26
Department of Geography, University of Nevada Reno Douglas P. Boyle Nevada State Climate Office Douglas P. Boyle [email protected] Department of Geography University of Nevada, Reno
| Date post: | 17-Jul-2015 |
| Category: |
Science |
| Upload: | driscience |
| View: | 50 times |
| Download: | 8 times |
Department of Geography, University of Nevada Reno Douglas P. Boyle
Nevada State Climate Office
Douglas P. Boyle
[email protected] of Geography University of Nevada, Reno
Department of Geography, University of Nevada Reno Douglas P. Boyle
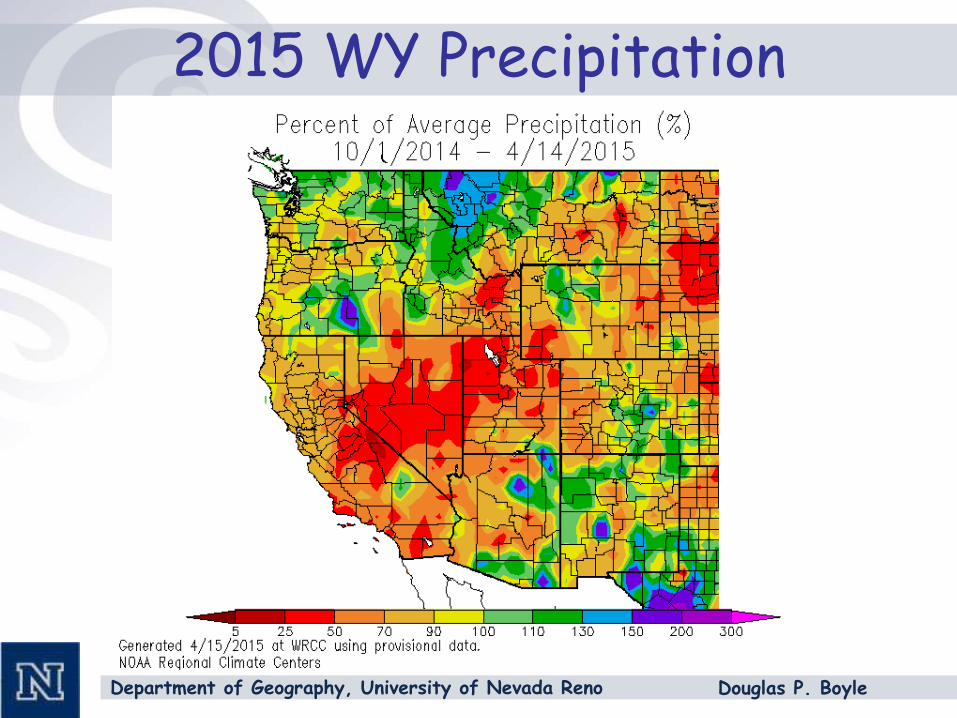
2015 WY Precipitation
Department of Geography, University of Nevada Reno Douglas P. Boyle
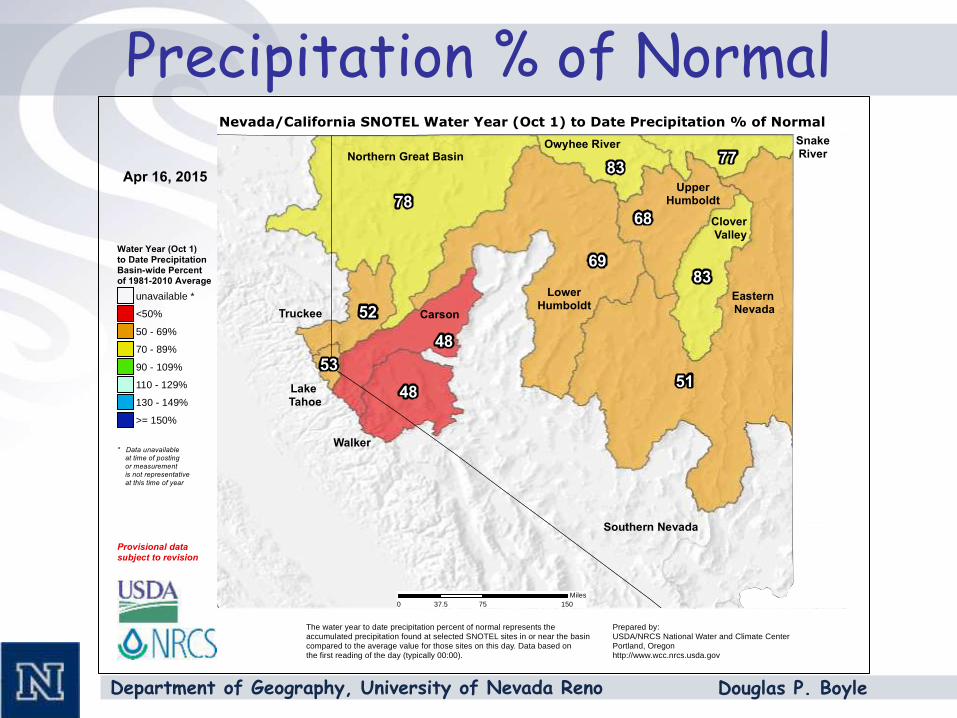
Precipitation % of Normal
Eastern Nevada
Northern Great Basin
Lower Humboldt
Southern Nevada
Walker
Carson
Owyhee River SnakeRiver
Clover Valley
Upper Humboldt
Truckee
Lake Tahoe
51
78
69
68
83
48
48
83
52
77
53
Water Year (Oct 1)to Date PrecipitationBasin-wide Percent of 1981-2010 Average
unavailable *
<50%
50 - 69%
70 - 89%
90 - 109%
110 - 129%
130 - 149%
>= 150%
Prepared by:USDA/NRCS National Water and Climate Center Portland, Oregonhttp://www.wcc.nrcs.usda.gov
Provisional data subject to revision
Nevada/California SNOTEL Water Year (Oct 1) to Date Precipitation % of Normal
0 75 15037.5
Miles
* Data unavailable at time of posting
or measurement is not representative
at this time of year
The water year to date precipitation percent of normal represents the accumulated precipitation found at selected SNOTEL sites in or near the basin compared to the average value for those sites on this day. Data based on the first reading of the day (typically 00:00).
Apr 16, 2015
Department of Geography, University of Nevada Reno Douglas P. Boyle
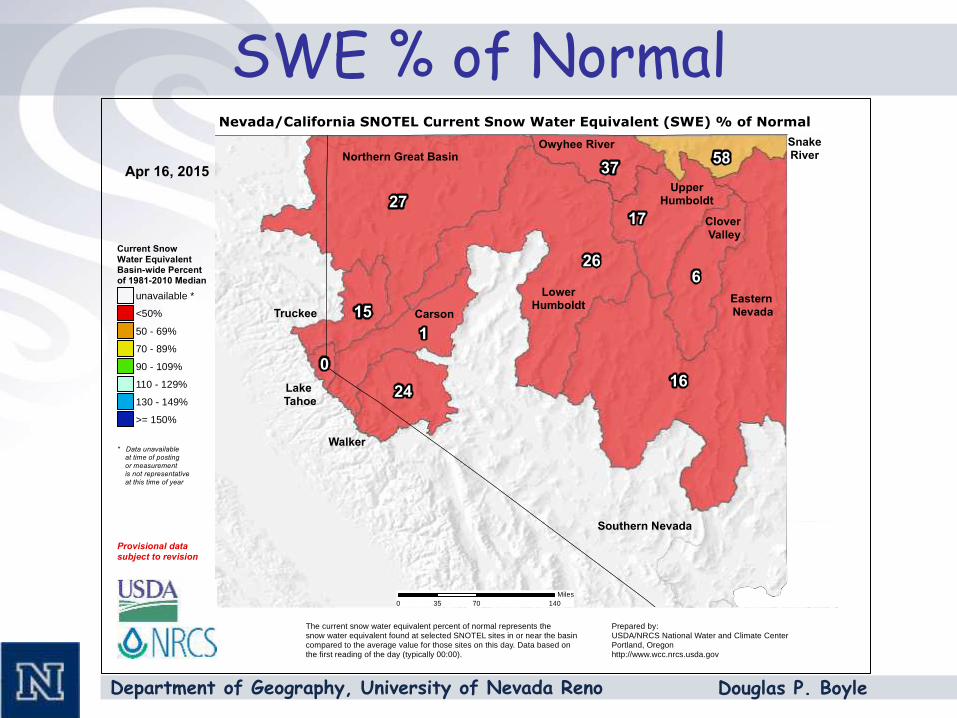
SWE % of Normal
Eastern Nevada
Northern Great Basin
Lower Humboldt
Southern Nevada
Walker
Carson
Owyhee River SnakeRiver
Clover Valley
Upper Humboldt
Truckee
Lake Tahoe
16
27
266
1
17
24
37
15
58
0
Current Snow Water EquivalentBasin-wide Percent of 1981-2010 Median
unavailable *
<50%
50 - 69%
70 - 89%
90 - 109%
110 - 129%
130 - 149%
>= 150%
Prepared by:USDA/NRCS National Water and Climate Center Portland, Oregonhttp://www.wcc.nrcs.usda.gov
Provisional data subject to revision
Nevada/California SNOTEL Current Snow Water Equivalent (SWE) % of Normal
0 70 14035
Miles
* Data unavailable at time of posting
or measurement is not representative
at this time of year
The current snow water equivalent percent of normal represents the snow water equivalent found at selected SNOTEL sites in or near the basin compared to the average value for those sites on this day. Data based on the first reading of the day (typically 00:00).
Apr 16, 2015
Department of Geography, University of Nevada Reno Douglas P. Boyle
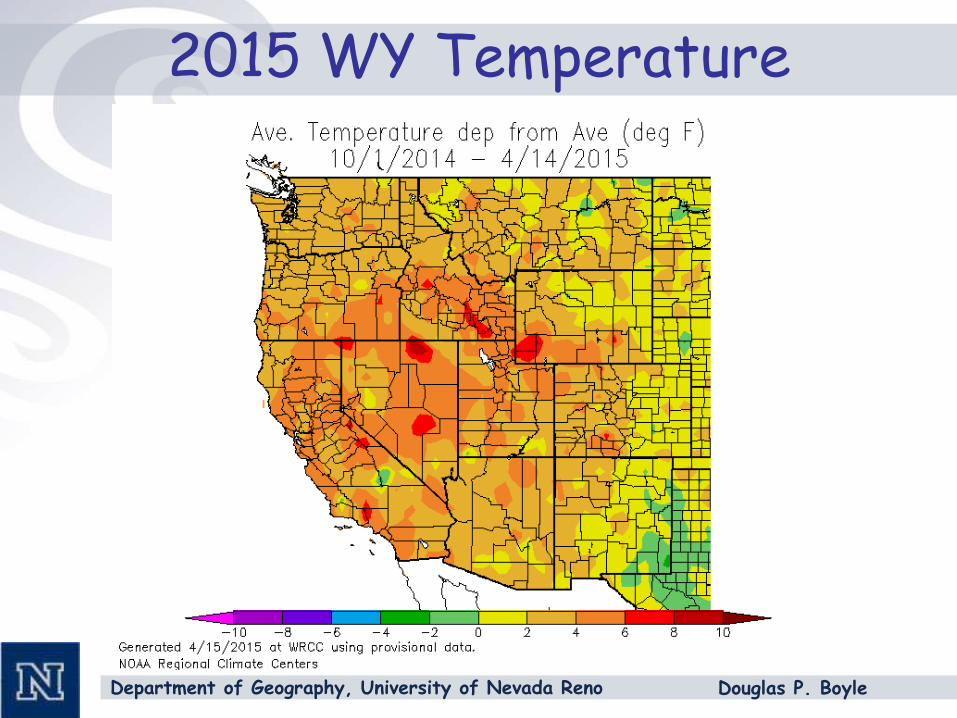
2015 WY Temperature
Department of Geography, University of Nevada Reno Douglas P. Boyle
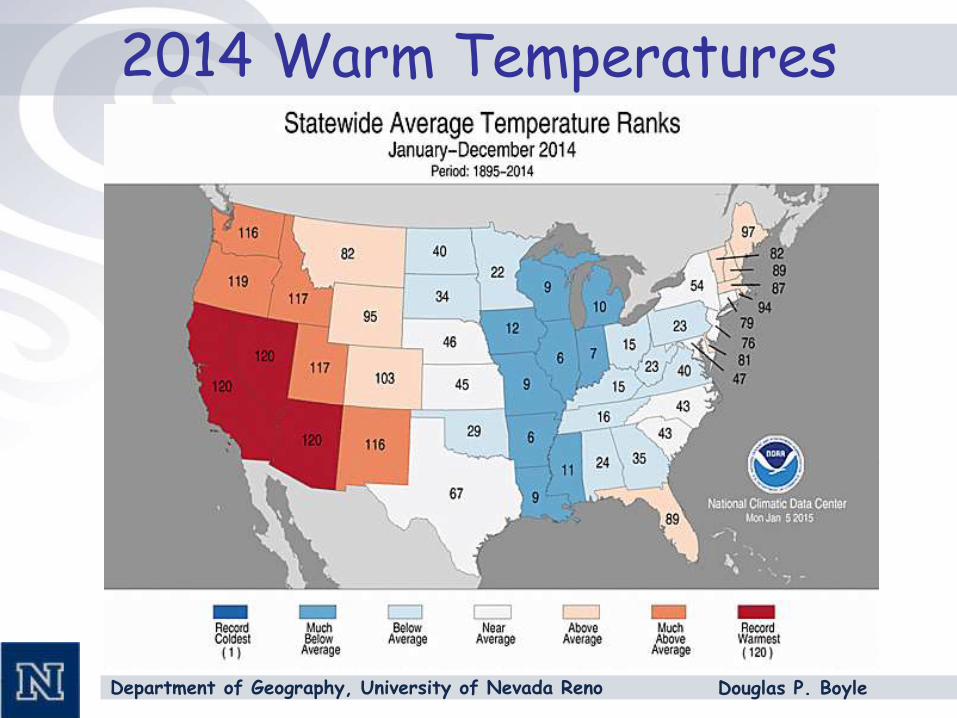
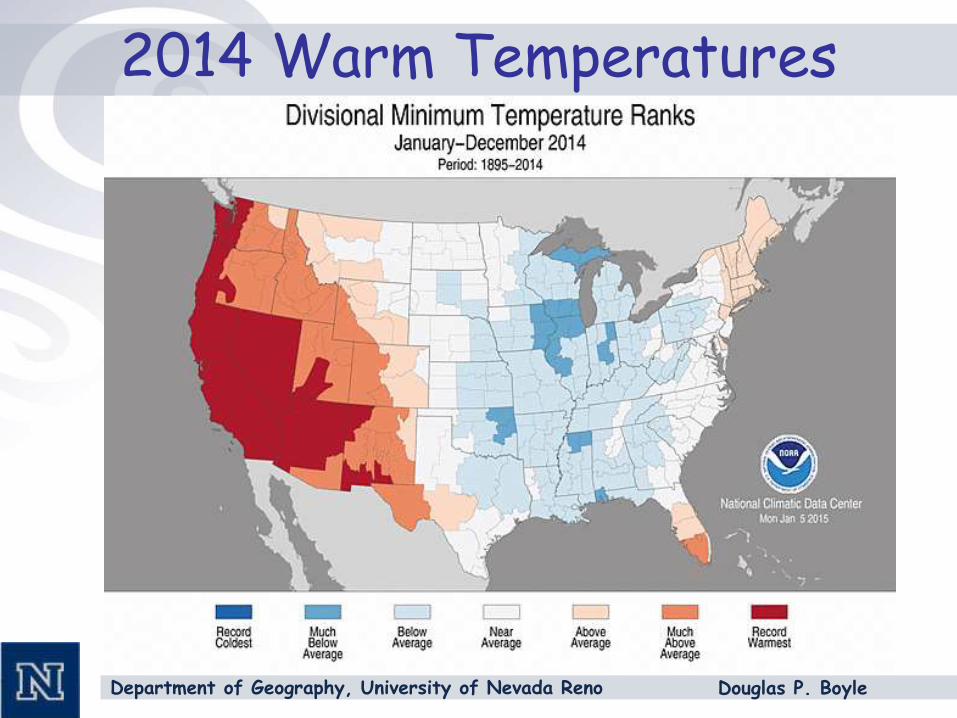
2014 Warm Temperatures
Department of Geography, University of Nevada Reno Douglas P. Boyle
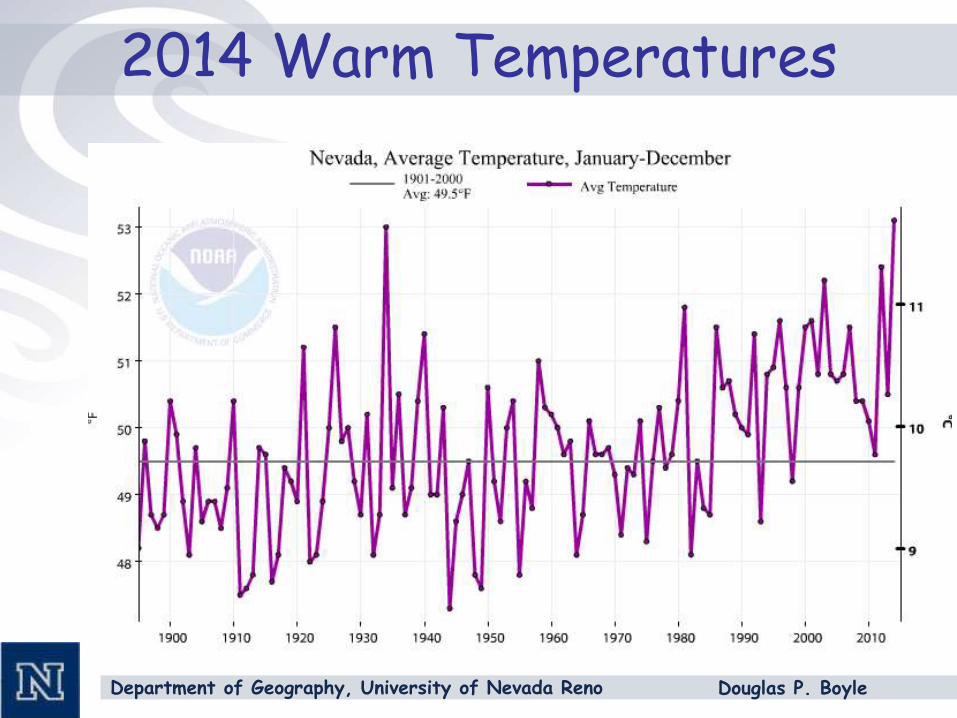
2014 Warm Temperatures
Department of Geography, University of Nevada Reno Douglas P. Boyle
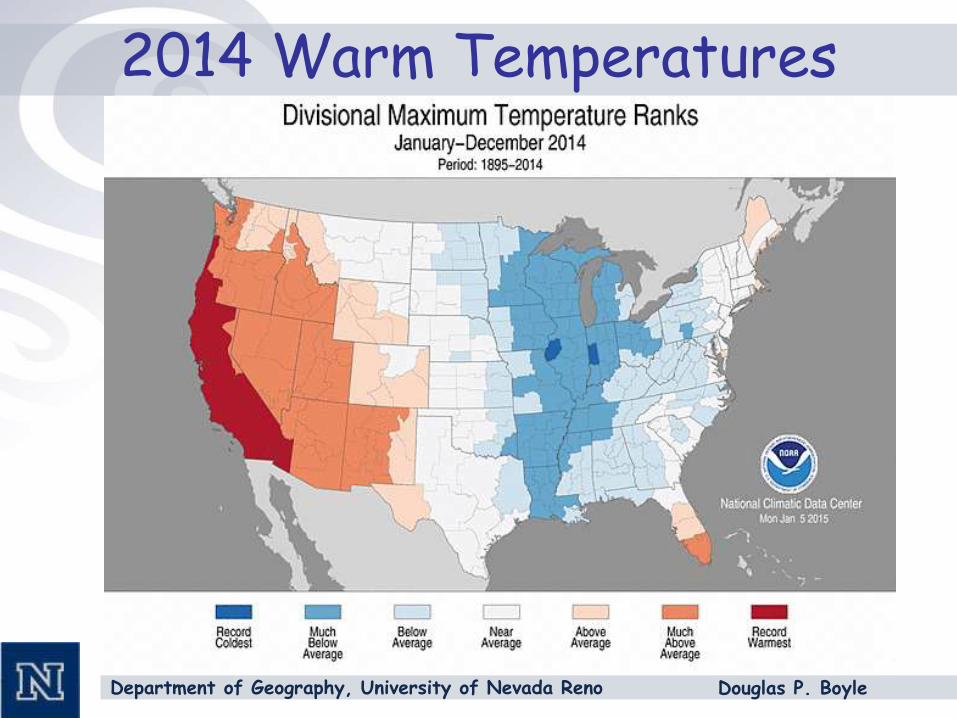
2014 Warm Temperatures
Department of Geography, University of Nevada Reno Douglas P. Boyle
2014 Warm Temperatures
Department of Geography, University of Nevada Reno Douglas P. Boyle
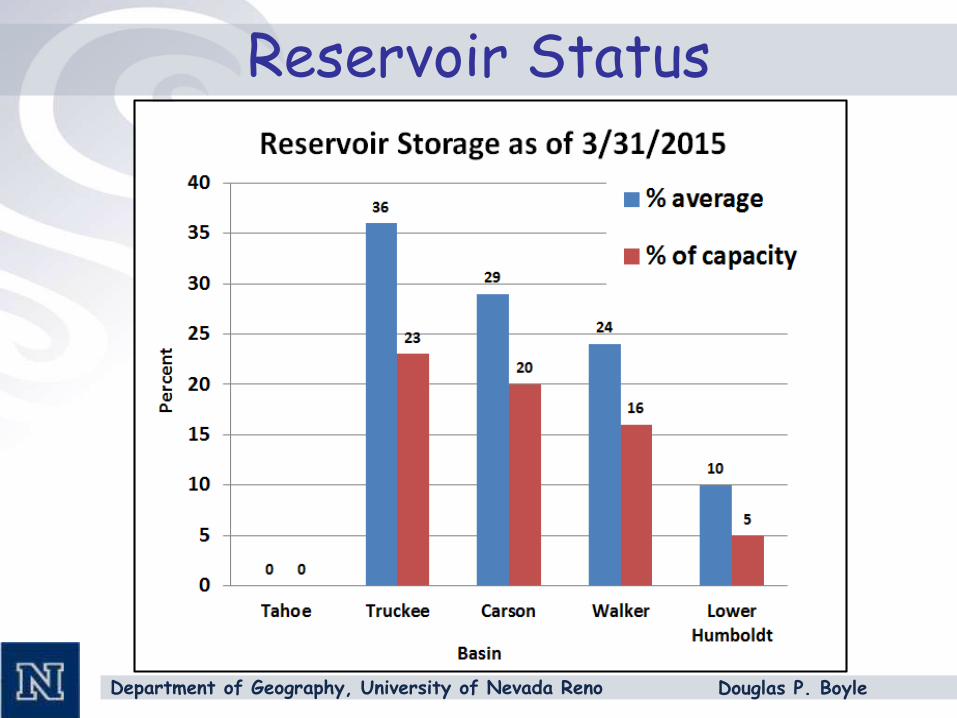
Reservoir Status
Department of Geography, University of Nevada Reno Douglas P. Boyle
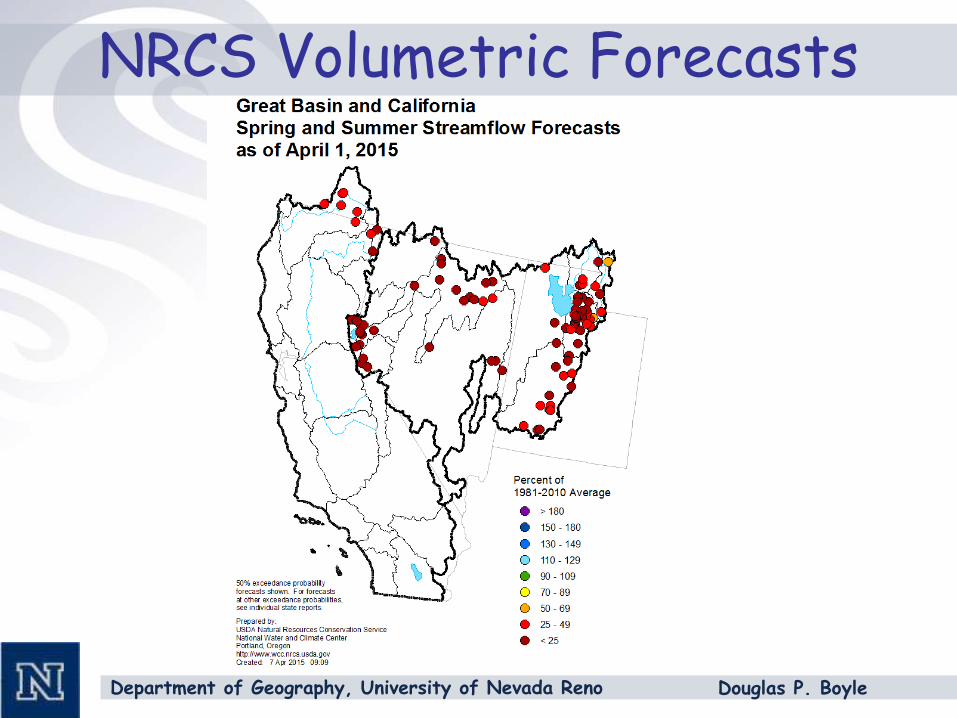
NRCS Volumetric Forecasts
Department of Geography, University of Nevada Reno Douglas P. Boyle
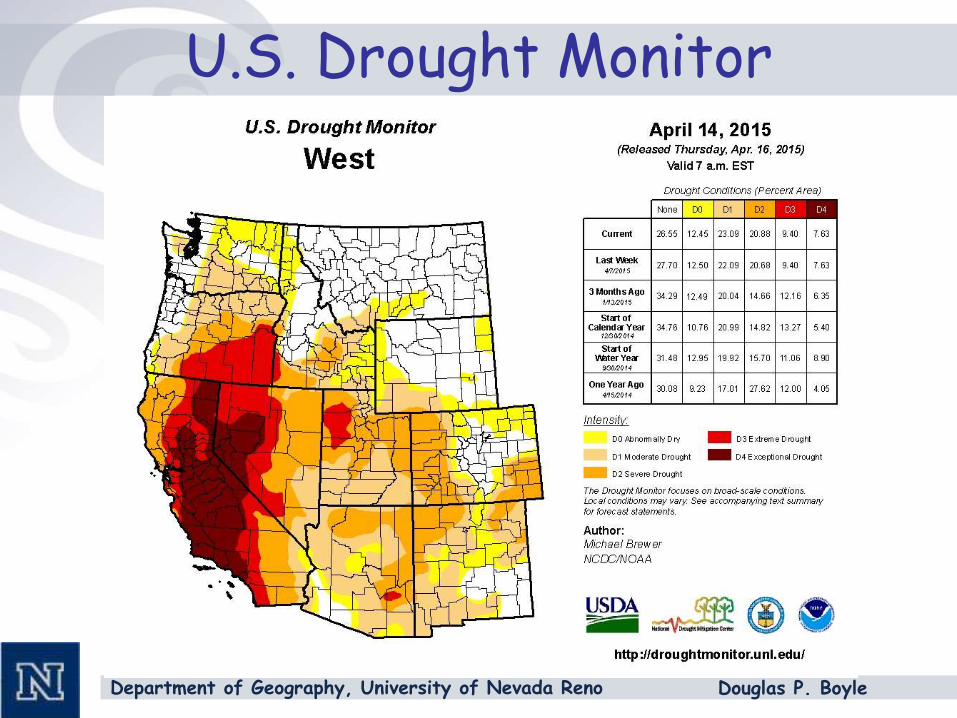
U.S. Drought Monitor
Department of Geography, University of Nevada Reno Douglas P. Boyle
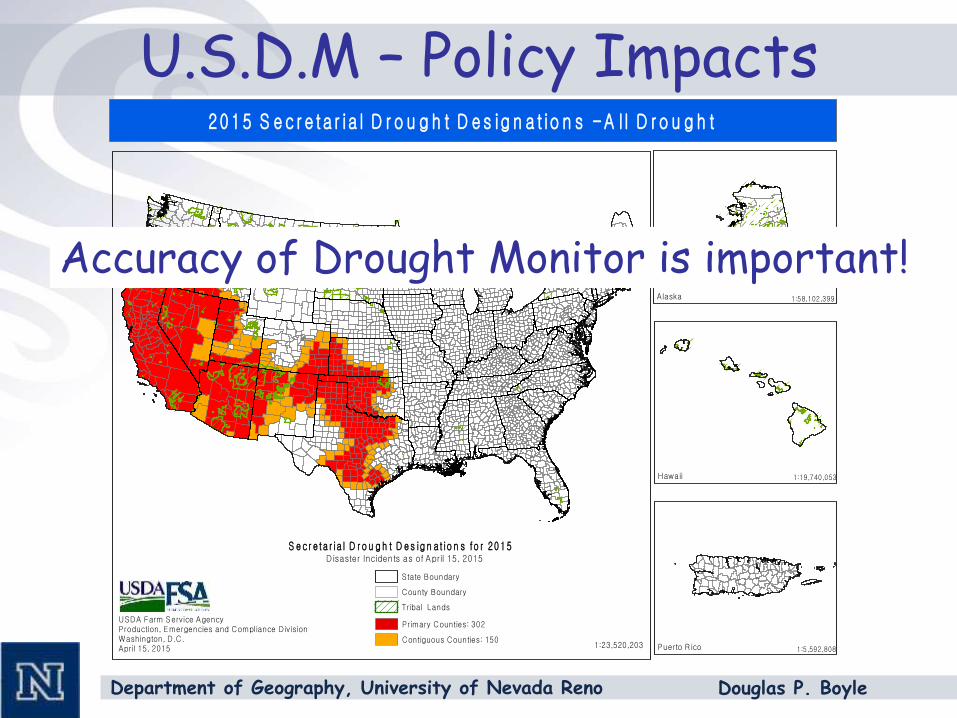
U.S.D.M – Policy Impacts20 1 5 S e c r e ta r i a l D r o u g h t D e s ig n a t io n s - A l l D r o u g h t
Alaska 1:58,102,399
Hawaii 1:19,740,053
S e c r e ta r ia l D r o u g h t D e s ig n a t io n s fo r 20 1 5 Disaster Incidents as of April 15, 2015
State Boundary
County Boundary
Tribal Lands
USDA Farm Service Agency Primary Counties: 302
Production, Emergencies and Compliance Division Washington, D.C. Contiguous Counties: 150
1:23,520,203 Puerto R ico 1:5,592,808 April 15, 2015
Accuracy of Drought Monitor is important!
Department of Geography, University of Nevada Reno Douglas P. Boyle
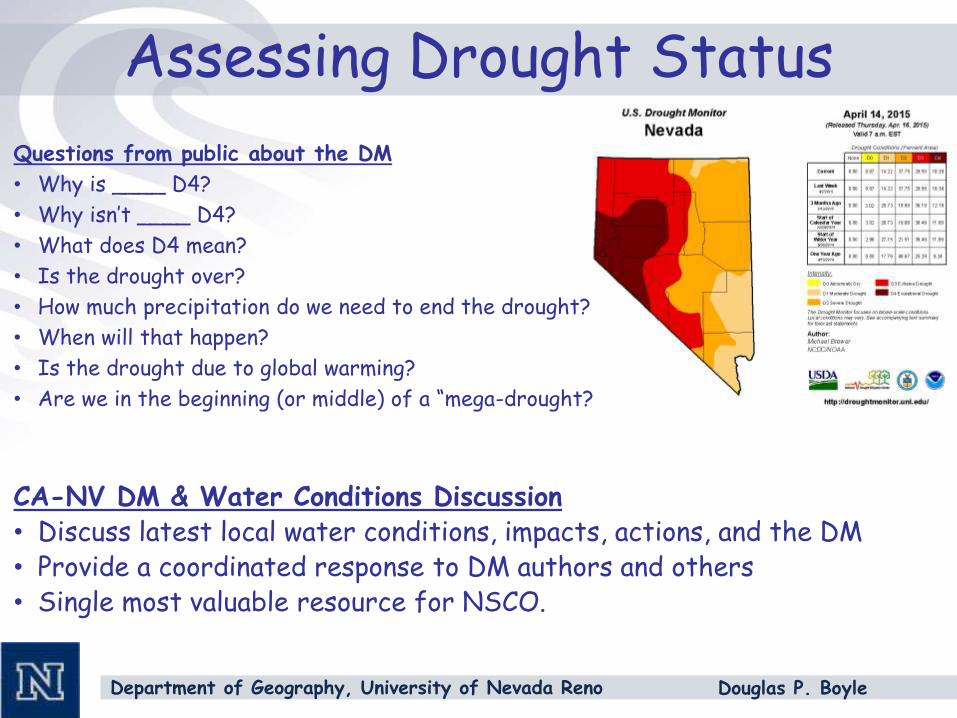
Assessing Drought Status
Questions from public about the DM
• Why is ____ D4?
• Why isn’t ____ D4?
• What does D4 mean?
• Is the drought over?
• How much precipitation do we need to end the drought?
• When will that happen?
• Is the drought due to global warming?
• Are we in the beginning (or middle) of a “mega-drought?
CA-NV DM & Water Conditions Discussion• Discuss latest local water conditions, impacts, actions, and the DM• Provide a coordinated response to DM authors and others• Single most valuable resource for NSCO.
Department of Geography, University of Nevada Reno Douglas P. Boyle
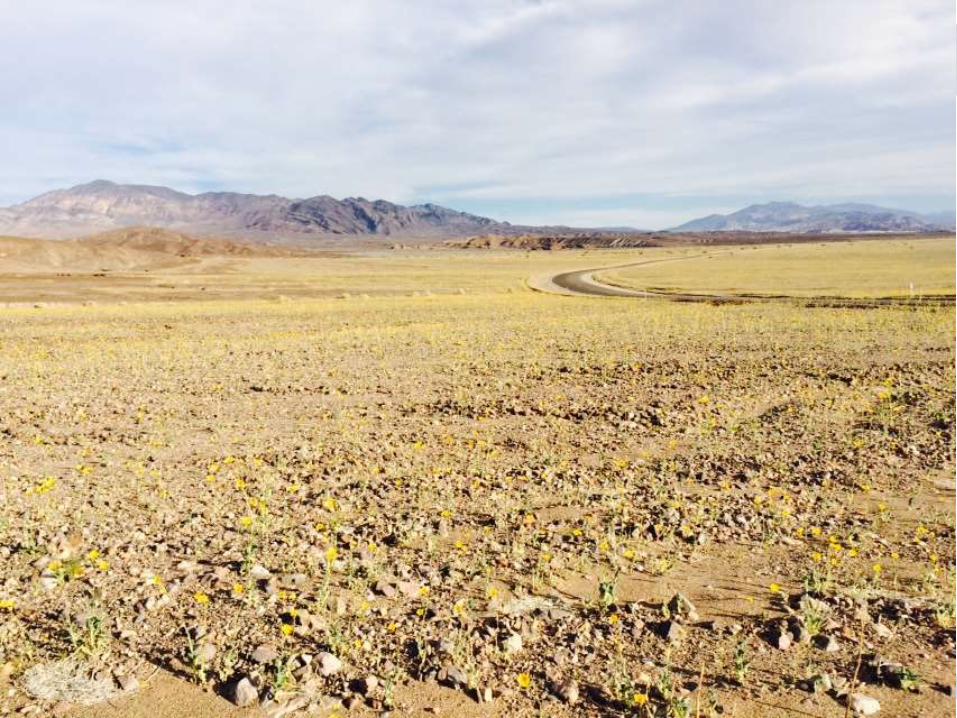
Death Valley
Department of Geography, University of Nevada Reno Douglas P. Boyle
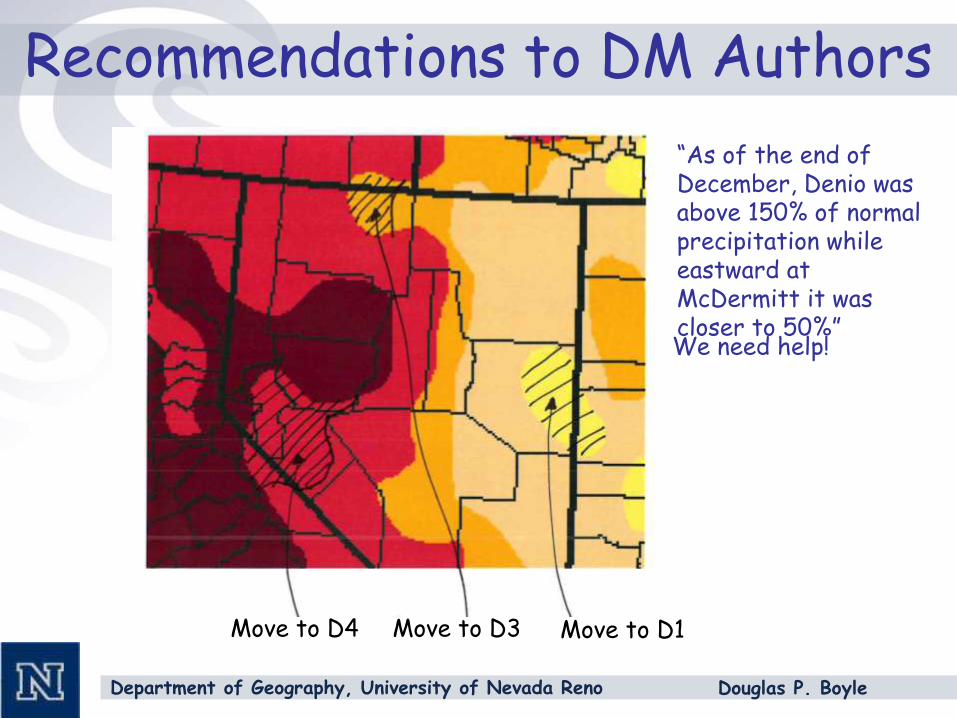
Recommendations to DM Authors
Move to D4 Move to D3 Move to D1
“As of the end of December, Denio was above 150% of normal precipitation while eastward at McDermitt it was closer to 50%”We need help!
Department of Geography, University of Nevada Reno Douglas P. Boyle
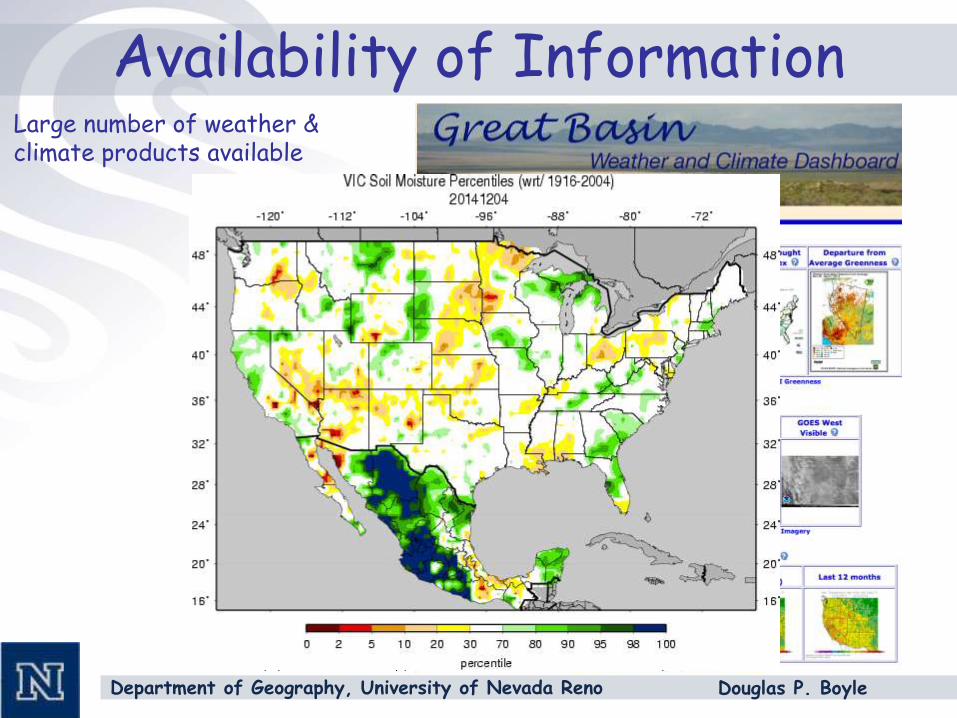
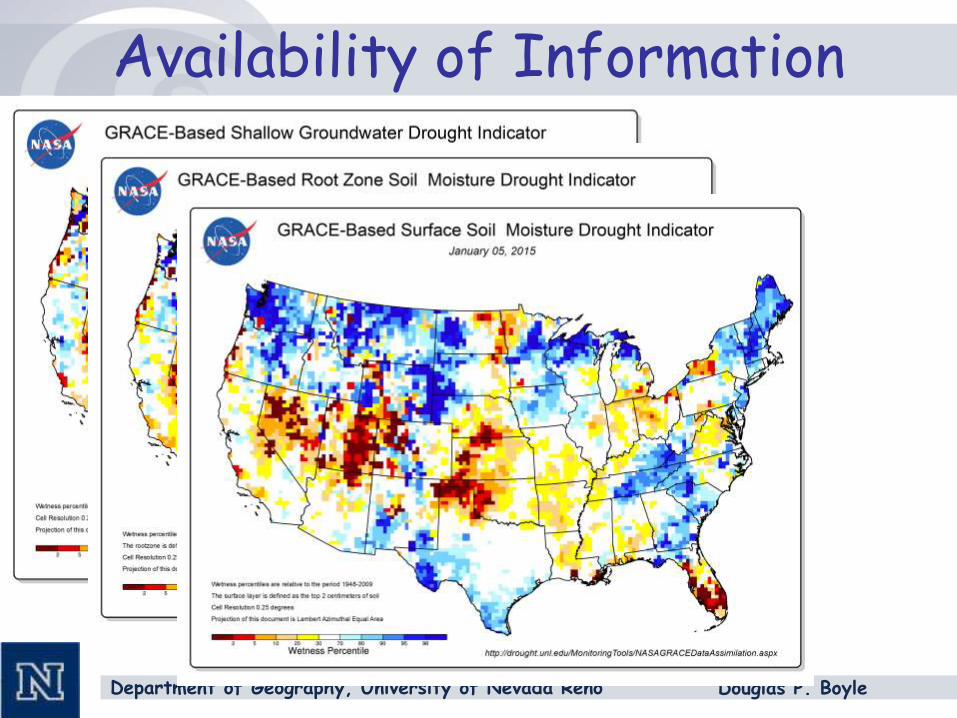
Availability of InformationLarge number of weather & climate products available
Department of Geography, University of Nevada Reno Douglas P. Boyle
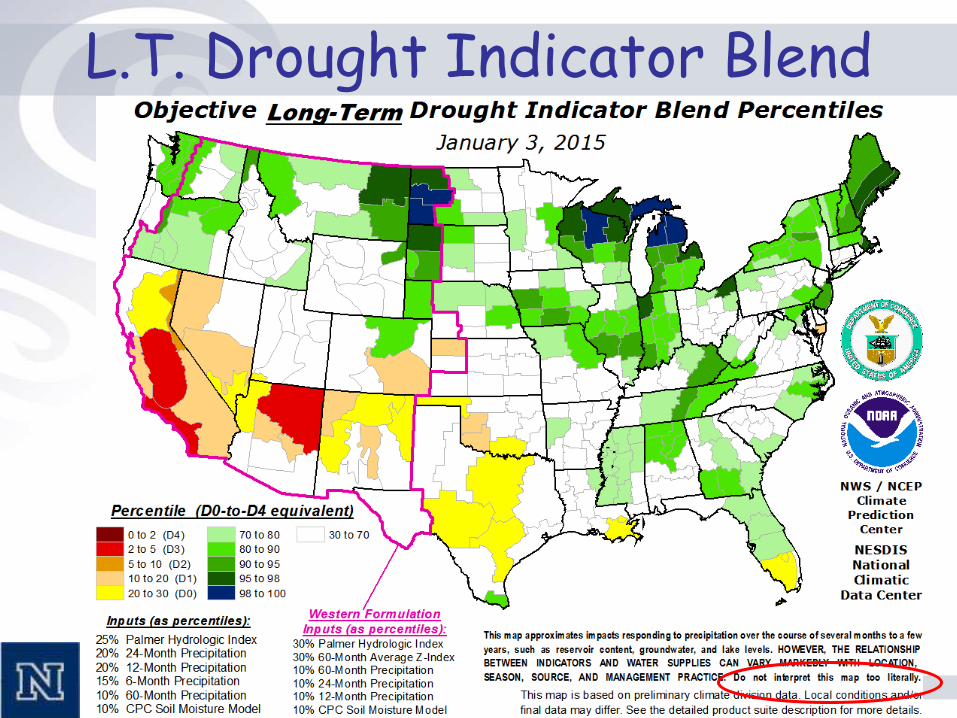
L.T. Drought Indicator Blend
Department of Geography, University of Nevada Reno Douglas P. Boyle
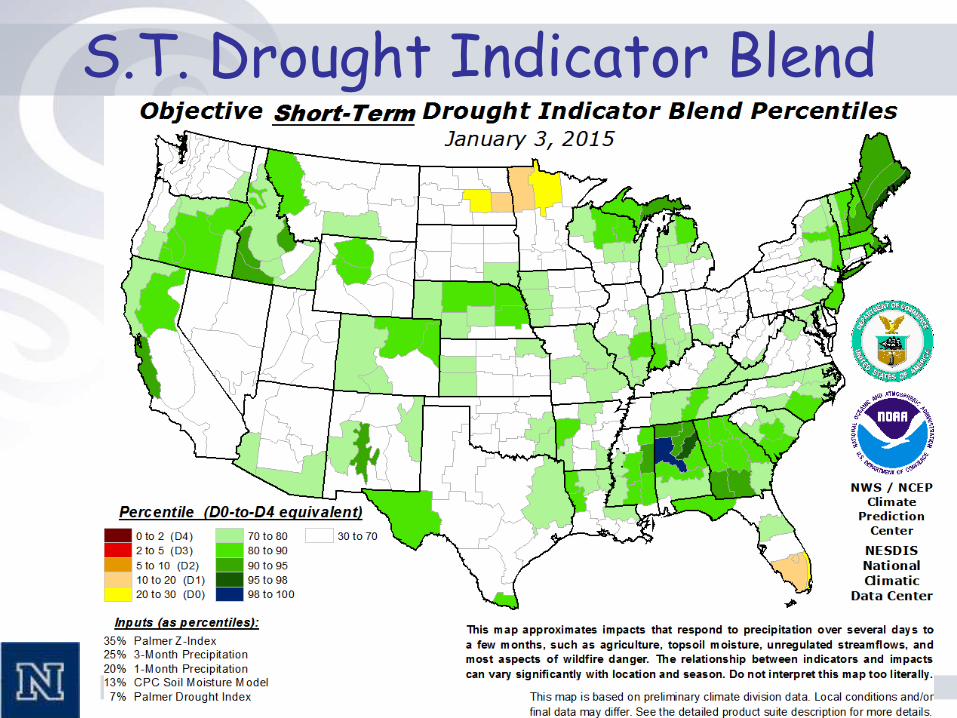
S.T. Drought Indicator Blend
Department of Geography, University of Nevada Reno Douglas P. Boyle
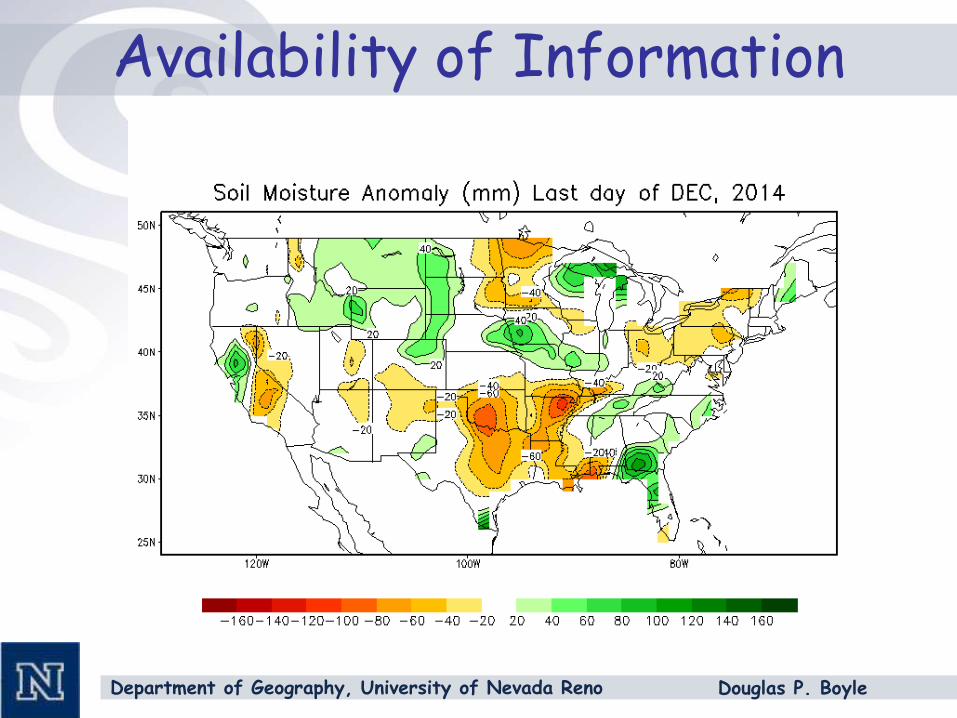
Availability of Information
Department of Geography, University of Nevada Reno Douglas P. Boyle
Availability of Information
Department of Geography, University of Nevada Reno Douglas P. Boyle
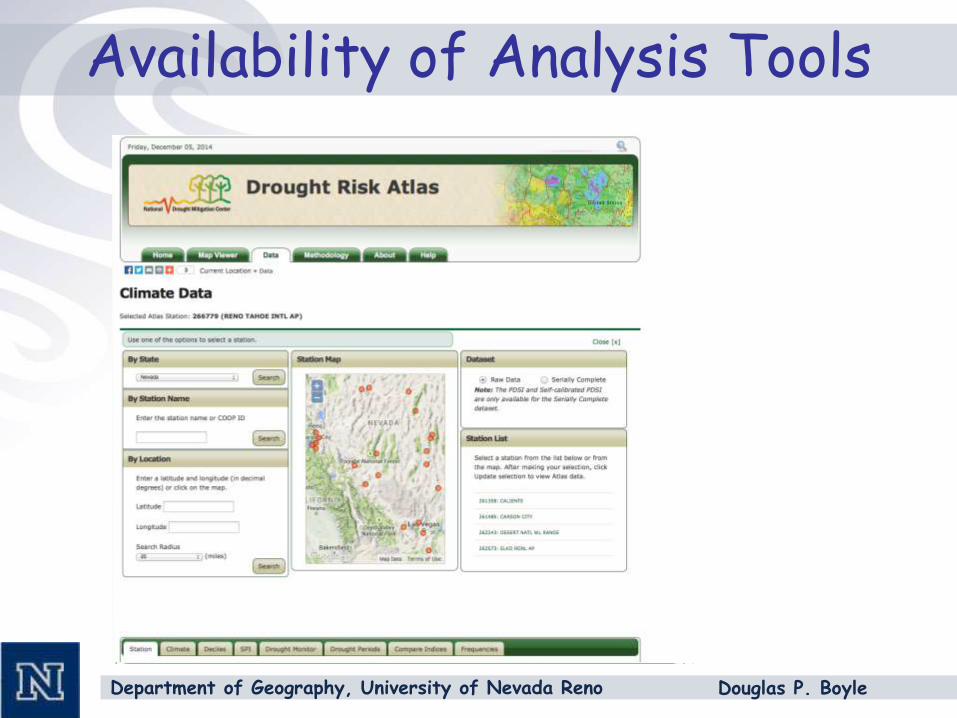
Availability of Analysis Tools
Department of Geography, University of Nevada Reno Douglas P. Boyle
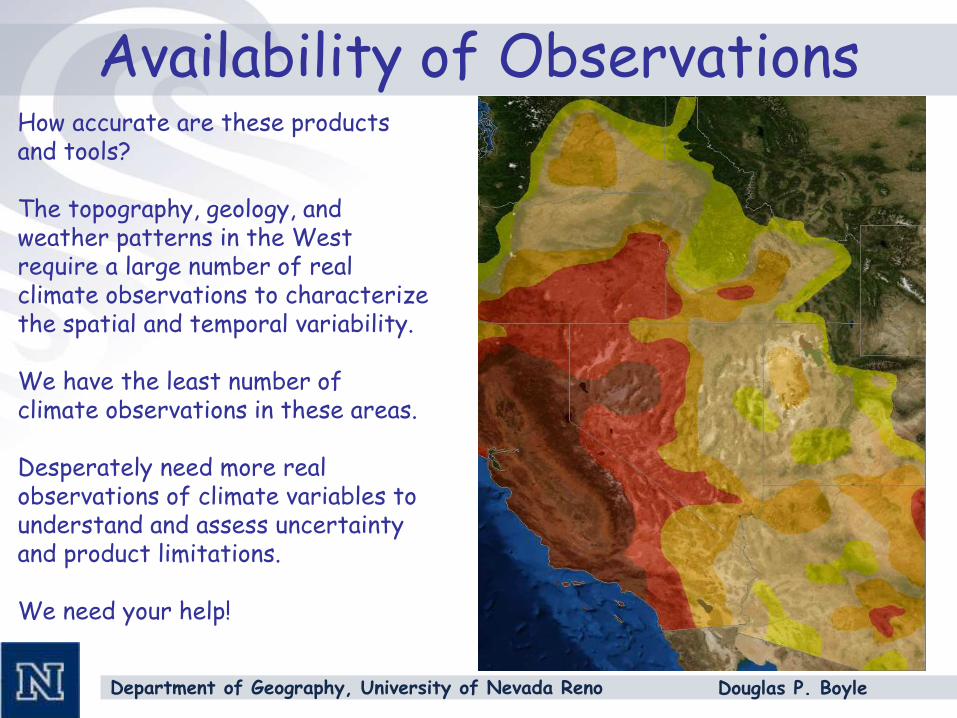
Availability of ObservationsHow accurate are these products and tools?
The topography, geology, and weather patterns in the West require a large number of real climate observations to characterize the spatial and temporal variability.
We have the least number of climate observations in these areas.
Desperately need more real observations of climate variables to understand and assess uncertainty and product limitations.
We need your help!
Department of Geography, University of Nevada Reno Douglas P. Boyle
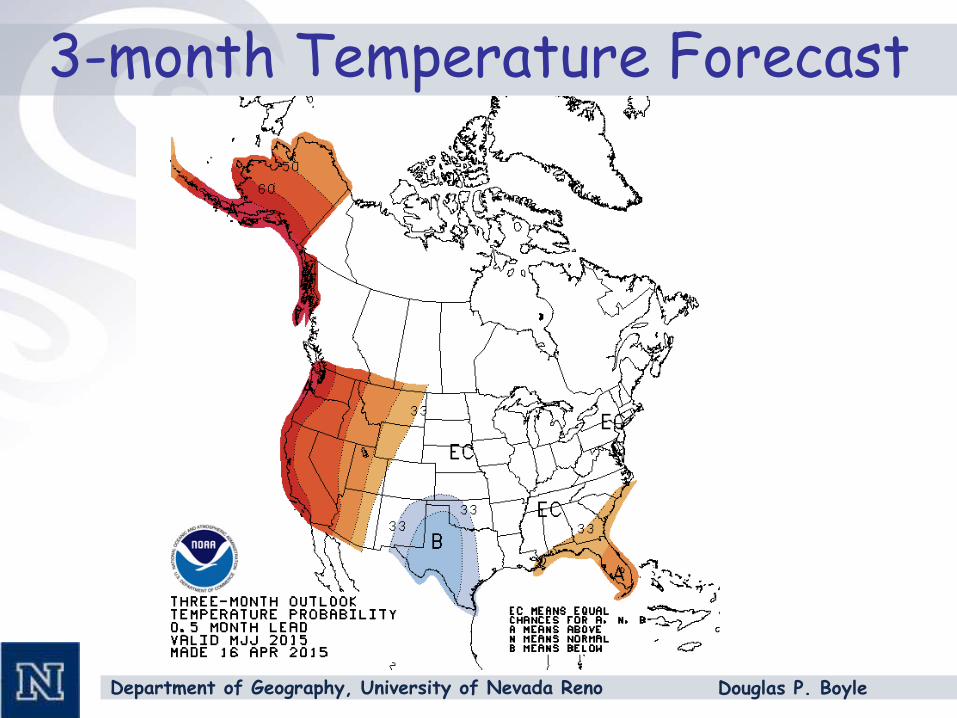
3-month Temperature Forecast
Department of Geography, University of Nevada Reno Douglas P. Boyle
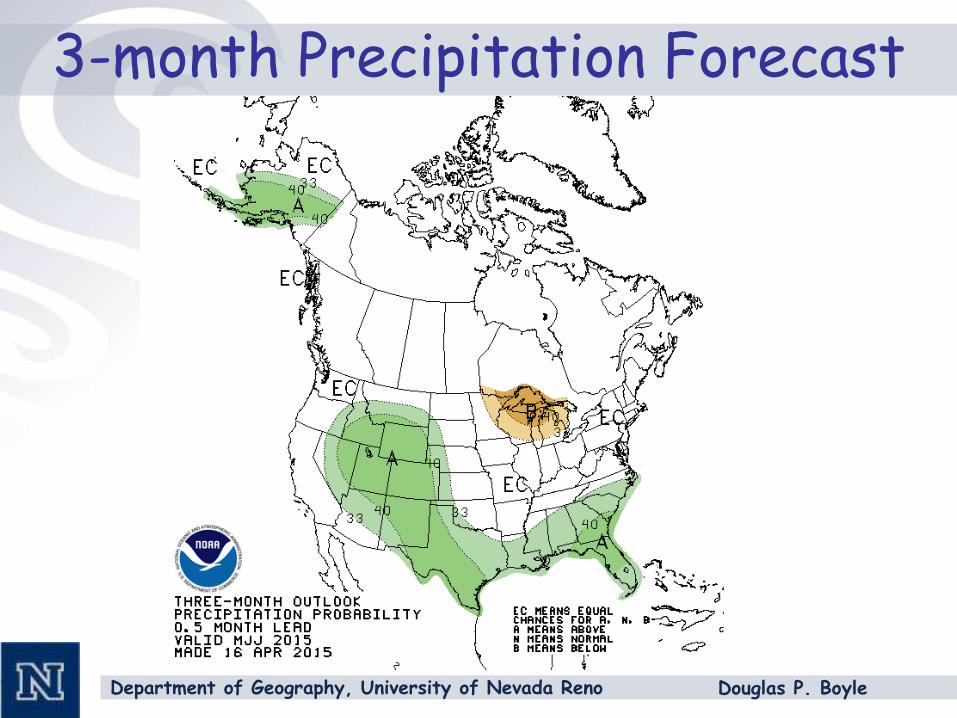
3-month Precipitation Forecast
Department of Geography, University of Nevada Reno Douglas P. Boyle
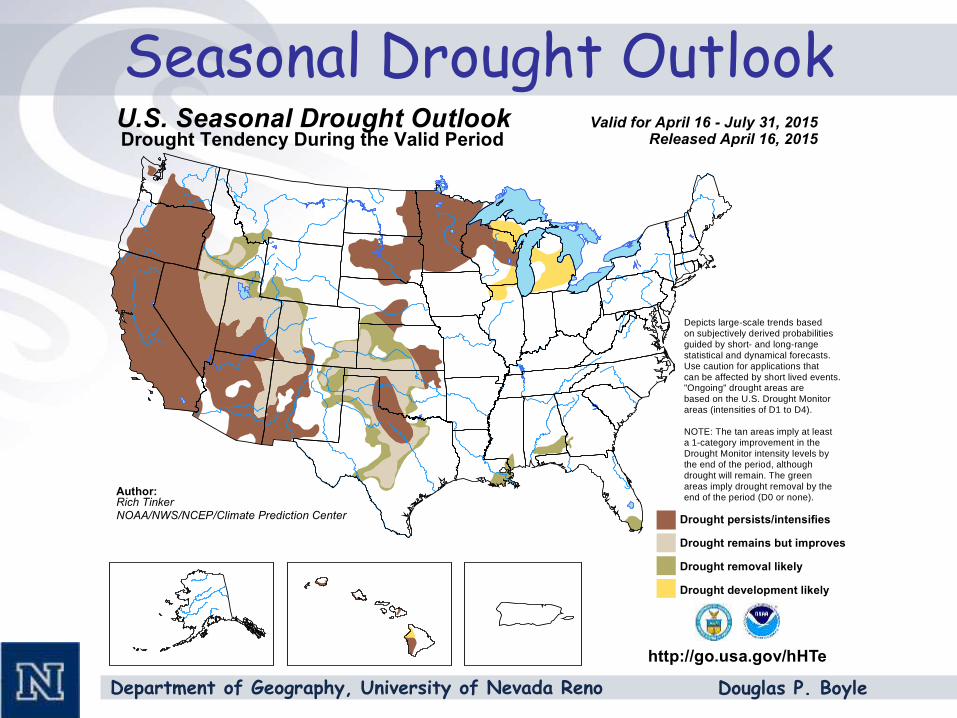
Seasonal Drought Outlook
http://go.usa.gov/hHTe
U.S. Seasonal Drought Outlook
Author: Rich TinkerNOAA/NWS/NCEP/Climate Prediction Center
Drought Tendency During the Valid PeriodValid for April 16 - July 31, 2015
Released April 16, 2015
Depicts large-scale trends basedon subjectively derived probabilities
guided by short- and long-range
statistical and dynamical forecasts. Use caution for applications that
can be affected by short lived events."Ongoing" drought areas are
based on the U.S. Drought Monitorareas (intensities of D1 to D4).
NOTE: The tan areas imply at leasta 1-category improvement in the
Drought Monitor intensity levels by the end of the period, although
drought will remain. The green
areas imply drought removal by the end of the period (D0 or none).
Drought persists/intensifies
Drought remains but improves
Drought removal likely
Drought development likely


