107
1 New Analytical Methods For Silicone Elastomers Used in Drug Delivery Systems Anders Karlsson Department of Polymer Technology Royal Institute of Technology Stockholm 2003

1
New Analytical MethodsFor Silicone Elastomers
Used in Drug Delivery Systems
Anders Karlsson
Department of Polymer TechnologyRoyal Institute of Technology
Stockholm 2003

2
ABSTRACT
The modern pharmaceutical industry requires high quality performance anddocumentation in all the manufacturing steps to meet continually increasingeconomic and regulatory demands. This includes the need for new advancedanalytical methods to ensure high consistency of the incoming raw materials,and of the intermediate and final products.
This thesis describes the development of new analytical methods or therefinement of established methods for silicone elastomers with a focus on highselectivity, accuracy and precision. Spectroscopy (NMR, IR MS),chromatography (GC, LC) and thermoanalytical techniques (TGA, DSC,DMTA) have been used to analyse the consistency of the silicone materialcomposition. These methods have also been used to improve the productionprocesses for a controlled drug release product and to ensure that the regulatorydemands of the final product are met.
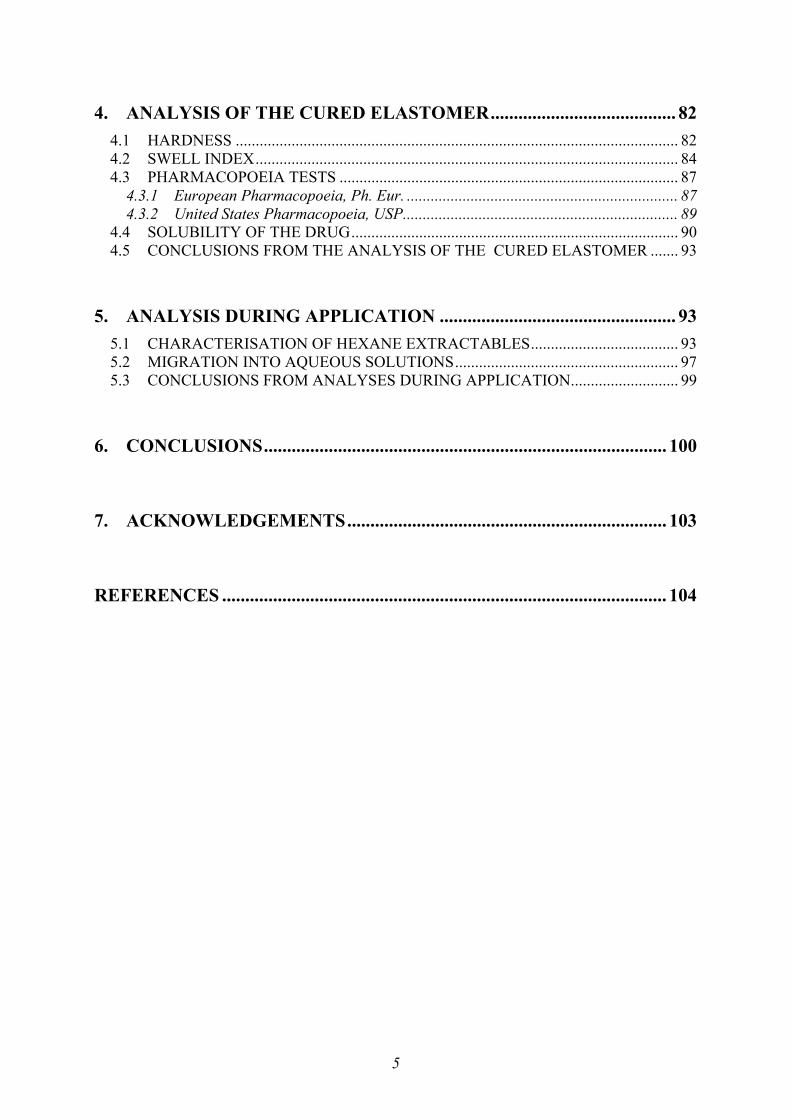
The dimethyl silicone elastomer used was cured by a hydrosilylation mechanismwhere vinyl and hydride siloxane groups add and form an ethylene crosslinkingbond. This reaction is catalysed by platinum in the presence of an inhibitor toprevent the material from curing at room temperature.
The low amounts of vinyl and hydride groups were quantified by a new NMRmethod. As a complement, a large number of samples were analysed withrespect of their hydride content with a rapid IR method.
The low molecular weight inhibitor was determined with a new headspace GCmethod. We also found that the inhibitor content was of great importance in themanufacture of the controlled drug delivery device. If the inhibitor content wastoo low, the pre-curing made the material practically impossible to handle.
After curing, we found residues of hydride groups in the elastomer that had anegative impact on the product properties. Using NMR and IR for hydridequantification, we developed a controlled procedure by storing the material in aroom at constant temperature and humidity in order to decompose these hydridegroups.
Several other methods which were developed are also described in this thesis.The methods are essential both during the development phase and in the qualitycontrol phase in the manufacture of a silicone elastomer drug delivery device.

3
LIST OF PAPERS
This thesis is a summary of the following publications and several hithertounpublished studies:
I. ˝Controlled Destruction of Residual Crosslinker in a Silicone Elastomerfor Drug Delivery˝ Karlsson, A.; Singh, S. K.; Albertsson, A.-C.J. Appl. Polym. Sci. 2002, 84, 2254-2264
II. ˝New Selective Method for Quantification of Organosilanol Groups inSilicone Pre-elastomers˝ Karlsson, A.; Albertsson, A.-C.Biomacromolecules 2002, 3, 850-856
III. ˝A New method for the Determination of a Hydrosilanization InhibitorApplied to Measurements during Curing of a Silicone Elastomer˝Karlsson, A.; Albertsson, A.-C. J. Appl. Polym. Sci. 2001, 79, 2349-2353
IV. ˝Thermal and Mechanical Characterization of Cellulose Acetate PhthalateFilms for Pharmaceutical Tablet Coating: Effect of Humidity DuringMeasurements˝Karlsson, A.; Singh. S. K. Drug Dev. Ind. Pharm. 1998, 24, 827-834
V. ˝Characterization of Cellulose Acetate Phthalate (CAP)˝Roxin, P.; Karlsson, A.; Singh, S. K.Drug Dev. Ind. Pharm 1998, 24, 1025-1041

4
TABLE OF CONTENTS
TABLE OF CONTENTS.................................................................................... 1
1. INTRODUCTION ........................................................................................ 61.1 SILICONE APPLICATIONS IN DRUG DELIVERY SYSTEMS ............................ 61.2 DESCRIPTION OF THE SILICONE MATERIAL..................................................... 71.3 ANALYTICAL METHODS ...................................................................................... 101.4 PURPOSE OF THIS WORK...................................................................................... 11
2. ANALYSIS OF THE PRE-ELASTOMERS BEFORE CURING......... 122.1 SILICONE VINYL AND SILICONE HYDRIDE CONTENT ................................. 12
2.1.1 Measurements of silicone vinyl and hydride groups using proton NMR ............. 132.1.2 Measurements of silicone vinyl and silicone hydride groups using
infrared spectroscopy (IR) ................................................................................... 182.1.3 Vinyl content measured by gas chromatography ................................................. 22
2.2 INHIBITOR CONTENT DETERMINED WITH HEADSPACEGAS CHROMATOGRAPHY [PAPER III].................................................................. 28
2.3 SILICA FILLER CONTENT DETERMINED WITH TGA...................................... 332.4 ORGANOSILANOL CONTENT DETERMINED WITH HPLC [PAPER II]............ 382.6 CATALYST CONTENT DETERMINED WITH ICP-AES ..................................... 502.7 CONCLUSIONS FROM ANALYSES OF THE PRE-ELASTOMERS
BEFORE CURING..................................................................................................... 51
3. ANALYSIS DURING CURING ............................................................... 533.1 TECHNIQUES TO MONITOR THE CURING REACTION ................................... 553.2 PRE-CURING............................................................................................................. 58
3.2.1 Size exclusion chromatography, SEC................................................................... 603.2.2 Differential scanning calorimetry (DSC)............................................................. 613.2.3 Dynamic mechanical thermal analysis (DMTA).................................................. 653.2.4 Head space gas chromatography (HS-GC) ......................................................... 673.2.5 Conclusions from the analyses during curing; pre-curing .................................. 68
3.3 POST-CURING [PAPER I] .......................................................................................... 683.3.1 Analyses of residual MHS by NMR and IR .......................................................... 703.3.2 Controlled elimination of MHS............................................................................ 753.3.3 Factors affecting the mechanical properties........................................................ 763.3.4 Post-curing by thermal treatment ........................................................................ 793.3.5 Conclusions from analyses during curing; post-curing....................................... 81
5
4. ANALYSIS OF THE CURED ELASTOMER........................................ 824.1 HARDNESS ............................................................................................................... 824.2 SWELL INDEX.......................................................................................................... 844.3 PHARMACOPOEIA TESTS ..................................................................................... 87
4.3.1 European Pharmacopoeia, Ph. Eur. .................................................................... 874.3.2 United States Pharmacopoeia, USP..................................................................... 89
4.4 SOLUBILITY OF THE DRUG.................................................................................. 904.5 CONCLUSIONS FROM THE ANALYSIS OF THE CURED ELASTOMER ....... 93
5. ANALYSIS DURING APPLICATION ................................................... 935.1 CHARACTERISATION OF HEXANE EXTRACTABLES..................................... 935.2 MIGRATION INTO AQUEOUS SOLUTIONS........................................................ 975.3 CONCLUSIONS FROM ANALYSES DURING APPLICATION........................... 99
6. CONCLUSIONS....................................................................................... 100
7. ACKNOWLEDGEMENTS..................................................................... 103
REFERENCES ................................................................................................ 104

6
1. INTRODUCTION
1.1 SILICONE APPLICATIONS IN DRUGDELIVERY SYSTEMS
Silicones are frequently used in medical applications. For more than 50 years,they have been used to treat glass surfaces to reduce the surface energy (Ref. 1),as e.g. a lubricant to reduce friction between a rubber plunger and a glasssyringe or to reduce pain when an injection needle penetrates the skin. Othermedical applications for silicones are flexible tubings for catheters,antiflatulents, body prostheses, intra-ocular and contact lenses and for controlleddrug release.
Since the early 1970’s, silicone elastomers have been used as drug deliverysystems for female sex hormones (Ref. 2). At that time, WHO initiated thedevelopment of a contraceptive intra-vaginal silicone ring (IVR) (Refs. 3-4)(Fig. 1). This type of device gives a constant drug release over a long period.However, during the initial period of a few days, the drug release rate is muchhigher due to the washing out of the dissolved drug from the outer sheathmaterial. The NuvaRing® is another example of an IVR. It is made from a coreof ethylene vinylacetate copolymer containing etonorgestrel andethynylestradiol with a silicone membrane controlling the drug release (Ref. 5).
Figure 1 Drawing of a hormone-releasing intra-vaginal ring with a corecontaining the dispersed hormone. The right-hand figure shows across-section of the ring
Today, there are several other devices available for contraception (Ref. 6).Norplant® is an example of an implantable rod containing levonorgestrel. Sixrods are injected under the skin and they act for 5 years before they are removedby surgery (Ref. 7). Levonova® (Fig. 2) is an example of an intra-uterine device

7
(IUD). A silicone elastomer covers the stem of the T-shaped polyethylenedevice and contains the levonorgestrel hormone (Ref. 8).
Figure 2 Drawing of the Levonova® IUD, which gives a controlled release oflevonorgestrel dispersed in Silastic® silicone elastomer (black part)
Another example of medical application for the IVR is the Estring®. It is a lowdose releasing hormone IVR made of a silicone elastomer with a construction asin figure 1. It has been developed for the local treatment of symptoms associatedwith urogenital ageing. This product constantly releases 8 µg of 17β-estradiolper 24 hours over three months (Ref. 9).
A major advantage of all these types of controlled delivery device for hormonetherapy compared to orally taken tablets is that the effects on first passmetabolism are overcome, i.e. the side effect of high serum concentrations of thehormone is much reduced. Another effect is that they are very convenient to useand they have a long period of action before they have to be changed (Ref. 10)
1.2 DESCRIPTION OF THE SILICONE MATERIAL
The silicone material used in this thesis belongs to the Silastic® family ofelastomers, manufactured by Dow Corning, USA. It is a medical gradeelastomer and is used in many medical applications, e.g. Levonova®, Norplant®
and Estring®. The particular grade used here is called Silastic® Q7-4735. It is arather soft elastomer with a Durometer hardness of 35 Shore A. The pre-elastomer, a gel-like material, is composed of two parts, Part A and Part B. Bothparts contain a base material, equal in both parts. The difference between thetwo parts is that Part A contains the catalyst and Part B contains the crosslinkerand an inhibitor. Equal proportions of the two parts are mixed in a two-roll millinto a homogeneous blend and the product is then formed into the desired shape.

8
The formed material is then placed in a mould and heated to 100-150 °C. Duringthis heating, the crosslinking reaction occurs and the elastomer is formed.
The base material is composed of roughly 70% of two high molecular masspolydimethylsiloxane gums. Both polymers have terminal dimethylvinyl groupsand one of them also contains methylvinylsiloxane groups randomly distributedalong the polymer chain (Fig. 3). On average, approximately one in every 500repeating units contains a vinyl group.
SiCH3
CH3
CH OH2C Si O Si O Si
CH3
CH3 CH3
HC
CH CH2
CH3
CH3
CH2n m
SiCH3
CH3
CH OH2C Si O SiCH3
CH3
CH CH2
CH3
CH3
n
Figure 3 Structures of the two high molecular mass polydimethylsiloxanescontaining vinyl groups
The base also contains approximately 20% of the reinforcing fumed silicaparticles (SiO2) and the rest of the base consists of two rather small hydroxyl-terminated polydimethylsiloxane oils (Fig. 4). Their purpose is to deactivate thesilanol groups on the fumed silica surface during the mixing step in the basemanufacture. This deactivation step is essential. If it is not properly done, it willhave a negative influence on both the rheological behaviour of the uncuredmaterial and the drug delivery characteristics of the hormones.
SiCH3
CH3
HO O Si O Si O Si
CH3
CH3 CH3
HC
OH
CH3
CH3
CH2n m
SiCH3
CH3
HO O Si O SiCH3
CH3
OH
CH3
CH3
n
Figure 4 Structures of the two organosilanols present in the base material

9
When the components in the base material have been thoroughly mixed, thematerial is divided into two equal parts. The platinum catalyst, which isdissolved in a vinyl-containing silicone oil, is added to Part A, and the siliconhydride crosslinker (Fig. 5) and the inhibitor, 1-ethynylcyclohexanol (Fig 6) aremixed with Part B. The crosslinker is a low molecular mass trimethylsiloxane-terminated copolymer which consists of methylhydrogensiloxane anddimethylsiloxane groups. These two parts are delivered by Dow Corning asSilastic® Q7-4735.
SiCH3
CH3
H3C O Si O Si O Si
CH3
CH3 CH3
H
CH3
CH3
CH3
n m
Figure 5 Structure of the silicon hydride crosslinker
C
OH
CH
Figure 6 Structure of the inhibitor, 1-ethynylcyclohexanol
The drug manufacturer takes parts A and B, and mixes them in a two-roll mill.The material is then formed into the desired shape, normally by extrusion atroom temperature and put into a mould. During this period, the inhibitorprevents the material from curing. When the material in the moulds is heated,the curing proceeds (Fig. 7). In the curing reaction, all the vinyl groups reactwith the low molecular mass crosslinker, as the crosslinker is present in excess.The curing reaction demands the presence of a small amount of platinumcatalyst. The amount of platinum in this material was found to be about 20 ppm.

10
+ H2C CH SiSi H Pt CH2 SiCH2Si
Figure 7 The hydrosilylation reaction where silicon hydrides and siliconevinyls add and form an ethylene bond in the presence of a platinumcatalyst
After curing, the remaining silicon hydride groups are slowly hydrolysed in thepresence of water into rather inactive silanol groups. In addition, the hardness ofthe elastomer also increases after curing. These reactions are summarised in aterm called “post-curing”.
1.3 ANALYTICAL METHODS
Different analytical methods have been developed to quantify different groups inthe pre-elastomer.
o The amounts of vinyl groups in the pre-elastomers are proportional to thecrosslinking density of the elastomer and have been measured by NMR andgas chromatography.
o The crosslinker with the active hydride group add to the vinyl groups. It ispresent in excess in order to ensure a rapid and complete curing. Thecrosslinker content has been measured with both NMR and infraredspectroscopy (IR).
o The silica filler content was determined by thermogravimetric analysis. Theremaining hydroxyl-terminated silicones used in the deactivating of the silicasurface were assessed by a liquid chromatography method after derivatisationof the silanols.
o The inhibitor was quantified by headspace gas chromatography (HS-GC).o The amount of platinum in the catalyst was assessed by atomic emission
spectroscopy.
The pre-curing of the mixed material was studied by several techniques.
o The heat evolved in the curing reaction was studied by differential scanningcalorimetry (DSC)
o The change in elastic modulus was measured by dynamic mechanical thermalanalysis (DMTA).
o Size exclusion chromatography (SEC) was used to study the increase inmolecular mass.
o The HS-GC technique was used to monitor changes in inhibitor content.

11
The effects of humidity, atmosphere and temperature on post-curing werestudied.
o Residues of hydride crosslinker were measured by both NMR and IR.o Durometer hardness and DMTA were used to study the mechanical changes.
The final elastomer was then analysed to qualify the material for its applicationas an intra-vaginal drug delivery device.
o The material was qualified to meet the requirements in both the EuropeanPharmacopoeia and the US Pharmacopoeia.
o Hardness was used as an identity test to differentiate the elastomer from othersimilar Silastic® materials.
o Swelling in toluene was used to measure the relative degree of crosslinking. o The non-bonded materials in the elastomer, the extractables, were quantified
by extraction followed by weighing. The extractables were identified byNMR, IR, UV spectroscopic techniques, and by mass spectrometry. Furtheridentification of the extract was achieved with GC and SEC.
1.4 PURPOSE OF THIS WORK
The modern pharmaceutical industry requires high quality performance anddocumentation in all the manufacturing steps to met continually increasingeconomic and regulatory demands. This includes the need for new advancedanalytical methods to ensure high consistency of the incoming raw materials,and of the intermediate and final products.
The purpose of this work has been to develop analytical methods for siliconeelastomers with a focus on high selectivity, accuracy and precision. Theseanalytical methods were then used to improve the manufacture of Estring,which led to a more reproducible manufacturing process, a higher productionyield and thereby reduced costs. It was important that the methods should beable to determine small batch variations in composition of the pre-elastomer andthey should also be applicable to the silicone material during the different phasesin the manufacturing chain from the incoming pre-elastomer, over the blendingand curing and to the final elastomer.

12
2. ANALYSIS OF THE PRE-ELASTOMERSBEFORE CURING
2.1 SILICONE VINYL AND SILICONE HYDRIDE CONTENT
The reason for quantifying the vinyl and hydridesiloxane groups is that they arethe two structures in the pre-elastomer that form the ethylene crosslinking bond.The vinyl groups are distributed along the siloxane chains and they are alsofound as terminal groups. Both types of vinyl groups are found in the highmolecular mass polymers. The hydride crosslinker has a rather low molecularmass and is present in excess relative to the vinyl groups. The vinyl groups willtherefore be fully converted to ethylene groups, assuming that each vinyl groupleads to an addition to a hydride group. The degree of excess of the hydridegroup will have an influence on the crosslinking density. Too little or too muchcrosslinker will reduce the crosslinking density (Ref. 11). In addition, too muchcrosslinker may lead to post-curing problems with unreacted hydrides.
Due to the small amount of vinyl groups in the pre-elastomers, around 0.2molar-% in both Part A and Part B, only a few methods are applicable for thistype of quantification with acceptable accuracy and precision. Proton NMR isone of the few spectroscopic techniques that can be used. Another possibletechnique is gas chromatography, after alkaline or acidic degradation of thepolymers. For materials with a higher vinyl content, e.g. in reference standards,it is possible to perform the quantification by other techniques such as titration(Refs. 12-13) and infrared spectroscopy (IR). Raman spectroscopy is consideredto be unsuitable for the characterisation of silicone elastomers due to the verypoor quality of the spectral information (Ref. 14).
The amount of hydride groups is about seven times greater than the amount ofvinyls. It is therefore easier to find methods to quantify the hydrides withsufficient accuracy and precision. Old chemical quantification methods arebased on oxidation followed by iodometric titration (Refs. 15-17) or alkalinereaction with water or an alcohol followed by measurements of the amount ofevolved hydrogen (Ref. 18). A sensitive method uses the reaction with acarbenium ion reagent, which gives an intensive chromophore, which can bemeasured in the visible region (Ref. 19). Modern methods are based on eitherNMR or IR spectroscopy (Ref. 20).

13
2.1.1 Measurements of silicone vinyl and hydride groups using
proton NMR
29Si NMR is frequently used for the characterisation of silicone compounds(Ref. 21) One of the advantages of 1H-NMR spectroscopy compared to 13C and29Si is that it is much more sensitive, due to the use of an NMR active isotope(1H – 99.9%, 13C – 1,1%, 29Si – 4,7%). Another important advantage of NMRcompared with other techniques is that, when the analysis is properly performed,there is a direct relationship between the integral of the signal peak and themolar amount of the nuclei, i.e. no calibration versus a reference substance isnecessary. Quantitative measurements using NMR on silicones have beensuccessfully used for several years (Refs. 22-25) But, no publications for thistype of material have been found.
The following 1H-NMR method was successfully developed and validated forthe quantification of both types of vinyl groups and the hydride group in the pre-elastomer (Ref. 26). Approximately 75 mg of the sample was dissolved in 0.7 mldeuterated chloroform (CDCl3) in a sealed vial overnight and analysed by one-dimensional 1H-NMR spectroscopy. The spectrometer was a Varian Unity 500MHz instrument. The experimental conditions were as follows: temperature30 °C, spectral width -1.0 to 10.0 ppm, resolution 0.3 Hz, and the pulse delaywas 17.5 s, i.e. five times the relaxation time.
The signals were assigned by comparison of the spectral data obtained for well-defined low molecular mass reference substances; dimethylvinyl-terminatedpolydimethylsiloxane (PS437), a methylhydrogen-dimethylsiloxane copolymer(PS123) and a dimethylsiloxane-vinylmethylsiloxane copolymer (PS422), all ofwhich were obtained from ABCR, Karlsruhe, Germany and manufactured byHűls America Inc, USA.
The NMR spectra of Part A and Part B are shown in figures 8 and 9. The hugemethylsiloxane peak is at approximately 0 ppm. The methylhydrogensiloxanegroup in the crosslinker in Part B (Fig. 9) shows a singlet at about 4.7 ppm andthe complex spectrum from the vinyl groups is at about 6 ppm. There is a broadpeak from water and organosilanol groups between 1 and 2 ppm and the peak atabout 7 ppm is from the solvent (chloroform).

14
Figure 8 500 MHz 1H-NMR spectrum of Silastic® Q7-4735 Part A in CDCl3
Figure 9 500 MHz 1H-NMR spectrum of Silastic® Q7-4735 Part B in CDCl3

15
Figure 10 shows an expansion of the proton NMR spectrum in the regionaround 6 ppm where the signals from vinyl protons occur.
Figure 10 500 MHz 1H-NMR spectrum of Silastic® Q7-4735 Part B inCDCL3, showing an expansion the spectrum of signals from thevinyl protons around 6 ppm
The method also included a system suitability test to ensure proper performanceof the instrument. The line width at half height for the CDCl3 signal, which wasset at 7.27 ppm, should be less that 2.0 Hz. In addition, the signal-to-noise ratiofor the signal at 6.1 ppm should be at least 4, where the noise was measuredbetween 6.4 and 6.9 ppm.

16
The proton signals were integrated over the ranges given in table 1.
Table 1 Integration range in the 1H-NMR spectrum for the differentsiloxane structures
Integrationrange(ppm)
Chemical group Structure
-0.7 to 0.8 dimethylsiloxane (DMS) Si
CH3
CH3
4.2 to 5.2 methylhydrogen groups(MHS)
Si
H
CH3
5.6 to 6.0 methylvinyl groups (MVS) Si
HC
CH3
CH2
6.0 to 6.2 dimethylvinyl groups (DMVS) Si
HC
CH3
CH3
CH2
A correction has to be made for the integrals of the MVS groups, as the DMVSgroups have 2/3 of the peaks in this region. The results for the different groupsare calculated as relative molar-%, i.e. the sum of DMS, MVS, DMVS and MHSis 100%. The silica filler and any proton NMR inactive group will not bemeasured. It is of course possible to further develop the method as a true assaymethod, which would involve a known amount of an internal standard.However, it was considered that this relative method was sufficient formonitoring the consistency of the different pre-elastomer batches
The method was validated for reproducibility using one of the pre-elastomerPart B batches containing both the crosslinker with the methylhydrogen group

17
and the polymer with the vinyl groups. Ten different sample preparations weremade and analysed during a period of two weeks (Tab. 2).
Table 2 Precision of the 1H NMR method for the quantificationof vinyl and hydride groups in the pre-elastomer.
Averagemolar-%
RSD%
MVS 0.15 3.7
DMVS 0.05 6.3
MHS 1.55 0.7
The accuracy of the method was also validated. The methylsiloxane protons arein a great excess relative to the groups that are to be quantified and this maycause deviations in accuracy. However, it was found that the instrument gave alinear response for DMS over the whole concentration range. In addition, theaccuracy of the NMR method was checked by comparing the results with IR.As the IR technique is quite insensitive to vinyl groups, a substance with ahigher amount of vinyl groups was used (Tab.3).
Table 3 Comparison between the 1H NMR method and IR for thequantification of vinyl and hydride groups.
NMR IR
Vinyl 1.65 1.56
MHS 1.52 1.31
There is a small deviation in results between NMR and IR. The reason for thisdeviation was not fully resolved, but one possible explanation is that the settingof the baseline in the IR method introduces a slight systematic error. Approximately ten batches, several samples taken from every batch, wereanalysed and the vinyl content results are shown in table 4.

18
Table 4 Vinyl content in ten batches of Silastic® Q7-4735 Part A and Part B.
Averagemolar-%
Std.dev.molar-%
RSD%
MVS Part A 0.149 0.010 6.9
MVS Part B 0.143 0.008 5.8
DMVS Part A 0.066 0.011 15.9
DMVS Part B 0.046 0.007 15.1
MHS Part A 1.52 0.12 7.8
There is a slightly higher terminal methylvinylsiloxane (DMVS) content in PartA than in Part B, approximately 0.02 molar-%. These vinyl groups originatefrom the platinum catalyst, which is dissolved in a vinyl-terminated silicone oil.The vinyl content seems to be quite consistent compared to the hydride content,considering the method variations.
2.1.2 Measurements of silicone vinyl and silicone hydride groups
using infrared spectroscopy (IR)
IR spectroscopy is often used as the primary technique for the identification ofunknown samples. However, the technique is also very suitable for quantitativeanalyses. The different measuring techniques commonly used for silicones aretransmission through a liquid cell for liquid silicones or solutions, or throughthin pieces of elastomers, or photoacoustic or reflection techniques (Refs. 27-35).
A simple procedure for obtaining an IR spectrum for this type of soft uncuredmaterial is a reflection technique, Attenuated Total Reflectance (ATR). A thinslice of the sample was cut to closely match the crystal area on the horizontalATR accessory, Spectra-Tech QC ATR with a 45° ZnSe crystal. The samplewas slightly pressed onto the crystal surface and the infrared spectrum wasrecorded on a Nicolet 60SXB FTIR instrument, 32 scans with a resolution of 8cm-1. The background spectrum of the clean crystal was subtracted from that ofthe sample spectrum. This method was selected for identification of the two pre-elastomers. Figures 11 and 12 show the two different spectra of Part A and PartB. The spectra are very similar, apart from the band at 2160 cm-1 for Part B

19
which comes from the hydride crosslinker. This absorption at 2160 cm-1
corresponds to a stretching vibration of the methylhydrogensiloxane group.
Figure 11 Reflection IR spectrum of Silastic® Q7-4735 Part A.
Figure 12 Reflection IR spectrum of Silastic® Q7-4735 Part B.

20
In order to quantify the methylhydrogensiloxane groups, the sample spectrumwas converted to absorbance and scaled between 0 and 0.1 absorbance units inthe range of 3300 and 1500 cm-1. The peak heights (H) were measured for thetwo peaks at 2160 cm-1, the methylhydrogensiloxane group, and at 1944 cm-1,the siloxane polymer backbone which was used as internal reference. Thebaselines were set as indicated in figure 13.
Figure 13 Expanded reflection IR spectrum of Silastic® Q7-4735 Part A,using absorbance scaling
The MHS content was calculated according to following equation:
Molar-% MHS =
×
1944
2160109.1HH + 005.0 [1]
where H is the height of the absorbing band
This equation was obtained by running FTIR spectra of different mixtures of thetwo silicone fluids PS123 and DC200. PS123 was obtained from ABCR,

21
Germany, and is a methylhydrogensiloxane dimethylsiloxane copolymer with29.8 molar-% MHS measured by proton NMR. DC200 is a dimethylsiloxanehomopolymer (PDMS) obtained from Dow Corning. The repeatability of themethod was estimated by making ten successive measurements on the samesample, which had a MHS content of 1.59 molar-%. The sample was removedfrom the crystal after each measurement. The standard deviation was 0.013molar-%, which is equivalent to a relative standard deviation (RSD) of 0.9%.
Several batches and several samples per batch were analysed for MHS contentusing the IR method. The average value for 30 batches was 1.30 mole-% with anRSD of 8%. The same variation was found with NMR. The MHS content overtime is shown in a trend plot in figure 14. The MHS content seems to be quiteconsistent considering the mean batch results. However, the variations withinthe batches indicate a shift to larger variations in the middle of the trend plot, atmeasurement numbers around 150. This increased variation was later found tobe related to a change in the pre-elastomer manufacture at Dow Corning. Theylater changed to a much more efficient process giving very consistent pre-elastomers.
0,8
1,0
1,2
1,4
1,6
1,8
0 50 100 150 200 250 300# measurement
Con
tent
of M
HS
(mol
e-%
)
Individual values Average value per batch
Figure 14 Trend plot over time for the MHS content in pre-elastomer Part Bmeasured by ATR infrared spectroscopy
The vinyl groups can also be measured by IR. The vinyl group cannot however,be determined at low levels as in the case of the Silastic® materials. In order to

22
illustrate the limit of what can be measured with IR, a vinyldimethyl-terminateddimethyl silicone oil was used (Dow Corning SFD 119, Batch No ET020681).This silicone oil has an average number molecular mass of approximately10 000, which corresponds to approximately 1.5% of the dimethylvinylsiloxanegroup. The IR spectrum shows a small absorption at about 3050 cm-1 for thisvinyl group (Fig. 15)
Figure 15 IR spectrum of the vinyldimethyl-terminated silicone oil SFD 119
The detection limit was estimated to be 0.1%, calculated as vinyldimethyl-siloxane.
2.1.3 Vinyl content measured by gas chromatography
The vinyl content can also be determined by gas chromatography (GC) afterdegradation into volatile compounds. Ethylene can be cleaved off from thevinyl-containing polymer by alkaline fusion and quantified by GC (Refs. 36-39).Acidic hydrolysis in excess of hexamethyldisiloxane gives dimethyl derivativesof the monomer units (Refs. 40-41). The method used here is based on alkaline

23
degradation in the presence of tetraethoxysilane. The main advantage comparedwith the acidic degradation is that the alkaline degradation is much faster. Likethe acidic method, this method can be used for the determination of bothvinylmethylsiloxane (VMS) and terminal vinyldimethylsiloxane groups(VDMS).
The principle of this method is that the sample is decomposed by breaking thesiloxane bonds (Si-O) in a hot alkaline solution using tetraethoxysilane as bothreagent and solvent. Ethoxy derivatives are then formed by neutralisation withcarbon dioxide, and the components are analysed by gas chromatography.Figure 16 shows the three components that can be formed from the vinyl-containing high molecular mass polymers in the pre-elastomer materials.
SiCH3
CH3
CH OH2C Si O Si O Si
CH3
CH3 CH3
HC
CH CH2
CH3
CH3
CH2n m
SiCH3
CH3
CH OH2C
O Si O
CH3
CH3
Si O
CH3
HC CH2
CH2CH2
CH2OCH2
CH2 CH3
H3C
H3C CH3
CH3
Figure 16 Products formed from alkaline degradation in tetraethoxysilane ofthe vinyl-containing polydimethylsiloxane in the pre-elastomers
Other siloxane groups present in the pre-elastomer material can also be analysedby this method. However, the terminal dimethylsilanol group cannot beanalysed, as this group transforms to dimethyldiethoxysilane, the samederivative as from the dimethylsiloxane group (Fig. 17).

24
O Si
CH3
CH3
OH O Si
CH3
CH3
OCH2 CH2 CH3H3C
Figure 17 Reaction product of the terminal dimethylhydroxylsiloxane group,the same product as is formed from dimethylsiloxane
The methylhydrogensiloxane (MHS) group generates the methyltriethoxysilanederivative (Fig. 18). This reaction product would also be found if themethylhydroxysiloxane were present. This group was never specificallyanalysed and, according to the manufacturer, it should not be present in the pre-elastomer.
O Si
H
CH3
O
O Si
O
CH3
OCH2 CH2 CH3H3C
CH2
CH3O Si
OH
CH3
O
Figure 18 Reaction product formed from methylhydrogensiloxane (MHS) andmethylhydroxysiloxane. The latter is probably present only in verylow amounts in the pre-elastomer
We used tetraethoxysilane with a purity of 98% from Fluka, potassiumhydroxide of analytical reagent grade from Prolabo or sodium ethylate, ≥ 95%from Fluka. n-octane was used as internal standard, 99% from Ventron, andvinylmethyldiethoxysilane (VMDES) from ABCR as external standard. Forneutralisation, we used gaseous carbon dioxide with a purity of more than 99.8%from Alfax.
The sample solution was prepared by weighing 10 mg of the sample into a 4 mlPierce Reacti-vial with a magnetic stirrer bar. 4.0 gram of tetraethoxysilane,containing 0.05% n-octane as internal standard, and 0.1 gram of potassiumhydroxide or sodium ethanolate were added. The vial was sealed with aTeflonised rubber septum and two 27 gauge needles were penetrated through theseptum. Nitrogen was bubbled through the solution for two minutes to remove

25
dissolved oxygen. Both needles were then removed and the reaction was carriedout at 120 °C under stirring in a heating block for 60 minutes. After cooling toroom temperature, the cap was removed. Gaseous carbon dioxide was bubbledthrough the solution for two minutes to neutralise the alkaline solution. Aftercentrifugation, the clear supernatant was checked to be slightly acidic using apH stick and then analysed by gas chromatography.
For this purpose we used a Hewlett Packard GC model 5890A with a flameionisation detector. The column was a J&W DB-1 (30 m x 0.32 mm) with a filmthickness of 1 µm. Helium was used as carrier gas with a flow rate of 1.0 ml/min(constant pressure).The instrument was set with an injector port, a temperatureof 250 °C and a detector temperature of 350 °C. The column oven wasprogrammed with the following settings: 40 °C for one minute, 4 °C/min up to140 °C and then 10 °C/min up to 325 °C at which the temperature was held for20 minutes. The split ratio was 1:10 and the injection volume was 1 µL.
The external standard solution for vinylmethylsiloxane was made from solutionsof vinylmethyldiethoxysilane (VMDES), from ABCR, dissolved in the internalstandard solution in the range of 25 to 600 µg VMDES/g tetraethoxysilane. Thechromatograms of the two pre-elastomers are shown in figures 19-20. Achromatogram of a vinyl-terminated PDMS is shown in figure 21 forcomparison.
Figure 19 GC chromatogram of the alkaline tetraethoxysilane decomposedpre-elastomer Part A

26
Figure 20 GC chromatogram of the alkaline tetraethoxysilane decomposedpre-elastomer Part B
Figure 21 GC chromatogram of the alkaline tetraethoxysilane decomposedsilicone oil SFD 119
To identify the majority of the different peaks in the chromatograms we used amass spectrometer Hewlett Packard 5972, as detector.

27
♦ The first eluting peak at 4 minutes was ethanol, traces from or degradationof the reagent, tetraethoxysilane.
♦ The peak, at 7 minutes, was trimethylethoxysilane, which is the derivativeof the terminal trimethylsiloxane group. This peak was present only in thechromatogram from pre-elastomer Part B. This compound originates fromthe crosslinker, the only trimethyl-terminated siloxane in the pre-elastomer.
♦ The derivative of the terminal vinyl group dimethylvinylethoxysilane wasfound at 10 minutes. This peak was very small in the chromatograms of thepre-elastomers, but quite large in the chromatogram of the vinyl-terminatedsilicone oil, SFD119.
♦ The relatively large peak at approximately 13 minutes wasdiethoxydimethylsilane, the derivative of the major component in thepolymers, the dimethylsiloxane group.
♦ The internal standard, n-octane, was found at about 15 minutes
♦ The vinylmethyldiethoxysilane group from the vinyldimethylsiloxanegroup (VDMS) eluted at 17 minutes.
♦ After 18 minutes, methyltriethoxysilane eluted, which was the derivativeformed from the hydride group (MHS). This peak was also found in thechromatogram from pre-elastomer Part A contains no crosslinker. Oneexplanation of this finding is that this derivative can also be formed fromthe silanol group methylhydroxysilane, which should be considered as animpurity in the sample.
♦ Some of the peaks eluting after the reagent itself (23 min) are cyclicoligomers of dimethylsiloxane.
From a ruggedness study where different experimental factors were varied overa range of approximately 10-50% we found that the results from this methodwere dependent mainly on the sample weight and choice of catalyst. A smallamount of sample (≤10 mg) and the use of sodium ethylate as catalyst gavealmost full recovery for vinylmethylsiloxane (Ref. 42). The repeatability of the method for the quantification of thevinyldimethylsiloxane terminal group was estimated to be 2% from five separatedeterminations, where the content was determined to 0.21%.

28
This GC method is more sensitive than proton NMR, for the determination ofdifferent vinyl groups. Also, several different moieties can be analysed by theGC method. The NMR method has the advantage that the measurements aremade directly on the sample solution without derivatisation. In conclusion, thetwo methods are complementary and the choice of method is dependent on theissue.
2.2 INHIBITOR CONTENT DETERMINED WITHHEADSPACE GAS CHROMATOGRAPHY [Paper III]
In order to increase the available processing time of the mixed material prior tocuring, the manufacturer adds an inhibitor to the formulation. Different types ofcompounds containing an acetylenic group have been successfully used for thispurpose (Refs. 43-44). As the silicone material is heated, this inhibition effect islost or strongly reduced and the curing reaction proceeds rapidly.
No suitable method was found in the literature for the determination of theinhibitor in the silicone matrix. On the other hand, indirect methods were foundwhere the curing rate was measured by e.g. rheometry, thermal analysis methodssuch as DSC or DMTA and spectroscopically by IR (Refs. 45-48). However,these indirect measurements reflect not only the content of the curingcomponents but also the presence of any substance that can poison the curingprocess e.g. amines, sulfur, nitrogen oxide, organotin compounds and carbonmonoxide (Ref. 49). It was therefore necessary to measure the content of theinhibitor itself. Different attempts to determine the inhibitor content byspectroscopy (NMR and IR) failed, probably due to the rather low amount ofinhibitor in the silicone material. During the characterisation by gaschromatography of oligomers in the pre-elastomers, we found that the inhibitorpresent in Part B, 1-ethynyl-1-cyclohexanol, (ETCH) eluted at a rather lowtemperature from the column. From this observation, we assumed that it couldbe possible to develop a gas chromatography method using the headspaceinjection technique. The advantage of using head space injection is that only thevolatile compounds are injected to the column, and the column will not thereforebe damaged due to injections of high molecular mass polymers.
As reference substance, we used 1-ethynylcyclohexanol, purum quality,manufactured by Fluka Chemie AG, Switzerland (Fig 22).

29
C
OH
CH
ETCH
Figure 22 Structure of the inhibitor, 1-ethynylcyclohexanol (ETCH)
Octamethylcyclotetrasiloxane (D4) with 98% purity, from ABCR, Karlsruhe,Germany, was used for the system suitability test.
The equipment used was a headspace autosampler, Perkin Elmer HS40, whichwas coupled to a Hewlett Packard gas chromatograph, model 6890A, with asplit/splitless injector and a flame ionization detector. The flame ionizationdetector (FID) signal was processed by a Millennium 2020 chromatography datasystem from Waters. The capillary column (30m*0.32mm) was DB1 from J&Wcoated with 1 µm poly(dimethylsiloxane). For the identification of the unknownpeaks in the GC chromatogram, a mass selective detector Model 5972A fromHewlett Packard replaced the flame ionization detector.
Approximately ten grams of the sample were thoroughly mixed in the two-rollmixer to ensure homogeneity. For each analysis, 1.00 ± 0.01 gram of the samplewas placed in each of two 20 ml headspace vials. 50 µl of ethanol was added tothe first vial and 50 µl of a standard solution of ETCH (10 mg/ml) dissolved inethanol was added to the second vial. The vials were put into the headspaceautosampler after being sealed. The sample vial was allowed to equilibrate at90 °C for 60 minutes prior to injection into the gas chromatograph. Thesampling needle and the transfer liner were set to 120 °C and the appliedpressure time was 1.0 minutes, the injection time 0.06 minutes and the needlewithdrawal time 0.1 minute. The gas chromatograph was programmed with aninjection port temperature of 150 °C and a detector temperature of 250 °C. Thecolumn oven was set at 50 °C for 1 minute and the temperature was then raisedby 10 °C/min to 250 °C at which it was kept constant for 1 minute. The flowrate of the helium carrier gas was approximately 2 ml/min. The peak areas forETCH were determined for the sample with and without standard addition. Theretention time for ETCH was approximately 8 minutes. A standard addition plotwas constructed and the amount of ETCH was calculated.
A system suitability test was performed prior to the analysis of the inhibitor, inorder to verify that the headspace gas chromatographic system had the expectedperformance. 50 µl of a solution of ETCH (0.5 mg/ml) and the cyclic siliconeoligomer, D4, (0.3 mg/ml) were transferred to a headspace vial. After the vial

30
has been sealed, the mixture was analysed according to the conditions for thesilicone material described above, except that the equilibration time was reducedto 10 minutes. The resolution (Rs) between the two peaks should be at least 4 ifthe instrument is working properly.
Measurement of the gas phase of the silicone sample takes advantage of therelatively high vapour pressure of ETCH. The selected non-polar GC columnmainly separates substances according to their vapour pressures. It can be seenin a typical chromatogram from a sample without standard addition (Fig. 23)that the ETCH peak elutes rather early.
Figure 23 Example of a GC chromatogram from a gas phase injection of thepre-elastomer Part B, containing the inhibitor, ETCH
The chromatogram also shows that other volatile substances are present in thesample. The mass selective detector was used to identify these peaks,. Theinterpretations of the mass spectra show a positive identification for 1-ethynylcyclohexanol for the peak at approximately 8 minutes. Apart from thefirst peak, which was the added solvent (ethanol), all other peaks were found tobe different species of silicone compounds. The largest peaks were interpretedas being linear and cyclic oligomers of dimethylsiloxane, while many of the

31
smaller peaks were related to the methylhydrogensiloxane crosslinker. Forcomparison, figure 24 shows a chromatogram of Part A. The first large peak ismissing because no ethanol was added to this sample.
Figure 24 Example of a GC chromatogram of the pre-elastomer Part A withno inhibitor
Only the short linear and cyclic oligomers of poly(dimethylsiloxanes) can befound in this chromatogram, apart from the first small peak which was related tothe vinyl-containing silicone oil. No peak was eluted at the retention time forETCH, which confirms that the chromatographic method separates ETCH fromother volatile compounds present in the sample.
The time for a volatile compound to equilibrate between the solid phase and thegas phase is normally very long for solid samples. Attempts were thereforeinitially made to dissolve the semi-solid silicone sample in different solvents. Itwas found however that the sensitivity of ETCH became low using thisapproach. In addition, the procedure was very time-consuming, as the siliconematerial required a long time to dissolve. An investigation was therefore carriedout in order to determine the time required for ETCH to equilibrate betweensolid and gas phase using the untreated sample. After initial experiments withdifferent equilibrium temperatures, the sample equilibration temperature was setto +90 °C. This temperature was chosen as a compromise, between the need toensure sufficient sensitivity for ETCH, and the need to avoid degradation of

32
sample components. The higher the temperature, the larger the amount of highvolatile silicone oligomers that would be injected into the column, and thiswould result in column bleeding and, in the worst case, changes in the columnperformance. As shown in figure 25, it was found that the peak area for ETCHreaches a maximum value within approximately 60 minutes. The figure alsoshows that the peak area was constant between 60 and 100 minutes, i.e. thereseems to be no degradation of ETCH in the sample matrix consisting of reactivevinyl and hydride groups.
Figure 25 Response curve at different times for the inhibitor at 90°
The precision of the method was estimated from duplicate analyses of twelvesamples on different occasions. The relative standard deviation was estimated tobe 6%. The contents of ETCH in these samples were found to be in the range of0.4 to 0.6 mg/g, i.e. 0.04-0.06%. The linearity of the method was examined bymaking several standard additions to a sample with increasing concentrations ofETCH. Figure 26 shows a graph where five standard additions have been madeto one sample. A good linear relationship was found within the examinedconcentration range that covers an ETCH content up to at least 1%.

33
y = 211,24x + 41,476R2 = 0,9989
0
200
400
-0,2 0,4 1,0 1,6Added amount of ETCH (µg)
Peak
are
a fo
r E
TC
H
Figure 26 Peak area versus added amount of the inhibitor ETCH
The disadvantage of the rather long equilibration time of one hour for the semi-solid silicone material prior to injection is easily overcome by the very easysample preparation and the use of automatic headspace equipment. In addition,no time has to be spent on dissolving the sample, which would be quite time-consuming for this type of high molecular mass polymer. There is of course alsoan environmental advantage in using an almost solvent-free method.
2.3 SILICA FILLER CONTENT DETERMINED WITH TGA
Silica, both fumed and precipitated, is used as a filler for reinforcing the siliconeelastomer (Refs. 50-57). The fumed silica used in this silicone elastomer ismanufactured by burning silicon tetrachloride (SiCl4) with hydrogen and oxygenat a temperature of about 1000 °C. Agglomerates of very small silica particlesare formed and the diameter of the individual primary particles is in the regionof 5 to 20 nm. Due to the small particle size, the surface area is enormouslyhigh, several hundred square meters per gram silica. The reinforcing effect isvery high with this filler. Unfilled silicone elastomers are brittle and have verypoor mechanical properties. The large reinforcement capability of silica is duemainly to the strong interactions between the different silanol groups on the

34
silica surface and the silicone polymer through hydrogen bonds. The differentchemical groups on the silica surface are shown in figure 27 (Refs. 58-59).
Isolatedsilanol
Geminalsilanols
Vicinal silanols Siloxane
Figure 27 Different silanol groups on the surface of fumed silica
Examples of hydrogen bonds which can interact between silica and siloxanes areshown in figure 28. There is a strong interaction between two silanol groupsdue to the possibility of double hydrogen bonds. A weaker hydrogen bond isformed between the silica silanol group and the siloxane oxygen in silicone.
Hydrogen bonding between an isolatedsilanol on silica and a terminalorganosilanol group
Hydrogen bonding between an isolatedsilanol on silica and a siloxane bondingin a silicone polymer
Figure 28 Hydrogen bonds in silica-filled silicone
It is important to use silicone materials with a consistent silica content andsurface properties, as these parameters influence the drug release properties,both the drug solubility and the diffusion rate. One example of a drug – silicainteraction is shown in figure 29. In this case the nitrogen atom also contributesto the interactions (Ref. 58)

35
Figure 29 Possible interactions (dotted lines) between silica and besocain
The rheological properties of the pre-elastomers, which are important in themanufacture of the finished drug products, are also influenced by the amountand type of silica filler (Refs. 60-61). Furthermore, the mechanical properties ofthe cured elastomer, e.g. hardness, tensile strength, elongation and tearresistance, also vary with filler content and type.
Thermogravimetric analysis (TGA) is a common technique for studying thermaldecomposition and for determining the filler content in plastic materials (Refs.62-65). This technique was also applied to the pre-elastomer samples. The TGAequipment was from Mettler Toledo AG, Switzerland, and consisted of athermobalance TGA30 controlled by a computer, running the TA4000 software.Platinum sample crucibles were used, and an inert atmosphere was maintainedin the sample compartment with a nitrogen gas flow of 200 mL/min.Approximately 10 mg of the sample was heated from 30 to 1000 °C at a rate of10 °C/min. The remaining white ash was assumed to be the silica filler.
Figure 30 shows a typical TGA thermogram of the silicone pre-elastomer. Up to400 °C, only the low molecular mass part of the sample evaporates, mainlycyclic oligomers. At approximately 500 °C, depolymerisation starts with theformation of volatile cyclic oligomers.

36
Figure 30 TGA thermogram of pre-elastomer Part B
We initially found silica contents of 26-31% for Part A and 23-24% for Part B.This was not what we had expected, as the information supplied by DowCorning was that the silica content should be about 21%. We tried therefore tofurther improve the method to make it more accurate. We knew that it wasessential that no oxygen should be present in the sample compartment becausesilicone can oxidize to form silica (SiO2). Different parameters were tested in areduced factorial design experiment.
♦ High purity nitrogen♦ High purity helium♦ Addition of moisture to the atmosphere♦ Gas flow rate♦ Sample degassing prior to the pyrolysis♦ Variations in heating rate♦ Replacement of the platinum sample crucible by
aluminium oxide crucibles♦ Addition of alkali to the sample♦ Amount of sample
None of these parameters was able to reduce the amount of residue. The resultsfrom Part A also showed large variations, 28-48%, which was probably due tothe presence of the platinum catalyst in the sample. From elemental analysis of

37
the residues, we found that they contained a significant amount of carbon,indicating that part of the ash was silicon carbide (SiC). The results of thecarbon analysis (Tab. 5) indicate that this is not the only explanation, as thesilica content should be around 21%.
Table 5 Results of carbon analysis and calculation of silicon carbide content
Sample TGA residue(SiO2+SiC)
(%)
Carboncontent
in residue(%)
Calculatedamount of SiC
(%)
Residue minusSiC, equal tosilica content
(%)Part A 47.7 10.0 33.4 14.3
Part B 23.9 1.3 4.3 19.6
During the thermal degradation of the samples, it is possible that the followingreactions occur where the small amount of platinum catalyst has a largeinfluence:
♦ Silicone depolymerisation into volatile oligomers (mainreaction)
♦ Silicone reduction into silicon carbide♦ Silica (filler) reduction into silicon carbide
We also carried out experiments with mixtures of silica and silicone oils whichall gave very accurate results for the silica content. The silica in the pre-elastomer samples is not chemically the same as pure silica, as it has beenchemically modified by deactivation with organosilanols. Part of the silicasurface is covered by covalently bonded silicone, and it is this which probablydoes not depolymerise but rather converts into silicon carbide. We thereforeconcluded that it was not possible to develop a method for the accuratedetermination of silica filler in these types of silicone pre-elastomers.
Although there is an overestimation of the filler content, we made duplicateanalyses of ten different batches by the method described. The variation in themethod calculated as the pooled standard deviation was 0.9% and the fillercontent for the pre-elastomer Part B was found to be between 24.0 and 25.8%.These results show that the filler content is very consistent in the pre-elastomerbatches.

38
2.4 ORGANOSILANOL CONTENT DETERMINED WITH HPLC[Paper II]
Untreated silica in pre-elastomers tends to agglomerate, and this leads to areduction in mechanical strength of the final elastomer. This agglomeration canbe seen by transmission electron microscopy (TEM) (Ref. 66). It has also beenfound, especially for high-consistency pre-elastomers, that the inorganic silanolgroups must be deactivated in order to avoid stiffening of the uncured pre-elastomer, a phenomenom known as creep hardening (Ref. 67).
Both the agglomeration and creep hardening can be avoided by deactivating thesilanol groups on silica with e.g. trimethylchlorosilane or hexamethyldisilazane.Another common way of achieving this kind of deactivation is to mix the fumedsilica with low molecular mass organosilanols at an elevated temperature (Refs.67-69). Excess organosilanols remaining in the material after the manufacture ofthe pre-elastomers, due to poor deactivation, will affect the rheologicalproperties of the pre-elastomer, influence drug delivery properties and causeleaching from the final medical product. It is therefore important to control thepre-elastomers for these non-bonded organosilanols. Figure 31 shows twodifferent types of silanol present in silicone pre-elastomers, inorganic silanol andorganosilanol. In addition, the organosilanol may be free, hydrogen bonded orcovalently bonded to the silica.
Figure 31 Two different types of silanol present in silicone pre-elastomers
The organosilanols, also called hydroxy-terminated PDMS, are produced byhydrolysis of dimethyldichlorosilane (Fig 32).

39
Si
CH3
Cl
CH3
Cl + H2O Si
CH3
HO
CH3
O H
n
+ HCl
Figure 32 Polymerisation of dimethyl dichlorosilane in the presence of water
Organosilanols are stable but they may condense with an increase in the averagemolecular mass, especially at high temperatures or in the presence of an alkalinecatalyst. They may also react with silanol groups on silica surfaces to formsiloxane bonds or strongly attach to the silanols by hydrogen bonds and therebydeactivate the silica.
Many methods have been used to estimate the silanol content, but a majorweakness of most of these methods is that they do not distinguish betweeninorganic silanols and organosilanols. The use of a Grignard reagent, such asmethyl magnesium iodide, leads to the production of molar amounts of methanewhich have been measured manometrically (Refs. 70-71). Another methodsuitable for manometric measurement is treatment with the strong reducingagent lithium aluminium hydride, which leads to the formation of hydrogen(Ref. 72). Several titration methods have also been described. In potentiometrictitrations, silanols can be titrated as weak acids with a strong base, e.g. lithiumaluminium dibutylamide (Ref. 73) or lithium aluminium amide (Ref 74). KarlFischer titration has been widely used for this application. In this method,silanols and methanol (solvent) react and produce silyl ethers with water as a by-product, and this water reacts with the Karl Fischer reagent. A majordisadvantage of this procedure is that water, silanol groups on silica andorganosilanols present in pre-elastomers are all determined simultaneously. It ispossible to perform water-specific determinations using larger alcohols assolvent to prevent the condensation reaction and the difference between the twomethods hen gives the total amount of silanols (Ref 75-79). With spectroscopictechniques such as IR and 1H-NMR, it is difficult to differentiate betweensignals from inorganic silanols, organosilanols and water. It seems to be possibleto determine organosilanol using 29Si-NMR (Ref. 80) but, even though thetechnique is highly selective, the sensitivity is fairly low.
Several chromatographic methods have also been developed and they appear tobe more or less selective for silanols. The use of reverse-phase liquidchromatography or size exclusion chromatography in combination with an ICP-AES spectrometer (atomic emission spectroscopy) makes the detection highly

40
sensitive and also selective for silicones, but unfortunately not selective fororganosilanols (Ref. 81). The use of an infrared spectrometer as detector for LCmakes the determination fairly selective but not very sensitive (Ref. 82). Gaschromatography (GC) equipped with a mass spectrometric detector can be usedfor silanol identification and quantification (Ref. 83). But only for lowmolecular mass silanols which can be vaporised in the GC injector.Derivatisation of the silanol groups makes it possible to expand the mass rangeof silanols which can analysed by GC. GC is an excellent technique with a highseparating power for the smaller silanols, and the use of a flame ionisationdetector or mass spectrometer makes this technique very sensitive. A drawbackwhen using the chromatographic methods for silicones is the lack of suitablereference standards.
Here we present a new sensitive and selective method for the determination ofthe total amount of organosilanols in a silicone pre-elastomer. We used pyridinewith a water content less than 0.01%, non-stabilised tetrahydrofuran (THF)(LiChrosolve), toluene, methanol, and methyl cellosolve (2- methoxyethanol),all supplied by MERCK Eurolab, Stockholm, Sweden. The THF used forderivatisation was stored with a molecular sieve (4 A) in a closed bottle toreduce the water content. The Karl Fischer reagent, Hydranal Composite 5, wasobtained from Riedel-de Haen, Germany. The silylation agents,dimethylphenylchlorosilane (DMPSCl) and 1,3.diphenyl-1,1,3,3-tetramethyldisilazane (DPTMDS) were supplied by Sigma-Aldrich, Stockholm,Sweden (Fig 33).
Si
CH3
CH3
Cl Si N
CH3
CH3
N Si
CH3
CH3
DMPSCl DPTMDS
Figure 33 Structure of the two agents used for derivatisation of silanols
Fumed silica, Aerosil 200, was supplied by Degussa, Frankfurt, Germany.Hydroxy-terminated polydimethylsiloxanes PS340, PS340.5, PS341, PS342.5(organosilanol fluids), dimethylvinyl-terminated polydimethylsiloxane (PS437)and methylhydro (30-35%) dimethylsiloxane copolymer (PS123) were allobtained from ABCR GmbH, Karlsruhe, Germany. Three other organosilanolfluids, DC-I, DC-II and DC-III, and several batches of the pre-elastomerSilastic® Q7-4735 Part A and Part B were obtained from Dow Corning, SophiaAntipolis, France.

41
The hydroxyl content of the organosilanol fluids was determined by KarlFischer titration. The principle of this titration is that both inorganic and organicsilanol groups condense with methanol to form an equivalent molar amount ofwater (Fig 34).
H2OSi
CH3
HO
CH3
O+ Si
CH3
O
CH3
O +H3COHH3C
Figure 34 Condensation reaction between methanol and silanols used in theKarl Fischer titration
The condensation reaction is driven to completion as the water immediatelyreacts with the Karl Fischer reagent. The titration was performed with atitroprocessor, E 682, and a dosimat, E 665, from Metrohm Ltd, Switzerland.The titration end point, when an excess of iodine remained in solution, wasdetected amperiometrically with a twin-polarised platinum electrode.Approximately 200 mg of the sample was dissolved in 100 ml of a pre-titratedwater-free methanol-toluene (1:1) mixture. The following instrumentalparameters were used: delay time 10 s, extraction time 300 s, end point potential(EP) 250 mV. The titration was performed at room temperature. Any waterpresent in the standard samples was co-determined with silanol by thisprocedure and this leads to an error in the hydroxyl determination. A separatespecific water determination was therefore made to correct for this error. In thisdetermination, methyl cellosolve (2- methoxyethanol) was used as solvent,since negligible condensation of silanol groups occurs with methyl cellosolve(Refs. 84-85). The procedure was otherwise the same as for the hydroxyl contenttitration. Data for the organosilanol standards found by this procedure are givenin table 6.

42
Table 6 Hydroxyl content found by Karl Fischer titration and calculatednumber average molecular mass (<Mn>) in the organosilanolstandards, triplicate analyses.
Silanol standard Hydroxyl content (%) <Mn> (calc.)
PS340 6.1-6.3 550
DC-I 4.2-4.3 800
DC-II 3.3-3.4 1000
DC-III 2.5-2.6 1300
PS340.5 0.9-1.2 3200
PS341 0.8-0.9 4000
PS342.5 0.2-0.2 17000
The aim was to develop a method for the selective quantification of silicone-bonded hydroxyl groups (organosilanols) in the pre-elastomers. The approachwas to combine silanol derivatisation with liquid chromatography using a smallpore size exclusion column (SEC). All polymeric silicones would then elutewithin a rather small volume, but only the derivatised polymers would bedetected. Derivatisation can be achieved with several different agents in order tointroduce a chemical group suitable for detection in a chromatographic system.We chose to react the silanol groups with a mixture of two different agents, in amanner similar to that described earlier for trimethylsilylation (Refs. 86-87). Thetwo agents, dimethylphenylchlorosilane (DMPSCl) and 1,3-diphenyl-1,1,3,3-tetramethyldisilazane (DPTMDS), replaced the hydroxyl group on the silanolwith a dimethyl phenyl group, suitable for UV detection in a chromatographicsystem.
In the first study, 100 mg of the reference silanol PS340 was dissolved in 5.0 mlof solvent. 100 µl of pyridine and 100 µl of each derivatisation agent were thenadded. After 60 minutes at room temperature, the reaction was stopped by theaddition of 1.0 ml ethanol to deactivate the reagents. Different solvents wereinitially evaluated. More or less poor recoveries were found with hexane,methylene chloride, toluene and ethyl acetate as solvent, although these are allgood solvents for PDMS. The highest recovery was found when non-stabilisedtetrahydrofuran (THF) was used as a solvent, and THF was thus chosen as thechromatographic eluent.

43
After the initial tests, an screening study was performed in order to clarify howdifferent factors influence the derivatisation yield. Low, medium and high pointsettings the five variables, sample mass, reaction time, reaction temperature,amount of pyridine and ratio of the derivatisation agents were combined in afactorial experiment. The factors and the experimental design are given in table7. The temperatures of the solutions were controlled by water baths. The firsteluting part in the chromatogram in each run was integrated (approx. 5 to 6.5min). This corresponds to the derivatised organosilanols. The peak areas werethen normalised with respect to the sample mass and final volume of the samplesolution.
Table 7 Experimental design: Factors investigated factors and their settings.
Factor Low (-)
Medium(0)
High (+)
Sample mass (mg) 10 55 100
Reaction time (min) 5 17.5 30
Reaction temperature (°C) 20 35 50
Amount of pyridine (µl) 0 50 100Volume of DMPSCl 1(µl)
Total DMPSCl1 + DPTMDS1 = 100 µl 10 50 90
1 DMPSCl = dimethylphenylchlorosilane, DPTMDS = diphenyltetramethylsilazane
The statistical evaluation was carried out with Modde ver 3.0, Umetri AB,Sweden, using multiple linear regression.

44
Figure 35 Variables and combination of variables having the greatest influ-ence on the derivatisation yield. Only the amount of pyridine andthe ratio of reagents were significant
Figure 35 shows the variables and combination of variables having the greatesteffect on the derivatisation yield. It was found that only the amount of pyridineand the ratio of silanisation agents had any significant effect. The medium andhigh settings gave approximately the same result in both cases. In the finalselection of factor settings, the appearance of the total chromatogram was alsoconsidered. For the high setting of DMPSCl, a large extra peak eluted atapproximately 16 minutes with strong tailing. As a consequence, thechromatographic running time had to be prolonged to 30 minutes for thesesamples. This peak was not found for the medium and lower settings. These datawere used to develop an optimised derivatisation procedure.
The chromatographic conditions were also optimised. A small pore, 50 Å, sizeexclusion column was selected in order to separate the short chain silanols fromthe derivatisation agents. The optimal detection wavelength was selected afterstudying repeated injections of the same sample while varying the wavelengthbetween 250 and 270 nm. A wavelength of 264 nm gave the maximum peakarea. A large injection volume should be used to gain maximum sensitivity. Inorder to maintain the peak resolution between the silanol derivative and thereagents in the chromatogram, the injection volume should not however be toolarge. Injection volumes up to 200 µl could be applied without losing too muchresolution. The resolution can be even better if a more efficient column is usedor if several columns are used in series.

45
In the final method, approximately 100 mg of the sample or the referencestandard silanol oil, PS340, was weighed into 10 ml glass tubes. The materialwas dissolved in 5.0 ml THF. 100 µL pyridine, 50 µL DMPSCl and 50 µLDMTMDS were then added and the solution was thoroughly mixed. After 30minutes at room temperature, 1.0 ml ethanol was added to decompose theremaining derivatisation agents. After another 30 minutes, the supernatantsolution was filtered through a 0.5 µm filter into autosampler vials and injectedinto the column.
The liquid chromatography system consisted of a pump M616, an autoinjectorWISP 712, a detector M486 and a Millennium 2020 chromatography datasystem from Waters, USA. The size exclusion column, PLgel, Polymer Labs,England, was 7.5 mm x 300 mm with 5 µm particles of crosslinked polystyrenewith a pore size of 50 Å. Single-use 25 mm PTFE filters with a pore size of 0.5µm from Millipore, USA, were used. The chromatography conditions were:flow rate of THF 1.0 ml/min, injection volume 25 µL and detection wavelength264 nm. The peak area was obtained by integration after setting a straightbaseline from the start to the end of the run. The area was measured betweenapproximately 5.0 and 6.5 minutes. The area corresponding to a blank was alsomeasured using the same integration time limits. Figure 36 shows the wholechromatogram for approximately 100 mg of the reference standard together withthat for a blank. The major peaks are components from the derivatisationreagents and pyridine. An expansion of the first part of this chromatogramshows the region where the organosilanol peak elutes.

46
Figure 36 The full chromatogram for 100 mg of the reference standard,PS 340, <Mn> = 550, together with that for a blank. The firsteluting region has been expanded, showing the organosilanol peak
The method for silanol determination was validated with regard to selectivity,linearity, detection limit (D.L.), precision and accuracy. The selectivity of themethod was investigated with regard to the different compounds present in asilicone pre-elastomer for hydrosilylation. Silicone oils containing vinyls(PS437), hydrides (PS123) and fumed silica (Aerosil 200) were analysedaccording to the described method. None of these compounds gave anyresponse. These compounds were also included in mixtures with the standardsilanol oil PS340 to see whether they had any influence on the response, i.e.whether they inhibited the derivatisation reaction. The same response wasachieved with and without the added compounds. We therefore conclude that themethod is selective for organosilanol groups in pre-elastomers.
The linearity of the response was studied for the standard silicone oil, PS340,with a hydroxyl content of 6.2% (Fig. 37). Twelve separate derivatisations weremade on the standard oil in the range from 0.3 to 260 mg. The hydroxyl contentwas then calculated for 100 mg of sample. The chromatographic peak height forthe largest amount of standard was approximately 1.0 absorbance unit. This isprobably the upper limit for linearity, as larger peaks will be outside the linearresponse of the UV-detector.

47
y = 2.622x + 0.038R2 = 0.997
0
10
20
30
0 5 10
Amount OH (%)
Peak
are
a (A
U*s
)
Figure 37 The peak area for the reference standard, PS340, versus amount ofsilanol groups
Dilute solutions of PS340 and blank solutions (THF) were used to estimate thedetection limit. The injection volume was increased to 200 µL. The detectionlimit was estimated to 10 µg of PS340 or 0.5 µg expressed as hydroxyl groups.
The precision (pooled relative standard deviation) of the peak areas wasestimated to be 3%. The accuracy of the method was investigated by comparisonwith data obtained from the Karl Fischer titration. Figure 38 shows that the newLC method gives results comparable to those obtained by conventional KarlFischer titration.

48
y = 1.020x + 0.134R2 = 0.955
0
1
2
3
4
5
0 1 2 3 4 5
OH content % Karl Fischer titration
OH
con
tent
% L
C m
etho
d
Figure 38 Comparison between results obtained by the new LC method andthe Karl Fischer titration results for six organosilanols standards
Figures 39-41 show chromatograms of the three silanols PS340.5, PS341 andPS342.5. The different sizes of the organosilanol molecules led to differentchromatogram patterns. The reference standard, PS 340, shown in figure 36, hasthe lowest average molecular mass and is fully separated from the column void.In contrast, the largest organosilanol, PS 342.5, elutes at the void of the column(Fig. 41). Furthermore, the higher the average molecular mass the lower is thearea per mass, as can be seen by comparing the scales of the chromatograms.

49
Figure 39 Chromatogram of 94 mg of the organosilanol fluid PS 340.5together with that of a blank, <Mn> is 3 200
Figure 40 Chromatogram of 110 mg of the organosilanol fluid PS 341together with that of a blank, <Mn> is 4 000

50
Figure 41 Chromatogram of 100 mg of the organosilanol fluid PS 342.5together with that of a blank, <Mn> is 17 000
The organosilanol content in six batches of the pre-elastomer Silastic® Q7-4735Part A and Part B was determined by the new LC method. The results for thedifferent samples were quite consistent and the values obtained corresponded to0.05 – 0.10% OH.
2.6 CATALYST CONTENT DETERMINED WITH ICP-AES
Platinum is used as a catalyst in the crosslinking reaction of Silastic® Q7-4735.It is made from hexachloroplatinic acid dissolved in a vinylsiloxane-terminateddimethylsiloxane forming a complex (Ref. 88). Platinum is well suited for thisreaction because it activates the silane bond cleavage (≡ Si-H), weakens thecarbon-carbon bond in the vinyl groups and resists reduction to lower oxidationstates during crosslinking. A drawback with this catalyst is, however, that it iseasily poisoned by sulphur, amines, and phosphorus compounds (Ref. 89). Theplatinum content in the pre-elastomer (Part A) was determined by externallaboratories by either X-ray fluorescence or atomic emission spectroscopy (ICP-AES).
In the X-ray fluorescence method, the sample was decomposed at 500 °C. Theresidue, consisting mainly of silica, was treated with hydrofluoric acid (HF) and

51
under slight heating the silicon fluoride formed evaporated prior to the finalmeasurement.
In the other method, the pre-elastomer was treated with a mixture of nitric acid,hydrofluoric acid and hydrochloric acid in a sealed Teflon container in amicrowave oven to form a clear solution according to ASTM D3683. Thissolution was directly analysed with ICP-AES according to EPA methods 200.7and 200.8, respectively.
It was found that the platinum content was very consistent. We analysed 25batches and the mean value was 22.1 µg/g with a standard deviation of 1.8 µg/g.We did not perform any validation of these methods, but they are considered tobe highly specific, as well as having high accuracy and rather good precision.
2.7 CONCLUSIONS FROM ANALYSES OF THEPRE-ELASTOMERS BEFORE CURING
Several analytical methods have been developed to measure the amounts offunctional groups or compounds present in the pre-elastomers. Most of thegroups are present in rather low concentrations in the material. It was therefore achallenge to create methods with high quality regarding accuracy, precision andselectivity.
The proton NMR method was able to quantify the terminal and total amounts ofvinyl groups simultaneously with the hydride groups without the need forreference standards. Using the IR method, it was possible to measure the hydridedirectly on the pre-elastomer. With this fast procedure a large number ofsamples could be run to control the consistency of the delivered pre-elastomerbatches. By using alkaline digestion in the presence of tetraethoxysilanefollowed by gas chromatography-mass spectrometry, it was possible to extract alot of information about the material composition which not had been identifiedby either NMR or IR.
The inhibitor content was successfully determined with headspace gaschromatography using the standard addition technique. Even though the methodwas found to be selective for ethynylcyclohexanol in Silastic® Q7-4735, it isrecommended that the flame ionisation detector be replaced by the massselective detector when this inhibitor or other similar inhibitors are analyses inother silicone materials.
Liquid chromatography was used to determine the organosilanol residues. Theselectivity was achieved by derivatisation of the silanol group, where a phenyl

52
group was introduced which could be detected by the UV detector. The silanolswere separated by size exclusion chromatography.
The amount of silica filler was determined by thermogravimetry. When the pre-elastomer was heated, it degraded and produced volatile compounds. Theresidue after the pyrolysis was mainly silica. This method was not applicable tothe platinum Part A pre-elastomer due to side reactions.
Atomic emission spectroscopy was used to determine the amount of theplatinum catalyst.

53
3. ANALYSIS DURING CURING
Silicone elastomers can be cured in various ways and they can be divided intoroom temperature cures or vulcanisations (RTV) and activated cures. RTVcuring starts at room temperature as soon as the components have been mixed,whereas activated cure systems require heat or irradiation to start. One type ofone-component RTV curing system is based on the condensation reaction ofsilanols which is catalysed by acids. However, due to the poor storage stability,precursors of silanols such as alkoxy and acetoxy derivatives are used instead. Ifthe material is exposed to moisture, acetoxysilanol groups undergo hydrolysisand silanols and acetic acid are formed. In the second step, the crosslinkingreaction between the silanols proceeds with acetic acid as catalyst (Fig. 42).
Si OH3CO
O
CO
CH3
+ H2O Si OHH3CO
O
+ CH3COOH
Si OHH3CO
O
SiH3CO
O
Si CH3
O
O
O + H2OHOAc2
Figure 42 Curing of a one-component RTV elastomer
The activated cures can be achieved by several reactions. A free radical initiator,e.g. di-tert-butylperoxide, will abstract a hydrogen atom from the methyl group,and the subsequent combination of two methylene radicals leads to theformation of an ethylene linking group. The reaction rate of peroxide-initiatedcrosslinking may be improved by the incorporation of vinyl groups in thepolysiloxane chain.
A common system for crosslinking silicone for medical applications is thehydrosilylation reaction (Refs. 90-94). The hydrosilylation curing is an additionreaction between silicone hydride and silicone vinyl groups where platinum isused as catalyst (Fig. 43).
54
O Si
CH3
CH3
CH CH2
SiO
CH3
O
O Si
CH3
CH3
CH2 CH2
SiO
CH3H
O+
Pt heat
Figure 43 The hydrosilylation crosslinking reaction used in theSilastic® Q7-4735
It is important to consider all the different issues that can be raised due to thecuring of the material during the manufacture of a drug delivery device.
1. Pre-curing is an undesired partial curing that occurs in the material duringmixing, on subsequent storage and during extrusion. The pre-curinginfluences the rheological behaviour of the material.
2. The curing itself may have undesirable side effects. If the curingtemperature is too high and/or the curing time is too long, the drug itselfmay form degradation products. There is also a risk that the drug will beoversaturated in the sheet layer of an intra-vaginal ring. This would leadto an unacceptable high drug release during the initial use of the device.
3. Post-curing will occur. During post-curing, residues of hydride groupsfrom the crosslinker slowly decompose. In addition, the elastomer showsan increase in hardness upon storage.

55
3.1 TECHNIQUES TO MONITOR THE CURING REACTION
Moving Die Rheometer
A common technique used for cure monitoring close to the manufacturingprocess involves the use of dynamical mechanical rheological instruments, e.g.the Monsanto moving die rheometer, MDE 2000E. Between 4.5 and 5.0 g of the mixed material was put on the lower rheometerplate. The upper plate which was oscillating with an amplitude of ± 0.5° waslowered until it was close to the stationary lower plate and the torque wasmeasured for 3 minutes. The plates maintained a constant temperature of 120 °Cduring the whole measurement. The curing profiles in figure 44 show that theinitial torque is quite constant. After the inhibition time, the crosslinkingincreases and finally reaches a plateau when the curing is complete. It iscommon to characterise this profile using the T90 value, i.e. the time to reach90% of maximum curing. It is also possible from the slope of the curve to obtaininformation about the crosslinker excess. The higher the slope of the curve, thehigher is the excess of crosslinker hydride groups to vinyl groups (Ref. 95).Multiple measurements on the same blend should give only a small variation inthe T90 value, otherwise the material is not homogeneously mixed. The effect ofdifferent degrees of mixing is shown in figure 44. In the lower curve thematerial had been mixed more thoroughly, but it was still not fullyhomogenised.

56
Figure 44 Moving die curing profiles. In the lower graph, the material hasbeen mixed more thoroughly than the material in the upper graph
One parameter that must be controlled is the temperature of the pre-elastomerblend that is to be measured. During mixing, a significant amount of energy isabsorbed by the material due to friction, and this leads to an increase in thesample temperature. We obtained quite different T90 values by varying thetemperature of the blend at the time of loading the rheometer (Fig. 45). For thisreason, we state that the temperature on the sample before measurement shouldbe 25°.
60
65
70
75
80
10 15 20 25 30 35
Temperature of pre-elastomer blend (°C)
T 90 (
s)
Figure 45 Curing time measured by the moving die rheometer as a function ofsample temperature on loading
The main advantages of the moving die rheometer over the other techniquesused are that it is very fast and it is easy to load samples. Both these advantagesmake the technique suitable as a technique during manufacture. The mean T90value for 22 batches was 69 seconds and the standard deviation, includingmethod variation and batch variations, was 4 seconds.
Dynamic mechanical analyser, DMTA
A similar technique to the moving die rheometer is the dynamic mechanicalanalyser (DMTA) (Refs. 96-98). The same information can be obtained fromboth instruments. In our case, we used mainly the DMTA instrument as it was

57
available in the laboratory whereas the moving die rheometer was at themanufacturing site.
The DMTA measurements were carried out on a Netzsch DMTA 242 (NetzschGerätebau GmbH, Selb, Germany) in the shearing mode, using serrated sampleholders in order to avoid slippage between sample and sample holder during themeasurement. Only newly mixed samples were measured with the DMTAequipment. The sample area was 1.8 cm2, which was set by the sample holdergeometry, and the sample thickness was approximately 1 mm, accuratelymeasured on each occasion. The oven was purged during the measurements with200 ml/min of dry air. The samples were normally run isothermally but it wasalso possible to run temperature scans. The maximum dynamic force was 4 N,no static force was applied and the maximum amplitude was 240 µm. As thesample had been mounted in the sample holder, the pre-heated oven was raised.After each run, the endset temperature was calculated using the DMTAsoftware, illustrated in figure 46.
Figure 46 Curing with DMTA showing shear modulus (G’) developmentduring isothermal measurement at 70 °C
Differential scanning calorimetry, DSC
The curing can also be followed by DSC, where the heat of curing is monitoredversus sample temperature (Refs 98-101). The measurements were carried outon a Mettler DSC 30 TA4000. The standard 40 µl aluminium pan wascompletely filled with 40 mg of mixed samples using a spatula. For each run, aseparate mixing was performed on the pasta mixer. The samples were run from30 °C to 250 °C with a programmed temperature increase of 10 °C/min.

58
Nitrogen was used as purge gas with a flow rate of 50 ml/min. Figure 47 showsa typical exothermal peak between 100 and 110 °C for the curing of the Silastic®
material.
Figure 47 DSC thermogram showing the exothermal peak of thecuring reaction
The measurements were evaluated by measuring the area of the peak which isequivalent to the heat evolved from the curing and peak apex temperature. Anoticeable slope in the thermogram was obtained using an empty aluminiumcrucible as reference. It was possible to reduce his slope substantially whenusing a fully cured sample in the reference crucible. Consequently, theintegration of the curing peak was much more accurate when using thisprocedure.
The variation of this method was calculated from duplicate analyses of 15batches. The standard deviation for the peak apex temperature was 0.7 °C andthe heat of curing 0.17 J/g. The mean value of the peak temperature for thesamples was 105.4 °C with a standard deviation of 3.2 °C, and the mean heatwas 2.08 J/g with a standard deviation of 0.21 J/g.
3.2 PRE-CURING
The curing reaction starts as soon as the two pre-elastomer parts are mixed.However, due to the presence of the inhibitor, the reaction rate is very low andhighly dependent on the sample temperature. On a production scale, largeamounts of material are mixed and, to ensure the homogeneity of the material,

59
the mixing time may be quite long. In order to minimise the temperatureincrease in the mixture due to the friction, the rolls are cooled inside by tap-water, but temperatures up to 50 °C may nevertheless occur in the material. Forseveral reasons, it is desirable to have a consistent rheological behaviour of themixed material prior to extrusion and moulding into the finished product. Weperformed some experiments where we stored the mixed material at differenttemperatures and humidities in order to study the unwanted pre-curing reactionand how this pre-curing was affected by variations in inhibitor and crosslinkercontent.
We received five different lots of pre-elastomer, basically Silastic® Q7-4735,from Dow Corning S.A., European Healthcare Centre, Sophia Antipolis, France.The samples were similar except for variations in the crosslinker system, i.e.amount of inhibitor and crosslinker. They were analysed for their content ofinhibitor (1-ethynylcyclohexanol, ETCH) with headspace gas chromatography,catalyst with atomic emission spectroscopy and methylhydrogensiloxane (MHS)with infrared spectroscopy. The results are shown in table 8.
Table 8 Contents of crosslinking active components in the Silastic® Q7-4735sample
Sample NoCatalyst
Pt in Part A(µg/g)
Inhibitor ETCHin Part B(w/w-%)
Crosslinker MHSin Part B(mole-%)
#1 21 0.025 1.2
#2 21 0.037 1.4
#3 21 0.065 1.1
#4 21 0.078 1.5
#5 22 0.051 1.3
Sample preparation and storage
The mixing was performed on different equipment depending on the amount ofmaterial to be cured. On the small laboratory scale we used 5.0 - 25.0 g of eachpre-elastomer and mixing was performed on a pasta blender (Atlas model 150,Marcato OMC) using slit 4. The material was drawn through the blender ten

60
times and after each passage the material was rolled up and then fed in theopposite direction to get a homogeneous blend.
On a pilot-plant scale, we used approximately 50-100 grams of each part, in atwo-roll mixer, Polymix 150 L/O (Schwabenthan Maschinen Gbmh&Co KGBerlin, Germany) in order to achieve a homogeneous material. The mixer rollswere continuously cooled internally with tap water in order to minimise sampleheat-up and thereby minimise the pre-curing reaction rate. The gap between therolls was 1.0 mm and the rotation speed was 10 rpm, the same for both rolls, i.e.no shear was applied. The actual mixing was achieved by removing the materialsheet that eluted from the mixer and roll it to a cylinder and then again placing iton the mixer rolls. This procedure was repeated ten times. The homogeneity ofthe mixing procedure was verified by measuring the crosslinker content atdifferent positions in the material using infrared spectroscopy.
The effect on storage humidity was first studied. Two different glass desiccatorspartly filled with saturated lithium chloride and sodium chloride were used tocreate controlled relative humidities at + 20 °C of 11% and 75%, respectively(Ref. 102). The mixed samples were subsequently stored at +4, +20 and +30 °Cat relative humidities of 54, 55, and 56%, respectively, which was achieved byusing a saturated magnesium nitrate solution
3.2.1 Size exclusion chromatography, SEC The molecular mass of the sample increases as the crosslinking proceeds. In thebeginning of this process, before any network is build up, some polymers are bebranched but still soluble in a suitable solvent. One possible way of followingthis very early molecular mass development is to use size exclusionchromatography (SEC). Another technique with a greater sensitivity for changesin the high molecular mass region is light scattering. The light scattering signalis proportional to the product of the molecular mass and the polymerconcentration. By measuring both the light scattering intensity and theconcentration simultaneously from a size exclusion column, it is possible tofollow the increase in relative molecular mass by dividing the area of the lightscattering peak by the area of the concentration detector peak.
Sample pieces, approximately 500 mg in size, were dissolved or extracted as thepolymer network started to build up, in 100 ml toluene at room temperatureunder vigorous mixing. The sample solution was filtered through a 0.5 µmMillex filter (Millipore). The instrument consisted of a Waters HPLC systemwith a pump M616, an autoinjector M717plus and a refractive index detectorM410 (tempered to +40 °C and the sensitivity set at 128) in order to measure the

61
relative concentration. The light scattering detector was a Dawn DSP MALLS.The detector was used at an angle of 90 degrees to measure the scattered lightintensity. Waters Millennium 2020 was used to control the chromatographysystem and to collect and process the signals from the two detectors. A singlePLgel Mixed-C with 5 µm particles in a 7.5*300 mm SEC column, PolymerLaboratories, UK, was used to separate the low molecular part of the samplefrom the main polymer. Toluene was pumped into the system at a flow rate of 1ml/min and 100 µl of the filtered sample solution was injected into the system.
When analysed by laser light scattering in combination with an RI concentrationdetector the toluene extract of the blended and stored silicone materials showedno significant change in mass average molecular mass, i.e. the quotient of thescattered light intensity and the concentration was constant. This means that theextract was unaffected by crosslinking.
3.2.2 Differential scanning calorimetry (DSC)The primary chemical reaction during crosslinking is the addition reactionbetween vinyl and hydride. Heat is evolved in the curing reaction and it can bedetected and quantified by DSC. For a new mixed sample, where no pre-curinghas occurred, a maximum heat of reaction can be detected. If any pre-curing hasoccurred, less heat will be recorded by DSC. The results from the freshly mixedsamples are summarised in table 9.
Table 9 Results from the DSC measurements of the freshly mixed sampleswhere the heat of reaction and peak apex are shown.
Exp. NoInhibitorContent
(%)
Crosslinkercontent
(%)
Heat ofreaction
J/g
Peaktemperature
(°C)
1 0,025 1,2 2,56 93,3
2 0,037 1,4 2,78 99,2
3 0,065 1,1 2,71 115,9
4 0,078 1,5 2,75 116,5
5 0,051 1,3 2,68 105,7

62
As illustrated in figure 48 (left figure), there is a strong correlation between thepeak temperature of the reaction and the inhibitor content. The higher theinhibitor content, the higher is the curing temperature. The content of theinhibitor 1-ethynylcyclohexanol normally found in the Silastic® Q7-4735batches (Part B) is around 0.05%. This amount corresponds to a reaction peaktemperature of 106 °C using this DSC method. On the other hand, there seems tobe no relationship between the peak temperature and the crosslinker content(Fig. 48, right).
80
100
120
0 0,05 0,1ETCH (w/w-%)
Peak
tem
p. (°
C)
80
100
120
1 1,3 1,6
MHS (mole-%)
Peak
tem
p. (°
C)
Figure 48 Peak apex temperature measured by DSC versus inhibitor contentand crosslinker content
There seems to be a weak correlation between the heat of reaction and both theinhibitor and MHS contents, although the significance is rather poor (Fig. 49).This indicates that the inhibitor takes part in the crosslinking reaction, i.e. reactswith the crosslinker as with the vinyl groups. The increasing heat of reactionwith increasing crosslinker content is probably due to secondary reactions ofMHS, e.g. with water and/or oxygen.

63
2,4
2,6
2,8
3
0 0,05 0,1ETCH (w/w-%)
Hea
t (J/
g)
2,4
2,6
2,8
3
1 1,3 1,6
MHS (mole-%)H
eat (
J/g)
Figure 49 Heat of reaction measured by DSC versus inhibitor content andcrosslinker content
The stored samples were analysed on different occasions, particularly in the caseof samples stored at higher temperatures. Figure 50 shows the heat of curing forsample # 1. The data for +20 and +30 °C showed a linear decrease in the heat ofcuring versus storage time, and the time for a complete cure was evaluated byextrapolation. For the samples stored at +4 °C it was not possible to evaluate thetime for full curing as the decrease was less than 10%.

64
0
1
2
3
0 50 100Storage time (hours)
Hea
t of c
urin
g (J
/g)
+4°C +20°C
+30°C
Figure 50 Heat of curing for sample No 1 stored at 4, 20 and 30 °C
The extrapolated time for full curing showed a good correlation with theinhibitor content (Fig. 51). For the normal batches with an inhibitor content of0.05%, the time for full cure would be approximately two days at roomtemperature.
0
25
50
75
100
0 0,05 0,1ETCH content (% )
Tim
e to
full
cure
(hou
rs
+20°C +30°C
Figure 51 Time to complete curing versus the inhibitor content for mixed pre-elastomers stored at 20 and 30 °C. The time to complete curing wasdetermined by extrapolation of DSC data to ∆H=0

65
Another effect of pre-curing was that the DSC peak apex shifted to a lowertemperature with increasing the storage time. For the samples where the curingwas almost complete, i.e. showing very small peaks, the peak temperature wasas low as 75 °C. This reduction in curing temperature is probably due to the lossof inhibitor, by evaporation and/or by a reaction with the crosslinker.
3.2.3 Dynamic mechanical thermal analysis (DMTA)
The increase in shear modulus, proportional to the degree of crosslinking, wasmeasured with DMTA. The standard deviation for the end-point determination(Fig. 46) was estimated to be 3 °C for a sample with a curing time ofapproximately 100 minutes (n=6). The humidity in the oven had no influence onthe end-point value. Two measurements each at 0 and 100% relative humiditywere made for one sample. The end-point was 98 +/- 3 minutes at the dryconditions and 93 +/- 2 minutes at the humidified conditions.
Samples of the five different compositions (#1-5) were run isothermally, in dryair, at 24, 30, 40, 50, 60, 70 and 80 °C. A good correlation was obtainedbetween the logarithm of the curing time and the temperature for the fivesamples (Fig. 52).
1
1,5
2
2,5
3
3,5
4
20 30 40 50 60 70 80
Temperature (C)
Lg
Tim
e to
full
cure
(h)
#1 #2 #3 #4 #5
Figure 52 Curing time at different temperatures for the five compositions

66
The points at the higher temperatures deviate from the straight lines, but this isprobably due to the high heat capacity of the sample holder and the slow heattransfer from the surrounding air. The sample was mounted in the holder atroom temperature outside the pre-heated oven and had to be heated to the oventemperature, which took several minutes. This delay was less pronounced atlower temperatures. This means that there was a time lag before the samplereached the equilibrium curing temperature. Nevertheless, by measuring thecuring time of an unknown sample at a few different moderately hightemperatures, it will be possible to foresee the pot life of the mixed sample atroom temperature.
The information in figure 52 is presented in a different manner in figure 53which shows that there was a good correlation between time of curing andinhibitor content at the different temperatures. These results are somewhatdifferent than those found by DSC. For instance, the mixed material with aninhibitor content of 0.05% would be fully cured after 2 days at 30 °C accordingto DMTA, but after half that time, i.e. one day, accoring to the DSC results. Thereason for this difference may be that the inhibitor is free to evaporate from theopen DSC crucibles during storage, whereas it is trapped in the DMTA sampleholder.
0,00
25,00
50,00
75,00
100,00
0 0,05 0,1
ETCH content (% )
Tim
e to
full
cure
(hou
rs)
30°C
40°C
50°C
60°C
70°C
Figure 53 Time for curing versus the inhibitor content for mixed pre-elastomers measured by DMTA at temperatures between30 °C and 70 °C

67
3.2.4 Head space gas chromatography (HS-GC)
In order to follow the inhibitor concentration in the mixed silicone materialduring curing, the headspace gas chromatographic method was used. One gramof the mixed sample was placed in each 20 ml glass vial and screw caps with aPTFE-coated silicone rubber were used for sealing. The vials were placed in theheated headspace injector at 70 °C and the gas phase was automatically sampledby the injector at 10 minute intervals between 10 and 90 minutes.
As shown earlier, it takes a relative long time to reach equilibrium partition ofthe inhibitor between the solid and gas phases at the investigated temperature; inthis case at least 30 minutes. In addition, the inhibitor content in the materialchanged during the time of measurement. As we wished to measure the inhibitorcontent from 10 minutes it was not possible to perform a quantitativedetermination of the inhibitor but only a relative determination. Thedetermination was carried out using octamethyltetrasiloxane (D4) as an internalstandard, to the inhibitor where the content of D4 would remain constant. Wefound that the ratio of the area for the inhibitor to the area for D4 measured onPart B was constant from a few minutes up to several hours.
In figure 54, the ratio of the inhibitor peak area to the D4 peak area is plottedversus the reaction time at +70 °C in the closed system.
0
0,1
0,2
0 20 40 60 80Equilibrium time (minutes)
Are
a E
TC
H/A
rea
D4

68
Figure 54 Inhibitor content versus storage time in a mixed pre-elastomerstored at 70 °C measured by headspace gas chromatography usingD4 as an internal standard
The results show firstly that the inhibitor is volatile and that it can therefore belost by evaporation during storage, reducing the shelf-life of the mixed material.Secondly, the inhibitor content in the gas phase and thus also in the materialdecreases with time. After roughly one hour at 70 °C less than 10% of theoriginal amount is left to prevent crosslinking from occuring. As themeasurement was performed in a closed system, no loss of inhibitor byevaporation was possible. Consequently, the inhibitor must have reactedchemically during this heating process, either with the silicone components, e.g.addition to the hydride group in the crosslinker, similar to the reaction betweenvinyl group and hydride groups, or by degradation as a result of oxidation orsome other degradation process.
3.2.5 Conclusions from the analyses during curing; pre-curing
Thermal analytical techniques such as DSC and DMTA can be used to measurepre-curing effects. Gas chromatography was also able to show that the inhibitorwas lost in the material, probably by addition to the crosslinker.
The results clearly show that it is essential to keep the material at the lowestpossible temperature during mixing and subsequent storage to minimise pre-curing. The material should preferably be used as soon as possible directly aftermixing. The humidity seems to have no effect on the pre-curing.
3.3 POST-CURING [Paper I]
During the development work on Estring, we found that the elastomer becomesharder and that the modulus increases during storage, as a result of the elastomerpost-cure. We have also found that a newly prepared silicone elastomer containsresidues of unreacted methylhydrogensiloxane (MHS) groups from thecrosslinker. This is because an excess of crosslinker is added in order to ensure acomplete crosslinking of the vinyl groups. One problem with the remainingMHS groups is that, in the method for the determination of the degradationproducts of the drug, ethynylestradiol was used as an internal standard. Usingnewly cured elastomers, we found a significant loss of the internal standard

69
during these analyses, and this led to errors in the results for the degradationproducts. This phenomenon was not observed on samples which had been storedfor more than one month at room temperature. We presume that the internalstandard loss was due to a reaction between the MHS group and the unsaturatedaliphatic group in the internal standard. As this loss of internal standard was notfound in stored samples, we believe that the MHS groups are decomposedduring storage.
The post-curing reactions which change the mechanical properties of theelastomer are probably such that they will increase the crosslink density. Thehydrogen bond between the filler and the polymer may also affect themechanical properties of the elastomer. Only a few papers have been publisheddiscussing the chemical reactions causing the post-curing of silicone elastomersmade from hydrosilanisation. Reactions between residual vinyl and MHS groupstogether with the reaction between silanols and MHS both increase the crosslinkdensity (Ref. 103). Another post-curing reaction is the decomposition of MHS.This reaction will however, not change the crosslink density, it will only convertthe silicone hydride into a silanol group. It has been found that this reaction doesnot occur if the elastomer is aged in dry nitrogen. No studies were made toascertain whether it was oxidation or hydrolysis that was the major cause of thedecomposition of the MHS groups (Ref. 95).
Sample preparation
The pre-elastomers were thoroughly mixed in equal weight portions(approximately 50 g of each part) in the pilot two-roll mixer. The homogeneousmaterial was then put into a stainless steel mould and cured into silicone slabs of10 cm x 10 cm with a thickness of 0.6 cm. These slab samples were cured on aheat press Polystat 200 S (Schwabenthan Maschinen, Gbmh&Co KG, Berlin,Germany) with the sample placed in a mould between two preheated Teflonizedsteel plates at 120 °C for 90 seconds. Immediately after curing in the mould, theslabs (silicone elastomer) were placed in a desiccator containing the dryingagent Siccapent (phosphorus pentoxide). The desiccator was finally flushed withnitrogen to give an inert and dry atmosphere to prevent post-curing. Aftercooling at room temperature for two hours, the slabs were cut into pieces,approximately 2 cm x 2 cm, and each piece was transferred to a gas-tightaluminium pouch. A factorial design of the different storage conditions wasestablished with a combination of atmosphere (nitrogen or oxygen), humidity (0and 100%), temperature (20 and 40 °C) and storage time (1 and 14 days). This

70
design resulted in 16 different samples. A small amount of water (1 ml) wasadded to half the samples and they were flushed either with oxygen or nitrogenbefore sealing. The pouches were then stored at 20 °C and 40 °C for 1 and 14days, respectively, before the analytical measurements were carried out.
3.3.1 Analyses of residual MHS by NMR and IR
1H-NMR spectroscopy was used to determine the residual amounts of vinyl andhydride groups. A small plug with a diameter of 3 mm was cut from the storedsilicone elastomer sample with the use of a hole puncher. The sample plug wasinserted into a 5 mm NMR tube containing 0.6 ml of deuterated chloroform,where it was allowed to swell for two hours. The 1H-NMR spectrum wasrecorded on a Bruker Avance DRX 500 MHz spectrometer at 30 °C with thefollowing instrumental settings: sweep width 20.5 ppm, carrier frequency 4.0ppm and number of scans 1500. As reference for quantification of the MHSamount in the sample, the integrated methyl signal at 0.3 ppm was set to 10 000.Integral regions were 4.4 to 5.0 ppm for the MHS signal and –1.9 to 2.6 ppm forthe methyl signal.
The NMR spectrum of the cured sample No. 1 stored for one day in dry oxygen(Fig. 56), shows that no detectable signals of vinyl groups were found in theregion from 5.7 to 6.2 ppm in the sample. The same observation was made forthe other seven cured and stored samples. This indicates that the primarycrosslinking reaction (Fig 55), the platinum-catalysed hydrosilanization betweenvinyl and hydride groups was complete.
≡ Si – H + H2C = CH – Si ≡ Pt
≡ Si – CH2 – CH2 – Si ≡
Figure 55 The hydrosilylation reaction
Sample No. 1 was also found to have the highest relative amount of MHSremaining in the sample. Table 11 summarises the residual amounts of MHSfound by NMR.

71
Figure 56 1H-NMR spectrum of the crosslinked sample No 1, stored for 1 dayin dry oxygen at 20 °C showing the signal from the residual MHSgroup (≡Si-H) and the reference peak from the methyl group
Chloroform gives a signal at 7 ppm while the signals between 1 and 2 ppm inthe NMR spectra are probably due to the presence of silanol groups and/orwater. Furthermore, the ethylene group formed in the hydrosilanization reactionshould be seen in the region around 2 ppm. Identification and quantification ofthis ethylene group would be a direct measurement of the primary crosslinkingdensity. However, we have not further investigated this possibility in this work.
Infrared spectroscopy was used to measure the amount of MHS in the samples.The intensive absorption band around 2160 cm-1 was used for this purpose. Theovertone absorption band at 2500 cm-1 from the methylsiloxane group was usedas an internal reference band. A small 0.5 mm-thick slice was cut from thesample with a scalpel and mounted in the sample holder. The transmissioninfrared spectrum was recorded on a Nicolet Magna 560 with a resolution of 4cm-1 between 1500 and 3300 cm-1. The absorption ratio A2160/A2500 wasevaluated as a measure of the amount of residual MHS in the silicone elastomersamples.

72
A standard curve was set up for this method, in order to enable the absoluteamounts of MHS residue in the samples to be calculated, in contrast to 1H-NMRwhere only the relative amount was measured. Homogeneous solutions withknown concentrations of the MHS standard polymer were prepared in a siliconeoil standard in the concentration range from 0.1 to 1 mole-% MHS.Transmission spectra of these standard solutions were recorded using a fluidmeasuring cell. The absorbances of the two bands were then measured and acalibration curve, A2160/A2500 versus content of MHS, was created.
The IR spectra evaluations of the stored samples were primarily used forquantification of the MHS group.
Figure 57 IR spectrum of the crosslinked sample No 1, i.e. the sample storedfor one day in dry oxygen, showing the MHS band atapproximately 2160 cm-1 and the reference band from the polymerbackbone at 2500 cm-1
As i evident in figure 57, the MHS group has an absorption band at approxi-mately 2160 cm-1. As an internal reference for quantification, the band at 2500cm-1 was used. This absorption band is an overtone band of the symmetricdeformation of the silicon-bonded methyl group found at 1260 cm-1. Thisovertone band has been described as being suitable for measurements on thick

73
samples due to its low absorptivity (Ref. 103). From the calibration data, it wasfound that the amount of MHS in the sample was equal to 0.307 * A2160/A2500expressed as mole-%. As the MHS content measured with IR did not reach zerofor samples Nos. 4 and 8, as in the NMR measurements, the selectivity of the IRmethod was examined. The stored sample with the lowest MHS content, i.e.sample No. 8, was heated at 150 °C for four hours in a heating chamber in orderto decompose all the MHS groups. After cooling to room temperature, a newinfrared spectrum was recorded and the relative amount of MHS was found tobe below 0.01 mole-%. This experiment shows that the absorption at 2160 cm-1
is highly selective for MHS in the analysed silicone elastomer. Data for residualMHS found in the samples from the factorial experiment measured by IR aregiven in Table 11.
In the IR measurements, small pieces 0.5 mm thick were cut from the surface ofthe samples. As the samples were 6 mm thick it was possible that aninhomogeneity could arise in the MHS content, i.e. the decomposition could befaster in the surface than within the sample. A study was therefore carried out toinvestigate this possibility. One of the samples was cut into two parts with ascalpel, giving a fresh surface for analysis. This new surface was immediatelyanalysed with respect to MHS content at different positions, from the top to thebottom of the sample. The measurements were performed with the IR instrumentequipped with an IR-microscopic SpectraTech Model 40. The rectangularsurface analysed had the dimensions 0.1 x 1 mm. Six IR spectra were takenevenly distributed over the sample. Table 10 shows the result of this study. Itcan be clearly seen that the MHS decomposition rate was uniform.
Table 10 Residue MHS distribution at different depths in the cured siliconesample measured by IR
Distancefrom top
surface (mm)
Amount of MHS(mole-%)
1 0.272 0.263 0.264 0.265 0.26
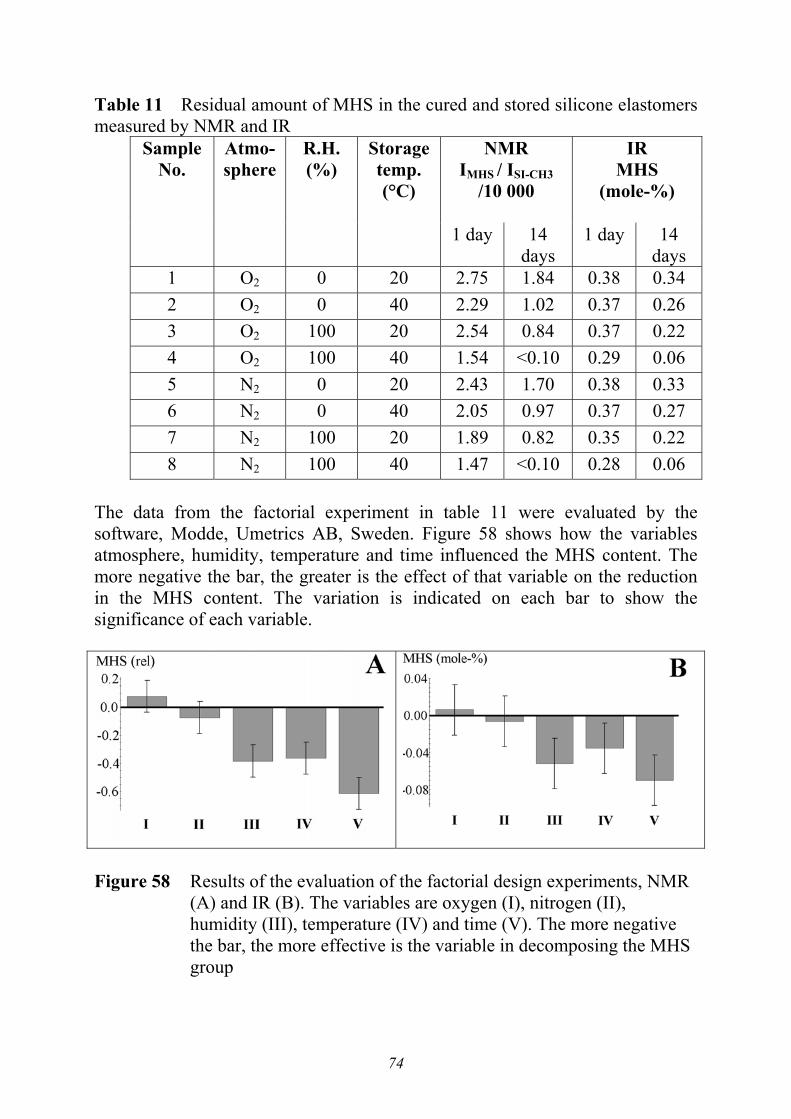
74
Table 11 Residual amount of MHS in the cured and stored silicone elastomersmeasured by NMR and IR
NMRIMHS / ISI-CH3
/10 000
IRMHS
(mole-%)
SampleNo.
Atmo-sphere
R.H.(%)
Storagetemp.(°C)
1 day 14days
1 day 14days
1 O2 0 20 2.75 1.84 0.38 0.342 O2 0 40 2.29 1.02 0.37 0.263 O2 100 20 2.54 0.84 0.37 0.224 O2 100 40 1.54 <0.10 0.29 0.065 N2 0 20 2.43 1.70 0.38 0.336 N2 0 40 2.05 0.97 0.37 0.277 N2 100 20 1.89 0.82 0.35 0.228 N2 100 40 1.47 <0.10 0.28 0.06
The data from the factorial experiment in table 11 were evaluated by thesoftware, Modde, Umetrics AB, Sweden. Figure 58 shows how the variablesatmosphere, humidity, temperature and time influenced the MHS content. Themore negative the bar, the greater is the effect of that variable on the reductionin the MHS content. The variation is indicated on each bar to show thesignificance of each variable.
Figure 58 Results of the evaluation of the factorial design experiments, NMR(A) and IR (B). The variables are oxygen (I), nitrogen (II),humidity (III), temperature (IV) and time (V). The more negativethe bar, the more effective is the variable in decomposing the MHSgroup

75
Both the NMR and the IR results clearly show that the gas environment(nitrogen or oxygen), around the silicone samples during storage had no effecton the MHS content. On the other hand, the humidity and, of course, thetemperature and time had a significant impact on the rate of decomposition ofthe MHS groups in the samples. This finding indicates that the MHS groupsmainly undergo a hydrolysis reaction (Fig. 59) where the silicon-bondedhydrogen is hydrolysed into a silanol according to the reaction:
≡ Si – H + H2O Pt
≡ Si – OH + H2
Figure 59 Hydrolysis of the hydride group catalysed by platinum
This reaction has to be catalysed by platinum, as the crosslinker in the uncuredPart B material, containing the crosslinker with MHS groups, is stable for wellover one year at room temperature. The oxidation of the MHS groups in thecured material seems to occur at a very slow rate compared to the hydrolysisreaction. The small decrease in MHS content found between the two measuringoccasions, 1 and 14 days, for the samples stored in dry conditions in bothoxygen and nitrogen are probably due to hydrolysis with the small amount ofwater remaining in the sample after curing. This water is probably both adsorbedon the surface of the silica filler and dissolved in the silicone polymer network.The water content in the newly cured samples was estimated to be about 0.05%by thermal desorption at 150 °C in combination with Karl Fischer coulometrictitration.
3.3.2 Controlled elimination of MHS
A separate study was performed in order to investigate the rate of MHSdecomposition on elastomers stored at various temperatures and humidities. Aset of silicone elastomer slabs was prepared according to the method describedearlier. The samples were stored under various conditions, which may berelevant to silicone elastomer drug release products. In our case, the maximumstorage temperature for the product was estimated to be 40 °C in order to avoidany degradation of the incorporated drug. Exposure to various humidity levelswas achieved by storing the samples in desiccators filled with either saturatedMg(NO3) giving 56% R.H. at 22 °C and 48% R.H. at 40 °C or saturated NaCl at40 °C giving a relative humidity of 75% (Ref. 102). A higher humidity is notrecommended due to the risk of microbiological growth. The MHS content wasmeasured by the IR method described above. Figure 60 shows the MHS contentas a function of the storage time under the various conditions.

76
0
0,1
0,2
0,3
0,4
0 4 8 12 16Storage time (days)
MH
S co
nten
t (m
ole-
%)
Figure 60 MHS content measured by IR versus time, showing the decom-position rates in different environments; 22 °C / 56% R.H. (∆),40 °C / 48% R.H (Ο) and 40 °C / 75% R.H. ( )
We found that the best procedure to eliminate the MHS groups in the elastomerwas to store the products at 40 °C and a relative humidity of 75%. Using thisprocedure, the MHS groups were practically gone after a few weeks.
3.3.3 Factors affecting the mechanical properties
The Shore A hardness was measured with a digital hardness instrument, ShoreDurotronic 1000 with an automatic stand, series 900. The hardness of the 6 mm-thick sample was measured one second after application of the measuringsensor. Six measurements were performed on each individual sample slab andthe mean hardness value was reported.

77
The storage compression modulus (E’) was measured at room temperature in airwith a Dynamic Mechanical Analyser (DMTA), Netzsch DMTA 242. Acylindrical piece with a diameter of 12 mm was cut from the sample with a holepuncher. This cylindrical test piece was then mounted in the compressionsample holder. The frequency was set to 1 Hz, the dynamic force was 4.0 N andthe static applied force was 4.8 N. The maximum amplitude was set to be 60µm. A flat probe with a diameter of 15 mm was applied to the sample before theforce was applied.
The results of the mechanical analysis of the stored samples in the factorialexperiment, hardness and compression storage modulus are shown in table 12.Figure 61 shows the mathematical evaluation of these data.
Table 12 Mechanical properties of cured and stored silicone elastomers
Hardness Shore A
Compressionstorage modulus
(MPa)
SampleNo.
Atmos-phere
R.H.(%)
Storagetemp.(°C)
1 day 14 days 1 day 14 days
1 O2 0 20 38.5 40.1 2.9 2.62 O2 0 40 39.3 41.7 3.3 2.73 O2 100 20 38.4 40.4 3.3 2.64 O2 100 40 39.8 44.3 2.8 3.05 N2 0 20 38.5 41.0 2.9 3.16 N2 0 40 39.2 42.4 2.5 3.37 N2 100 20 38.5 41.1 2.9 3.08 N2 100 40 40.0 47.0 2.6 3.4

78
Figure 61 Result from the evaluation of the factorial experiments, Shore Ahardness (C) and compression storage modulus (D). The variablesare oxygen (I), nitrogen (II), humidity (III), temperature (IV) andtime (V). The more positive the bar, the more effective is thevariable in increasing the post-curing
Only temperature and time seem to have any significant influence on thehardness. There is a tendency for the humidity to be of importance, although thiseffect is not statistically significant. The choice of gas environment has nosignificant effect on the hardness development. On the contrary, the storageconditions seem to have no significant influence on the compression modulus. Apossible explanation to this result is that the method variation was too large toresolve the different effects.
However, the increase in hardness indicates that the crosslinking densityincreases during storage. There is a possibility that the primary curing reactionbetween vinyl and hydride groups was not totally complete during themanufacture of the samples. During the subsequent storage, this reactioncontinues. Another possible chemical reaction explaining the change in hardnessis the addition between MHS and silanol groups shown in figure 62 (Ref. 96).The silanol groups can be present in the pre-elastomers before curing but theyare also formed during the post-curing reaction when MHS is decomposed withwater according to the hydrolysis reaction:
≡ Si – H + HO – Si ≡ Pt
≡ Si – O – Si ≡ + H2
Figure 62 Platinum-catalysed reaction between the hydride group and asilanol group

79
This reaction would also increase the degree of crosslinking in the elastomer, asin the case of the hydrosilanisation reaction, and consequently increase thehardness and modulus.
3.3.4 Post-curing by thermal treatment
In stability studies on the drug delivery silicone elastomer, it was found that thehardness increased with time. The normal conditions in drug stability studies arestorage at room temperature for at least the time of the product shelf life. 40 °Cis normally used for accelerated studies over 6 months. In order to find theasymptote value for the hardness after total post-curing, we performed a studywhere we stored the samples in different temperatures and measured theShore A hardness on different occasions.
The silicone elastomer slabs were prepared as described above. The sampleswere stored at different controlled temperatures at ambient humidity for oneweek. The results of the Shore A hardness development are shown in figure 63.
36
40
44
48
52
56
0 40 80 120 160Storage time (hours)
Shor
e A
har
dnes
s -20°C
7°C
21°C
30°C
37°C
60°C
90°C
105°C
Figure 63 Hardness development on newly cured silicone samples versusstorage time at different temperatures
The post-curing conditions at 90 and 105 °C seem to give a plateau value of thehardness for the elastomers, with a hardness value of approximately 53. The

80
hardness had increased as much as 40% from the initial value after curing. Thesamples stored at lower temperatures also showed an increase in hardness, butthis was less pronounced for the cold stored samples. They did not, however,reach any steady-state value during this rather short time of investigation.
The change in compression modulus as a result of the treatment at hightemperatures was also measured. In this study, the samples from the factorialexperiment were taken, i.e. the post-curing had proceeded differently for thedifferent samples. The storage compression modulus was monitored by theDMTA instrument in the temperature-scanning mode. The samples were heatedfrom room temperature up to 250 °C with a heating rate of 2 °C/min. The purgenitrogen gas flow rate was set to 200 mL/min. A cylindrical piece with adiameter of 12 mm was cut from the sample with the aid of a hole punch. Thiscylindrical test piece was then mounted in the compression sample holder. Thefrequency was set to 1 Hz, the dynamic force was 4.0 N and the static appliedforce was 4.8 N. The maximum amplitude was set to be 60 µm. A flat probewith a diameter of 15 mm was applied to the sample before the force wasapplied.
The DMTA thermogram for sample No 1 (Fig. 64) shows a rather large increaseof approximately 80% in the modulus during the heat treatment. A plateau valueis nearly reached in the temperature interval between 200 and 250 °C. When thetemperature was increased even more, it was found that the modulus decreasedas the elastomer started to degrade.
Figure 64 DMTA thermogram of sample No 1, storage compression modulus(E’) versus temperature. A strong increase in E’ at highertemperatures indicates a significant increase in crosslink density

81
All thermograms had the same shape, but the increase in modulus varied amongthe samples. Samples Nos. 4 and 8 measured after 14 days also showed anincrease in modulus. Although these two samples contained no measurableamount of MHS, the modulus increased by approximately 10%. Thisobservation, together with the observation that the hardness of samples Nos. 4and 8 was far from the end value of 53 Shore A, indicates that yet anothercrosslinking reaction occurred. One possible chemical reaction that may occur inthe high temperature region is the condensation reaction between two silanolgroups in different polymer chains (Fig 65):
≡ Si – OH + HO – Si ≡ → ≡ Si – O – Si ≡ + H2O
Figure 65 Condesation reaction between two silanol groups
3.3.5 Conclusions from analyses during curing; post-curing
In our study of a drug delivery silicone elastomer, our main interest was todevelop a procedure to decompose the remaining methyl silicone hydride groups(MHS) in the crosslinker in a fast and controlled procedure. Using NMR and IR,we found that temperature and relative humidity are the main parametersinfluencing this reaction. Due to the poor thermal stability of the incorporateddrug, it was not an option to use temperatures higher than 40 °C to increase thesilicone hydride decomposition rate. However, by storing the product in acontrolled environment with a high relative humidity and at a reasonably lowtemperature this post-curing reaction can be controlled and is complete within acouple of weeks.
The decomposition of the silicone hydride with water has no direct effect on thecrosslink density, as silanol groups are formed. However, other chemicalreactions take place that increase the crosslinking density and thereby changethe mechanical properties of the elastomer. Traces of residual vinyl groups reactwith the silicone hydride (primary crosslinking reaction) (i), the silanol groupsformed from the decomposition of the MHS groups also react with siliconehydride groups (ii) and at higher temperatures, condensation between silanolgroups may occur (iii). All these chemical reactions are probably active in thepost-curing of the silicone elastomer.

82
4. ANALYSIS OF THE CURED ELASTOMER
Preparation of cured slabs
The two parts of the pre-elastomer, Part A and Part B, were thoroughly mixed inequal weight portions (approximately 50 g of each part), in a two-roll mixer(Polymix 150 L/O, Schwabenthan Maschinen Gbmh&Co KG Berlin, Germany),in order to produce a homogeneous material. The mixer rolls were continuouslyinternally cooled with tap water in order to prevent pre-curing. The gap betweenthe rolls was 1.0 mm and the rotation speed was 10 rpm and equal for both rolls,i.e. no friction was applied. The actual mixing was achieved by removing thesheet of silicone material that was removed from the mixer, rolling it into theshape of a cylinder, and then again feeding it onto the mixer rolls. Thisprocedure was repeated ten times. The homogeneous material was then put intoa stainless steel mould and cured into silicone slabs of 10 cm x 10 cm withthicknesses of 1 and 6 mm. The slabs were cured on a heated press, Polystat 200S (Schwabenthan Maschinen, Gbmh&Co KG, Berlin, Germany) with the sampleplaced in a mould between two preheated Teflonised steel plates at 116 °C for10 minutes.
4.1 HARDNESS
The hardness is basically dependent on the filler content and crosslink density.The Shore A Durometer hardness of the elastomer was measured according tothe ASTM standard D 2240. The instrument was a digital Durotronic 1000Shore A with an automatic stand model 902, both from Shore InstrumentsComp. The 6 mm thick sample was stored at room temperature and themeasurement was made within 24 to 48 hours after sample preparation, due tothe increase in hardness with time caused by post-curing.
Prior to each test occasion, a system suitability test was performed to verifycorrect reading. The display was first checked to read zero without sampleapplication. The measuring unit was then carefully lowered towards theweighing pan of a balance so that a hardness value of approximately 35 wasreached. The apparent mass was read and the hardness was calculated accordingto equation [2].

83
Shore A hardness = ( )075.0
550.081.9 −×m [2]
where m is the apparent mass in kg
The number of samples taken for testing dependend on the batch size. Normallybetween eight and twelve samples were taken from each batch. The averagevalue of the Shore A hardness of the tested batches was 37.6 with a standarddeviation of 1.2. Figure 66 shows how the hardness varied over different batchesdelivered between 1993 and 1997.
30
35
40
45
0 10 20 30
Batch
Har
dnes
s Sh
ore
A
Figure 66 Shore A hardness of Silastic® Q7-4735, mean value of differentbatches

84
4.2 SWELL INDEX
The swell index is a test to indirectly measure the crosslink density of anelastomer. The sample is immersed in a good solvent and after equilibrium theincrease in mass is determined. In order to gain knowledge about how differentsolvents affected the degree and rate of swelling, we measured the increase inheight of a silicone elastomer sheet by thermomechanical analysis (TMA). Weused the analyser TMA 40 from Mettler AG with the standard rod and a glasscrucible with lid (Fig. 67).
Figure 67 Drawing of the glass crucible for measuring the swelling of thesilicone elastomer in different solvents. The hole on top is used forthe probe of the TMA instrument
Round sample disks, 2 mm in diameter, were punched from the 1 mm-thicksheets and then placed in the cup. A quartz glass disk was put on top, coveringthe whole disk. The TMA rod was applied on the disk and the dynamicmeasurement started with an alternating force between 0.07 and 0.13 N at 1 Hz.After one minute, the solvent was poured into the crusible. All swellingexperiments were carried out at room temperature. Figure 68 shows thatchloroform and hexane have the greatest swelling effect on the elastomer.

85
Figure 68 Swelling of the silicone elastomer using TMA withdifferent solvents
However, as the final method is gravimetric, the volatility of the solvent has tobe considered in order to achieve a robust method where the balance readingshould be as stable as possible. A good guidance for this selection is to comparethe boiling points of the different solvents (Tab 13).
Table 13 Boiling points of different solvents for silicone
Solvent b.p. (°C)Chloroform 62Hexane 692-Propanol 83Ethyl acetate 99Toluene 111
Toluene was chosen as solvent for the swelling tests as it has a rather highboiling point and is a good swelling solvent for the silicone elastomer.

86
In the finalised method, a disk 10 mm in diameter was punched from the 6 mm-thick cured sheet. The disk was weighed and then put in a 50 mL E-flask and 30mL toluene was added. After approximately 48 hours, the disk was removedfrom the solvent and put on a paper tissue and carefully dried. The disk wasagain weighed, but this time the disk was placed in a weighing pan with a lid, inorder to prevent solvent evaporation. The swell index was calculated as the ratioof the solvent weight to the weight of the non-swollen sample.
The results for 21 different batches are shown in figure 69. The averagecrosslink density was 322 g/g and the relative standard deviation was only 1%.
300
310
320
330
340
0 5 10 15 20 25 30
Batch
Swel
l Ind
ex
Figure 69 Swell Index in toluene for 21 different batches

87
4.3 PHARMACOPOEIA TESTS
4.3.1 European Pharmacopoeia, Ph. Eur.
For regulatory purposes, it is important that the materials used for drug deliveryfulfil the requirements of the different Pharmacopoeiae. There is no monographin the European Pharmacopoeia describing silicone elastomers for drug deliveryor for use as implants. The most relevant chapter is ‘SILICONE ELASTOMERSFOR CLOSURES AND TUBING’. The Silastic® Q7-4735 material complieswith the description of this material. The following tests should be performed inorder to verify that the elastomer fulfils the requirements for identity tests andseveral purity tests:
o Identity; IR, reaction with chromotropic acid and test for silicao Water extract; Appearance of solution, Acidity or alkalinity and Reducing
substanceso Relative densityo Substances soluble in hexane o Volatile mattero Phenylated compoundso Mineral oilso Platinum
The identification is made by three different methods. The first method isinfrared reflection spectroscopy, the same method as was described above forthe pre-elastomer. The IR spectrum for the sample should be equal to thespectrum obtained with a chemical reference standard CRS obtained from theEuropean Pharmacopoeia. In the second method, the sample is heated in a testtube and the subsequent reaction with chromotropic acid should result in a violetsolution. In the third method, the sample is combusted and the residue shouldgive a positive reaction for silicate.
An aqueous extract is made by boiling 25 gram of elastomer under reflux in 500mL of water for 5 hours. As a reference, a blank solution should be prepared inparallel. The aqueous extract is then tested for clarity and it should be as clear asa dilute solution of hydrazine sulphate which gives a very slight opalescence.The water extract is then tested for acidity and alkalinity. For 100 mL of extract,less than 25 µmol sodium hydroxide (to pH = 7.6) or 10 µmol hydrochloric acid(to pH = 4.4) is required for neutralisation. The third test on the aqueous extractis a test for reducing substances. The substances in the extract that can beoxidized by the permanganate ion are determined. 20 mL of the extract isreacted with an excess of potassium permanganate in an acidic solution for 15

88
minutes at room temperature. The remaining potassium permanganate convertsiodide into iodine, which is quantified by titration with 0.01 M potassiumthiosulphate using starch as indicator. The difference in volume of potassiumthiosulphate between the sample and blank should not be greater than 1.0 mL. Amore relevant method to determine the amount of organic compounds in thewater extract would be a TOC, Total Organic Carbon, assessment. TOCmeasurement is increasingly beeing accepted as an excellent overall method forthe control of water quality. The principle of the TOC method is that inorganiccarbon is removed by acidification and purging. The organic carbon is thenoxidised into CO2 by treating the sample with the strongly oxidising persulphateion (S2O8
2-) in combination with UV irradiation. The carbon dioxide formed isthen quantified by infrared spectroscopy, using a gas cell.
The relative density of a solid sample can be determined either with a gradientcolumn or, as in the case of the European Pharmacopoeia, by using apycnometer. Ethanol is used as immersion solvent in order to achieve goodwetting to avoid the risk of adsorbed air bubbles on the sample surface.
“Substances soluble in hexane” is a test used to quantify the non-bonded siliconepresent in the elastomer. A 2.0 gram sample is boiled in 100 mL n-hexane for 4hours using a reflux condenser. After cooling the solution is filtered through aglass filter to remove particles. A 25 mL portion is transferred into a weighedglass evaporating dish or beaker, which is placed on a boiling water bath toevaporate the solvent. The residue is then dried in a heating chamber at 100 –105 °C for 1 hour. The hexane-soluble substances should not be more than 3%.
In the test for volatile matter, a 10 gram sample piece is weighed and placed inan oven at 200 °C for 4 hours. After cooling, the sample piece is re-weighed.The volatile matter should be less than 2.0%. This is a test to determine the non-bonded low molecular mass silicones in the elastomer.
Extractable phenylated compounds are measured in the same solution as wasprepared for the determination of hexane-soluble substances. The UV lightabsorbance between 250 and 340 nm should be less than 0.4.
Mineral oils are determined on a 100 mL pyridine-ammonia (95-5) extract of a 2g sample, extracted at room temperature for 2 hours. The fluorescence from thesolution irradiated at 365 nm should be less than the fluorescence from a 1 ppmquinine sulphate solution
Finally, a limit test for platinum is performed. The sample is combusted and theresidue is treated with different acids e.g. to remove the silicon dioxide. The

89
final residue and a standard solution are then treated with an acidic solution ofstannous chloride. The colour of the sample solution should not be more intensethan the colour of the standard solution, which corresponds to 30 ppm of Pt.
All identity and purity tests of the Silastic® Q7-4735 conformed to therequirements of the European pharmacopoeia.
4.3.2 United States Pharmacopoeia, USP
There is no monograph in USP for silicone elastomer at all. The closestapplicable chapter is chapter <661> Container, Physico-Chemical tests, Plastics.The sample is extracted in water at 70 °C for 72 hours and the water extract isanalysed with respect to:
o Non-volatile residueo Residue on ignitiono Heavy metalso Buffering capacity
Using the 6 mm thick elastomer slabs, a total sample area of 1200 cm2 wasextracted with 200 ml water. 100 ml of the water extract was then transferred toa fused silica crucible and placed on a steam bath for evaporation. The cruciblewas then placed in an oven at 105 °C for one hour. The maximum allowedweight of the residue was 15 mg. The same crucible was then put in an oven at800 °C for complete combustion. A residue of not more than 5 mg was allowed.In the test for heavy metals, the extract was treated with a slightly acidicsolution of sodium sulphide. Some metal ions give rise to a dark colour if theyare present in relatively low concentrations. 1 ppm of a lead ion solution wasused as reference. In the present edition of USP, sodium sulphide has beenreplaced with thioacetamide to complex the metal ions present in the extract. Inthe final test, buffering capacity, 20 ml of the aqueous extract is titrated to pH7.0 with either sodium hydroxide or hydrochloric acid. Not more than 100 µmolof either HCl or NaOH is allowed.
All purity tests of the Silastic® Q7-4735 conformed to the requirements of theUS Pharmacopoeia.

90
4.4 SOLUBILITY OF THE DRUG
It was mentioned in the introduction that the initial drug release rate from theintra-vaginal ring (IVR) was quite high and that after a few days, the ring beganto release the drug at a constant rate. For Estring® this rate is approximately 8µg/day for the three months of use. The reason for this so-called burst effect isthat the diffusion layer becomes saturated with drug during manufacturing andstorage and this is washed out in the beginning of use. It has been found that theamount of silica filler has an effect on drug solubility (Refs. 104-105). Inaddition, we found that, if the curing time was increased, the burst became veryhigh indicating an over-saturation of drug in the sheath material of the IVR. Wetherefore had to cure the silicone material as fast as was practically possible. Inorder to better understand the burst effect, we decided to measure the solubilityof the drug in the silicone matrix under various conditions.
The silicone pre-elastomers were mixed and part of the material was cured at120 °C for 90 seconds in a pre-heated aluminium mould giving a membranethickness of approximately 0.5 mm. Estradiol was mixed in a second part andcured in the same way giving an estradiol content of 0.3%. The differentmembranes were then stacked with three unloaded membranes in the middlesurrounded by two loaded membranes. Under slight pressure, to ensure fullcontact between the membranes, diffusion of estradiol from the loaded into theunloaded membranes was allowed to proceed at room temperature. In addition,the membrane stacks were stored under 0, 57 and 97% relative humidity.
The estradiol content in the inner membrane was then determined.Approximately 500 mg of the membrane was extracted overnight with 10 mLmethanol containing 2 µg/mL estrone as an internal standard. The extract wasthen transferred into another vial and the solvent was completely evaporated.The residue was dissolved in 1 mL of mobile phase and was analysed with areversed phase liquid chromatography system. A Superspher® 100 RP 184.0x120 mm column from Merck, Germany, was used to separate estradiol fromthe internal standard, estrone. The flow rate was 1 mL/min using a mobile phaseconsisting of 40% acetonitrile, 5% methanol and 55% water. The injectionvolume was 100 µL and detection was achieved with a UV detector at 280 nm.
It was found that the solubility of the estradiol was strongly dependent on theambient relative humidity. Figure 70 shows that the dry conditions give a veryhigh estradiol content.

91
0
50
10 0
150
0 10 2 0 3 0
Equilibrium time (days)
0 % R H 5 7 % R H 9 7 % R H
Figure 70 Content of estradiol versus time of equilibration at the siliconeelastomer in different humidities
As stated above, the solubility of the drugs was also dependent on the amount ofsilica filler. At 60% relative humidity the solubility of estradiol in Silastic® Q7-4735 was 21 µg/g and in Silastic® Q7-4765 52 µg/g. The silica contents were 21and 37%, respectively, measured by thermogravimetric analysis. We alsoanalysed the sheath material for estradiol in the finished product and found inprinciple the same results. In addition, we measured the drug release during thefirst day in an in-vitro dissolution test. The higher the humidity during storageafter manufacturing, the lower was the release. As a consequence, we realisedthat the primary packaging for Estring® had to be completely gas tight to keepthe moisture level constant during the shelf life.
The more silica the higher is the drug solubility, and the higher the humidity thelower is the drug solubility. From these observations, a model was constructedwhere estradiol and water are in equilibrium in the hydrogen bonding of thesilicone filler to the silica surface (Fig. 71). If the water concentration in thematerial is reduced, it becomes possible for estradiol to adsorb to the surface.Unfortunately, we did not perform any test to examine the solubility of estradiolin the material without silica filler. With this information, it would have beenpossible to see the importance of the filler content and of the amount of residualinorganic silanol groups.

92
.
Figure 71 Possible interactions between silanol groups on the silica surfaceand water and estradiol

93
4.5 CONCLUSIONS FROM THE ANALYSIS OF THECURED ELASTOMER
The cured elastomers have been tested with the standard method for hardness.The main purpose of this measurement is to control that the elastomer has theright amount of filler. To verify that the Durometer instrument works properlyprior to the hardness measurements a system suitability test has been introduced.The degree of swelling was determined to check that the crosslink density wasconsistent.
The material was also tested according to both the European and the USpharmacopoeiae, to verify that the material met the identity and purity demands.
A method was developed to measure the solubility of estradiol in the elastomer.Using this method, we found that both humidity and filler content had a greatinfluence on the solubility of this drug. The practical conclusion drawn from thisfinding is that the newly produced IVR should be stored in humidifiedconditions prior to packaging. It is also important that the package itself iscompletely moisture tight. Otherwise, the IVR may dry out during storage overthe shelf life of the products, and as a consequence the initial drug release maybe unacceptably high.
5. ANALYSIS DURING APPLICATION
5.1 CHARACTERISATION OF HEXANE EXTRACTABLES
In the extraction tests with hexane according to the European Pharmacopoeia(Ref. 106) we found approximately 3% extractables. This amount is the limitgiven in the pharmacopoeia. As these non-bonded materials are potentiallymigrants, i.e. in the in-vivo situation they could be absorbed by the patient, wefound it important to characterise these extractables more thoroughly.
Using 6 mm thick elastomers slabs from five different batches, we cut samplepieces with dimensions of 1 x 1 cm. Three pieces were weighed, approximately2 .0 grams, into a 250 mL conical flask. 100 mL hexane was added and theextraction was performed under reflux on a boiling water bath for 4.0 hours. Thesolution was cooled to room temperature and then filtered through a glass filter(No 4). 25 mL of the extract was transferred to a pre-weighed evaporation dishand put on a boiling water bath until all the solvent had evaporated. The dishwas then placed in an oven at 105 °C for 4.0 hours. After equilibration at room

94
temperature, the dish was weighed again giving the average extractable amountof 3.3%, and the range for the five batches was 3.1-3.4%.
The residue was then characterised by several different techniques. The identityof the extract was determined by both IR and 1H-NMR. For the IR measurement,a few milligrams of the extract were placed between two KBr disks and thetransmission spectrum was recorded between 4000 and 400 cm-1. For the 1H-NMR measurement, approximately 15 mg of the extract was dissolved in 1 mLCDCl3 followed by complete evaporation under nitrogen at room temperature inorder completely to remove traces of hexane. The residue was then dissolved in0.7 ml CDCl3 and the proton spectrum of the solution was recorded as describedabove (see 2.1.1). Both the IR and the 1H-NMR spectra show that the extract isidentical to polydimethylsiloxane (PDMS). No vinyl or hydride groups werefound in the extract. In the IR spectrum, a small broad absorption around 3400cm-1 was found which indicated the presence of organosilanols in the extract.
Size exclusion chromatography was used to determine the average masses andsize distribution of these polydimethylsiloxanes. Approximately 15 mg of theextract was dissolved in 5.0 mL toluene. The solution was analysed on a liquidchromatography system with two size separation columns (PLgel mixed-C, 300x 7.5 mm, Polymer Labs). Toluene was used as eluent with a flow rate of 1.0mL per minute and the detection was done with a refractive index detector. 50µL of the toluene extract solution was injected. A broad standardpolydimethylsiloxane was used to calibrate the columns. The average values forthe five batches were <Mm> equal to 9100 (8800 – 10200) and <Mn> was 1700(1300-1900), which is quite a broad distribution. The polydispersity of theextract was 5.4. The results indicate that the extract contains small oligomers upto short polymers.
Both the extract residue and the hexane-extract solution which had not beenevaporated were analysed with gas chromatography. A non-polar column wasused, DB-1 from J&W, 12 m x 0.22 mm, coated with stationary phase of 0.33µm polydimethylsiloxane. The injector temperature was 200 °C and the FIDdetector temperature was 300 °C. The oven was programmed to have an initialtemperature of 35 °C for 5 minutes and was then heated at 10 °C/min to 325 °Cand held there for 30 minutes. Approximately 15 mg of the extract residue wasdissolved in 5.0 mL toluene, i.e. the same solution that was used for the sizeexclusion analysis. In both cases, a small amount of n-decane was added as aninternal standard. One microlitre of sample solution was injected and a split ratioof 1:50 was used. All eluted peaks were quantified versus a calibration curveconstructed with different concentrations of decamethylcyclopentasiloxane (D5).

95
Figure 72 Chromatogram of the hexane extract, before solvent evaporation

96
Figure 73 Chromatogram of the hexane extract, after solvent evaporation,residue dissolved in toluene. Five times more concentrated than thehexane extract, internal standard added
It is obvious by looking at the chromatograms of the two solutions (Figs. 72 and73) that they differ regarding the presence of low molecular mass oligomers.This means that in the procedure to measure the amount of hexane-solubleextracts, some of the extractables are evaporated and will not be measured.Assuming a response in the detector for all eluting peaks equal to that for thestandard D5, the amount eluted from the GC column for the residue was 1.3%(1.1-1.4) and for the hexane extract 2.3% (2.1-2.5). The difference of onepercent should be added to the figure for what is extracted with hexane.Therefore, a more reliable figure for the amount of hexane extractables is 4%.Another conclusion that can be drawn is that with the GC method only 40% ofthe total extract is detected. The rest of the silicone material is trapped in the GCinjector and in the column. The latest eluting peak in the GC chromatograms isprobably a polydimethylsiloxane with 30 repeating units, corresponding to amolecular mass of approximately 2300. This assumption was drawn frominjections of standards of the cyclic oligomers D4, D5 and D6, assuming that theother subsequent peaks were oligomers of higher degree. With higher injectorand column temperatures, the amount of siloxanes detected by this GC methodwould have been slightly higher, but a large part of the extractables were stillnot detected.
In conclusion, the hexane extractables from the elastomer consisted mainly oflow molecular mass dimethylsiloxanes, probably a mixture of both linear andcyclic compounds. A minor part of the extract probably has a silanol function,although the only evidence for that statement is the slight infrared absorptionaround 3500 to 4000 cm-1. In addition, the method described in the EuropeanPharmacopoeia underestimates the amount of material that is extracted. Duringsolvent evaporation of the extract solution, a portion of the extractables is lostdue to low vapour pressure of the silicone material. The selection of solvent mayalso be important. A non-polar solvent like hexane will certainly not desorb allthe silicones that are adsorbed to the silica surface in the elastomer. Using asolvent for siloxane like tetrahydrofuran which is capable of breaking thesehydrogen bonds should result in a more accurate determination. Preliminarystudies in replacing hexane for tetrahydrofuran with the pharmacopoeia methodgave a quantity of extractables of about five percent.

97
5.2 MIGRATION INTO AQUEOUS SOLUTIONS
Using NMR spectroscopy it has been found that free silicone was present intissues surrounding the silicone implants (Refs. 107). Several methods aredescribed in the literature for determining silicone in low levels. Atomicabsorption spectroscopy after solvent extraction gives a high selectivity to thedetermination silicon and makes it possible to enrich the migrants in theextraction step (Refs. 108-109). An alternative method is to perform an acidicdigestion of the aqueous extract in the presence of an excess ofhexamethyldisiloxane followed by gas chromatography with mass spectrometry(Refs. 110-113). The advantage of this method is that migrants of differentfunctionality can be separated, while the major non-bondedpolydimethylsiloxane is converted into a single spicies. Liquid chromatography,both size exclusion chromatography and reversed phase chromatography, incombination with a sensitive detector like atomic emission spectroscopy (ICP)or mass spectroscopy has also been used successfully (Refs. 114-120). The mainadvantage of these methods is that no derivatisation of the different siliconemigrants is needed prior to the analysis.
Our approach to measure the potential migrants was first to perform theextraction to the aqueous solutions followed by an extraction combined with apre-concentration with a medium polar solvent. We finally applied differentmethods for quantification of the migrants, viz: silicon and platinum weredetermined by atomic emission spectroscopy, dimethylsiloxane oligomers werequantified by gas chromatography, and organosiloxane compounds wereconverted into ethoxysilane derivatives followed by gas chromatography(see 2.1.3).
In the first extraction step, we used 1 gram of the 6 mm-thick elastomer slabs.The sample was placed in a 50 mL flask, and 25 mL of saline solution (0.9%sodium chloride) was added. The screw caps were screwed on and the flaskswere placed in a heating chamber at 37 °C. The flasks were sampled after 1, 2and 3 months. In the clinical application the IVD should be removed andchanged for another ring after 3 months. From recovery studies during thedevelopment phase, it was found that we had to deactivate the surface of theglass flasks. The deactivation was done with a 5% solution ofhexamethylendisilazane dissolved in hexane at room temperature over night.Excess of reagent was thoroughly removed by several washing cycles withhexane. Polyethylene and Teflon flasks were also examined with poor recovery.Using the deactivation procedure for the glass flask we found recoveries in therange of 95-125% when a few milligrams of a dimethylsilicone oil were addedto the aqueous solution and the solution was stored it for three months. The

98
silicone slabs were removed and the water solution was extracted with 5 mL offreshly distilled methylisobutylketone (MIBK) for 30 minutes. An aliquote ofthe organic phase was collected for further analyses.
An external laboratory determined the content of silicon in the MIBK solutionsby atomic emission spectroscopy (ICP). The results for silicon were thenrecalculated as dimethylsiloxane, as it was assumed that no inorganic siliconwas extracted into MIBK. The migration results are shown in figure 74.Approximately 2 mg of dimethylsiloxane has leached out from the one gramelastomer piece in this static migration model after three months. This resultcorresponds to a migration of 0.2% of the total elastomer. However, calculatedas a part of the non-bonded silicone material, approximately 5% has migrated.
0
1
2
3
0 1 2 3
Extraction time (months)
Am
ount
of s
ilico
ne (m
g)
Figure 74 Migration of silicone compounds into a saline solution at 37 °Cover three months measured by ICP as Si
A complementary analysis was performed in order to determine the content ofvolatile compounds in the MIBK extract. The same gas chromatography methodwas used in this analysis as was used to characterise the hexane extract. Thedetection limit for the cyclic oligomer, D5, was 0.2 µg/mL. No peaks werefound, other than solvent peaks. To increase the sensitivity the FID detector wastherefore replaced by a mass selective detector (MS). The MS detector was used

99
in the single ion monitoring mode, set to detect the sum of two ions, m/z 71 and73. These two ions were found as fragments in all cyclic dimethylsiloxaneoligomers. Using this method, it was possible to detect 0.01 µg/mL D5. Runningthe MIBK extract again, we found detectable peaks corresponding to the cyclicoligomers D5 – D9. The total amount, calculated as D5 was 0.2 µg, i.e. only 0.1%of the total amount of water extractables.
Almost all the silicone found in the MIBK extract seemed to have a lowvolatility, as they do not elute from the GC column. This suggests that the water-extractable silicones are very polar. Another possible explanation is that thecomponents in the extract are thermo-labile and degrade in the GC injector andare not therefore seem. No further attempts have been made to resolve thisuncertainty. Liquid chromatography with mass spectrometry should be a modernsuitable technique to use.
5.3 CONCLUSIONS FROM ANALYSES DURING APPLICATION
The content of non-bonded silicone material in Silastic® Q7-4735 is at least 4%.The limit in the method prescribed in the European Pharmacopoeia is 3%, butthe elastomer nevertheless meets the requirements in the pharmacopoeia. Thereason for this is that the method does not measure the true amount of non-bonded material, as the low molecular mass extractables are lost by evaporationduring the drying phase of the analysis. In addition, the choice of extractingsolvent is rather strange. Hexane is known to be poor in desorbing semi-polarcompounds adsorbed to silica. A more suitable solvent for extracting the non-bonded silicones in the elastomer would be tetrahydrofuran.
The non-bonded material was identified as dimethylsiloxanes using NMR, IRand gas chromatography.
Migration from the elastomer into aqueous solutions showed very low levels ofdimethylsiloxanes measured by GC-MS, only 0.1% of the non-bonded material.On the other hand, the amount of organically bonded silicon measured byatomic emission spectroscopy was in the range of 5%, calculated with respect tothe non-bonded material. The identity of this migrant is probablydimethylsiloxanes with a high content of hydroxyl groups, possibly hydrolysedcrosslinker residues.

100
6. CONCLUSIONS
The modern pharmaceutical industry has to meet both economic and regulatoryrequirements. The production costs must be low, and at the same time, thequality has to be high to meet the regulatory requirements. For this reason it isimportant to have full control of the properties of the raw materials, and of theintermediate and final products. In this work we have focused on a siliconeelastomer used for controlled drug delivery. Several new analytical methodshave been developed to ensure the consistency and high quality of this siliconeelastomer. The analytical methods have been developed to meet the moderndemands for high selectivity, accuracy and precision.
The raw material used in this work, the two-part pre-elastomer Silastic® Q7-4735, is a complex mixture of both large and small polysiloxanes containingdifferent functionalities, silica reinforcing filler and low molecular weightcompounds as inhibitor and catalyst. New analytical methods have beendeveloped for the silicone material in different physical stages, from theincoming pre-elastomer raw material, over the curing, including unwanted pre-curing, and control of the post-curing to the analysis of the finished siliconeelastomer.
A whole battery of different techniques has been used. The results of theseanalytical methods have been used to improve the consistency of the rawmaterial. The manufacturing process has also been improved, leading to higherproduction yield and thus to a cost reduction. By gaining knowledge of thechemistry and behaviour of the silicone material, it was possible to maintain adialogue with the manufacturer of the pre-elastomer, Dow Corning, in order forthem to understand the improvements that had to be made in order to achieve aconsistent material of high quality. Moreover, the results were essential forimproving the manufacture of the drug delivery device, from mixing, extrusionand curing to control of the post-curing and finally the essential packaging intotight pouches.
NMR, infrared and mass spectroscopy were the most useful spectroscopictechniques. These spectroscopic techniques were used not only foridentification. Their main application was as quantitative analytical techniques.The contents of vinyl and hydride groups in the pre-elastomer, both groupsactive in the crosslinking of the silicone material, could be measuredsimultaneously with 1H NMR. The same groups could also be semi-quantified inthe cured elastomer, used for the post-curing studies. Among silicone chemists,29Si NMR is used frequently. However, due to the relatively low sensitivity

101
compared to 1H NMR and the low content of the functional groups we found noapplication of this technique for this elastomer. IR was used for the positiveidentification of the raw material and for quantification of the hydride group inthe pre-elastomer as a complement to 1H NMR. IR was also used on the curedelastomer to follow the post-curing by measuring the content of the hydridegroup. NMR, IR and MS were used to identify and quantify the hexaneextractables and the mass spectroscopic detector was essential to reach the lowlevels of siloxanes in the migration studies.
We found many applications for gas chromatography for the silicones. Wedeveloped a completely new method for the quantification of the inhibitor byusing the headspace injection technique coupled to the GC. With this method wecould also follow the loss of inhibitor during curing. Extractables from theelastomer or solutions from the pre-elastomer were successfully analysed withGC using a flame ionisation detector. The oligomers were identified byconnection to the mass selective detector. Although it has not been presented inthis thesis, we also succeeded to separating and identifying liner and cyclicoligomers with GC-IR. However, this is only a minor part of the material thatcan be directly analysed by GC, as the majority of the material consists of non-volatile polymers. Therefore, degradation in alkaline or acidic conditions inexcess of a siloxane reagent was a useful method to produce monomericcompounds that can easily be identified and quantified by GC. Using thismethodology, it is possible to quantify the different types of functionalities inthe pre-elastomer.
Liquid chromatography was used to quantify the non-bonded organosilanols.We developed a new derivatisation method where liquid chromatography with aUV detector was used. Size exclusion chromatography with a light scatteringdetector and a refractive index detector was used to measure the changes inmolecular mass during the initial curing. Reversed phase liquid chromatographyis normally the method chosen for drug substances. We used this technique instudies where we saw the dramatic effect that the humidity had on the solubilityof estradiol in the silicone matrix, an effect which had a direct impact on theinitial release of the drug.
The thermoanalytical instruments DSC and DMTA were both used to study thecuring reaction. DSC was used to measure the heat of reaction while DMTA wasused to follow the creation of the network by measurement of the elasticmodulus. Theses techniques were applied on the raw material and also in thepre-curing studies to follow the degree of curing. TGA was used only tomeasure the silica content in the raw material.

102
All the analytical techniques used in this thesis have been essential to achieve anacceptable characterisation the silicone elastomer in its different phases fromraw material to finished product. However, with the development of newtechniques and the improvements of present techniques, this characterisationwill be better performed. NMR is going towards higher fields, giving betterresolution, and improved electronics result in higher signal-to-noise ratios.Therefore, it will probably also be possible to use 29NMR to resolve several ofthe questions around the silica surface in the silicone elastomer. Near infraredspectroscopy (NIR) will certainly be more frequently used in the future as aroutine identification and quantification technique for silicones, although itneeds reference techniques for calibration. The combination of differentseparations modes and the possibility of connecting different detectors makechromatography very powerful.

103
7. ACKNOWLEDGEMENTS
I would like to thank two persons in particular for initiating and helping methough the process of creating this thesis, Dr. Astrid Arbin and Prof. Ann-Christine Albertsson.
As all practical work were done at the former Pharmacia in Uppsala, I wouldlike to thank all former colleges who was involved in the drug deliverydevelopment during the 1990’s, especially those who were involved in the workwith enteric films and silicone elastomers.
Satish Singh for fruitful and interesting scientific discussions and for sharing thewriting of several scientific papers.
The Material Characterisation Group, the group which made most of the siliconedevelopment work and which I had the privilege to manage for some years;Bigitta Ander, Rolf Bergman, Elisabet Fransson and Tord Jonsson.
Anne Helander, who did the development of the NMR method on the siliconepre-elastomers, Herbert Bauman for the NMR characterisations of the curedelastomer. Martin Sandberg, Margot Eklund and David Söderström who mademost of the IR analyses. Jan-Olof Öberg for initiating the headspace gaschromatography method for determination of the inhibitor, Bertil Sellberg andKent Lundström for their management and scientific support. From thePharmacy Department; Thomas Nordlander and Kari Sandvold, who came to usanalytical chemists with all their nice problems for us to solve.
All gradient studients and summer workers; Patrice Poinsaint from Paris XIUniversity, Tobias Lehtipalo, Carl Lindner, Kalle Mälson and Fredrik Wallinfrom the University of Uppsala. Pernilla Roxin, Anette Qwärnström, UlrikaEdlund, and Maria Persson from KTH in Stockholm.
Bengt Lindqvist for giving me the opportunity to further explore the world ofanalytical chemistry by initiating the contacts with the Medical ProductsAgency. Dick Fransson, Tomas Mälson and Åke Öhrlund, and all otherparticipants (no names given nor forgotten) for all non-scientific meetings.
Finally, my dearest thanks and love to Annika, Johanna and Josefin, for theirunderstanding and support during this period of our lives.

104
REFERENCES1. Goldman, R. US Patent 2504482, 19492. Mishell, D. R. Jr.; Talas, M.; Parlow, A.F.
Am. J. Obstet. Gynecol. 1970, 107, 100-1073. d’ Arcangues, C. WHO Annual Technical Report, Long-acting systematic
agents for fertility regulation, 1995, 31-474. Burton, F. G.; Skiens, W. E.; Gordon, N. R.; Veal, J. T.; Kalkwarf, D. R.;
Duncan, G. W. Contraception 1978, 17, 221-2305. Roumen, F. J.; Boon, M. E.; van Velzen, D.
Hum. Reprod. 1996, 11, 2443-24486. Sam, A. P. J. Controlled Release 1992, 22, 35-467. FASS, Drugs in Sweden 2003, Läkemedelsinformation AB, Stockholm8. Levonorgestrel IUD 20 µg / 24 h, Product Monograph,
Leiras Oy, Finland, 19939. Estring® estradiol vaginal ring, Product Monograph,
Kabi Pharmacia, Stockholm, 199310. Vartiainen, J.; Wahlström, T.; Nilsson, C.G. Maturitas 1993, 17, 129-13711. Wrobel, D. Bayer AG, Leverkusen, Germany, Vulcanisation kinetics of
addition-cured silicone rubber, Proceedings of the Organosilicon Chem. II,Muench, 1994, 633-648,Eds.; Auner, N.; Weis, J. VCH, Weinheim, Germany
12. Das, M. N. Anal. Chem. 1954, 26, 1086-108713. Marquardt, R.P.; Luce, E. N. Anal. Chem. 1967, 39, 1655-1656 14. Hendra, P. J.; Jones, C. H.; Wallen, P. J.; Ellis, G.; Kip, B. J.;Van Duin,
M.; Jackson, K. D. O.; LoaDMTAn, M. J. R.Kautch. Gummi Kunstst. 1992, 45, 910-917
15. Fritz, G. Z. Anorg. Allgem. Chem. 1955, 280, 134-14216. Fritz, G.; Burdt, H. Z. Anorg. Allgem. Chem 1962, 317, 35-4017. Harzdorf, C. Z. Anal. Chem 1971,256, 192-19418. Winkler, H. J. S.; Gilman, H. J. Org. Chem. 1961, 26, 1265-126719. Chojnowski, J.; Mazurek, M.; Wilczek, L. Analyst 1976, 101, 286-29120. Josef, M. A.; Haque, S. A.; Grover, S.S.; Francis, D.
J. Angew. Macromol. Chem. 1991, 188, 63-7221. Kapecki, J. A. J. Chem. Education, 1971, 48, 73122. Lehnert, R.; Brendler, E. Farbe und Lack, 2000, 106, 30-3423. Michael, G.; Muller, A. Eur. Pat. Appl. 107466, 200024. Liu, C. C.; Maciel, G. E. Anal. Chem. 1996, 68, 1401-140725. Harris, R. K.; Kimber, B. J. Appl. Spectrosc. Rev. 1975, 10, 117-13726. Anne: Helander, A.; Paulsen, U. Poster presentation, Conference on
Pharmaceuticals, Swedish Academy of Pharmaceutical Sciences,Stockholm, 1994.
27. Pasch, H.; Disselhoff, R. Kautsch. Gummi Kunstst. 1994, 47, 90-96

105
28. Dai, Q.; Fan, J.; Gu, X.; Ni, H. Spectrosc. Lett. 1994, 27, 515-52329. Yilgör, I.; McGarth, J. E. Polym. Bull. 1984, 12, 499-50630. Bokobza, L.; Buffeteau, T.; Desbat, B. Appl. Spectrosc. 2000, 54, 360-36531. Dai, Q.; Fan, J.; Gu, X.; Ni, H. Spectrosc. Lett. 1994, 27, 515-52332. Stein, J.; Grade, H.; Williams, E. A.; Codella, P. J.; Smith, J. F.
J. Appl. Polym. Sci. 1993, 47, 2257-226733. Yang, D. B. J. Polym. Sci. 1993, 31, 199-20834. Fiorenza, A.; Bonomi, G. Rass. Chim. 1961, 13, 5-1835. Salomon, G. Pros. Inst. Rubber Ind. 1956, 3, 176-18636. Hansson, C. L.; Smith, R. C. Anal. Chem. 1972, 44, 1571- 157437. Heylmun, G. W.; Bujalski, R. C.; Bradley, H. B.
J. Gas Chromatogr. 1964, 300-30538. Frank, J.; Placek, K. Microchim. Acta 1975, 2, 31-3439. Bissel, E. R.; Fields, D. B. J. Chromatogr. 1972, 10, 164-16740. Mahone, L. G.; Garner, P. J.; Buch, R. R.; Lane, T. H.; Tatera, J. F.; Smith,
R. C.; Frye, C. L. Environ. Toxicol. Chem. 1983, 2, 307-31341. Stein, J.; Grade, H.; Williams, E. A.; Codella, P. J.; Smith, J. F.
J. Appl. Polym. Sci. 1993, 47, 2257-226742. Poinsaint, P. Universié Paris XI, Faculté de Pharmacie, “Determiantion of
Polysiloxane and silanol functionality by chromatography”,Gradiate study, Uppsala, 1996
43. Kookootsedes, G. J.; Plueddemann, E. P. US Patent 3445420, 196944. Dow Corning Corp. Curable Organopolysiloxane Compositions,
U. S. Patent 559729, June 23, 196645. Greco, R.; Laurienzo, P.; Martuscelli, M.; Perenze, N.; Sorrentino, A.
Advanced Polymer Technology 1994, 13, 14146. Shan-Yang, L.; Wen-Jin, T.; Ying-Liang, C.; Chau-Jen, L.
J. Controlled Release 1994, 31, 27747. arall, E. M.; Flandera, M. A. J. Elastomers Plast. 1974, 6, 1648. Wang, J. Z.; Bogner, R. H. Int. J. Pharm. 1995, 133, 11349. Lee, C. L.; Ronk, G. M.; Spells, S. J Cellular Plastics 1983,, Jan/Feb, 2950. Warrick, E. L.; Lauterbur, P. C. Ind. Eng. Chem. 1955, 47, 486-48951. Polmanteer, K. E. Rubber Chem. Technol. 1981, 54, 1051-108052. Kumudinie, C.; Mark, J. E. Polym. Mater. Sci. Eng. 1997, 77, 491-49253. Basic Characteristics of AEROSOL, Technical Bulletine No 11,
Degussa AG, Frankfurt, Germany, 199354. Okel, T. A.; Wadell, W. H. Rubber Chem. Technol. 1995, 68, 59-7655. Kazuo, H.; Akito, N. Compounding silicone rubber for stable resistivity.
Eur. Pat. Appl. 392262, 199056. Kennan, L. D.; Monroe, C. M.; Knapp, T. H. Skostins, O. Manufacture of
improved reinforcing silica fillers for silicone rubbers by treatment withalkoxysilanes. Eur. Pat Appl. 382370, 1990

106
57. Hair, M. L. In Silica surfaces, Proceednings of the Silanes, Surfaces, andInterfaces Symposium, Snowmass, Colorado, US, 1985
58. Hockey, J. A. Chem. Ind. 1965, Jan 9, 57-6359. Zur Adsorption von phamazeutischen Wirkstoffen an AEROSIL,
Technical Bulletine No 19, Degussa AG, Frankfurt, Germany, 198560. Aranguren, M. I.; Mora, E.; Macosko, C. W.; Saam,
J. Rubber Chem. Technol. 1994, 67, 820-83361. Aranguren, M. I.; Mora, E.; DeGroot, Jr. J. V.; Macosko, C. W.
J. Rheol. 1992, 36, 1165-1182 62. Grassie, N.; Macfarlane, G. Eur. Polym. J. 1978, 14, 875-88463. Kang, D. W.; Rajendran, G. P.; Zeldin, M.
J. Polym. Sci. 1986, 24, 1085-109564. Schneider, O. Thermochim. Acta. 1988, 134, 269-27465. Widman, G.; Riesen, R. Thermal Analysis: Terms,
Methods and Applications; Hüthig Verlag Heidelberg, 198766. Wang, S.; Mark, J. E. Macromol. Rep. 1994, A31, 253-26067. Warrick, E. L. Rubber Chemistry and Technology, 49, 1976, 90968. Polmanteer, K.E. Rubber Chemistry and Technology, 54, 1981, 105169. Fomicheva, M.; M.; Borisov, S. N. Kausch. Rezina 1967, 26, 8-970. Guenther, F. O. Anal. Chem. 1958, 30, 1118-112071. Jordan, D. E. Anal. Chim. Acta 1964, 30, 297-30272. Barnes, G. H.; Daughenbaugh, N. E. Anal. Chem. 1963, 35, 1308-131073. Kellum, G. E.; Uglum, K. L. Anal. Chem. 1967, 39, 1623-162774. Jordan, D. E. Anal Chim. Acta 1964, 30, 297-30275. Kellum, G. E.; Smith, R. C. Anal. Chem. 1967, 39, 1877-187976. Smith, R. C.; Kellum, G. E. Anal. Chem. 1966, 38, 338-34077. Smith, R. C.; Kellum, G. E. Anal. Chem. 1966, 38, 67-7278. Kellum, G. E.; Smith, R. C. Anal. Chem. 1966, 39, 341-34579. Peters, E. D.; Jungnickel, J. L. Anal Chem. 1955, 27, 450-45380. Kendrick, T. C.; Pharbhoo, B.; White, J. W. Siloxane polymers and co-
polymers, The Chemistry of Organic Silicon Compounds, 1989, 128981. Dorn, S. B.; Frame, E. M. S. Analyst 1994, 119, 1687-169282. Kohn, E.M. Energy Resech Abstract 1985, 10, No 1366483. Smith, A. L. The Analytical Chemistry of Silicones,
John Wiley & Sons Inc. 199184. Smith, R. C.; Kellum, G. E. Anal. Chem. 1966, 38, 647-64885. Mika, V.; Cadersky, I. Z. Anal. Chem. 1972, 258, 25-2986. Pierce, A. E. Silylation of Organic Compounds,
Pierce Chemical Company, Rockford IL, USA, 196887. Sweely, C. C.; Bently, R.; Makita, M.; Wells, W.W.
J. Am. Chem. Soc. 1963, 85, 249788. Modic, F. J. General Electric, US Patent 3516946, 197089. Macosko, C. W.; Saam, J. C. Polym. Bull. 1987, 18, 463–471

107
90. Speier, J. L.; Webster, J. A.; Barnes, G. H.J. Am. Chem. Soc. 1957, 79, 974-979
91. Saam, J. C.; Speier, J. L. J. Am. Chem. Soc. 1958, 80, 4104-410692. Saam, J. C.; Speier, J. L. J. Am. Chem. Soc. 1961, 83, 1351-135593. Ryan, J. W.; Speier, J. L. J. Am. Chem. Soc. 1961, 86, 895-89894. Chalk, A. J.; Harrod, J. F. J. Am. Chem. Soc. 1965, 87, 16-2195. Quam, X. Polym. Eng. Sci. 1989, 29, 1419-142596. Hill, H. Rubber World 1983, 189, 15-2397. Jones, D. S. Int. J. Pharm. 1999, 179, 167-17898. Wang, J. Z. Y.; Bogner, R. H. Int. J. Pharm. 1995, 113, 113-12299. Barall, E. M.; Flandera, M. A. J. Elastomers and Plastics 1974, 6, 16-25100. Lin, S.; Tsay, W.; Chen, Y.; Lee, C.
J Controlled Release 1994, 31, 277-282101. Greco, R.; Laurienzo, P.; Malinconico, M.; Martuscelli, E.; Perenze, N.;
Sorrentino, A. Adv. Polym. Technol. 1994, 13, 141-147102. Nyqvist, H. Int. J. Pharm Tech. & Prod. Mfr. 1983, 4, 47-48103. Lee, C. L.; Ronk, G. M.; Spells, S.
J. Cellular Plastics 1983, Jan/Feb, 29-33104. Most, C. F. Jr. J. Appl. Polym. Sci. 1970, 14, 1019-1024105. Burggraaf, S.; Rathbone, M. J.; Bunt, C. R.; Burke, C. R.; Pickering, K. L.
Effect of silicone Shore hardness, inter fillers and progesterone particlesize upon the release of progesterone from a controlled releaseintravaginal drug delivery system, Proceedings of the InternationalSymposium Controlled Release Bioactive Materials, Controlled ReleaseSociety, 1997, 24, 147-148
106. European Pharmacopoeia Ed. 4, 2003107. Pfleiderer, B,; Xu, P.; Ackerman, J. L.; Garrido, L.
J Biomed. Mater. Res. 1995, 29, 1129-1140108. Pellenbarg, R. Environ. Sci. Technol. 1979, 13, 565-569109. Pellenbarg, R. Mar. Pollut. Bull. 1979, 10, 267-269110. Pierce, A. E. Silylation of Organic Compounds111. Pierce Chemical Corp., Rockford, Illinois, USA, 1968112. Weiss, A. H.; Tambawala, H. J. Chromatogr. Sci. 1972, 10, 120-122113. Lentz, C. W. Inorg. Chem. 1964, 3,574-579114. Mahone, L. G.; Garner, P. J.; Buch, R. R.; Lane, T. H.; Tatera, J. F.; Smith,
R. C.; Frye, C. L. Environ. Toxicol. Chem. 1983, 2, 307-313115. Hausler, D. W.; Taylor, L. T. Anal. Chem. 1981, 53, 1223-1227116. Biggs, W. R.; Fetzer, J. C. Anal. Chem. 1989, 61, 236-240117. Smith A. L.; Parker, R. D. The Analytical Chemistry of Silicones,
Ed.;Smith A. L. Whiley, New York, 1991, pages 71-95118. Hausler, D. W.; Taylor, L. T. Anal. Chem. 1981, 53, 1227-1231119. Heine, D. R.; Denton, M. B. J. Chromatogr. Sci. 1985, 23,454-458120. Dorn, S. B.; Skelly Frame, E. M. Analyst 1994, 119, 1687-1694


![Silicone rubbers for dielectric elastomers with improved ......dielectric elastomer (DE) formulation due to their favorable electro-mechanical properties. [1] Dielectric elastomers](https://static.documents.pub/doc/80x56/60a7aa8430c09b569000940a/silicone-rubbers-for-dielectric-elastomers-with-improved-dielectric-elastomer.jpg)


