New Bedford Harbor’s Environmental Problems & Evaluation of Filter Press Dewatering Process 1 New Bedford Harbor’s Environmental Problems and Bench-Scale Evaluation of Filter Press Dewatering Process Written by Minh Tran, R&D Intern, Waste Stream Technology, Inc., Buffalo, NY Field Supervisor: Dr. Brian Schepart Laboratory Advisor: Nicole O’Sullivan August 14, 2009
Transcript
New Bedford Harbor’s Environmental Problems & Evaluation of Filter Press Dewatering Process
1
New Bedford Harbor’s Environmental Problems and Bench-Scale Evaluation of Filter Press
Dewatering Process
Written by Minh Tran, R&D Intern, Waste Stream Technology, Inc., Buffalo, NY
Field Supervisor: Dr. Brian Schepart
Laboratory Advisor: Nicole O’Sullivan
August 14, 2009
New Bedford Harbor’s Environmental Problems & Evaluation of Filter Press Dewatering Process
2
Table of Contents
List of Tables …………………………………………………………………….. 3
I. A Description of New Bedford Harbor and Its Environmental Problems ... 4
II. An Introduction of Cleanup Methods ………………………………………. 5
III. Filter Press Tests
1. Scope of Work …………………………………………………………………………... 6 2. Initial Characterization …………………………………………………………………... 6 3. Filter Press ………………………………………………………………………………. 7 4. Summary and Conclusions ……………………………………………………………… 8
IV. New Bedford Harbor’s Current Status ……………………………………. 9
References ………………………………………………………………………. 11
Appendix A ……………………………………………………………………... 12
Appendix B ……………………………………………………………………... 13
Appendix C ……………………………………………………………………... 14
New Bedford Harbor’s Environmental Problems & Evaluation of Filter Press Dewatering Process
3
List of Tables
Table 1. Analytical methods utilized for sample characterization ……... 7
Table 2. Cleanup time frame depends on future funding rates ……….. 10
New Bedford Harbor’s Environmental Problems & Evaluation of Filter Press Dewatering Process
4
I. A Description of New Bedford Harbor and Its Environmental Problems
New Bedford Harbor is an urban tidal estuary on Buzzards Bay, in southeastern Massachusetts. Since the early nineteenth century, New Bedford Harbor has been considered the leading fishing and whaling port in the United States in terms of annual fish catch. The wealth in fishing opportunities drew many immigrants and brought prosperity to the city of New Bedford. In 1991, the population of the city was estimated to be nearly 100,000 which represented about 40% of the total population in the Bay’s drainage basin. Acushnet River, a 1,000-acre estuary, serves as the city’s main waterway.1 Until the 1970’s, there were no strict standards applying to water pollution. As a result, local businesses including factories, textile mills and fish processing plants freely dumped their industrial wastes into the river. From 1940 to 1978, before the use of polychlorinated biphenyls (PCBs) was banned by the U.S. Environmental Protection Agency (EPA), two manufacturers of electrical parts, mainly the Aerovox Corporation,
discharged an enormous volume of PCB-contained industrial process wastes directly into the New Bedford Harbor and indirectly through the city’s sewer system. Alerted by a series of studies conducted from 1974 to 1982 regarding high concentrations of PCBs found in sediments and biota along the Acushnet River into Buzzards Bay, the EPA added New Bedford Harbor to its Superfund List in 1983.2
PCBs are chlorinated, colorless, odorless, semi-volatile organic compounds that have been classified as carcinogens. For industrial applications, PCBs were mostly used as electrical insulators in capacitors and transformers. Since PCBs are insoluble in water, they adhere to sediments settling at the bottom of the waters for a very long period of time.3 PCBs have spread from the Hot Spot, a
FIGURE 1 New Bedford waterfront, 2001
FIGURE 2 Various concentrations of PCBs in sediments. The upper arrow indicates the location of the Aerovox facility. The lower arrow shows the hurricane barrier
New Bedford Harbor’s Environmental Problems & Evaluation of Filter Press Dewatering Process
5
5-acre portion surrounding Aerovox Corporation, to lower parts of the Acushnet River and the Bay, due to currents produced by tides. It has been estimated that approximately 0.5 pound of PCBs is transported by tides to the Bay each day. In the late 1980s and early 1990s, research indicated that PCB concentrations in marine sediments in the estuary varied from a few parts per million to over 200,000 ppm (the current clean-up level is 10-50 ppm). In addition, PCBs, when ingested, accumulate in animal’s tissue, which makes seafood at New Bedford too toxic to be consumed by humans. In 1979, the Massachusetts Department of Public Health restricted fishing and lobstering over the 18,000-acre New Bedford Harbor and Acushnet River estuary.4
II. An Introduction of Cleanup Methods
In October of 1983, the EPA started examining different cleanup plans. A good method should effectively and economically remove contaminated sediments as well as reduce the exposure of the public to the clean-up sites. Three proposals finally were recommended for voting:
a) Dredging and on-site incineration.
b) Removal, solidification and disposal in an off-site, federally approved, landfill.
c) Dredging and treatment with solvent extraction.
The third option had the potential to reduce the concentrations of PCBs on the sediments up to 96-99% by using an appropriate solvent to dissolve PCBs. This method, however, had been used successfully on soils but not on sediment, which had a much greater water content. As a result, extensive testing and development should be performed prior to large-scale application at New Bedford. Six out of nine committee members voted in favor of the dredging and incineration. However, public oppositions and fears that air-borne contamination including dibenzofurans, several types of dioxins and remaining PCBs released from incineration would spread widely over the
New Bedford Harbor’s Environmental Problems & Evaluation of Filter Press Dewatering Process
6
New Bedford area forced the EPA to alter its practice and dispose of the sediments in either the on-site Confined Disposal Facility (CDF) or an off-site certified landfill. 2
Sevenson Environmental Services, Inc. (SES) was contracted to perform sediment remediation and in the Spring of 2004, Sevenson started the construction of treatment facilities. The contaminated sediments at the bottom of the harbor are hydraulic dredged and transported by booster pumps and through a floating pipeline to the de-sanding facility. At the de-sanding building, coarse materials are separated from finer, PCB-laden materials by shaker screen and hydrocyclone units. While the coarse materials are stored in a lined holding cell near the de-sanding facility, the finer sediments are delivered, by submerged pipeline, to the de-watering facility. At the de-watering facility, filter presses squeeze water out of the dredged sediments. The dry sediments or filter cakes are collected and analyzed for contaminants then disposed off in the CDFs (if less than 50 ppm PCBs) or transported off-site by train to a licensed PCB landfill (if greater than 50 ppm PCBs). The large volume of filtrate then requires special treatment to meet the standards established in ambient water quality conditions (AWQC) in the parts per trillion range before returning to the harbor.5
III. Filter Press Tests
1. Scope of Work
Prior to deploying large scale dewatering of dredged sediments in the field, several pilot studies have been conducted in the laboratory to determine optimal conditions for applications. Since July 2001, Waste Stream Technology, Inc. (WST), a wholly-owned subsidiary of SES, has performed solidification/stabilization treatability studies on different sediment samples collected from New Bedford Harbor. The next sections of this part will solely present the results obtained from filter press testing of the sample collected in June 2009 at New Bedford Harbor. Ultimately, an optimal condition, which includes polymer dosage, filter press time and pressure, will be concluded.
2. Initial Characterization
A 5-gallon bucket of sediment sample from New Bedford Harbor was sent to WST by SES and received on June 12, 2009. Prior to initial analyses, the sample was logged in based on its weight and receiving date. It was also assigned an R&D number for future identification. Upon opening the bucket, the sample appeared to be thin, black sludge with no odor. The sample also appeared to be de-sanded and ready for filter press feed. Prior to subsample for initial characterization, the sample was mixed thoroughly for a few minutes to ensure homogeneity. Three characteristics that contribute to the initial analyses of any newly received sample include percent solids, specific gravity and pH. Table 1 lists the methods employed by the treatability laboratory.
New Bedford Harbor’s Environmental Problems & Evaluation of Filter Press Dewatering Process
7
Analysis Method Percent Solids Standard Method 2540G
Specific Gravity Standard Method 2710F pH SW 846 Method 9045C
TABLE 1 Analytical methods utilized for sample characterization
Results of the initial analyses are tabulated and presented in Appendix A. The content of the sample was mostly harbor water which was indicated by only 9.70% solids. The dominance of water in the sample was also reflected by the specific gravity of 1.04 which was just slightly above the density of water. The pH measured was 6.62, which was mostly neutral.
3. Filter Press
The dewatering machines that were used at the treatability laboratory were bench top recessed-chamber filter presses. These presses function similarly to the plate and frame filter presses at the New Bedford Harbor dewatering facility but with a much smaller scale, therefore, are suitable for bench scale studies. One-liter of pretreated sediment sample was fed to the filter press before each run. Time and filtration pressure were recorded for comparison. After each run, the filter cake was collected. Its physical characteristics were evaluated and its percent solids was measured. An excellent filter cake can be defined as one that has a high solids recovery and good handling characteristics – more specifically, is solid and dry, releases easily from the filter cloths and does not have a sticky consistency. In a similar manner, the filtrate was also collected for evaluation of its physical appearance and for determination of its total suspended solids (TSS). A high quality filtrate is one that has few suspended solids, no visible oil and requires minimal additional treatment. Finally, both filtrate and
filter cakes were disposed of in a designated waste bucket.
The chemicals that were used to treat sediment samples before dewatering were an anionic emulsion polymer, AE 843 and cationic solution polymers CP 626 and CP 757. These polymers, when mixed with sediments, changed their physical and chemical properties. More specifically, the added polymers decreased the
FIGURE 5 Bench top recessed-chamber filter press used at the treatability laboratory
FIGURE 6 Plate and frame filter press used at the dewatering facility
New Bedford Harbor’s Environmental Problems & Evaluation of Filter Press Dewatering Process
8
surface area of sediments exposed to leaching, coated the sediments or chemically immobilized PCBs to keep PCBs from migration.6 In previous treatability studies, the addition of the above polymers always resulted in very good to excellent filter cakes with clear filtrates. Also, advanced from previous results, only 300 ppm of either CP 626 or CP 757 were added to each feed and the press time was maintained at 90 minutes per run. The only parameter that varied was the pressure, which was increasing from 150 PSI to 225 PSI.
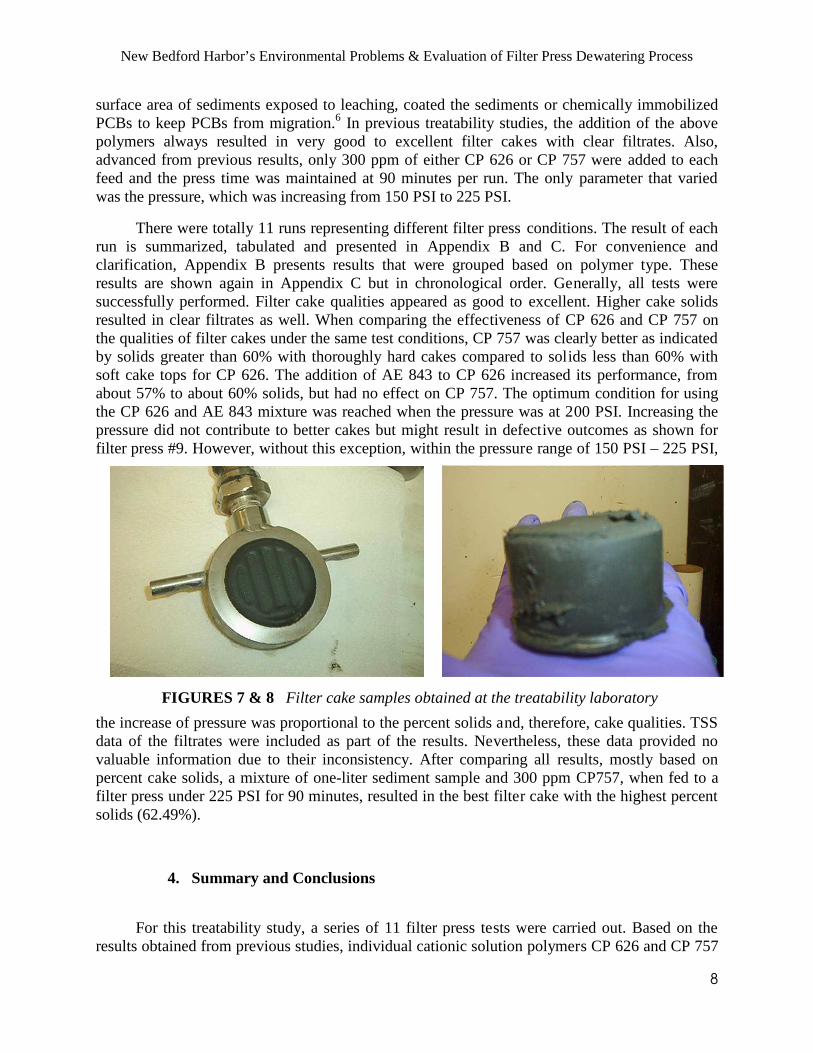
There were totally 11 runs representing different filter press conditions. The result of each run is summarized, tabulated and presented in Appendix B and C. For convenience and clarification, Appendix B presents results that were grouped based on polymer type. These results are shown again in Appendix C but in chronological order. Generally, all tests were successfully performed. Filter cake qualities appeared as good to excellent. Higher cake solids resulted in clear filtrates as well. When comparing the effectiveness of CP 626 and CP 757 on the qualities of filter cakes under the same test conditions, CP 757 was clearly better as indicated by solids greater than 60% with thoroughly hard cakes compared to solids less than 60% with soft cake tops for CP 626. The addition of AE 843 to CP 626 increased its performance, from about 57% to about 60% solids, but had no effect on CP 757. The optimum condition for using the CP 626 and AE 843 mixture was reached when the pressure was at 200 PSI. Increasing the pressure did not contribute to better cakes but might result in defective outcomes as shown for filter press #9. However, without this exception, within the pressure range of 150 PSI – 225 PSI,
the increase of pressure was proportional to the percent solids and, therefore, cake qualities. TSS data of the filtrates were included as part of the results. Nevertheless, these data provided no valuable information due to their inconsistency. After comparing all results, mostly based on percent cake solids, a mixture of one-liter sediment sample and 300 ppm CP757, when fed to a filter press under 225 PSI for 90 minutes, resulted in the best filter cake with the highest percent solids (62.49%).
4. Summary and Conclusions
For this treatability study, a series of 11 filter press tests were carried out. Based on the results obtained from previous studies, individual cationic solution polymers CP 626 and CP 757
FIGURES 7 & 8 Filter cake samples obtained at the treatability laboratory
New Bedford Harbor’s Environmental Problems & Evaluation of Filter Press Dewatering Process
9
or a mixture of AE 843 and one of the cationic solution polymers were chosen as treating reagents. A fixed press time was maintained while the pressure was increased for comparison. After considering all result data, it was concluded that sediment treated with 300 ppm CP 757 at 225 PSI for 90 minutes would provide the best and most economical performance. Furthermore, SES and WST have determined through extensive field experience that full-scale filter press units inevitably achieve filter cakes with up to 2-3% higher solids capture than bench-scale units.
IV. New Bedford Harbor’s Current Status
In order to reduce the concentrations of PCBs at New Bedford Harbor to safe levels, the EPA estimated that about 880,000 cubic yards of sediments should be removed. This volume is approximately equivalent to 175 football fields, each of which is 3 feet thick.5 After the 2008 cleanup season, the EPA has spent over 200 million dollars but only 14% of the contaminated sediments were removed. It has been expected that the total cost would mount up to 750 million dollars and it may take roughly the next 24 years to complete. There have been serious concerns about the length of the project among community members. One concern is the continuing exposures to PCBs through water, air and food chain which negatively affect the public’s health. In addition, since the New Bedford Harbor Superfund site comprises 1,000 acres of land and 17,000 acres in Buzzards Bay, it has directly slowed down the city’s plan for comprehensive redevelopment of New Bedford and other shoreline communities.7
On April 15, 2009, Massachusetts governor Deval Patrick announced the receipt of 25 to 35 million dollars from federal stimulus budget to speed up the cleanup process at New Bedford Harbor. This will double or triple the 2009 annual fund of 15 million dollars for the project. Recently, due to economic concern, some Massachusetts law makers have wrote a letter to the EPA’s administrator Lisa Jackson to ask her to allocate $110 million dollars for the harbor cleanup over the next two years.8 Currently, the
FIGURE 9 Fishing closure areas I, II and III. Such closure negatively affects New Bedford Harbor’s economy
New Bedford Harbor’s Environmental Problems & Evaluation of Filter Press Dewatering Process
10
EPA is still considering other cleanup alternatives to meet its criteria of safe, effective and economical performance.
Annual funding level (million dollars)
Years to complete Costs to complete (million dollars)
80 4 290 30 11 330 20 18 360 15 26 390
TABLE 2 Cleanup time frame depends on future funding rates
New Bedford Harbor’s Environmental Problems & Evaluation of Filter Press Dewatering Process
11
References
1. Geographical History of New Bedford Harbor. Buzzards Bay National Estuary Program. August 1991 <http://www.buzzardsbay.org/ccmpold/ccmp-chap6.pdf>
2. PCBs Contamination & Cleanup Methods. The Evans School of Public Affairs, University of Washington. 2001 <http://www.muw.edu/hpgp/docs/NewBedfordSfundCase.pdf>
3. PCBs Properties. National Oceanic and Atmospheric Administration <http://www.gc.noaa.gov/gc-rp/nbhch01.pdf>
4. The Spread of PCBs. Sevenson Environmental Services, Inc. <http://www.sevenson.com/project-listings/project-
5. Dredging and Dewatering Method. U.S. Environmental Protection Agency. 8 August 2008 http://yosemite.epa.gov/opa/admpress.nsf/d0cf6618525a9efb85257359003fb69d/a2b26760d55032588525749f004437c8!OpenDocument
6. Solidification/Stabilization Use at New Bedford Harbor. U.S. Environmental Protection Agency. September 2000
7. New Bedford Harbor’s Current Status. Center for Public Environmental Oversight. September 2006 <http://cpeo.org/pubs/NewBedford.pdf>
8. New Bedford Harbor’s Current Status. The Official Website of the Commonwealth of Massachusetts. 15 April 2009 <http://www.mass.gov/?pageID=gov3pressrelease&L=1&L0=Home&sid=Agov3&b=pressrelease&f=090415funding_for_New_Bedford_Cleanup&csid=Agov3>
New Bedford Harbor’s Environmental Problems & Evaluation of Filter Press Dewatering Process
12
APPENDIX A
Bench-Scale Evaluation of Filter Press Dewatering Process
Initial Characterization
New Bedford Harbor E-835rec'd 6/12/09
Initial Data
Sample ID % SolidsSpecific
GravitypH Physical Description
RD09028 9.70 1.04 6.62 Thin, black sludge.
New Bedford Harbor’s Environmental Problems & Evaluation of Filter Press Dewatering Process
13
APPENDIX B
Bench-Scale Evaluation of Filter Press Dewatering Process
Filter Press Data (chronological)
New Bedford Harbor E-835rec'd 6/12/09
Filter Press Data
Filter
Press #Sample ID
% Feed
Solids
Additive
and
Dosage
Press Time/
PressureFiltrate TSS (ppm)
Release/
Blinding
% Cake
SolidsComments
1 RD09028 9.70300ppm
626
90min/ 200
PSI
Clear,
colorless78
Excellent/ No
apparent57.81 Good cake, soft top.
2 RD09028 9.70
300ppm
626 +
35ppm 843
90min/ 200
PSI
Clear,
colorless80
Excellent/ No
apparent60.12 Very good cake, slight soft top.
3 RD09028 9.70300ppm
757
90min/ 200
PSI
Clear,
colorless66
Excellent/ No
apparent60.59 Very good cake, slight soft top.
4 RD09028 9.70
300ppm
757 +
25ppm 843
90min/ 200
PSI
Clear,
colorless79
Excellent/ No
apparent61.52 Excellent cake, hard throughout.
5 RD09028 9.70300ppm
626
90min/ 150
PSI
Clear,
colorless95
Excellent/ No
apparent57.25 Good cake, soft top.
6 RD09028 9.70
300ppm
626 +
35ppm 843
90min/ 150
PSI
Clear,
colorless104
Excellent/ No
apparent59.21 Very good cake, slight soft top.
7 RD09028 9.70300ppm
757
90min/ 150
PSI
Clear,
colorless119
Excellent/ No
apparent60.56 Very good cake, slight soft top.
8 RD09028 9.70
300ppm
757 +
25ppm 843
90min/ 150
PSI
Clear,
colorless109
Excellent/ No
apparent60.03 Excellent cake, hard throughout.
9 RD09028 9.70
300ppm
626 +
35ppm 843
90miin/ 225
PSI
Clear,
colorless111
Excellent/ No
apparent58.92 Very good cake, slight soft top.
10 RD09028 9.70300ppm
757
90miin/ 225
PSI
Clear,
colorless98
Excellent/ No
apparent62.49 Excellent cake, hard throughout.
11 RD09028 9.70
300ppm
757 +
25ppm 843
90miin/ 225
PSI
Clear,
colorless109
Excellent/ No
apparent61.74 Excellent cake, hard throughout.
New Bedford Harbor’s Environmental Problems & Evaluation of Filter Press Dewatering Process
14
APPENDIX C
Bench-Scale Evaluation of Filter Press Dewatering Process