+ All Categories
Home > Documents > New Business Models (Gas Pricing & Financing) in...

New Business Models (Gas Pricing & Financing) in...

Date post: 15-Mar-2018
Category:
Upload: phammien
View: 215 times
Download: 3 times
Share this document with a friend
15
New Business Models (Gas Pricing & Financing) in the New Era of Gas Presented at The 7 th International Indonesia Gas Conference and Exhibition 1 Conference and Exhibition Presented by Dr. Fereidun Fesharaki Chairman, FGE January 27, 2015 This presentation material contains confidential and privileged information. The dissemination, distribution, or copying by any means whatsoever without FGE’s prior written consent is strictly prohibited.
Transcript

New Business Models (Gas Pricing &

Financing) in the New Era of GasPresented at

The 7th International Indonesia Gas

Conference and Exhibition

1

The 7 International Indonesia Gas

Conference and Exhibition Presented by

Dr. Fereidun Fesharaki

Chairman, FGE

January 27, 2015

This presentation material contains confidential and privileged information.

The dissemination, distribution, or copying by any means whatsoever without FGE’s prior written consent is strictly prohibited.

Who is FGE?� For over 30 years, FGE has delivered strategic advice on the oil and gas markets to clients around the

world. The company was the first consulting firm to specialize in the downstream oil and gas markets with

a focus on the East of Suez region.

� Over the past decades, FGE has provided studies and advisory services to national governments, national

oil and gas companies, major oil and gas companies, independent oil and gas companies, financial

institutions, international and intergovernmental organizations, utilities, consultancies, and engineering

design firms.

� FGE’s global presence enables us to service clients around the world.

Over 270 Clients Around the Globe

2

Please visit our website,

www. FGEnergy.com for more information.

Beijing

SingaporeHonolulu

Dubai

London

Main Offices

Rep/Branch Offices

Global/Asian Headquarters

TokyoCalifornia

Melbourne

Mumbai

� Need for consistent integrated oil and gas policy in the era of volatile oil

prices.

� Since many new gas projects are high cost offshore gas, huge challenges

are faced by the industry to proceed forward. Incentives need to be

provided.

� Imported LNG is inevitable. Pricing of LNG imports will be much lower

New Paradigm for Indonesia

3

than expected in the past. A consistent relationship between domestic

and international prices needs to be established.

� Project financing will become more challenging in the era of lower oil

prices. There is a role for the State in facilitating and incentivizing

innovative project financing.

� There is a need to develop institutions along with policies to ensure

proper implementation, free of political wrangling.

�OPEC size addition to oil production New

� Largest producer of condensates in the world (now) New

�Amongst top 3 LNG exporters in the world (by 2020/22) New

�Top LPG exporter in the world (by 2015/16) New

The US as an Energy Superpower

4

Top LPG exporter in the world (by 2015/16) New

� Largest exporter of refined products in the world (now) New

�Emerging major petrochemical exporter (by 2020) New

�Emerging ethane exporter New

�Major coal exporter

$70

$80

$90

$100

$110

$120

$130

US$/bbl Brent (2005-2020)

Long-Term Oil Price: Finding A New Balance

5

$-

$10

$20

$30

$40

$50

$60

52005–2014: actual, forecast in $2014 thereafter

$40

$60

$80

$100

$120

US$/bbl Brent (Jan 2014-Dec 2015)

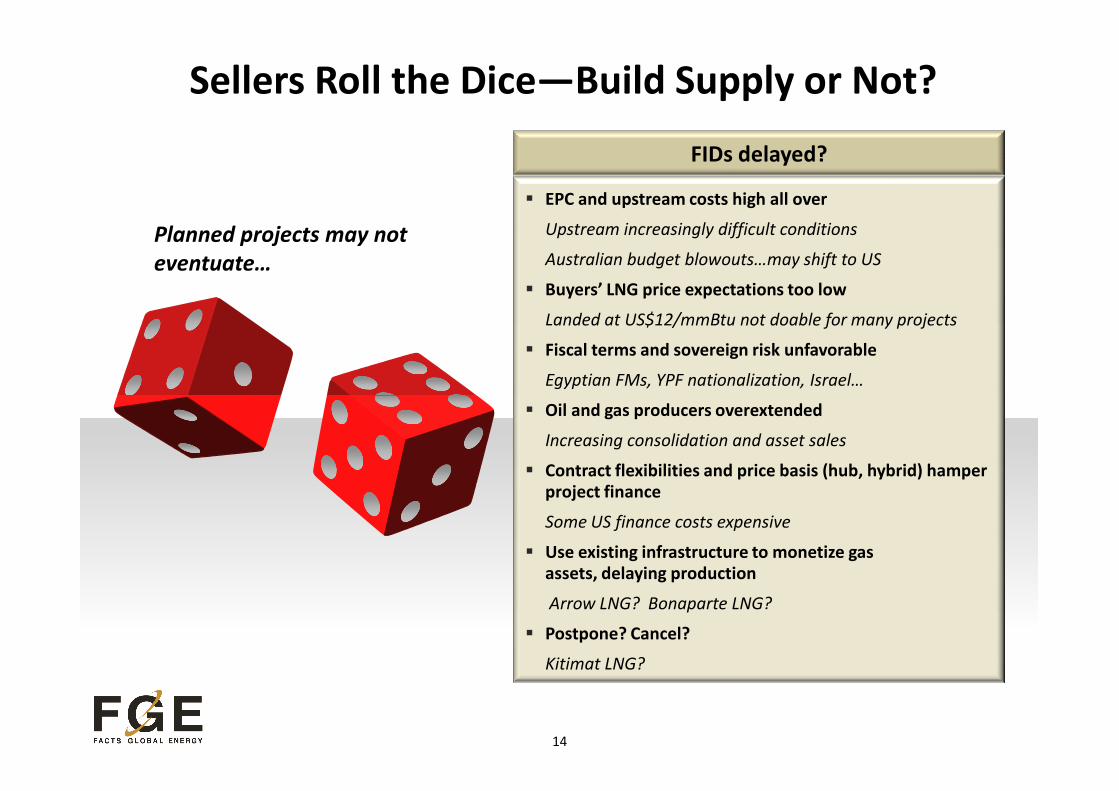
Massive Supplies Planned Post-2017…

…But Buyers Need to Commit!

500

600

700

800

900

mm

t

World Liquefaction Capacity and LNG Demand

Speculative

Planned

Under Construction

In Operation

6

0

100

200

300

400

500

mm

t

World LNG Demand

250

300

350

mm

t

Likely East Africa Exports to Asia*

Likely Canada Exports to Asia

Likely US Exports to Asia

Likely East of Suez Supply Capacity

Targeting Asia Pacific

Asia+ME Demand

2014: Supply required

from West of Suez

East of Suez LNG Market Pressure PointsEast of Suez Liquefaction Supply and LNG Demand

Market softens. No huge

surplus, uncompetitive projects

fail to materialize.

7

100

150

200

2014 2015 2016 2017 2018 2019 2020 2021 2022 2023 2024 2025

from West of Suez

Base case scenarios (JKTIC + New Markets + Middle East)

*Only Mozambique for now

Australian ramp up.

US supplies start.

Canadian and East African projects add to supplies.

Myth: No More Oil-Linked Deals Being Done

HH-

Linked, 3

0%

Oil-

Linked, 6

0%

Number of Contracts:*

Share by Type (2013-Present) HH-

Linked,

5.6

mmtpa

Hybrid,

Oil-

Linked, 1

9.2

mmtpa

Contracted* Volumes

(2013-Present)

8

*Mid- to long-term contracts signed since early 2013 by Asian end-user buyers only,

excluding contracts concluded for resale purposes.

More contracts signed and the most volumes contracted

were either oil or hybrid-linked!

Hybrid, 1

0%

Hybrid,

7.7

mmtpa

Long-Term Oil vs. Hub Indexation—Which is Better? Projected Oil- and Hub-Linked LNG Prices Delivered to Asia

9

In comparing the oil-indexed contracts and hub-indexed LNG prices delivered to Asia, a range of HH prices

is considered. A lower case (EIA’s 2014 Outlook) and higher case (FGE Outlook) for HH prices are used as

the basis of hub-linked LNG contract prices.

HH-linked contracts are not necessarily cheaper but may offer greater flexibility in non-pricing terms.

Spot/Short-Term Buying has Risen Substantially

15%

20%

25%

25

30

35

40

45

mm

tMiddle East

Thailand, Singapore & Malaysia

China

India

Taiwan

South Korea

Japan

Spot/Short-Term Share of East of Suez Trade (RHS)

10

0%

5%

10%

0

5

10

15

20

25

2006 2007 2008 2009 2010 2011 2012 2013

mm

t

Asia is the Biggest Driver in Global Trade

0

10

20

30

40

2001 2002 2003 2004 2005 2006 2007 2008 2009 2010 2011 2012 2013

% c

ha

nge

ye

ar

on

ye

ar

Global LNG Imports, 2001-2013

Y-O-Y Change

11

Europe

14%

Asia

75%

Americas

9%

Middle

East

2%Europe

23%

Asia

72%

Americas

5%

-20

-10

2001 2002 2003 2004 2005 2006 2007 2008 2009 2010 2011 2012 2013

Middle East Americas Asia Europe

2013:

236 mmt

2000:

101 mmt

Besides Japan, Korea, and Taiwan, which will be under pressure to secure additional

supplies, new demand is emerging from Southeast Asian importers

Who Holds the Biggest Potential in Signing New

Contracts?

60

80

100

120

mm

tpa

Uncontracted LNG Demand*

12

*Likely uncontracted demand including contract renewals and likely preliminary agreements.

Contractual supplies exclude optional volumes and additional volumes.

-

20

40

2015 2016 2017 2018 2019 2020 2021 2022 2023 2024 2025

mm

tpa

New Markets Uncontracted Demand India Uncontracted DemandChina Uncontracted Demand Taiwan Uncontracted DemandKorea Uncontracted Demand Japan Uncontracted Demand

• US • Under construction – 34.95 mmtpa

• Announced* – >260 mmtpa

• Canada• Announced* – >310 mmtpa

“New Frontiers” of Supply – Big Bonanza?

13

• Russia• Under construction – 16.5 mmtpa

• Announced – 63.9 mmtpa

• East Africa• Announced – up to 32.5 mmtpa**

*Capacity per DOE authorization to FTA countries for US, NEB authorization for Canada.

**Mozambique project partners’ original plan includes up to 50 mmtpa but 20 mmtpa landed + 2.5 mmtpa FLNG in 1st phase. Tanzania is 10 mmtpa.

FIDs delayed?

Sellers Roll the Dice—Build Supply or Not?

� EPC and upstream costs high all over

Upstream increasingly difficult conditions

Australian budget blowouts…may shift to US

� Buyers’ LNG price expectations too low

Landed at US$12/mmBtu not doable for many projects

� Fiscal terms and sovereign risk unfavorable

Egyptian FMs, YPF nationalization, Israel…

Planned projects may not

eventuate…

14

� Oil and gas producers overextended

Increasing consolidation and asset sales

� Contract flexibilities and price basis (hub, hybrid) hamper project finance

Some US finance costs expensive

� Use existing infrastructure to monetize gas assets, delaying production

Arrow LNG? Bonaparte LNG?

� Postpone? Cancel?

Kitimat LNG?

Thank You

Global Headquarters:

133 Aldersgate Street

London, EC1A 4JA

United Kingdom

Tel: (44 -0-20) 7726-9570

[email protected]

Asian Headquarters:

8 Eu Tong Sen Street,

#20-89/90 The Central,

Singapore 059818

Tel: (65) 6222-0045

Fax: (65) 6222-0309

[email protected]

London – Singapore – Dubai – Beijing – Tokyo – Hawaii – California – Melbourne – Mumbai

Global Offices:

Dubai (971-4) 439-0451

Beijing (86-10) 5869-5737

Tokyo (81-3) 6256-0299

Hawaii (1-808) 944-3637

California (1-646) 733-7571

Melbourne (61-3) 9787-9520

Mumbai [email protected]


Recommended