New Car CO 2 Report 2015 The 14th report THE SOCIETY OF MOTOR MANUFACTURERS AND TRADERS LIMITED SMMT, the ‘S’ symbol and the ‘Driving the motor industry’ brandline are trademarks of SMMT Ltd.
Transcript
New Car CO2 Report 2015The 14th report
THE SOCIETY OF MOTOR MANUFACTURERS
AND TRADERS LIMITED
SMMT, the ‘S’ symbol and the ‘Driving the motorindustry’ brandline are trademarks of SMMT Ltd.
Page 2 | New Car CO2 Report THE SOCIETY OF MOTOR MANUFACTURERS AND TRADERS THE SOCIETY OF MOTOR MANUFACTURERS AND TRADERS New Car CO2 Report | Page 3
FOREWORD
The UK automotive industry has experienced unprecedented growth in recent years. New car registrations returned to pre-recession levels in 2014 as building confidence in the economy saw a consistent and robust increase in consumer demand, yielding the best market performance for a decade. The domestic market grew 9.3%, exceeding the EU average of 5.7% and confirming the UK as the second largest market in Europe behind Germany. Alongside this market growth, confidence in UK automotive manufacturing was demonstrated by extraordinary levels of investment, totalling more than 4.7 billion last year.
Last year also saw a remarkable surge in demand for alternative fuelled vehicles. Increased vehicle choice, coupled with consumers’ ongoing quest for lower running costs and greater efficiency, resulted in a quadrupling of plug-in car registrations to 14,498. With a variety of new plug-in models expected in 2015, this area of the market will continue to grow significantly.
However, one of the greatest challenges still facing the sector is the transition to a low-carbon future. Average CO2 emissions from new cars have fallen by 27.3% in 10 years, and 2.9% since 2013 to 124.6g/km in 2014. This is 4.2% below the 130g/km 2015 pan-EU target, an achievement in which industry should be immensely proud.
The European Parliament and the Council of the European Union have set mandatory CO2 emission targets, which new passenger cars and light commercial vehicles must meet by 2020. By this time, 95% of all new cars sold in the EU must emit on average 95g/km CO2 or less – a limit that becomes mandatory for all cars on sale from 2021. Light-commercial vehicles will be limited to 147 g/km CO2. The 2020 EU targets for new cars and vans remain ambitious and challenging, but offer stability and planning certainty which are critically important for industry competitiveness and development.
The UK motor industry can play a key part in rebalancing the economy, creating high value jobs and leading the global transition to decarbonising transport. It is increasingly important that industrial, energy and environmental policies are closely aligned to maximise environmental, social and economic gains while maintaining a diverse and dynamic UK market and manufacturing base. The work of the Automotive Council, a collaborative partnership between industry and government,
is making the UK a more attractive location for automotive investment.
The EU’s new car CO2 regulation has indeed set ambitious targets for the transformation of vehicle use in 2020 and beyond. This is especially challenging if population and GDP growth continue to rise. Stable levels of new car and van demand and a growing car parc will drive strong growth in road traffic. It is also expected that there will be continuity and sustainability in government’s fiscal regimes for the automotive sector in the UK and for all motorists. These factors will be crucial if the UK car market is to transform and adapt to the challenges of ultra low CO2 travel.
The SMMT 2015 New Car CO2 Report shows that the UK new car market is set on a solid trend, but we do not underestimate the scale of the challenges further to develop, market and transform the UK new car market and the car parc to 2030 and beyond.
Contents
1. Summary
2. Average New Car CO2 Emissions
3. Market Trends
4. Drivers of Development
5. New Light Commercial Vehicle Average CO2
Emissions
6. Future Challenges and Opportunities
SUMMARY
The 14th New Car CO2 Report explores key developments of the automotive industry in 2014. It outlines UK automotive performance relating to CO2 emissions, market trends and the different drivers of development. For more detailed findings and regular updates see http://www.smmt.co.uk/
• Average new car CO2 emissions are continuously declining. In 2014, CO2 emissions fell for the 17th consecutive year to 124.6g/km, 2.9% lower than the 2013 average (128.3g/km) and 24% lower than the 2007 average (164.9 g/km). The 2014 UK new car CO2 average is 4.2% below the 130g/km 2015 pan-EU target.
• The UK new car market recorded strong demand growth in 2014, up 9.3% since 2013. Between 2011 and 2014 new car registrations grew by more than 0.535 million to reach 2.476 million, a 27.6% increase in registrations.
• CO2 reductions are noted in all fuel, segment and sale types in 2014, in which all registrations grew year-on-year. Key trends include greater fuel efficiency of new engines, an increase in the uptake of alternative fuelled vehicles (AFVs), and a market shift to lighter cars and more compact engines. Moreover, diesel and petrol vehicles still constitute the majority of new car registrations.
• The total volume of alternative fuelled vehicles grew from just over 16,000 in 2007 to nearly 52,000 in 2014, a three-fold increase, and a 58.1% increase since 2013. The bulk of this growth remains in hybrids, however significant improvements are witnessed in the electric vehicle segment.
• The most recent estimate for car parc CO2 average for 2014 is 156.6 g/km, down by 2.3% on the 2013 average (160.2 g/km) and a 3.6 g/km difference in comparison to the 2014 new car CO2 average.
• New light commercial vehicles’ average CO2 emissions fell to 182.4g/km in 2014, decreasing by 1.8% since 2013 and by 3% since 2012.
• The UK government has played a significant role in supporting the industry’s CO2 reduction strategies. In 2014, key initiatives included the continued work of the Office for Low Emission Vehicles, opening of the Advanced Propulsion Centre and the development of the ‘Go Ultra Low’ campaign.
• Key drivers of change towards CO2 reductions and decarbonising transport are also ambitious EU target and UK policies, greater collaboration between government and industry as well as continued investment in R&D and new technology.
• Looking forward, the automotive industry will continue to face new challenges and opportunities – demographic changes, increasing safety requirements, stricter environmental regulation, urbanisation, as well as the rise of alternative powertrain technologies and increasingly connected and autonomous vehicles.
Glossary
AFV Alternative Fuelled Vehicle
APC Advanced Propulsion Centre
CO2 Carbon Dioxide
DfT Department for Transport
EV Electric Vehicle
g/km grams per kilometre
GTR Global Technical Regulation
HFCV Hydrogen Fuel Cell Cars and Vehicles
KERS Kinetic Energy Recovery System
LCV Light Commercial Vehicle
OEM Original Equipment Manufacturer
OLEV Office for Low Emission Vehicles
R&D Research and Development
ULEV Ultra Low Emission Vehicles
ULEZ Ultra Low Emission Zone
VED Vehicle Excise Duty
WLTP World Harmonised Light Vehicles Test Procedure
WLTC World Harmonised Light vehicles Test Cycle
Page 4 | New Car CO2 Report THE SOCIETY OF MOTOR MANUFACTURERS AND TRADERS THE SOCIETY OF MOTOR MANUFACTURERS AND TRADERS New Car CO2 Report | Page 5
AVERAGE NEW CAR CO2 EMISSIONS
UK average new car CO2 emissions are at an all-time low, falling to 124.6g/km in 2014. This represents 2.9% decrease on 2013 (128.3 g/km) and a 24% fall from average new car CO2 emissions levels in 2007 (164.9 g/km). The 2014 UK new car CO2 average is below the EU 130g/km 2015 target by 5.4 g/km or 4.2%. The average rate of CO2 emissions reduction since 2007 has been 3.5%, a significant improvement compared with a 1.3% average reduction between 2000 and
2007. However, to reach the EU 2020 new car CO2 target of 95g/km, this reduction needs to average approximately 4.2% per year. Furthermore, the cost associated with eliminating one unit of pollution, will rise for each further gram of CO2. The easiest gains seem to have already been made, and looking forward we may expect the average rate of new car CO2 emissions to reduce at a slower pace.
181.0
164.9
128.3 124.6 130.0
95.0 75
100
125
150
175
200
2000 2007 2013 2014 2012-15 EU new car target
2020 EU new car target
CO
2 g/k
m
Chart 1 Average new car CO2 vs EU new car targets
Complementing the EU’s focus in reducing CO2 emissions, regulation has also focussed on the reduction of other pollutant emissions to improve air quality. Successive legislation through Euro standards has tightened emission limits for a range of pollutants over time. Euro 6, the latest regulation, was introduced 1 September 2014 and is mandatory for the registration and sale of new types of cars as of 1 September 2015, and vans a year later. The automotive industry has made significant strides in reducing overall vehicle emissions over recent years, simultaneously responding to the issue of air quality and climate change. With progressively stricter Euro standards together with strict CO2 legislation there have been real improvements.
The UK new car market recorded strong demand growth in 2014, up 9.3% on 2013 and above pre-recession levels. From 2011 to 2014 car registrations grew by over 0.535 million to reach 2.476 million, a 27.6% increase in registrations. Sales to private buyers accounted for two-thirds of the overall growth in volume. This three year period featured a significant growth in the availability and take-up of AFVs, zero and ultra low emission cars. SMMT estimates also show used car sales volumes grew by 0.22 million between 2011 and 2014 to a level of 7.19 million. This implies a distinct switch at the margin to buying new rather than used cars, specifically, two new for every one used car.
Chart 2 UK new car registrations
1700
1800
1900
2000
2100
2200
2300
2400
2500
2600
2007 2008 2009 2010 2011 2012 2013 2014
Reg
istr
atio
ns in
000
s
Table 1 Data Summary
2000 2007 2013 2014
Total 181.0 164.9 128.3 124.6Registrations (000s) 2,222 2,404 2,265 2,476
DefinitionsHybrid – a hybrid vehicle uses two or more distinct power sources to move the vehicle, eg petrol and electricity.
ULEV - an ultra low emission vehicle produces 75g/km or less of CO2. At the moment, all cars that achieve this use electric power directly to turn the wheels at least some of the time, from a 100% electric car to a plug-in hybrid and a range-extended electric vehicle.
Plug-in hybrid EV – is a hybrid electric vehicle which utilises rechargeable batteries, or another energy storage device, that can be restored to full charge by connecting a plug to an external electric power source.
DisclaimerThis publication contains general information and, although SMMT endeavours to ensure that the content is accurate and up-to-date at the date of publication, no representation or warranty, express or implied, is made as to its accuracy or completeness and therefore the information in this publication should not be relied upon. Readers should always seek appropriate advice from a suitably qualified expert before taking, or refraining from taking, any action. The contents of this publication should not be construed as advice or guidance and SMMT disclaims liability for any loss, howsoever caused, arising directly or indirectly from reliance on the information in this publication.
SUMMARY
Page 6 | New Car CO2 Report THE SOCIETY OF MOTOR MANUFACTURERS AND TRADERS THE SOCIETY OF MOTOR MANUFACTURERS AND TRADERS New Car CO2 Report | Page 7
AVERAGE NEW CAR CO2 EMISSIONS
The graph below demonstrates a market shift towards lower emitting vehicles representing a higher share of the market. In 2000, only 0.9% of new cars registered fell under the 130g/km band, the 2015 EU target. This proportion
has significantly increased since, and in 2014 68.6% of UK new cars emitted less than 130g/km of CO2. This is an important improvement which illustrates that the UK is working towards reaching EU set targets.
Chart 3 CO2 distribution by VED bands
Chart 4 Electric vehicle registrations 2010 - 2014
0%
5%
10%
15%
0 55 65 75 85 95 105
115
125
135
145
155
165
175
185
195
205
215
225
235
245
255
256
275
285
295
301+
Mar
ket S
hare
CO2 g/km
2000 2007 2013 2014
2014 also witnessed significant growth in demand for alternative fuelled vehicles. Improvements were especially seen in the greater uptake of pure and other electric vehicles, which is linked to stronger incentives and regulation as well as improved consumer demand. New car registrations for plug-in electric vehicles grew four-fold, from 3,586 in 2013 to 14,498 in 2014. Consumers are increasingly aware of the environmental costs
of transport emissions, and there has been a greater push from government to encourage buyers through financial incentives. An example is the Car and Van Plug-In Grant, in which the UK offers up to £5,000 in grants for electric and plug-in cars and up to £8,000 for vans, along with tax exemptions. Moreover, hybrid vehicles saw a significant increase in 2014 and remain dominant, driving the AFV market forward.
Note: other electric – plug-in hybrid and range-extenders
Num
ber
of r
egis
trat
ions
0
10000
20000
30000
40000
50000
60000
2010 2011 2012 2013 2014
Petrol/electric hybrid Diesel/electric hybrid Other electric Pure electric
MARKET TRENDS
a. Fuel TypesCO2 reductions were achieved across all fuel types in 2014. The increasing availability and uptake of alternative fuelled vehicles (AFVs) will be a key feature in 2014 and will be a critical factor in driving down CO2 emissions in the future. AFV registrations rose by 58.1% from the previous year. In addition, the registration of electric vehicles has risen, experiencing higher figures across the four main categories: pure
electric vehicles, plug-in hybrid, range-extender hybrid and hybrid electric vehicles. However, due to petrol and diesel engines becoming cleaner and less polluting, reductions can be attributed to all fuel types. Diesel and petrol vehicles still constitute the majority of new car registrations and have continued to rise in 2014, with diesel car sales outperforming petrol sales for the fourth consecutive year.
Chart 5 Mean CO2 per fuel type Chart 6 Registrations per fuel type
The Shift towards DieselMarket penetration of diesel has strengthened in almost all car segments since 2005 and in the majority of cases it is the leading fuel type. Diesel has grown in prominence largely due to
its greater fuel efficiency, enhanced availability and refinement. Diesel emits less CO2 levels than petrol or other gas engine vehicles. Moreover, diesel tends to be the preferred fuel for larger vehicle types, while for mini and sport vehicles petrol dominates.
Chart 7 Diesel share by segment
0%
25%
50%
75%
100%
A MINI B SUPERMINI C LOWERMEDIUM
D UPPERMEDIUM
E EXECUTIVE F LUXURYSALOON
GSPECIALIST
SPORTS
H DUALPURPOSE
I MULTIPURPOSEVEHICLE
2005 2010 2014
Mar
ket S
hare
0
20
40
60
80
100
120
140
160
180
2007 2010 2013 2014
CO
2 g
/km
AFV DIESEL PETROL
0 10 20 30 40 50 60 70 80 90 100
0
200
400
600
800
1000
1200
1400
1600
2007 2010 2013 2014
000’
s
Reg
istr
atio
ns in
000
’s
DIESEL PETROL AFV (on right axis)
0
20
40
60
80
100
120
140
160
180
2007 2010 2013 2014
CO
2 g
/km
AFV DIESEL PETROL
0 10 20 30 40 50 60 70 80 90 100
0
200
400
600
800
1000
1200
1400
1600
2007 2010 2013 2014
000’
s
Reg
istr
atio
ns in
000
’s
DIESEL PETROL AFV (on right axis)
Page 8 | New Car CO2 Report THE SOCIETY OF MOTOR MANUFACTURERS AND TRADERS THE SOCIETY OF MOTOR MANUFACTURERS AND TRADERS New Car CO2 Report | Page 9
MARKET TRENDS MARKET TRENDS
The table that follows (Table 2) shows the best selling model in 2014, in each segment, and a petrol and diesel version have been chosen to reflect an equivalent trim and power rate where possible. It shows that diesels on average emit between 1% and 28.5% less CO2 than their petrol equivalent.
Table 2 Best selling model in 2014 by fuel type
Market Sector Line Model Registrations in 2014
Petrol Model CO2
Diesel Model CO2
Difference
A MINI HYUNDAI i10 25,030 108 n/a n/a
B SUPERMINI FORD FIESTA 131,254 99 98 1.0%
C LOWER MEDIUM FORD FOCUS 85,140 114 109 4.4%
D UPPER MEDIUM BMW 3 SERIES 38,649 147 118 19.7%
E EXECUTIVE MERCEDES C CLASS 31,525 124 113 8.9%
F LUXURY SALOON MERCEDES S CLASS 2,789 207 148 28.5%
G SPECIALIST SPORTS MERCEDES SLK 5,451 151 132 12.6%
H DUAL PURPOSE FORD KUGA 24,353 154 139 9.7%
I MULTI PURPOSE CITROEN C4 PICASSO 19,164 145 105 27.6%
However, it is important to allocate the right fuel type to the specific vehicle use. Dual and multi-purpose vehicles tend to use diesel for greater fuel efficiency when driving long distances, which is similar for light commercial vehicles. Mini and supermini segments experience lower diesel penetration, as they tend to drive shorter journeys and can benefit more from petrol vehicles due to their lower purchase cost.
b. SegmentsCO2 emissions have decreased across all nine segments1 in 2014. The segment range from Mini to Upper Medium vehicles continue to emit the lowest CO2, illustrated below. Although Luxury and Dual Purpose segments still produce the most CO2, there have been significant improvements in these segments since 2000.
Chart 8 Mean CO2 by segment
0
50
100
150
200
250
300
350
Mini Supermini Lower Medium
Upper Medium
CO
2 g/k
m
Executive Luxury Sports Dual Purpose
MPV
2000 2007 2014
1 The SMMT uses a classification system to recognise different segments of vehicles within the UK. This classi-fication system relates to style and body size and varies from small to large with special categories assigned to certain ‘cross-over’ vehicles. See the SMMT website for more details, at: http://www.smmt.co.uk/
In 2014, ultra low emission vehicles, which by definition produce 75g/km or less of CO2, were available in each of the nine segments, providing more choice to buyers. Moreover, five of the nine categories featured models with zero-emission capabilities. This increasing diversity
and availability of products, including smaller vehicles and those within the dual purpose and MPV segments, has helped to drive demand and has seen a shift away from once popular larger family cars.
c. UK Car Parc The decade from 1997 to 2007 recorded consistent growth in the total UK car parc. Average annual growth was 1.75% and the level of all cars in circulation, as measured by SMMT, increased by 4.93 million to 31.106 million, implying robust and consistent growth in car ownership and availability. Between 2007 and 2014 the net growth in the UK car parc more than halved to an annual average of 0.7%. The consistent inflow of newer and increasingly more durable cars, the effects of the recent recession on new and used cars sales and the 2009/10 scrappage scheme are some of the factors affecting the UK car parc. By 2014, the car parc level reached 32.61 million, up by 4.8% since 2007, as buyers focused on new rather than used cars.
The earliest SMMT estimate of the average car CO2 for all cars in circulation was 169.3g/km in 2010. SMMT estimated that at the end of 2013
the average CO2 rating for all cars in the parc was 160.2g/km, about 25% above the equivalent new car CO2 average. The 2014 estimate for the car parc CO2 average is 156.6 g/km. The 2014 average is down by 1.4% on 2013 (160.2 g/km) and a 33.4 g/km difference in comparison to new cars CO2 average. About 5% of cars in circulation have no recorded CO2 rating.
The average age of a car in circulation in Britain has increased to 7.8 years in 2014, from 6.8 years in 2007. While car availability and ownership has continued to grow, the after-effects of the major recession of 2008/09 saw substantial growth in new car leasing and rental-for-use ownership patterns. This will now begin to affect the timing and nature of returned cars and the remarketing of two to four year-old ex-lease cars and so the trading relationships in the used to new car markets. Recent trends to 2014 are shown in the chart below; the increased volumes of returned used cars to be matched with buyers may begin from 2015/16.
Chart 9 New and used car sales 2001 to 2014 - volumes in millions
4.00
5.00
6.00
7.00
8.00
9.00
1.75
2.00
2.25
2.50
2.75
3.00
2001 2002
2003 2004
2005 2006
2007 2008
2009 2010
2011 2012
2013 2014
2015 2016
used new
New New 7 year average Used Used 7 year average
d. EU ComparisonsIn 2013, average CO2 emissions of newly registered cars in the EU was 127 g/km and UK emissions are on par with the EU average. However, the rate varies among member states, with Germany, Sweden and Austria at the upper
end (135 g/km; 135 g/km; 132 g/km) and the Netherlands, Denmark and Portugal at the lower end (109 g/km; 113 g/km; 114 g/km)2. Market structures of different EU countries vary in size, preferences, and fuel and segment type mixes.
2 ACEA, Pocketbook 2014
Page 10 | New Car CO2 Report THE SOCIETY OF MOTOR MANUFACTURERS AND TRADERS THE SOCIETY OF MOTOR MANUFACTURERS AND TRADERS New Car CO2 Report | Page 11
Source: ACEA, 2014 Pocketbook
Diesel continues to dominate the passenger car market in the EU. In 2013, 53% of all newly registered cars were diesel. It is also relevant to note that hybrid vehicles are also increasing and in 2013 1.6% of all new car sales in the EU
were hybrid-electric. Although this is relatively low, it is increasing and is more than twice as high compared to two years ago. Hybrid-electric vehicles are most popular in the Netherlands, making up 9.7% of the market share in 2013.
0
20
40
60
80
100
120
140
160
EU-28
UK
Germ
any
France
Ita
ly
Spain
Belgium
Nether
lands
Austria
Sweden
Denm
ark
Portu
gal
Finland
Irelan
d
Greec
e
Luxem
bourg
Ave
rage
CO
2 g/k
m
Chart 10 Average CO2 g/km (2013) by EU country
MARKET TRENDS DRIVERS OF DEVELOPMENT
The UK automotive industry is committed to improving technology and efficiency of its products to deliver reductions in CO2 emissions. However, it is crucial that all stakeholders, including policy makers, regulators and consumers help drive the necessary development – taking on an integrated approach to successfully reduce CO2 emissions.
a. Government
Support for Ultra Low Emission VehiclesContinued support for Ultra Low Emission Vehicles by government has been central to the growth of the early market of these vehicles and investment in R&D for new low carbon technologies. £500 million has been committed by government for ultra low emission vehicles from 2015 to 2020. The Office for Low Emission Vehicles (OLEV) published its initial plan of how this funding would be allocated in April 2014. Key elements of this funding are outlined below:
• £200 million for the continuation of consumer grants to support ULEV uptake, with the current £5,000 grant remaining in place until at least 50,000 ULEVs have been sold or 2017, whichever is the sooner. £30 million to support other vehicles including vans.
• A city scheme with up to £35 million allocated to two to four cities for supporting a step change in ULEV uptake was announced.
• £20 million for local authorities to introduce ULEV taxis and £30 million for low emission buses.
• £32 million to fund electric vehicle charging infrastructure, alongside £4 million for gas refuelling stations.
• £100 million for supporting research and development in ULEV technology.
Almost 15,000 plug-in car grants were issued in 2014, a threefold increase on the previous year, while more than 25,000 plug-in car and van grant claims submitted since consumer incentives began in 2010.
Government ProcurementA significant announcement in conjunction with OLEV in 2014 was a £5 million government fleet procurement programme to support the uptake of ULEVs within central government fleets. There
are also plans to roll out the scheme to other public service providers, including local councils, the police and the NHS. This project is the first step in plans to make ultra low emission vehicles commonplace in government fleets.
Advanced Propulsion CentreIn November 2014, the Automotive Council opened the Advanced Propulsion Centre (APC) at the University of Warwick, a £1 billion 10-year commitment, to harness future technologies in the next generation of eco-efficient engines and ULEV vehicles. Funding rounds for projects involved with the APC are announced twice a year and currently four projects have been allocated funding, including the continued development of Ford’s EcoBoost engine and GKN’s motorsport energy recovery technology.
Roads Investment Strategy The Roads Investment Strategy (RIS) announcement at the 2014 Autumn Statement saw a £15 billion public funding commitment for the improvement of UK roads between 2015 and 2020, with provision to install rapid-charging points approximately every 20 miles on 95% of the Strategic Road Network. Alongside this, £100 million has been allocated for issues related to air quality.
London Ultra Low Emission ZoneIn 2013 the Mayor of London announced plans for introducing an Ultra Low Emission Zone in central London by 2020. In 2014 the Mayor announced additional measures for taxis and private hire vehicles with the aspiration to have newly licensed taxis and private hire vehicles to be “zero emission capable” from 2018. A consultation was launched in October 2014 which outlined the plans and proposed vehicle standards for entry into the ULEZ. In March 2015 the Mayor of London confirmed these plans and the introduction of an Ultra Low Emission Zone in central London from 7 September 2020.
b. Vehicle Excise Duty and other Motoring TaxesVED rates for cars, motorcycles and the main rates for vans increased by RPI from 1 April 2015. Table 3 shows the effective VED rates from April 2015 for new and existing cars in the parc and includes an analysis of the individual and cumulative shares of all new cars and all parc
Page 12 | New Car CO2 Report THE SOCIETY OF MOTOR MANUFACTURERS AND TRADERS THE SOCIETY OF MOTOR MANUFACTURERS AND TRADERS New Car CO2 Report | Page 13
cars by the current VED bands. More than two in three new cars pay no VED and almost one in five existing cars pay £30 or less. Since April 2010 new car VED has remained £0 for a car emitting up to CO2 130g/km. Also, for existing cars the three rate values up to CO2 120 g/km have not changed and the value for the CO2 band 121 to 130g/km is up by just £20 from £90
to £110. The overall CO2 banding structure of new and existing car VED regime has remained stable. Most motorists would recognise this as a welcome stability during a period of significant increases in total household and business costs. The VED rate for a Band G car was £155 at June 2010. By April 2015 it was £180, a rise of £25 in five years.
DRIVERS OF DEVELOPMENT DRIVERS OF DEVELOPMENT
Chart 11 VED bands and new car market share 2000 – 2014
0% 10% 20% 30% 40% 50% 60% 70% 80% 90% 100%
2000
2007
Market share
2013
2014 A (to 100)
B (101-110)
C (111-120)
D (121-130)
E (131-140)
F (141-150)
G (151-165)
H (166-175)
I (176-185)
J (186-200)
K (201-225)
L (226-255)
M (Over 255)
0% 20% 40% 60% 80% 100%
2000
2007
2012
2013
Market share
A (Up to 100) - £0/£0
B (101-110) - £0/£20
C (111-120) - £0/£30
D (121-130) - £0/£105
E (131-140) - £125/£125
F (141-150) - £140/£140
G (151-165) - £175/£175
H (166-175) - £285/£200
I (176-185) - £335/£220
J (186-200) - £475/£260
K (201-225) - £620/£280
L (226-255) - £840/£475
M (Over 255) - £1,065/£490
VED Band (CO2 values) – 1st year/standard VED rate
Table 3 UK VED graduated car regime bands and rates 2015/16 and shares of new cars & car parc
Car Parc year end 2014 Rate: £ New cars in 2014 Rate: £
CO2 values Band All Parc % All Parc cumulative % Standard All new % All new
cumulative % First Year
<=100 A 3.3 3.3 0 17.7 17.7 0
101 - 110 B 4.7 8.0 20 15.9 33.6 0
111 - 120 C 8.4 16.4 30 20.7 54.3 0
121 - 130 D 7.7 23.8 110 14.3 68.6 0
131 - 140 E 12.9 36.7 130 11.4 80.6 130
141 - 150 F 12.2 48.9 145 6.8 86.7 145
151 - 165 G 16.4 65.3 180 6.5 93.2 180
166 - 175 H 7.2 72.5 205 2.2 95.4 295
176 - 185 I 5.8 78.3 225 1.3 96.8 350
186 - 200 J 5.7 84.0 265 1.4 98.2 490
201 - 225 K 5.0 89.1 290 1.0 99.2 640
226 - 255 L 3.1 92.1 490 0.5 99.6 870
>255 M 2.9 95.0 505 0.4 100 1,100
unknown 5.0 100
The implication in terms of stable nominal total revenues from VED on all vehicles, but declines in real terms is summarised in table 4 . The graduated car VED regime now accounts for
81% of all VED. Vans and cars with no CO2 rating comprise the other significant aspect, at just below 13%.
Table 4 UK net total VED receipts from all vehicles
2001/02 2011/12 2014/15
Graduated VED all cars 400 4,180 4,850
of which new cars - 210 170
Private and Light Goods (PLG) 3,500 1,270 750
All VED all vehicles/licences 4,320 5,860 6,000
Table 5 UK capital allowances CO2 bands/rates and percentage shares of all new cars and car parc
to 95g/km 18% - 96 to 130 g/km
131 g/km and over
allowance type
100% first year
allowancestandard
allowancespecial
allowance
All car parc at 2014 1.1% 18.5% 80.4%
All new cars in 2014 6.4% 62.2% 31.4%
Table 6 Company car taxation regime 2013 to 2019P and 2014 parc and new cars shares in total
CO2 g/km
2013/ 14
All Parc
All New
2015/ 16
2017/ 18*
2019/ 20
appropriate percentage of car list price taxed
0 0 0.03% 0.27% 5 9 16
<=50 5 0.04% 0.31% 5 9 16
51-75 5 0.01% 0.08% 9 15 19
76-94 10 0.36% 2.19% 13 17 22
95-99 11 0.65% 3.52% 14 18 23
100-104 12 2.21% 11.34% 15 19 24
105-109 13 1.58% 6.82% 16 20 25
Source: DVLA financial data and SMMT estimates
Capital Allowances Since 2009 capital allowances, a cost relief for business investment against taxable profits, has been referenced to cars CO2 ratings and their status, new or used. The rates and corresponding CO2 reference ratings for cars were stable from 2009 to 2013, but changed from 2013. The current rates are referenced to CO2 ratings to 95g/km, 96 to 130, and 131 and over. A first year allowance is set at 100% for new cars with ratings up to 95g/km; 18% for the main pool of 96 to 130g/km and 8% for the special pool of 131 and over. At Budget 2014 the coalition government extended the First Year Allowance for a further three years until 31 March 2018. From April 2018, the carbon dioxide emissions threshold will be cut from 95 g/km to 75 g/km. The table below, table 5, illustrates the car capital allowances regime and its distribution in terms of the UK car parc at the end of 2014 and new car registrations in 2014.
Company Car Tax Company car tax has been linked to cars CO2 ratings since 2002. Company cars typically have replacement cycles of up to three years, though in some cases these have lengthened, possibly due to the recession. Also, since 2010, the regime has set significant benefit-in-kind incentives for those businesses and employees using zero and ultra low emission vehicles. These incentives change and diminish significantly over the next five years. The essence of the changes is summarised in Table 6. By 2019/20 current plans for the regime are for a 25% median-point of an appropriate percentage of list price at a CO2 rating of 105 to 109 – near the EU new car CO2 regulation’s 95g/km EU-wide market average specification. At 2013/14 the equivalent median tax-point was 165 to <=169 g/km. When the regime was first set in 2002/03 the appropriate percentage rate’s 25% median point was referenced to a CO2 rating of 215 to 219g/km. By this current tax year 2015/16, significant changes will also affect the lowest CO2 emitting vehicles and by 2019/20 the new or existing parc cars with CO2 emissions of up to 50g/km will see the appropriate percentage of the car’s list price rise from 5% at 2015/16 to 16%.
Source: Budget Statements to March 2015
Page 14 | New Car CO2 Report THE SOCIETY OF MOTOR MANUFACTURERS AND TRADERS THE SOCIETY OF MOTOR MANUFACTURERS AND TRADERS New Car CO2 Report | Page 15
DRIVERS OF DEVELOPMENT DRIVERS OF DEVELOPMENT
c. Alternative Fuelled Vehicles2014 saw a remarkable surge in demand for alternative fuelled vehicles, coupled with increased choice of AFVs and a growing demand for reduced costs and greater efficiency. The total volume of AFVs grew from just over 16,000 in 2007 to nearly 52,000 in 2014, a three-fold increase, and a 58.1% increase since 2013.
Hybrid vehicles, specifically petrol/electric, have driven AFV growth since 2007 and have particularly risen in 2014. There has also been considerable growth in new registrations of pure electric, plug-in hybrids and range-extenders, on the UK market. This illustrates a welcome reception from car buyers to plug-in pure
electric and other electric vehicles; volumes of nearly 6,700 and over 7,800 respectively. The combined total of 14,500 compares to just below 3,600 in 2013. Clearly, as well as continuing efficiency improvements in conventional petrol and diesel engine technology, UK car buyers are beginning materially to embrace the benefits of zero and ultra low emission motoring. The continued increase in AFV registrations, in particular ultra low emission vehicles, is important to contribute to the continual reduction of CO2 emission levels across all vehicles segment types. However, the market share of AFVs is still extremely low relative to the total new car market, constituting just over 2% in 2014. Diesel and petrol cars still represent the majority share of the new car market.
Chart 12 Registration of AFVs
0
10000
20000
30000
40000
50000
60000
2010 2011 2012 2013 2014
Pure electric Diesel/electric hybrid Other electric Petrol/electric hybrid
Num
ber
of r
egis
trat
ions
Electrification to 2020A key outcome for car and road transport is to achieve greater diffusion of alternative fuelled, electric and ultra low emission vehicles into the annual flow of new vehicles into the parc. The Committee on Climate Change (CCC) suggested that it is realistic to assume that by 2030 electric vehicles (EVs) will constitute 60% of new car sales4. Electric and hybrid electric vehicles
comprised 0.7% of the market share in 2008 and grew to 2.2% at the end of 2014. Recent work and a report by Element Energy reviewed this radical vision of the role and development for electric vehicles in the UK new fleet and car parc, (Element Energy’s Pathways to high penetration of electric vehicles, December 2013). Consumer awareness and reticence to consider EVs, capital costs and resale values, on/off cost-pressures from oil prices, range and refuelling
anxieties, infrastructure availability and effective choice were on the agenda as some of the familiar barriers. Three of the many significant recommendations in the work were a need for a continued campaign to raise consumer awareness, keeping the long term need (to 2030) for continued public support to aid the ownership or use of electric vehicles and continued value support to 2030 and providing enhanced infrastructure networks. There has been a significant growth in consumer demand for AFVs. In 2014, nine new models were introduced to the market, with almost 52,000 AFV models registered in the UK in 2014. Ten new models are expected to enter the market in 2015, with high expectations for the continued growth of AFVs, as seen in tables 7 and 8. Moreover,
ULEVs are now featuring in each vehicle segment type which illustrates the increasing availability of ULEVs and enhanced consumer choice. However, AFVs are still represent a modest proportion of the overall market.
Table 7 2014 AFV models
Market Segment Model Fuel Type CO2 g/km
A MINI VOLKSWAGEN UP! ELECTRIC 0
C LOWER MEDIUM AUDI A3 E-TRON PLUG-IN HYBRID ELECTRIC 37
C LOWER MEDIUM VOLKSWAGEN GOLF ELECTRIC 0
G SPECIALIST SPORTS TESLA MODEL S ELECTRIC 0
G SPECIALIST SPORTS BMWi8 PLUG-IN HYBRID ELECTRIC 59
G SPECIALIST SPORTS VOLKSWAGEN XL1 PLUG-IN ELECTRIC HYBRID 24
G SPECIALIST SPORTS PORSCHE PANAMERA PLUG-IN HYBRID ELECTRIC 71
H DUAL PURPOSE HYUNDAI iX35 HYDROGEN/ELECTRIC 0
H DUAL PURPOSE MITSUBISHI OUTLANDER PLUG-IN HYBRID ELECTRIC 44
Table 8 2015 AFV models
Market Segment Model Fuel Type CO2 g/km
B SUPERMINI KIA SOUL ELECTRIC 0
B SUPERMINI VOLKSWAGEN TWIN-UP! PLUG-IN ELECTRIC HYBRID 27
D UPPER MEDIUM FORD MONDEO TITANIUM PLUG-IN ELECTRIC HYBRID 99
D UPPER MEDIUM TOYOTA MIRAI HYDROGEN/ELECTRIC 0
D UPPER MEDIUM VOLKSWAGEN PASSAT GTE PLUG-IN ELECTRIC HYBRID 45
D UPPER MEDIUM VOLVO V60 PLUG-IN ELECTRIC HYBRID 48
F LUXURY SALOON MERCEDES-BENZ S-CLASS PLUG-IN ELECTRIC HYBRID 65
H DUAL PURPOSE VOLVO XC90 PLUG-IN ELECTRIC HYBRID 59
I MULTI PURPOSE VEHICLE TESLA MODEL X ELECTRIC 0
I MULTI PURPOSE VEHICLE MERCEDES-BENZ B-CLASS ELECTRIC 0
Page 16 | New Car CO2 Report THE SOCIETY OF MOTOR MANUFACTURERS AND TRADERS THE SOCIETY OF MOTOR MANUFACTURERS AND TRADERS New Car CO2 Report | Page 17
Go Ultra LowGo Ultra Low, launched in 2014, is a jointly funded partnership between industry and government, including seven OEMs which make up more than 90% of the EV market share, as well as the Office for Low Emission Vehicles and SMMT. The campaign aims to provide information on ultra low emission vehicles to enhance purchase consideration by increasing acceptance and reducing misconceptions of ULEVs, demonstrating that they are a real choice for motorists today. Changes in consumer behaviour are vital to complement technological advancements and can significantly reduce CO2 emissions. Consumers primarily focus
on the cost effectiveness of a vehicle as well as functionality when purchasing a new car. Developing appropriate policies to induce behavioural change is crucial. The campaign has already made an impact, encouraging 50% of the people who engaged with it to consider buying an ULEV, according to independent market research. It also witnessed that 75% of new car buyers have taken action as a result of seeing the campaign, which included seeking out more information, speaking to friends or visiting OEM websites, as well as a 17% reduction in barriers to purchase (around speed, performance and cost) and increased understanding of ULEVs within target audience.
DRIVERS OF DEVELOPMENT
3 Electric vehicle market still not fully charged, ENDS Europe, 5 February 20154 Ibid
European EV MarketEurope’s electric vehicle market grew 37% in 2014, with the UK experiencing the biggest growth of any major market in new plug-in electric vehicles in 20143. This is largely a result of strong policy incentives and support. Although the Netherlands, where significant consumer tax exemptions have been typical, at the end of 2013 saw government incentives cut. This helps to explain the 42% drop in sales in 2014, compared to 2013.
According to ACEA, wider EU-level support can help shift the new market focus from conventional fuel vehicles to electric. It sees the market share of electric vehicles growing between 2 and 8% in 2020s but greater coordination from EU states will be needed. Uniform standards for electric vehicle technology would also help the process4.
Chart 13 Total plug-in EVs 2013 – 2014
0 5,000 10,000 15,000 20,000 25,000
Austria Belgium Bulgaria
Czech Republic Denmark
Estonia Finland France
Germany Greece
Hungary Ireland
Italy Latvia
Netherlands Poland
Portugal Romania Slovakia
Spain Sweden
UK
Number of registrations
2013
2014
Source: ACEA
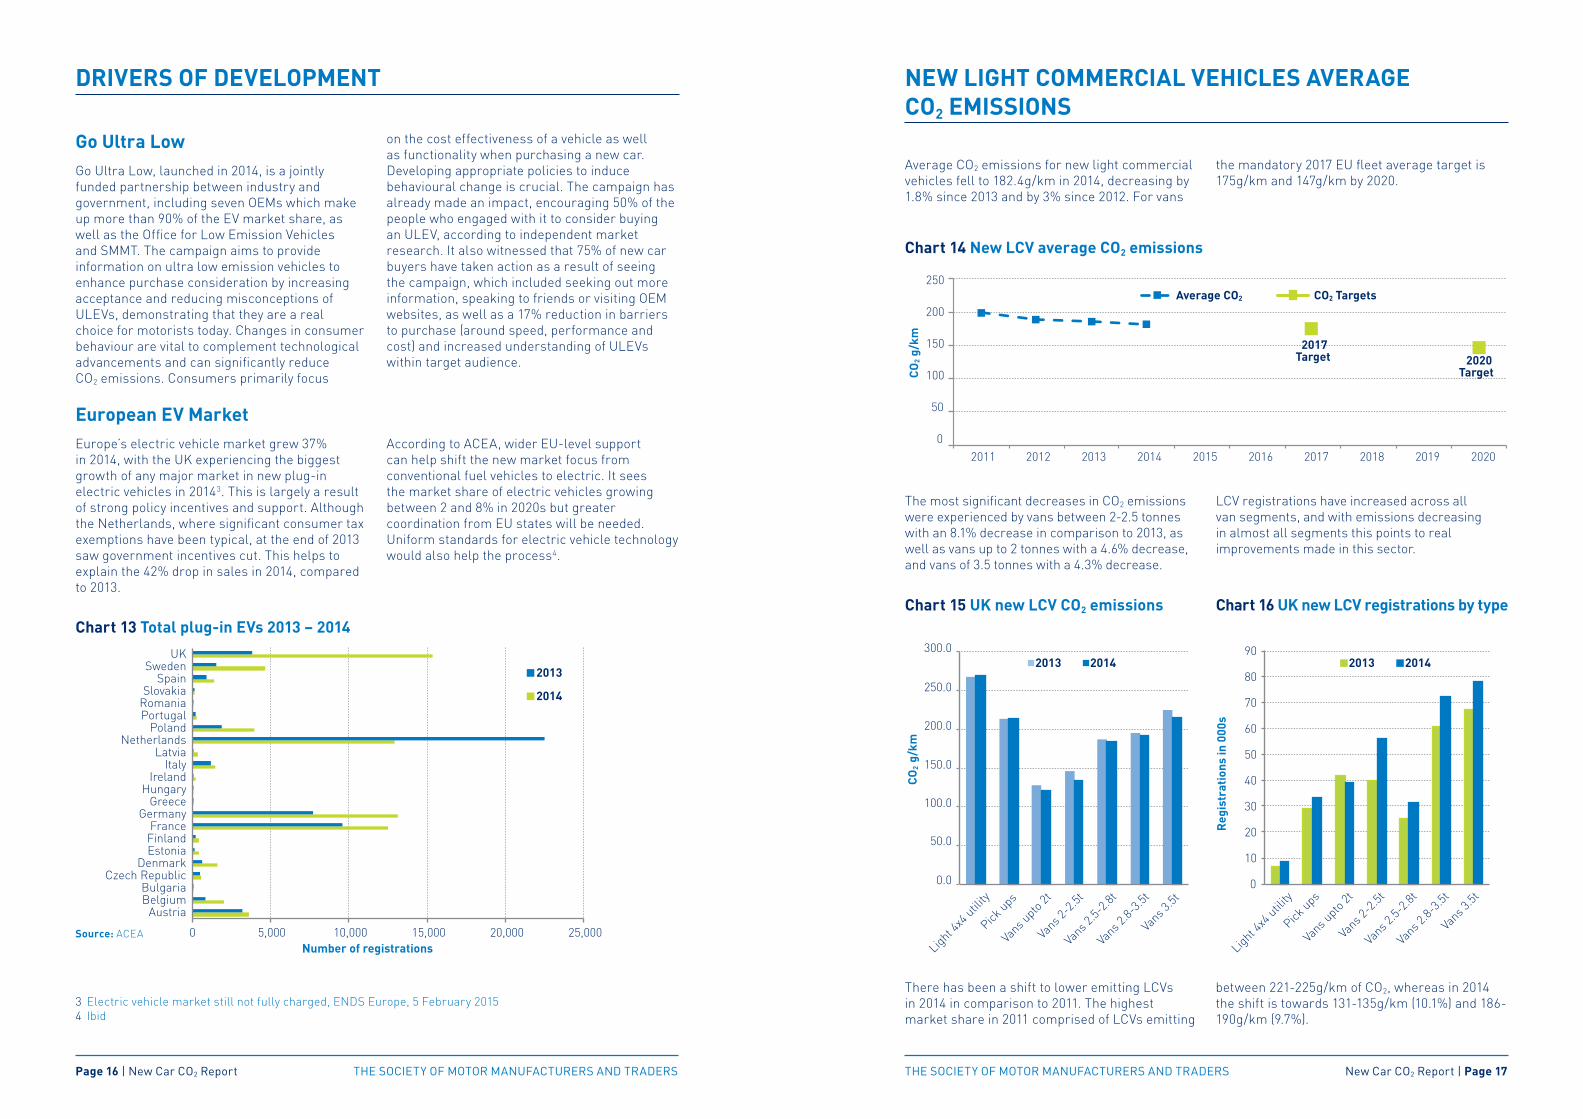
Average CO2 emissions for new light commercial vehicles fell to 182.4g/km in 2014, decreasing by 1.8% since 2013 and by 3% since 2012. For vans
the mandatory 2017 EU fleet average target is 175g/km and 147g/km by 2020.
NEW LIGHT COMMERCIAL VEHICLES AVERAGE CO2 EMISSIONS
The most significant decreases in CO2 emissions were experienced by vans between 2-2.5 tonnes with an 8.1% decrease in comparison to 2013, as well as vans up to 2 tonnes with a 4.6% decrease, and vans of 3.5 tonnes with a 4.3% decrease.
LCV registrations have increased across all van segments, and with emissions decreasing in almost all segments this points to real improvements made in this sector.
Chart 14 New LCV average CO2 emissions
Chart 15 UK new LCV CO2 emissions Chart 16 UK new LCV registrations by type
There has been a shift to lower emitting LCVs in 2014 in comparison to 2011. The highest market share in 2011 comprised of LCVs emitting
between 221-225g/km of CO2, whereas in 2014 the shift is towards 131-135g/km (10.1%) and 186-190g/km (9.7%).
0.0
50.0
100.0
150.0
200.0
250.0
300.0
Light 4
x4 util
ity
Pick ups
Vans u
pto 2t
Vans 2
-2.5t
Vans 2
.5-2.8
t
Vans 2
.8-3.5
t
Vans 3
.5t
2013 2014
CO
2g/
km
Light 4
x4 util
ity
Vans u
pto 2t
Vans 2
-2.5t
Vans 2
.5-2.8
t
Vans 2
.8-3.5
t
Vans 3
.5t
Reg
istr
atio
ns in
000
s
0
10
20
30
40
50
60
70
80
90
Pick ups
2013 2014
Page 18 | New Car CO2 Report THE SOCIETY OF MOTOR MANUFACTURERS AND TRADERS THE SOCIETY OF MOTOR MANUFACTURERS AND TRADERS New Car CO2 Report | Page 19
NEW LIGHT COMMERCIAL VEHICLES AVERAGE CO2 EMISSIONS
In 2011 just four LCVs registered emitted 75 g/km of CO2 or less, a number which rose significantly to 488 in 2014. One reason for the generally low ULEV uptake is that LCVs are primarily functional vehicles bought for specific purposes, and running costs as well as load capacity is a priority for purchase decisions. In recent years there has been a shift to higher payload vans which may constrain the rate of CO2 progress in terms of g/km. However, this may also be a positive development for decarbonisation because using the right size van for a given payload or business role is very important. All being equal, it is much more fuel efficient to use one large van rather than two or more small vans.
There has been support by government to encourage buyers through financial incentives. The plug-in van grant offers up to £8,000 premiums for electric and plug-in LCVs, and since the start of the scheme to 31 January 2015, there were 1,109 plug-in van grant claims. However, there has been a lack of products. For the first two years of the plug-in van grant there was only one product which sold in reasonable volume, the Renault Kangoo. The Nissan ENV launched in 2014 has contributed to the increase in grant claims. As more products are introduced, their market share will grow.
FUTURE CHALLENGES AND OPPORTUNITIES
Looking forward, the automotive industry will continue to face new challenges. Globalisation, urbanisation, demographic changes and rising competition will have an impact, as well as increasing safety requirements, climate change and environmental regulation. We are also witnessing significant technological breakthroughs such as connected and autonomous vehicles and fuel cell hydrogen vehicles. These trends will present both challenges and opportunities to the industry and regulatory framework in the years ahead.
Connected Vehicles Connected vehicles use technology that allows vehicles, traffic signals and road infrastructures to communicate and exchange information, connecting travellers, infrastructure and vehicles. Connected and autonomous vehicles are expected to deliver various social, economic and environmental benefits. According to a report jointly launched by SMMT and KPMG, the economic opportunity is multi-fold; reduced congestion contributing to lower emissions, an estimated 320,000 jobs created by 2030, over 2,500 lives saved and more than 25,000 serious injuries prevented by 2030.
Road and Car Traffic Forecasts to 2040 and CO2 EmissionsThe DfT outlined key factors likely to affect the future development of UK car and road traffic; substantial population growth, GDP and income growth and fuel costs. The report projects that total road traffic will grow to between 303 and 400.8 billion vehicle miles. Cars will continue to comprise the dominant mode of road transport and total van traffic is expected to rise 15-20% by 2040. Total CO2 emissions from all road traffic are forecast to fall by between 3% and 26% from 2010 to 2040. With year on year fuel efficiency improvements expected to ‘flatten out’ from 2025 to 2030 traffic growth sees CO2 emissions rise, but still remain below the 2010 base.
Future Role of Ultra-Low Emission Vehicle IncentivesThe Office for Low Emission Vehicles (OLEV) announced changes to the Plug-in Car Grant from April 2015, that the grant would continue at its current level (up to £5,000 off the purchase price of a vehicle) until 2017 or until 50,000 claims had been made. OLEV has announced the
introduction of three grant categories as below, differentiating ULEVs on the basis of their CO2 emissions and zero emission range:
• Category 1: CO2 emissions of less than 50g/km and a zero emission range of at least 70 miles.
• Category 2: CO2 emissions of less than 50g/km and a zero emission range between 10 and 69 miles.
• Category 3: CO2 emissions of 50-75g/km and a zero emission range of at least 20 miles.
World harmonised Light vehicles Test Procedure2014 saw a key development in the push to replace the existing drive cycle and test method used to determine the vehicle’s CO2 value. The European Commission is developing the regulatory framework to introduce the WLTP into current CO2 regulations, replacing the New European Drive Cycle (NEDC). SMMT welcomes the introduction of the WLTP as a key step in addressing the difference between test cycle CO2 values and those achieved in the real world. The introduction of WLTP does, however, introduce questions on the existing long term 2021 CO2 targets that were set against the existing NEDC and testing procedure, something the European Commission and UK government are investigating in order to maintain the overall level of ambition.
Post-2020 RegimeBy 2021, the EU new car market will have reduced CO2 emissions by almost 42% compared to 2005, becoming one of the most advanced industrial sectors. This is achievable only with a certain level of diesel engine penetration, alongside growing electrification or hybridisation.
A new target must not be set before the NEDC–WLTP transposition is fully implemented and must be based on agreed WLTP procedures. The current legislation is solely focused on vehicle technology; however, a more comprehensive approach is now required, taking into account the usage of the vehicles in the existing fleet in order to accelerate further CO2 emissions reduction. The relative costs of reducing carbon emissions must be similar and proportionate between EU industrial sectors and products between EU industrial sectors and products.
170
175
180
185
190
195
200
0.000%
0.020%
0.040%
0.060%
0.080%
0.100%
0.120%
0.140%
0.160%
2011 2012 2013 2014
Mar
ket S
hare
CO
2 g/k
m
% Electric (on left axis) Mean CO2
Chart 17 Market share of electric LCVs and mean CO2
One in ten of all licensed vehicles is a van and the numbers are expected to keep increasing with total van traffic mileage forecast to continue to grow rapidly over the next 25 to 30 years. Table 9 below shows some recent trends since 1990. Managing CO2 emissions from van traffic is a very challenging task given the wide range of vehicle applications and CO2 characteristics, van choice and cost considerations on the best market applications, efficiency characteristics on loading and responsible driving in use. As with cars it is a comprehensive approach that will be needed, but vehicle suppliers and operators are taking an active lead, backed up by European Commission regulations, operator needs and sustainable business strategies.
Table 9 UK Van Parc (to3.5t gvw), totals at year end 000s & annual van traffic totals billion kms