New constraints on the gas age-ice age difference along the EPICA ice cores, 0-50 kyr L. Loulergue, F. Parrenin, T. Blunier, J.-M. Barnola, R. Spahni, A. Schilt, G. Raisbeck, J. Chappellaz To cite this version: L. Loulergue, F. Parrenin, T. Blunier, J.-M. Barnola, R. Spahni, et al.. New constraints on the gas age-ice age difference along the EPICA ice cores, 0-50 kyr. Climate of the Past, European Geosciences Union (EGU), 2007, 3, pp.527-540. <in2p3-00182753> HAL Id: in2p3-00182753 http://hal.in2p3.fr/in2p3-00182753 Submitted on 27 Oct 2007 HAL is a multi-disciplinary open access archive for the deposit and dissemination of sci- entific research documents, whether they are pub- lished or not. The documents may come from teaching and research institutions in France or abroad, or from public or private research centers. L’archive ouverte pluridisciplinaire HAL, est destin´ ee au d´ epˆ ot et ` a la diffusion de documents scientifiques de niveau recherche, publi´ es ou non, ´ emanant des ´ etablissements d’enseignement et de recherche fran¸cais ou ´ etrangers, des laboratoires publics ou priv´ es.
Transcript
New constraints on the gas age-ice age difference along
the EPICA ice cores, 0-50 kyr
L. Loulergue, F. Parrenin, T. Blunier, J.-M. Barnola, R. Spahni, A. Schilt, G.
Raisbeck, J. Chappellaz
To cite this version:
L. Loulergue, F. Parrenin, T. Blunier, J.-M. Barnola, R. Spahni, et al.. New constraints on thegas age-ice age difference along the EPICA ice cores, 0-50 kyr. Climate of the Past, EuropeanGeosciences Union (EGU), 2007, 3, pp.527-540. <in2p3-00182753>
HAL Id: in2p3-00182753
http://hal.in2p3.fr/in2p3-00182753
Submitted on 27 Oct 2007
HAL is a multi-disciplinary open accessarchive for the deposit and dissemination of sci-entific research documents, whether they are pub-lished or not. The documents may come fromteaching and research institutions in France orabroad, or from public or private research centers.
L’archive ouverte pluridisciplinaire HAL, estdestinee au depot et a la diffusion de documentsscientifiques de niveau recherche, publies ou non,emanant des etablissements d’enseignement et derecherche francais ou etrangers, des laboratoirespublics ou prives.
New constraints on the gas age-ice age difference along the EPICAice cores, 0–50 kyr
L. Loulergue1, F. Parrenin1, T. Blunier2, J.-M. Barnola1, R. Spahni2, A. Schilt2, G. Raisbeck3, and J. Chappellaz1
1Laboratoire de Glaciologie et de Geophysique de l’Environnement (LGGE), CNRS, Universite Joseph Fourier – Grenoble,BP96 38402 Saint Martin d’Heres Cedex, France2Climate and Environmental Physics, Physics Institute, University of Bern, Sidlerstrasse 5, 3012 Bern, Switzerland3Centre de Spectrometrie Nucleaire et de Spectrometrie de Masse (CSNSM), IN2P3-CNRS-Universite de Paris-Sud, Bat 108,91405 Orsay Cedex, France
Received: 14 February 2007 – Published in Clim. Past Discuss.: 5 March 2007Revised: 25 July 2007 – Accepted: 15 August 2007 – Published: 28 August 2007
Abstract. Gas is trapped in polar ice sheets at∼50–120 mbelow the surface and is therefore younger than the surround-ing ice. Firn densification models are used to evaluate thisice age-gas age difference (1age) in the past. However, suchmodels need to be validated by data, in particular for periodscolder than present day on the East Antarctic plateau. Herewe bring new constraints to test a firn densification model ap-plied to the EPICA Dome C (EDC) site for the last 50 kyr, bylinking the EDC ice core to the EPICA Dronning Maud Land(EDML) ice core, both in the ice phase (using volcanic hori-zons) and in the gas phase (using rapid methane variations).We also use the structured10Be peak, occurring 41 kyr beforepresent (BP) and due to the low geomagnetic field associ-ated with the Laschamp event, to experimentally estimate the1age during this event. Our results seem to reveal an over-estimate of the1age by the firn densification model duringthe last glacial period at EDC. Tests with different accumu-lation rates and temperature scenarios do not entirely resolvethis discrepancy. Although the exact reasons for the1ageoverestimate at the two EPICA sites remain unknown at thisstage, we conclude that current densification model simula-tions have deficits under glacial climatic conditions. What-ever the cause of the1age overestimate, our finding suggeststhat the phase relationship between CO2 and EDC tempera-ture previously inferred for the start of the last deglaciation(lag of CO2 by 800±600 yr) seems to be overestimated.
Gas records in ice cores allow one to reconstruct changes inthe atmospheric composition (e.g. Siegenthaler et al., 2005;Spahni et al., 2005; Fluckiger et al., 2002). They also allowto compare between Greenland and Antarctic ice records,when used as correlative tools (Bender et al., 1994; Blunier etal., 1997, 1998; Blunier and Brook, 2001; Steig et al., 2002;Landais et al., 2004). Lastly, their phase relationship withice records provides a constraint on the mechanisms respon-sible for atmospheric composition changes (e.g. Monnin etal., 2001). The second and third application of gas recordscritically depends on uncertainties in the difference betweenthe age of the gas and the age of the surrounding ice matrix(1age) (Schwander et al., 1997).
Different methods are used to determine the ice/gas dif-ference (as a function of age at the same depth – hereafter1age, or as a function of depth at the same age – hereafter1depth) in ice cores: using a firn densification model whichsimulates gas trapping as a function of firn physical proper-ties and climatic conditions (e.g. Arnaud et al., 2000), com-paring a temperature signal recorded both in the ice matrixand in the gas phase (e.g. Severinghaus et al., 1998; Cail-lon et al., 2001), or takingδ15N of N2 as a proxy for theLock-In Depth (LID) where gas diffusion ceases (e.g. Gou-jon et al., 2003; Sowers et al., 1992). The firn densificationmodel requires specific inputs to compute firn density andthus gas trapping, such as the ice chronology and past vari-ations of surface temperature and accumulation rate at thesite of deposition. The most recent versions of these mod-els include heat diffusion in firn and its effect on firn sinter-ing. They are tested against present-day density and temper-ature profiles measured at different sites of Antarctica and
Published by Copernicus Publications on behalf of the European Geosciences Union.
528 L. Loulergue et al.: Gas age-ice age differences along the EPICA cores
Greenland. For the past, usually no present-day analogueexists in terms of temperature and accumulation conditions.Therefore the model output can only be tested against othermethods to determine1age, when available. This is the casein Greenland where1age can also be determined accuratelyin the past, thanks to the abrupt Greenland surface warmingand cooling inducing a temperature gradient in the firn col-umn. This temperature gradient causes isotopically heaviermolecules to migrate towards the cold end (Severinghaus etal., 1998). As the isotopic ratios of atmospheric nitrogen andargon are constant at millennial time scale in the atmosphere,their anomalies set the starting point of surface temperaturechanges in the gas record. With the temperature variation be-ing recorded both in the ice and gas isotopic compositions,1depth is obtained. With an underlying timescale it can betransferred into a1age. Unfortunately, in Antarctica, ther-mal diffusion produces isotope anomalies usually too smallto be detected. In addition, the lower accumulation rate com-pared to Greenland results in larger1age accompanied bymore uncertain1age calculations.
The uncertainty of1age estimates in Antarctica is criti-cal regarding the question of leads and lags between tem-perature and greenhouse gases variations in the past, whichconstrain the mechanisms responsible for these changes. Atthe onset of the last deglaciation (Termination I), based ona firn densification model Monnin et al. (2001) found a lagof 800±600 yr of CO2 versus EDC temperature. Using theSiple Dome ice core and a firn densification model, Ahnet al. (2004) inferred a smaller lag of 210 to 330 yr. Withthe Byrd ice core, Neftel et al. (1988) also inferred a lag of700±500 yr. Fischer et al. (1999) suggested an average lagof CO2 over Vostok surface temperature of 600±400 yr overthe last three Terminations, again using a firn densificationmodel. Lastly, using trends in the36Ar/40Ar isotopic ratioduring Termination III, a lag of CO2 on the Vostok warm-ing during the entire deglaciation was found, with a valueof 800±200 yr (Caillon et al., 2003). Better estimates of the1age are clearly required to ascertain these estimated lags.Some of them result from densification models runs underconditions without present-day analogues.
One way to improve the accuracy of1age estimates inAntarctica is to rely on stratigraphic markers recorded bothin the ice matrix and in the trapped gas in two ice cores. Thisallows the correlation of the ice records in addition to thegas correlation, and thus an evaluation of1age as a functionof time. The10Be anomaly (Raisbeck et al., 2002) providessuch a marker in the ice. It is observed as a highly structuredpeak believed to be due to a low geomagnetic field associatedwith the Laschamp Event (Mazaud et al., 1994), centered at40.4±2 kyr BP (Guillou et al., 2004). Yiou et al. (1997) andRaisbeck et al. (2002) showed that this10Be peak is contem-porary with the Dansgaard-Oeschger event (DO) #10.
Here we present new CH4 data obtained on the EDC icecore (75◦′ S, 123◦ E, 3233 m a.s.l., 25 kg m−2 yr−1) over thelast 55 kyr BP (before AD 1950), that complement recently
published CH4 data along the EPICA Dronning Maud Land(EDML) ice core (75◦ S, 0◦ E, 2892 m a.s.l., 64 kg m−2 yr−1)
(EPICA Community Members, 2006) and a stack of Green-land CH4 records (Blunier et al., 2007). We then evaluatedifferent accumulation and temperature scenarios against theobjective that the1age at EDC and EDML obtained by thedensification model should produce 1) two consistent gas agescales at EDC and EDML; and 2) a North-South synchroni-sation compatible with the one obtained from the10Be peakduring the Laschamp event.
2 Data and models used
2.1 Ice chronologies
When evaluating1age and1depth with a firn densificationmodel, a chronology for the ice has to be imposed.
For the NorthGRIP core, we use the GICC05 chronologyobtained by annual layer counting from 0 to 42 kyr BP (An-dersen et al., 2006; Rasmussen et al., 2006; Svensson et al.,2006; Vinther et al., 2006). The GICC05 age at the locationof the 10Be peak is 41.2±1.6 kyr BP,and matches recent in-dependent estimates within a few centuries (Svensson et al.,2006). Note that the uncertainty on the time spent betweentwo nearby depth levels is smaller than the error on the abso-lute ages, the latter being cumulative with depth.
The new EDC ice chronology (hereafter referred to asEDC3, Parrenin et al., 2007a) is based on a relatively simpleice flow model applicable to ice domes. Several control agewindows are used (from absolutely dated horizons and fromcomparison with other paleoclimate records) to constrain thefree parameters of the model via an inverse method (Parreninet al., 2001). For the last 50 kyr, EDC3 is matched ontoGICC05 (Parrenin et al., 2007a) at several tie points: dur-ing the last 6 kyr (by10Be-10Be synchronization), during thelast deglaciation (by methane-isotope synchronization) andduring the Laschamp event (by10Be-10Be synchronization).
The corresponding chronology for EDML (hereafterEDML1, Ruth et al., 2007) has been derived by synchro-nizing the EDML and EDC ice cores using volcanic hori-zons and dust peaks. The tie points are based on continuoussulphate, electrolytic conductivity, dielectric profiling, par-ticulate dust and Ca2+ data available for both cores (Sev-eri et al., 2007). Due to common changes in the Patagoniandust source strength and the hemispheric significance of ma-jor volcanic eruptions, this procedure is justified. For thelast 75 kyr (the period of interest in this study), the synchro-nization is mainly based on unambiguous volcanic markersrecorded in the sulphate parameter, providing a synchroniza-tion to better than±100 years (on average±35 years, Ruthet al., 2007).
L. Loulergue et al.: Gas age-ice age differences along the EPICA cores 529
2.2 Temperature and accumulation rate parameterizations
1age estimates from a firn densification model (Pimienta etal., 1987; Arnaud et al., 2000; Goujon et al., 2003) requireknowing the history of surface temperature and accumulationrate at the site of deposition. Below we present the temper-ature and accumulation rate parameterizations that will beused further on.
Accumulation rateA and temperatureT are deduced fromthe deuterium content of the iceδD, through the followingrelationships:
T = T 0+ α1δDcor (1)
A = A0 exp(β1δDsmo) (2)
whereA0 andT 0 are surface accumulation rate and temper-ature for the present.1δDcorr corresponds to the present-day valueδD0 isotope corrected for the variations in tem-perature and isotope at the source of the air masses (Par-renin et al., 2007). The latter is determined through iso-topic reconstructions of benthic foraminifera (Bintanja et al.,2005). 1δDsmo is a 50-yr running average of1δDcorr (toremove the noise of water isotopic ratios unrelated with ac-cumulation rate changes).α represents the spatial slopeof the present-day isotopic thermometer andβ representsthe glacial-interglacial amplitude of the accumulation ratechange. Theβ value is estimated at 0.0157 for EDC (Par-renin et al., 2007) and 0.045 for EDML (EPICA CommunityMembers, 2006). This correction factor will be describedand used later on in the manuscript.
At EDML, only δ18O of ice was measured and a syntheticδD record is obtained following:
δD = 8 · δ18O + 10 (3)
The present-day isotopic content, temperature and accumu-lation rates are respectivelyδD0=−396.5‰, T 0=217.5 K,A0=2.84 cm-IE/yr (cm ice equivalent per year) for EDC(Parrenin et al., 2007) andδD0=−351.22‰,T 0=228.65 K,A0=6.4 cm-IE/yr for EDML (EPICA, Community Members,2006).
Furthermore, a positive correction was applied to the EDCaccumulation rate during the early Holocene, in order tomatch EDC3 onto GICC05 during the last deglaciation (seeParrenin et al., 2007, for more details).
The average glacial accumulation rate at EDML drill sitecalculated with Eq. (2) is about 2.9 cm-IE/ year (EPICACommunity Members, 2006), a value not far from the presentone for Dome C (2.84 cm-IE/year) (Parrenin et al., 2007).
2.3 Methane records
We use CH4 records from EDC and EDML back to 55 kyr BP(Fig. 1) (EPICA Community Members, 2006). For EDC, theresolution of the existing methane data (Spahni et al., 2005;
Fig. 1. Methane concentrations at EDML (red line, bottom)and EDC (black line, top) during the last 55 kyr BP. The EDCmethane record consists of results published by Spahni et al. (2005),Fluckiger et al. (2002), Monnin et al. (2001) (Bern data, blue cross),new data doubling the time resolution (LGGE data, red dots) andadditional new data specifically improving the time resolution be-tween the DO #8 and #11 events (LGGE data, brown stars). TheEDML methane data, already published in EPICA CommunityMembers (2006), have been measured at LGGE and Bern.
Black stars and their error bars correspond to the CH4 tie points.Gas ages have been computed with the Goujon/Arnaud model(Goujon et al., 2003) according to scenario 1.
Fluckiger et al., 2002) has been doubled (leading to an aver-age temporal resolution of 93 years, and up to 40 years for theHolocene) and extra samples were analyzed around DO 8 to11 corresponding to the location of the10Be peak (resolutionof about 108 yr, see Supplement1 at http://www.clim-past.net/3/527/2007/cp-3-527-2007-supplement.zip). The mea-surements were performed at Bern and Grenoble with a wetextraction technique. Details of the method can be foundin Chappellaz et al. (1997). For consistency with previ-ously published EDC and EDML CH4 data sets, the CH4mixing ratios obtained at LGGE are increased by 6 ppbvto be in accordance with the Bern values (Spahni et al.,2005). The measurement uncertainty is±10 ppbv (Chap-pellaz et al., 1997). Numerical values are available fromthe NOAA World Data Center for Paleoclimatology (http://www.ncdc.noaa.gov/paleo/data.html).
2.4 The 41 kyr10Be peak in Greenland and Antarctic icecores
10Be has been measured in detail on the EDC (Raisbecket al., 2002; Raisbeck et al., 2007) and GRIP (Yiou et al.,1997) ice cores, depicting the full structure of the peak at41 kyr BP. Two sub-peaks can be clearly identified in thisstructure and serve as synchronization markers between bothcores. The position uncertainty of the two sub-peaks dur-ing the Laschamp event is about±1.1 m (Raisbeck et al.,
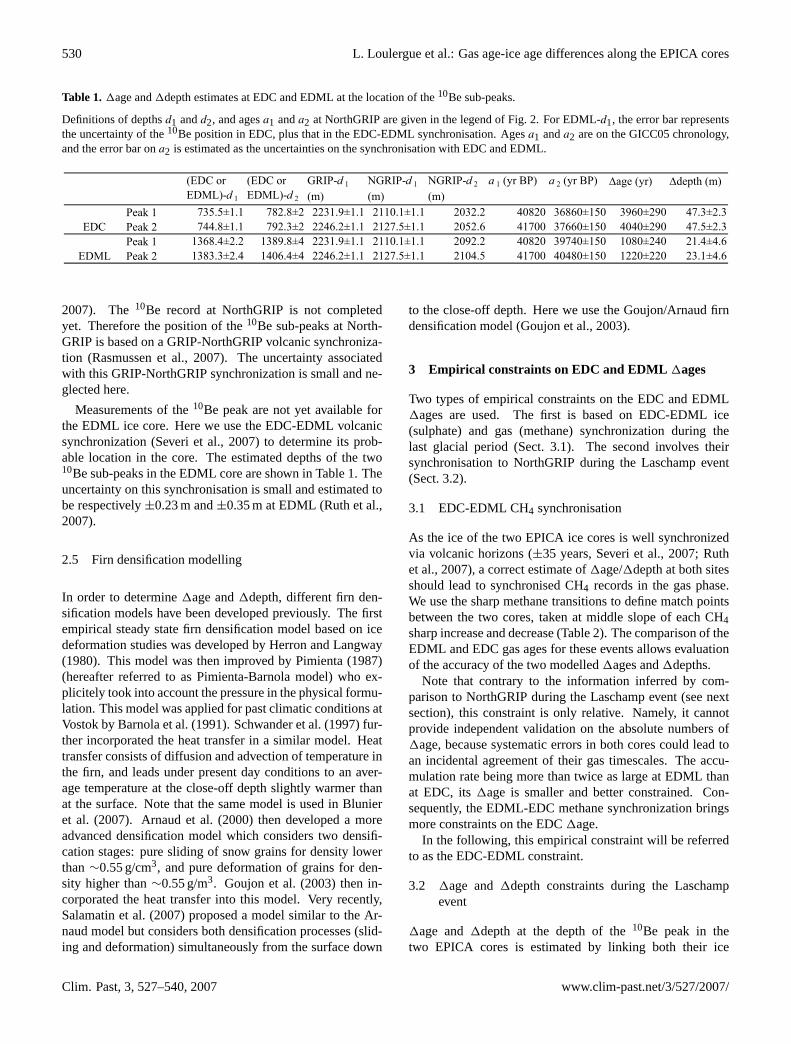
530 L. Loulergue et al.: Gas age-ice age differences along the EPICA cores
Table 1. 1age and1depth estimates at EDC and EDML at the location of the10Be sub-peaks.
Definitions of depthsd1 andd2, and agesa1 anda2 at NorthGRIP are given in the legend of Fig. 2. For EDML-d1, the error bar representsthe uncertainty of the10Be position in EDC, plus that in the EDC-EDML synchronisation. Agesa1 anda2 are on the GICC05 chronology,and the error bar ona2 is estimated as the uncertainties on the synchronisation with EDC and EDML.
2007). The10Be record at NorthGRIP is not completedyet. Therefore the position of the10Be sub-peaks at North-GRIP is based on a GRIP-NorthGRIP volcanic synchroniza-tion (Rasmussen et al., 2007). The uncertainty associatedwith this GRIP-NorthGRIP synchronization is small and ne-glected here.
Measurements of the10Be peak are not yet available forthe EDML ice core. Here we use the EDC-EDML volcanicsynchronization (Severi et al., 2007) to determine its prob-able location in the core. The estimated depths of the two10Be sub-peaks in the EDML core are shown in Table 1. Theuncertainty on this synchronisation is small and estimated tobe respectively±0.23 m and±0.35 m at EDML (Ruth et al.,2007).
2.5 Firn densification modelling
In order to determine1age and1depth, different firn den-sification models have been developed previously. The firstempirical steady state firn densification model based on icedeformation studies was developed by Herron and Langway(1980). This model was then improved by Pimienta (1987)(hereafter referred to as Pimienta-Barnola model) who ex-plicitely took into account the pressure in the physical formu-lation. This model was applied for past climatic conditions atVostok by Barnola et al. (1991). Schwander et al. (1997) fur-ther incorporated the heat transfer in a similar model. Heattransfer consists of diffusion and advection of temperature inthe firn, and leads under present day conditions to an aver-age temperature at the close-off depth slightly warmer thanat the surface. Note that the same model is used in Blunieret al. (2007). Arnaud et al. (2000) then developed a moreadvanced densification model which considers two densifi-cation stages: pure sliding of snow grains for density lowerthan∼0.55 g/cm3, and pure deformation of grains for den-sity higher than∼0.55 g/m3. Goujon et al. (2003) then in-corporated the heat transfer into this model. Very recently,Salamatin et al. (2007) proposed a model similar to the Ar-naud model but considers both densification processes (slid-ing and deformation) simultaneously from the surface down
to the close-off depth. Here we use the Goujon/Arnaud firndensification model (Goujon et al., 2003).
3 Empirical constraints on EDC and EDML 1ages
Two types of empirical constraints on the EDC and EDML1ages are used. The first is based on EDC-EDML ice(sulphate) and gas (methane) synchronization during thelast glacial period (Sect. 3.1). The second involves theirsynchronisation to NorthGRIP during the Laschamp event(Sect. 3.2).
3.1 EDC-EDML CH4 synchronisation
As the ice of the two EPICA ice cores is well synchronizedvia volcanic horizons (±35 years, Severi et al., 2007; Ruthet al., 2007), a correct estimate of1age/1depth at both sitesshould lead to synchronised CH4 records in the gas phase.We use the sharp methane transitions to define match pointsbetween the two cores, taken at middle slope of each CH4sharp increase and decrease (Table 2). The comparison of theEDML and EDC gas ages for these events allows evaluationof the accuracy of the two modelled1ages and1depths.
Note that contrary to the information inferred by com-parison to NorthGRIP during the Laschamp event (see nextsection), this constraint is only relative. Namely, it cannotprovide independent validation on the absolute numbers of1age, because systematic errors in both cores could lead toan incidental agreement of their gas timescales. The accu-mulation rate being more than twice as large at EDML thanat EDC, its1age is smaller and better constrained. Con-sequently, the EDML-EDC methane synchronization bringsmore constraints on the EDC1age.
In the following, this empirical constraint will be referredto as the EDC-EDML constraint.
3.2 1age and1depth constraints during the Laschampevent
1age and1depth at the depth of the10Be peak in thetwo EPICA cores is estimated by linking both their ice
L. Loulergue et al.: Gas age-ice age differences along the EPICA cores 531
Table 2. Depth of the methane tie points for the EDML-EDC gas synchronisation. Tie points are located at the middle of each sharptransition. The specified uncertainty (2σ) on the match has been determined as a function of depth, and then translated to ages using theEDC3 and EDML1 chronologies.
and gas signals to NorthGRIP. The ice link is obtained by10Be-10Be synchronization for both10Be sub-peaks duringthe Laschamp event. The gas link is obtained by matchingthe EPICA CH4 records to the NorthGRIP isotopic record,assuming that these two records are synchronous during therapid DO transitions (Huber et al., 2006; Fluckiger et al.,2004).
3.2.1 The1age method
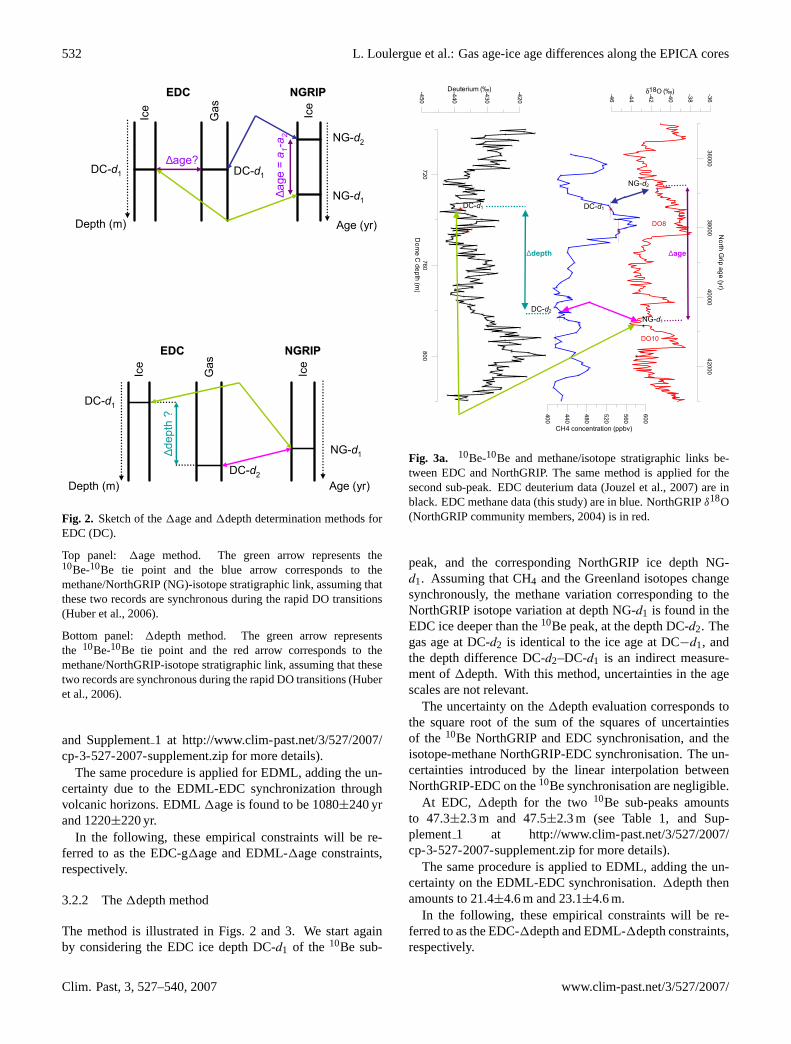
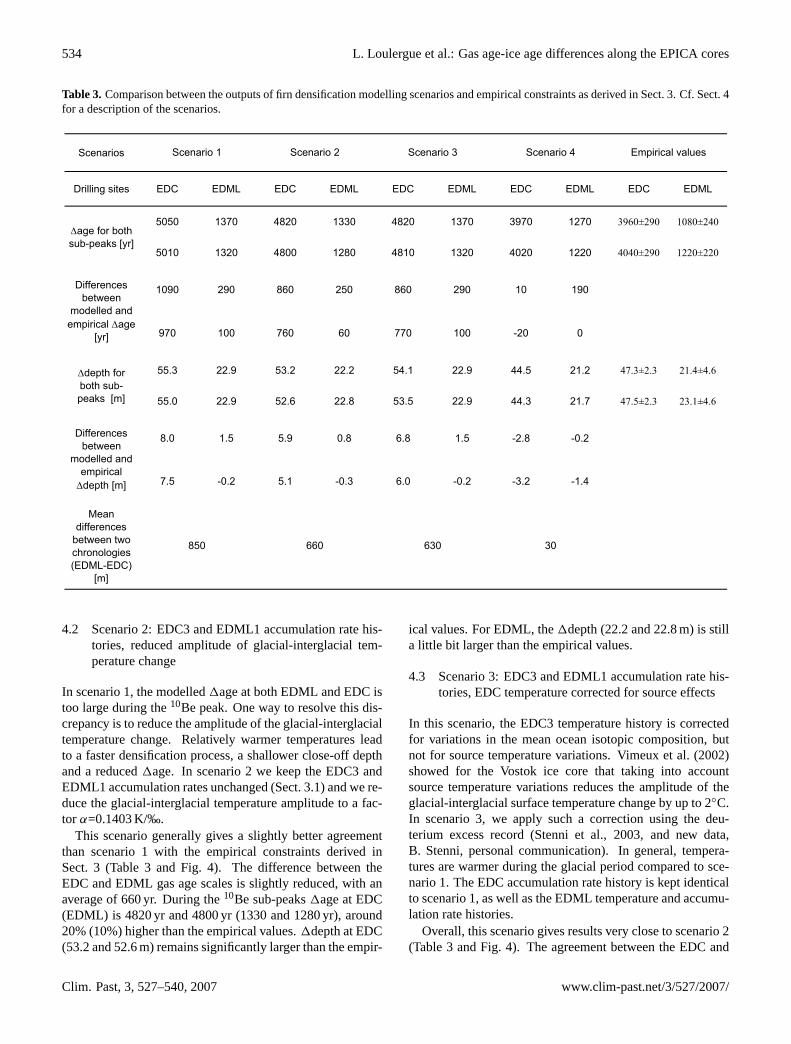
The method is illustrated in Figs. 2, 3a for EDC and 3b forEDML. One of the10Be sub-peaks is found at the ice depthsDC-d1 at EDC and NG−d1 at NorthGRIP. The correspond-ing GICC05 age isa1. The age of the methane at the sameEDC depth DC-d1 is younger than the agea1 with a dif-ference of1age. We synchronise this methane event withits concomitant NorthGRIP isotope event, being found shal-lower than the10Be sub-peak at a depth NG-d2 and with aGICC05 agea2. Therefore, the age differencea1 − a2 is anindirect measurement of the1age at the EDC depth DC-d1.
At EDC, at the depth of the10Be peak, one finds DO #8 inthe gas phase. At EDML, one finds DO #9 due to the smaller1age.
The overall uncertainty of this1age corresponds to thesquare root of the sum of the squares of the uncertainties on:
1. the10Be NorthGRIP-EDC synchronisation;
2. the isotope-methane NorthGRIP-EDC synchronisation;
3. the GICC05 age differencea1−a2, that is to say thenumber of uncertain annual layers between the NG-d1and NG-d2 depths (which is much smaller than the un-certainty on the absolute age at these depths). Conse-quently, the precision of our1age estimate is directlydependent on the precision of the GICC05 age scale.
4. the uncertainties on the linear interpolation betweenNorthGRIP and EDC on the10Be synchronisation
EDC1age with this method is found to be 3960±290 yr and4040±290 yr for the two EDC10Be sub-peaks (see Table 1,
532 L. Loulergue et al.: Gas age-ice age differences along the EPICA cores
∆age?
Ice
Ga
s
EDCEDC NGRIPNGRIP
Ice
∆ag
e=
a1-a2
NGRIPNGRIPEDCEDC
Ice
Ice
Gas
∆de
pth
?DC-d1
NG-d2
DC-d1
DC-d1
NG-d1
DC-d2
NG-d1
Depth (m) Age (yr)
Depth (m) Age (yr)
Fig. 2. Sketch of the1age and1depth determination methods forEDC (DC).
Top panel: 1age method. The green arrow represents the10Be-10Be tie point and the blue arrow corresponds to themethane/NorthGRIP (NG)-isotope stratigraphic link, assuming thatthese two records are synchronous during the rapid DO transitions(Huber et al., 2006).
Bottom panel: 1depth method. The green arrow representsthe 10Be-10Be tie point and the red arrow corresponds to themethane/NorthGRIP-isotope stratigraphic link, assuming that thesetwo records are synchronous during the rapid DO transitions (Huberet al., 2006).
and Supplement1 at http://www.clim-past.net/3/527/2007/cp-3-527-2007-supplement.zip for more details).
The same procedure is applied for EDML, adding the un-certainty due to the EDML-EDC synchronization throughvolcanic horizons. EDML1age is found to be 1080±240 yrand 1220±220 yr.
In the following, these empirical constraints will be re-ferred to as the EDC-g1age and EDML-1age constraints,respectively.
3.2.2 The1depth method
The method is illustrated in Figs. 2 and 3. We start againby considering the EDC ice depth DC-d1 of the 10Be sub-
360
00
38
000
40
00
04
200
0
No
rth G
rip a
ge
(yr)
-46
-44
-42
-40
-38
-36
δ18O (‰)
72
076
08
00
Do
me C
de
pth
(m)
-450
-440
-430
-42
0
Deuterium (‰)
40
0
44
0
480
520
560
600
CH4 concentration (ppbv)
∆age ∆depth
DC-d1 DC-d1
DC-d2
NG-d1
NG-d2
DO8
DO10
Fig. 3a. 10Be-10Be and methane/isotope stratigraphic links be-tween EDC and NorthGRIP. The same method is applied for thesecond sub-peak. EDC deuterium data (Jouzel et al., 2007) are inblack. EDC methane data (this study) are in blue. NorthGRIPδ18O(NorthGRIP community members, 2004) is in red.
peak, and the corresponding NorthGRIP ice depth NG-d1. Assuming that CH4 and the Greenland isotopes changesynchronously, the methane variation corresponding to theNorthGRIP isotope variation at depth NG-d1 is found in theEDC ice deeper than the10Be peak, at the depth DC-d2. Thegas age at DC-d2 is identical to the ice age at DC−d1, andthe depth difference DC-d2–DC-d1 is an indirect measure-ment of1depth. With this method, uncertainties in the agescales are not relevant.
The uncertainty on the1depth evaluation corresponds tothe square root of the sum of the squares of uncertaintiesof the 10Be NorthGRIP and EDC synchronisation, and theisotope-methane NorthGRIP-EDC synchronisation. The un-certainties introduced by the linear interpolation betweenNorthGRIP-EDC on the10Be synchronisation are negligible.
At EDC, 1depth for the two10Be sub-peaks amountsto 47.3±2.3 m and 47.5±2.3 m (see Table 1, and Sup-plement1 at http://www.clim-past.net/3/527/2007/cp-3-527-2007-supplement.zip for more details).
The same procedure is applied to EDML, adding the un-certainty on the EDML-EDC synchronisation.1depth thenamounts to 21.4±4.6 m and 23.1±4.6 m.
In the following, these empirical constraints will be re-ferred to as the EDC-1depth and EDML-1depth constraints,respectively.
L. Loulergue et al.: Gas age-ice age differences along the EPICA cores 533
∆ag
e
∆depth
DML-d1DML-d1
DML-d2
NG-d2
NG-d1
DO10
DO8
44
000
42000
4000
03800
0
No
rth G
rip a
ge
(yr)
-36
-38
-40
-42
-44
-46
δ18O (‰)
148
01440
1400
1360
1320
ED
ML
de
pth
(m)
-46
-48
-50
-52
-54
δ18O (‰)
600
55
0
500
45
0
400
35
0
CH4 concentration (ppbv)
Fig. 3b. Same for EDML.
EDML deuterium data (EPICA Community Members, 2006) are inblack. EDML methane data (this study) are in blue. NorthGRIPδ18O (NorthGRIP community members, 2004) is in red.
4 Testing firn densification model scenarios
In this section, we test different temperature and accumu-lation rate scenarios at EDC and EDML against the1ageand1depth empirical constraints described in Sect. 3: EDC-EDML methane synchronization, and1age and1depth atthe location of the10Be peak. Numerical values are given inSupplement2 (EDC) and 3 (EDML) (http://www.clim-past.net/3/527/2007/cp-3-527-2007-supplement.zip).
4.1 Scenario 1: EDC3 and EDML1 temperature and accu-mulation rate histories
With the EDC3 chronology (Parrenin et al., 2007a), the sur-face temperature history is deduced from the isotopic contentof the ice without correction for source temperature varia-tions. Theβ coefficient in Eq. (2) has then been determinedin order that the resulting chronology agrees with the abso-lute age of the10Be peak at 41 kyr BP. The inferred valueis 0.0157. The accumulation rate has been further slightlymodified in order to synchronize the EDC3 age scale ontoGICC05 at several tie points (Parrenin et al., 2007a). ForEDML, source temperature variations were not consideredeither andβ has been set to 0.015 (EPICA community mem-bers, 2006).
10000 20000 30000 40000 50000Gas chronology (yrs)
-400
0
400
800
1200
Diffe
rences b
etw
een the tw
o g
as c
hro
nolo
gie
s (
ED
ML-E
DC
)
Scenario 1
Scenario 2
Scenario 3
Scenario 4
Uncertainties
Fig. 4. Differences between the EDML and EDC gas chronologiesfor each methane tie point. The uncertainty (discontinuous line) onthe methane synchronisation tie points is shown with the grey area.For a description of the scenarios, refer to Sect. 4.
Theα coefficient in Eq. (1) representing the spatial slopeof the present-day isotopic thermometer is estimated empir-ically at EDC as 0.1656 K/‰ from the present day-surfacemeasurements between Dumont d’Urville and Dome C (Lo-rius and Merlivat, 1977). For EDML, the equivalent, thistime relating temperature toδ18O, is estimated empiricallyas 1.220 K/‰ from the relationship betweenδ18O and sur-face temperature at Dronning Maud Land (EPICA commu-nity members, 2006).
Overall, the EDC3 and EDML1 climatic inputs to the den-sification model provide a poor agreement with the empiricalconstraints (Table 3 and Fig. 4). The EDML gas time scaleis always older than the EDC gas time scale (see Fig. 4),with an average difference of 850 yr. The difference rangesfrom 300 yr (Younger Dryas/ Holocene transition) to 1150 yr(onset of DO #6). This implies that either the EDC1ageis overestimated or the EDML one is underestimated. Thediscrepancy being smaller during the last deglaciation thanduring the last glacial period, the modelling error appears toincrease during cold conditions (Fig. 4).
At the time of the two10Be sub-peaks, the EDC (EDML)modelled1age amounts to 5050 yr and 5010 yr (1370 and1320 yr), i.e. 20 (15%) larger than the empirically derivedvalues of 3960 and 4040 yr (1080 and 1220 yr) and outsidetheir confidence interval of 290 and 290 yr (240 and 220 yr).The comparison follows the same trend for the1depth con-straints. The EDC (EDML) modelled estimates amounts to55.3 and 55.0 m (22.9 and 22.9 m) and are larger by 15%(larger by about 6%) than the empirical values.
534 L. Loulergue et al.: Gas age-ice age differences along the EPICA cores
Table 3. Comparison between the outputs of firn densification modelling scenarios and empirical constraints as derived in Sect. 3. Cf. Sect. 4for a description of the scenarios.
4.2 Scenario 2: EDC3 and EDML1 accumulation rate his-tories, reduced amplitude of glacial-interglacial tem-perature change
In scenario 1, the modelled1age at both EDML and EDC istoo large during the10Be peak. One way to resolve this dis-crepancy is to reduce the amplitude of the glacial-interglacialtemperature change. Relatively warmer temperatures leadto a faster densification process, a shallower close-off depthand a reduced1age. In scenario 2 we keep the EDC3 andEDML1 accumulation rates unchanged (Sect. 3.1) and we re-duce the glacial-interglacial temperature amplitude to a fac-tor α=0.1403 K/‰.
This scenario generally gives a slightly better agreementthan scenario 1 with the empirical constraints derived inSect. 3 (Table 3 and Fig. 4). The difference between theEDC and EDML gas age scales is slightly reduced, with anaverage of 660 yr. During the10Be sub-peaks1age at EDC(EDML) is 4820 yr and 4800 yr (1330 and 1280 yr), around20% (10%) higher than the empirical values.1depth at EDC(53.2 and 52.6 m) remains significantly larger than the empir-
ical values. For EDML, the1depth (22.2 and 22.8 m) is stilla little bit larger than the empirical values.
4.3 Scenario 3: EDC3 and EDML1 accumulation rate his-tories, EDC temperature corrected for source effects
In this scenario, the EDC3 temperature history is correctedfor variations in the mean ocean isotopic composition, butnot for source temperature variations. Vimeux et al. (2002)showed for the Vostok ice core that taking into accountsource temperature variations reduces the amplitude of theglacial-interglacial surface temperature change by up to 2◦C.In scenario 3, we apply such a correction using the deu-terium excess record (Stenni et al., 2003, and new data,B. Stenni, personal communication). In general, tempera-tures are warmer during the glacial period compared to sce-nario 1. The EDC accumulation rate history is kept identicalto scenario 1, as well as the EDML temperature and accumu-lation rate histories.
Overall, this scenario gives results very close to scenario 2(Table 3 and Fig. 4). The agreement between the EDC and
L. Loulergue et al.: Gas age-ice age differences along the EPICA cores 535
EDML gas age scales is slightly improved, with an averageshift of 630 yr. During the10Be sub-peaks, the EDC1age is4820 yr and 4810 yr, around 20% higher than the empiricalvalues. The EDC1depth (54.1 m and 53.5 m) remains sig-nificantly larger than the empirical values. For EDML, thisscenario 3 is the same as scenario 1.
4.4 Scenario 4: EDC3 and EDML1 temperature histories,reduced amplitude of glacial-interglacial accumulationrate changes
Another way to reduce1age is to increase the past accumu-lation rate. In scenario 4, we chooseβ to be 0.0094 for EDCand 0.0120 for EDML, the temperature histories remainingidentical to scenario 1. These values have been obtained bya manual trial and error method, in order to minimize thediscrepancy between model and empirical constraints.
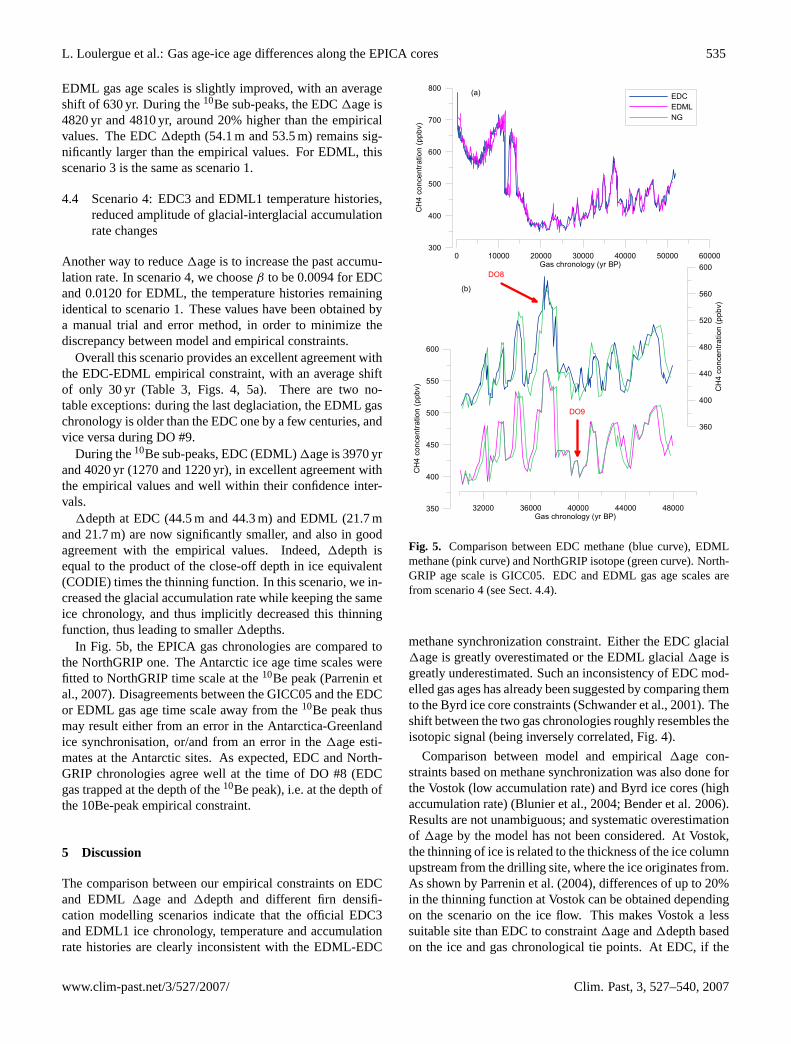
Overall this scenario provides an excellent agreement withthe EDC-EDML empirical constraint, with an average shiftof only 30 yr (Table 3, Figs. 4, 5a). There are two no-table exceptions: during the last deglaciation, the EDML gaschronology is older than the EDC one by a few centuries, andvice versa during DO #9.
During the10Be sub-peaks, EDC (EDML)1age is 3970 yrand 4020 yr (1270 and 1220 yr), in excellent agreement withthe empirical values and well within their confidence inter-vals.
1depth at EDC (44.5 m and 44.3 m) and EDML (21.7 mand 21.7 m) are now significantly smaller, and also in goodagreement with the empirical values. Indeed,1depth isequal to the product of the close-off depth in ice equivalent(CODIE) times the thinning function. In this scenario, we in-creased the glacial accumulation rate while keeping the sameice chronology, and thus implicitly decreased this thinningfunction, thus leading to smaller1depths.
In Fig. 5b, the EPICA gas chronologies are compared tothe NorthGRIP one. The Antarctic ice age time scales werefitted to NorthGRIP time scale at the10Be peak (Parrenin etal., 2007). Disagreements between the GICC05 and the EDCor EDML gas age time scale away from the10Be peak thusmay result either from an error in the Antarctica-Greenlandice synchronisation, or/and from an error in the1age esti-mates at the Antarctic sites. As expected, EDC and North-GRIP chronologies agree well at the time of DO #8 (EDCgas trapped at the depth of the10Be peak), i.e. at the depth ofthe 10Be-peak empirical constraint.
5 Discussion
The comparison between our empirical constraints on EDCand EDML 1age and1depth and different firn densifi-cation modelling scenarios indicate that the official EDC3and EDML1 ice chronology, temperature and accumulationrate histories are clearly inconsistent with the EDML-EDC
Fig. 5. Comparison between EDC methane (blue curve), EDMLmethane (pink curve) and NorthGRIP isotope (green curve). North-GRIP age scale is GICC05. EDC and EDML gas age scales arefrom scenario 4 (see Sect. 4.4).
methane synchronization constraint. Either the EDC glacial1age is greatly overestimated or the EDML glacial1age isgreatly underestimated. Such an inconsistency of EDC mod-elled gas ages has already been suggested by comparing themto the Byrd ice core constraints (Schwander et al., 2001). Theshift between the two gas chronologies roughly resembles theisotopic signal (being inversely correlated, Fig. 4).
Comparison between model and empirical1age con-straints based on methane synchronization was also done forthe Vostok (low accumulation rate) and Byrd ice cores (highaccumulation rate) (Blunier et al., 2004; Bender et al. 2006).Results are not unambiguous; and systematic overestimationof 1age by the model has not been considered. At Vostok,the thinning of ice is related to the thickness of the ice columnupstream from the drilling site, where the ice originates from.As shown by Parrenin et al. (2004), differences of up to 20%in the thinning function at Vostok can be obtained dependingon the scenario on the ice flow. This makes Vostok a lesssuitable site than EDC to constraint1age and1depth basedon the ice and gas chronological tie points. At EDC, if the
536 L. Loulergue et al.: Gas age-ice age differences along the EPICA cores
dome location remained stable, the total thinning is approxi-mately linearly related to the depth of ice layers (Parrenin etal., 2007).
The origin of the inconsistency between model outputs andthe observation lies 1) either in the parameterization of thesurface temperature; or 2) in the parametrization of the sur-face accumulation rate; or 3) in the calculation of the thinningfunction at both sites; or 4) in the physical representation ofthe densification process in the model; or 5) any combinationof the four previous options.
A test with different temperature scenarios (scenarios 2and 3) only removes a fraction of the disagreement withempirical constraints. These scenarios reduce the glacial-interglacial amplitude of temperature change by about 15%,which seems to be a maximum bound according to dif-ferent evidences presently available for the East Antarcticplateau (Jouzel et al., 2003; Blunier et al., 2004). Salamatinet al. (1998) and Tsyganova and Salamatin (2004) suggeston the other hand a large underestimate of the temperaturechange, which would make even worse the disagreement be-tween modelled and observed1age and1depth. To ourknowledge, there is no other study proposing smaller ampli-tude of glacial-interglacial temperature change than the onededuced from the standard isotope/temperature relationshipin Antarctica. In summary, only a small fraction of the dis-agreement can thus originate from the temperature scenario.
Using larger glacial accumulation rates at both EDC andEMDL (scenario 4) than those classically deduced from wa-ter isotopes, we are able to get a much improved agreementbetween firn densification model outputs and1age empir-ical constraints. But at EDC, it represents an average ac-cumulation rate of 63% of the present-day value during thelast glacial maximum, corresponding to an increase of morethan 30% with respect to the EDC3 official scenario. Theannual layer thickness in the EDC3 chronology is the prod-uct of the accumulation rate (the initial annual layer thick-ness) and the thinning function (evaluated with a mechanicalice-flow model, Parrenin et al., 2007). The EDC3 chronol-ogy is constrained within∼1 kyr at the location of the10Bepeak 41 kyr BP, being synchronized onto the NorthGRIP an-nual layer-counted GICC05 age scale (Andersen et al., 2006;Svensson et al., 2006). Increased glacial accumulation ratesas in scenario 4 are thus physically compatible with the icecore chronology only if they are compensated by a propor-tional decrease in the thinning function. However, the lattervaries between 1 at the surface and 0.75 at 850 m of depth(∼50 kyr BP) and it is considered very well constrained un-der ice-flow conditions for the upper quarter of an ice dome(Parrenin et al., 2007). A correction of about 30% of thethinning function in this EDC depth range thus seems to beunrealistic.
It could be argued that the EDML-EDC methane disagree-ment results from an underestimated1age at EDML. How-ever, EDML1age during the last glacial amounts to 1000–1500 yr, and a mean underestimate of 800 yr (50 to 80%) is
not feasible. We conclude that the firn densification modeloverestimates1age at EDC during the last glacial period.
A possible origin of disagreement between model and em-pirical constraints is a missing phenomenon in the firn den-sification model. As already suggested by theδ15N data atVostok (Sowers et al., 1992), firn densification models couldlead to an overestimate of the close-off depth for the verycold and low accumulation conditions of the glacial Antarc-tic plateau, for which no present-day analogue exists so far.There are 3 possible sources of modelling errors. First, sur-face density may be underestimated during glacial times. In-deed, surface density depends on the characteristics of thesurface: megadunes, glazed surfaces and areas with relativedensities of∼0.5 have been observed on the East Antarcticplateau and make this option plausible. Second, the densifi-cation velocity may be underestimated for glacial conditions.The densification model of Salamatin et al. (2007), simul-taneously calculating grain sliding and plastic deformationalong the firn column, indeed leads to faster densification thatthe model of Goujon et al. (2003). Third, the density at theclose-off depth may be less during glacial times. The densityat the bottom of the non-diffusive zone is relatively well con-strained by the total air content measurements, and we thusdo not expect important changes. But the depth differencebetween the Lock-In Depth (where gases stop diffusing) andthe COD (where gases are on average definitely trapped) maybe significantly larger than today for glacial conditions. Atthis stage, we have no strong argument to favour any of theseoptions.
What is not satisfying in any of the scenarios above is thatthe modelled COD is much too large compared to the ob-served LID calculated fromδ15N data for EDML (Landaiset al., 2006). We made the following experiment in attemptto bring both1age and COD in agreement with the obser-vation. We reduced COD from scenario 1 (with a largelyoverestimated1age) by a given factor so that it is in betteragreement to theδ15N derived LID during the glacial (datanot shown here). By this totally empirical correction it ispossible to get a generally good agreement with the empiri-cal values, about similar to scenario 4 with respect to1age.However, the limitation of this approach is that the physics inthis process is not explained and that the variations ofδ15Nparameter is not fully understood for glacial conditions fora lot of different sites (EDML; Landais et al., 2006, EDC,Berkner; Capron et al., 2007).
Whatever the physical explanation, our re-evaluation of1age at EDC has potentially large consequences on one ofthe key questions regarding climate and carbon cycle dynam-ics: the relative timing between Antarctic climate and CO2mixing ratio changes. Current estimates of the time relation-ship between the two signals at the start of the last deglacia-tion based on detailed EDC measurements, point to a CO2lag of 800±600 yr compared to theδD increase (Monnin etal., 2001). This conclusion based on a1age calculation sim-ilar to scenario 1 has to be revisited, as this scenario applied
L. Loulergue et al.: Gas age-ice age differences along the EPICA cores 537
to the 10Be peak at 41.2 kyr BP leads to a1age overesti-mate of more than 1000 yr. Indeed the gas age differencebetween EDC and EDML shows an overestimate for the en-tire glacial period and the last deglaciation. We concludethat the CO2 deglacial increase took place with a significantlysmaller lag over Antarctic temperature than previously sug-gested. The consequences of such a suggestion are far be-yond the scope of this paper and should certainly wait forconfirmation through other time markers in the ice allowinga direct chronological fit between EDC and the Greenlandice. Furthermore CO2 measurements on the EDML core witha much smaller1age will allow estimation of the timing ofCO2 and temperature rise with much more confidence. How-ever, with the information at hand through our study, it islikely that the EDC1age and therefore the CO2 lag on EastAntarctic temperature has also been overestimated around18 kyr BP.
6 Conclusions
An improved time resolution of CH4 measurements on theEDC and EDML ice cores, notably over DO #9 and 10, al-lowed us to evaluate the compatibility of the EDC and EDMLgas chronologies. The combination of EDC-EDML gas syn-chronisation through CH4 and ice synchronisation throughvolcanic horizons provides a constraint on the gas age-iceage difference at both sites. At the location of the 41 kyr10Be event, the ice synchronisation of EDC with NorthGRIPallows us to empirically evaluate this1age (as well as the1depth) for EDC and EDML.
The EDC1age and1depth produced by the firn densifi-cation model can match our new empirical constraints onlythrough larger accumulation rate at EDC and EDML dur-ing the last glacial period, compared with current estimates.However, it requires modification of the EDC chronology,which would change either the age of the 41 kyr10Be event,or the modelled EDC thinning function, both of them be-ing robust estimates. Although the exact causes of the1ageoverestimate remain unknown, our work implies that the sug-gested lag of CO2 on Antarctic temperature at the start of thelast deglaciation has probably been overestimated.
Independent estimates of paleo-accumulation rates viachemical tracers would remove the current doubt on theaccumulation rate scenario. In addition, the precision ofour method could be improved through direct synchronisa-tion of a future detailed CH4 record from NorthGRIP withits Antarctic counterparts. Finally, a similar study of theJapanese Dome Fuji ice core, also situated on a dome andcharacterized by a slightly larger accumulation rate relativeto EDC, would help to better understand the physics behindthe densification process on the East Antarctic plateau duringglacial conditions.
Acknowledgements. This work is a contribution to the EuropeanProject for Ice Coring in Antarctica (EPICA), a joint European
Science Foundation/European Commission scientific programme,funded by the EU (EPICA-MIS) and by national contributionsfrom Belgium, Denmark, France, Germany, Italy, the Netherlands,Norway, Sweden, Switzerland and the United Kingdom. The mainlogistic support was provided by IPEV and PNRA (at Dome C) andAWI (at Dronning Maud Land). This is EPICA publication no. 182.
Edited by: E. W. Wolff
References
Ahn, J., Wahlen, M., Deck, B. L., Brook, E. J., Mayewski, P. A.,Taylor, K. C., and White, J. W. C.: A record of atmospheric CO2during the last 40 000 years from the Siple Dome, Antarctica icecore, J. Geophys. Res., 109, 13 305, doi:10.1029/2003JD004415,2004.
Andersen, K. K., Svensson, A., Johnsen, S. J., Rasmussen, S.O., Bigler, M., Rothlisberger, R., Ruth, U., Siggaard-Andersen,M.-L., Steffensen, J. P., Dahl-Jensen, D., Vinther, B. M., andClausen, H. B.: The Greenland Ice Core Chronology 2005, 15–42 ka. Part 1: constructing the time scale, Quat. Sci. Rev., 25,3246–3257, 2006.
Anklin, M., Barnola, J.-M., Schwander, J., Stauffer, B., and Ray-naud, D.: Processes affecting the CO2 concentration measuredin Greenland ice, Tellus Ser., B(47), 461–470, 1995.
Arnaud, L., Barnola, J.-M., and Duval, P.: Physical modeling ofthe densification of snow/firn and ice in the upper part of polarice sheets. Physics of Ice Core Records, T. Hondoh, Sapporo,Hokkaido University Press, 285–305, 2000.
Barnola, J.-M., Pimienta, P., Raynaud, D., and Korotkevich, Y.S.: CO2-climate relationship as deduced from the Vostok icecore: a re-examination based on new measurements and on are-evaluation of the air dating, Tellus, 43 B, 83–90, 1991.
Bender, M. L., Floch, G., Chappellaz, J., Suwa, M., Barnola,J.-M., Blunier, T., Dreyfus, G., Jouzel, J., and Parrenin,F.: Gas age-ice age differences and the chronology of theVostok ice core, 0–100 ka, J. Geophys. Res., 111, D21115,doi:10.1029/2005JD006488, 2006.
Bender, M. L., Sowers, T., Dickson, M.-L., Orchardo, J., Grootes,P., Mayewski, P. A., and Meese, D. A.: Climate correlations be-tween Greenland and Antarctica during the past 100 000 years,Nature, 372, 663–666. 1994.
Bintanja, R., Van De Wal, R. S. W., and Oerlemans, J.: Modelledatmospheric temperatures and global sea levels over the past mil-lion years, Nature, 437, 125–128, 2005.
Blunier, T., Spahni, R., Barnola, J. M., Loulergue, L., and Schwan-der, J.: Synchronization of ice core records via atmosphericgases, Clim. Past, 3, 325–330, 2007,http://www.clim-past.net/3/325/2007/.
Blunier, T., Schwander, J., Chappellaz, J., Parrenin, F., and Barnola,J.-M.: What was the surface temperature in central Antarcticaduring the last glacial maximum?, Earth Planet. Sci. Lett., 218,379–388, 2004.
Blunier, T. and Brook, E. J.: Timing of Millennial-Scale climatechange in Antarctica and Greenland during the last glacial pe-riod, Science, 291, 109–111, 2001.
Blunier, T., Chappellaz, J., Schwander, J., Dallenbach, A., Stauf-fer, B., Stocker, T. F., Raynaud, D., Jouzel, J., Clausens, H. B.,Hammer, C. U., and Johnsen, S. J.: Asynchrony of Antarctic and
538 L. Loulergue et al.: Gas age-ice age differences along the EPICA cores
Greenland climate change during the last glacial period, Nature,394, 739–743, 1998.
Blunier, T., Schwander, J., Stauffer, B., Stocker, T. F., Dallenbach,A., Indermuhle, A., and Tschumi, J.: Timing of the AntarcticCold Reversal and the atmospheric CO2 increase with respect tothe Younger Dryas event, Geophys. Res. Lett., 24, 2683–2686,1997.
Caillon, N., Severinghaus, J. P., Jouzel, J., Barnola, J.-M., Kang, J.,and Lipenkov, V. Y.: Timing of atmospheric CO2 and Antarctictemperature changes across termination III, Science, 299, 1728–1731, 2003.
Caillon, N., Severinghaus, J. P., Barnola, J.-M., Chappellaz, J.,Jouzel, J., and Parrenin, F.: Estimation of temperature changeand of gas age-ice age difference, 108 kyr B.P., at Vostok, Antarc-tica, J. Geophys. Res., 106(D23), 31 893–31 901, 2001.
Capron, E.: Memoire de Master 2, Interaction Climat Environ-nement (UVSQ), Analyse de la composition isotopique de l’airpiege dans la glace de Berkner Island (Antarctique de l’Ouest)pendant la derniere deglaciation, p.30, 2007.
Chappellaz, J., Blunier, T., Kints, S., Dallenbach, A., Barnola, J.-M., Schwander, J., Raynaud, D., and Stauffer, B.: Changes inthe atmospheric CH4 gradient between Greenland and Antarc-tica during the Holocene, J. Geophys. Res., 102(D13), 15 987–15 997, 1997.
Chappellaz, J., Blunier, T., Raynaud, D., Barnola, J.-M., Schwan-der, J., and Stauffer, B.: Synchronous changes in atmosphericCH4 and Greenland climate between 40 and 8 kyr BP, Nature,366, 443–445, 1993.
Eisen, O., Rack, W., Nixdorf, U., and Whilhelms, F.: Charac-teristics of accumulation around the EPICA deep-drilling sitein Dronning Maud Land, Antarctica, Ann. Glaciol., 41, 41–46,2005.
Epica, C. M.: One-to-one interhemispheric coupling of polar cli-mate variability during the last glacial, Nature, 444, 195–198,doi:10.1038/nature05301, 2006.
Fischer, H., Wahlen, M., Smith, J., Mastroianni, D., and Deck, B.L.: Ice core records of atmospheric CO2 around the last threeglacial terminations, Science, 283, 1712–1714, 1999.
Fluckiger, J., Blunier, T., Stauffer, B., Chappellaz, J., Spahni, R.,Kawamura, K., Schwander, J., Stocker, T. F., and Dahl-Jensen,D.: N20 and CH4 variations during the last glacial epoch: in-sight into global processes, Global Biogeochem. Cy., 16, 227–230, 2002.
Fluckiger, J., Dallenbach, A., Blunier, T., Stauffer, B., Stocker, T.F., Raynaud, D., and Barnola, J.-M.: Variations in atmosphericN2O concentration during abrupt climatic changes, Science, 285,227–230, 1999.
Goujon, C., Barnola, J.-M., and Ritz, C.: Modeling the den-sification of polar firn including heat diffusion: Applicationto close-off characteristics and gas isotopic fractionation forAntarctica and Greenland sites, J. Geophys. Res., 108, 4792,doi:10.1029/2002JD003319, 2003.
Guillou, H., Singer, B. S., Laj, C., Kissel, C., Scaillet, S., and Jicha,B. R.: On the age of the Laschamp geomagnetic excursion, EarthPlanet. Sci. Lett., 227, 331–343, 2004.
Herron, M. M. and Langway, C. C.: Firn densification: an empiricalmodel, J. Glaciol., 25, 373–385, 1980.
pellaz, J., Fischer, H., Johnsen, S. J., Leuenberger, M., Louler-gue, L., Luethi, D., Oerter, H., Parrenin, F., Raisbeck, G. M.,Raynaud, D., Schwander, J., Spahni, R., Souchez, R., Selmo, E.,Schilt, A., Steffensen, J. P., Stenni, B., Stauffer, B., Stocker, T.F., Tison, J.-L., Werner, M., and Wolff, E.: Orbital and millenialantarctic climate variability over the last 800 000 years, Science,317, 793–796, 2007.
Jouzel, J., Vimeux, F., Caillon, N., Delaygue, G., Hoff-mann, G., Masson-Delmotte, V., and Parrenin, F.: Magni-tude of isotope/temperature scaling for interpretation of cen-tral Antarctic ice cores, J.Geophys. Res., 108(D12), 4361,doi:10.1029/2002JD002677, 2003.
Jouzel, J., Alley, R. B., Cuffey, K. M., Dansgaard, W., Grootes, P.,Hoffmann, G., Johnsen, S. J., Koster, R. D., Peel, D., Shuman,C. A., Stievenard, M., Stuiver, M., and White, J.: Validity of thetemperature reconstruction from water isotopes in ice cores, J.Geophys. Res., 102(C12), 26 471–26 487, 1997.
Landais, A., Barnola, J.-M., Kawamura, K., Caillon, N., Del-motte, M., Van Ommen, T. D., Dreyfus, G., Jouzel, J., Masson-Delmotte, V., Minster, B., Freitag, J., Leuenberger, M., Schwan-der, J., Huber, C., Etheridge, D. M., and Morgan, V.: Firn-aird15N in modern polar sites and glacial–interglacial ice: a model-data mismatch during glacial periods in Antarctica?, Quat. Sci.Rev., 25, 49–62, 2006.
Landais A., Caillon, N., Goujon, C., Grachev, A. M., Barnola, J.-M., Chappellaz, J., Jouzel, J., Masson-Delmotte, V., and Leuen-berger, M.: Quantification of rapid temperature change duringDO event 12 and phasing with methane inferred from air isotopicmeasurements, Earth Planet. Sci. Lett., 225, 221–232, 2004.
Lorius, C. and Merlivat, L.: Distribution of mean surface stable iso-tope values in east Antarctica. Observed changes with depth ina coastal area, in: Isotopes and impurities in snow and ice, Pro-ceedings of the grenoble symposium, August/September 1975,volume 118 of IAHS, Publication, IAHS, Vienna, 1977.
Mazaud, A., Laj, C., and Bender, M. L.: A geomagnetic chronologyfor antarctic ice accumulation, Geophys. Res. Lett., 21(5), 337–340, 1994.
Monnin, E., Indermuhle, A., Dallenbach, A., Fluckiger, J., Stauffer,B., Stocker, T. F., Raynaud, D., and Barnola, J.-M.: AtmosphericCO2 concentrations over the last glacial termination, Science,291, 112–114, 2001.
Neftel, A., Oeschger, H., Staffelbach, T., and Stauffer, B.: CO2record in the Byrd ice core 50 000–5000 years BP, Nature, 331,609–611, 1988.
North Greenland, Community Members: High resolution record ofNorthern Hemisphere climate extending into the last interglacialperiod, Nature, 2805, 1–5, 2004.
Parrenin, F., Dreyfus, G., Durand, G., Fujita, S., Gagliardini, O.,Gillet, F., Jouzel, J., Kawamura, K., Lhomme, N., Masson-Delmotte, V., Ritz, C., Schwander, J., Shoji, H., Uemura, R.,Watanabe, M., Wolff, E., and Yoshida, N.: Ice flow modellingat EPICA Dome C and Dome Fuji, East Antarctica, Clim. PastDiscuss., 3, 19–61, 2007,http://www.clim-past-discuss.net/3/19/2007/.
Parrenin, F., Barnola, J.-M., Beer, J., Blunier, T., Castellano, E.,Chappellaz, J., Dreyfus, G., Fischer, H., Fujita, S., Jouzel, J.,Kawamura, K., Lemieux, B., Loulergue, L., Masson-Delmotte,V., Narcisi, B., Petit, J.-R., Raisbeck, G. M., Raynaud, D., Ruth,U., Schwander, J., Severi, M., Spahni, R., Steffensen, J. P.,
L. Loulergue et al.: Gas age-ice age differences along the EPICA cores 539
Svensson, A., Udisti, R., Waelbroeck, C., and Wolff, E.: TheEDC3 agescale for the EPICA Dome C ice core, Clim. Past Dis-cuss., 3, 575–606, 2007a.
Parrenin, F., Remy, F., Ritz, C., Siegert, M. J., and Jouzel, J.:New modeling of the Vostok ice flow line and implication forthe glaciological chronology of the Vostok ice core, J. Geophys.Res., 109, D20102, doi:10.1029/2004JD004561, 2004.
Parrenin, F., Jouzel, J., Waelbroek, C., Ritz, C., and Barnola, J.-M.:Dating the Vostok ice core by an inverse method, J. Geophys.Res., 106(D23), 31 837–31 851, 2001.
Pimienta, P.: Etude du comportement mecanique des glaces poly-cristallines aux faibles contraintes; applications aux glaces descalottes polaires, Grenoble, Universite Joseph Fourier, 1987.
Raisbeck, G. M., Yiou, F., Jouzel, J., and Stocker, T. F.: DirectNorth-South Synchronization of abrupt climate change recordsin ice cores using10Be, Clim. Past Discuss., 3, 755–769, 2007,http://www.clim-past-discuss.net/3/755/2007/.
Raisbeck, G. M., Yiou, F., and Jouzel, J.: Cosmogenic 10Be as ahigh-resolution correlation tool for climate records, Geochimicaand cosmochimica acta Acta, 66, A623, 2002.
Rasmussen, S. O., Seierstad, I. K., Andersen, K. K., Bigler, M.,Dahl-Jensen, D., Jonhsen, S. J.: Synchronization of the NGRIP,GRIP, and GISP2 ice cores across MIS 2 and palaeoclimatic im-plications. Quat. Sci. Rev, INTIMATE special issue, accepted,2007.
Rasmussen, S. O., Andersen, K. K., Svensson, A., Steffensen, J. P.,Vinther, M., Clausens, H. B., Siggard-Andersen, M. L., Johnsen,S. J., Larsen, L. B., Bigler, M., Rothlisberger, R., Fisher, H.,Goto-Azuma, K., Hansson, M., and Ruth, U.: A new Greenlandice core chronology for the last glacial termination, J. Geophys.Res., 111, D06102, doi:10.1029/2005JD006079, 2006.
Ruth, U., Barnola, J.-M., Beer, J., Bigler, M., Blunier, T., Castel-lano, E., Fischer, H., Fundel, F., Huybrechts, P., Kaufmann, P.,Kipfstuhl, J., Lambrecht, A., Morganti, A., Oerter, H., Parrenin,F., Rybak, O., Severi, M., Udisti, R., Wilhelms, F., and Wolff, E.:EDML1: A chronology for the EDML ice core, Antarctica, overthe last 150 000 years, Clim. Past, 3, 475–484, 2007,http://www.clim-past.net/3/475/2007/.
Salamatin, A. N., Lipenkov, V. Y., Barnola, J.-M., Hori, J. M., Du-val, P., and Hondoh, T.: Basic approaches to dry snow-firn densi-fication modelling, Materialy Glyatsiologicheskih Issledovaniy,101, in press, 2007.
Salamatin, A. N., Lipenkov, V. Y., Barkov, N. I., Jouzel, J., Petit, J.-R., and Raynaud, D.: Ice core age dating and paleothermometercalibration based on isotope and temperature profiles from deepboreholes at Vostok station (east Antarctica), J. Geophys. Res.,103(D8), 8963–8977, 1998.
Schwander, J., Jouzel, J., Hammer, C. U., Petit, J.-R., Udisti, R., andWolff, E.: A tentative chronology for the EPICA Dome Concor-dia ice core, Geophys. Res. Lett., 28(22), 4243–4246, 2001.
Schwander, J., Sowers, T., Barnola, J.-M., Blunier, T., Fuchs, A.,and Malaize, B.: Age scale of the air in the summit ice: Impli-cation for glacial-interglacial temperature change, J. Geophys.Res., 102(D16), 19 483–19 493, 1997.
Severi, M., Castellano, E., Morganti, A., Udisti, R., Ruth, U., Fis-cher, H., Huybrechts, P., Wolff, E., Parrenin, F., Kaufmann,P., Lambert, F., and Steffensen, J. P.: Synchronisation of theEDML1 and EDC3 timescales for the last 52 kyr by volcanic sig-natures matching, Clim. Past Discuss., 3, 409–433, 2007,
http://www.clim-past-discuss.net/3/409/2007/.Severinghaus, J. P. and Brook, E. J.: Abrupt climate change at the
end of the last glacial period inferred from trapped air in polarice, Science, 286, 930–933, 1999.
Severinghaus, J. P., Sowers, T., Brook, E. J., Alley, R. B., and Ben-der, M. L.: Timing of abrupt climate change at the end of theYounger Dryas interval from thermally fractionated gases in po-lar ice, Nature, 391, 141–144, 1998.
Siegenthaler, U., Stocker, T. F., Monnin, E., Luthi, D., Schwan-der, J., Stauffer, B., Raynaud, D., Barnola, J.-M., Fischer, H.,Masson-Delmotte, V., and Jouzel, J.: Stable carbon cycle-climaterelationship during the late pleistocene, Science, 310, 1313–1317, 2005.
Sowers, T.: N2O record spanning the penultimate deglaciation fromthe Vostok ice core, J. Geophys. Res., 106(D23), 31 903–31 914,2001.
Sowers, T., Bender, M. L., Labeyrie, L., Martinson, D., Jouzel, J.,Raynaud, D., Pichon, J. J., and Korotkevich, Y. S.: A 135 000year Vostok-SPECMAP common temporal framework, Paleo-ceanography, 8(6), 737–766, 1993.
Sowers, T., Bender, M., Raynaud, D., and Korotkevich, Y. L.: Theδ15N of O2 in air trapped in polar ice: a tracer of gas transport inthe firn and a possible constraint on ice age-gas age differences,J. Geophys. Res., 97, 15, 15 683–15 697, 1992.
Spahni, R., Chappellaz, J., Stocker, T. F., Loulergue, L., Hausam-mann, G., Kawamura, K., Fluckiger, J., Schwander, J., Raynaud,D., Masson-Delmotte, V., and Jouzel, J.: Variations of atmo-spheric methane and nitrous oxide during the last 650 000 yearsfrom Antarctic ice cores, Science, 310, 1317–1321, 2005.
Stauffer, B., Fluckiger, J., Monnin, E., Nakazawa, T., and Aoki,S.: Discussion of the reliability of CO2, CH4 and N2O recordsfrom polar ice cores, Memoirs of National Institute of Polar Re-search, Special Issue (Japan), Global Scale Climate and Environ-ment Study trough Polar Deep Ice Cores, 57, 139–152, 2003.
Steig, E. J. and Alley, R. B.: Phase relationship between Antarc-tic and Greenland climate records, Ann. Glaciol., 35, 451–456,2002.
Stenni, B., Jouzel, J., Masson-Delmotte, V., Rothlisberger, R.,Castellano, E., Cattani, O., Falourd, S., Johnsen, S. J., Longinelli,A., Sachs, J. P., Selmo, E., Souchez, R., Steffensen, J. P., andUdisti, R.: A late-glacial high resolution site and source temper-ature record derived from the EPICA Dome C isotope records(East Antarctica), Earth Planet. Sci. Lett., 217, 183–195, 2003.
Stocker, T. F. and Johnsen, S. J.: A minimum thermodynamicmodel for the bipolar seesaw, Paleoceanography, 18, 1087,doi:10.1029/2003PA000920, 2003.
Svensson, A., Andersen, K. K., Bigler, M., Clausen, H. B., Dahl-Jensen, D., Davies, S., M., Johnsen, S. J., Muscheler, R., Ras-mussen, S. O., Rothlisberger, R., Steffensen, J. P., and Vinther,B. M.: The Greenland Ice Core Chronology 2005: 15–42 ka. Part2: comparison to others records, Quat. Sci. Rev., 25, 3258–3267,2007.
Tsyganova, E. A. and Salamatin, A. N.: Non-stationary tempera-ture field simulations along the ice flow line “Ridge B – VostokStation”, East Antarctica, Materialy Glyatsiologicheskih Issle-dovaniy, Data of Glaciological Studies, 97, 57–70, 2004.
Van Ommen, T. D., Morgan, V., and Curran, M.: Deglacial andHolocene changes in accumulation at Law Dome, East Antarc-tica, Ann. Glaciol., 39(1), 359–365, 2004.
540 L. Loulergue et al.: Gas age-ice age differences along the EPICA cores
Vimeux, F., Cuffey, K. M., and Jouzel, J.: New insights into South-ern Hemisphere temperature changes from Vostok ice cores us-ing deuterium excess correction, Earth Planet. Sci. Lett., 203,829–843, 2002.
Vinther, M., Clausens, H. B., Johnsen, S. J., Rasmussen, S. O., An-dersen, K. K., Buchardt, S. L., Dahl-Jensen, D., Seierstad, I. K.,Siggard-Andersen, M. L., Steffensen, J. P., Svensson, A., Olsen,J., and Heinemeier, J.: A synchronized dating of three Greenlandice cores throughout the Holocene, Geophys. Res. Lett., 111,D13102, doi:10.1029/2005JD006921, 2006.
Yiou, F., Raisbeck, G. M., Baumgartner, S., Beer, J., Hammer, C.,Johnsen, S. J., Jouzel, J., Kubik, P. W., Lestringuez, J., Stieve-nard, M., Suter, M., and Yiou, P.: Beryllium 10 in the Green-land Ice Core Project ice core at Summit, Greenland, J. Geophys.Res., 102(C12), 26 783–26 794, 1997.


![La cesura epica come problema lirico [1]](https://static.documents.pub/doc/80x56/617f6bb2c23bf340232e638b/la-cesura-epica-come-problema-lirico-1.jpg)


