New Constructs (NC) is a research firm that specializes in deep AI-empowered analyses of corporate financial filings, providing users with unique insights about public firms’ real economic earnings. NC examines the entirety of the financial filings, including tables, charts, MD&A, and footnotes to extract relevant items that affects a company’s earnings. To ensure accuracy and consistency, NC employs analysts and experts to classify relevant items first and, then, trains an AI algorithm to automatically extract and tag new information. Whenever the machine comes across an item that it has not seen previously, it will resort to human intervention to classify and learn. Using this methodology, which is described in detail in Rouen, So, and Wang (2020)1, NC processes over 270,000 financial filings covering over 5,500 US exchange traded stocks (~ 2800 active & 2700+ inactive US equities, view live coverage).
NC’s Core Earnings
Core Earnings, unlike net income, excludes all items from transitory shocks and ancillary business activities identified by NC. Those items, collectively defined as Earnings Distortion, are usually non-recurring. Therefore, Core Earnings is more persistent over time and less susceptible to earnings management, thereby providing a clearer picture about firms, true financial profitability. The relationship between net income and Core Earnings is:
𝑪𝒐𝒓𝒆 𝑬𝒂𝒓𝒏𝒊𝒏𝒈𝒔 + 𝑬𝒂𝒓𝒏𝒊𝒏𝒈𝒔 𝑫𝒊𝒔𝒕𝒐𝒓𝒕𝒊𝒐𝒏 = 𝑵𝒆𝒕 𝑰𝒏𝒄𝒐𝒎𝒆
If Earnings Distortion is positive, it means that the company reports more earnings in the financial statement than its actual Core Earnings as defined by NC. Earnings Distortion is further broken down into the following categories:
1. Reported distortions are transitory gains/losses reported on income statements, such as those related to discontinued operations, M&A expenses etc.
2. Hidden distortions are transitory gains/losses that cannot be found on the income statement and are available only in financial footnotes or other disclosures. For examples of the difference in Hidden and Reported distortions, click here.
3. Analyst vs Core Earnings Forecasts: We also use a forecast of next quarter’s Core Earnings as a benchmark against analysts’ consensus earnings forecasts to more accurately gauge the sell-side’s estimates for growth (difference between Core Earnings forecasts and sell-side analyst consensus earnings forecasts, both for the upcoming quarter).
1 Rouen, Ethan and So, Eric C. and Wang, Charles C. Y., Core Earnings: New Data and Evidence (November 20, 2020). Harvard Business School Accounting & Management Unit Working Paper No. 20-047, October 2019. Journal of Financial Economics (JFE).
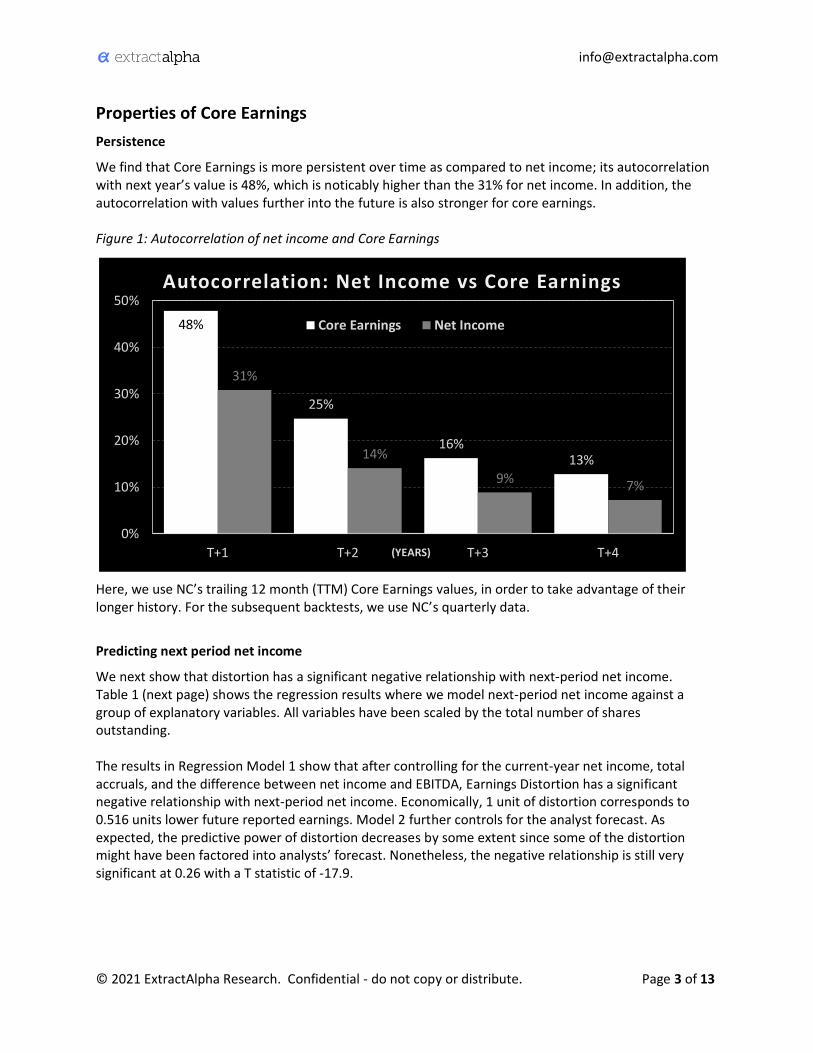
We find that Core Earnings is more persistent over time as compared to net income; its autocorrelation with next year’s value is 48%, which is noticably higher than the 31% for net income. In addition, the autocorrelation with values further into the future is also stronger for core earnings. Figure 1: Autocorrelation of net income and Core Earnings
Here, we use NC’s trailing 12 month (TTM) Core Earnings values, in order to take advantage of their longer history. For the subsequent backtests, we use NC’s quarterly data.
Predicting next period net income
We next show that distortion has a significant negative relationship with next-period net income. Table 1 (next page) shows the regression results where we model next-period net income against a group of explanatory variables. All variables have been scaled by the total number of shares outstanding. The results in Regression Model 1 show that after controlling for the current-year net income, total accruals, and the difference between net income and EBITDA, Earnings Distortion has a significant negative relationship with next-period net income. Economically, 1 unit of distortion corresponds to 0.516 units lower future reported earnings. Model 2 further controls for the analyst forecast. As expected, the predictive power of distortion decreases by some extent since some of the distortion might have been factored into analysts’ forecast. Nonetheless, the negative relationship is still very significant at 0.26 with a T statistic of -17.9.
Table 1: Regression results for next period net income
Regression Model 1 No. Observations: 45504, R-squared: 0.445
Coefficient STD Error T Stats P>|t|
Intercept 0.131 0.016 8.42 0.000
Net Income 0.733 0.004 174.39 0.000
Earnings Distortion -0.516 0.011 -47.00 0.000
Total Accruals 0.000 0.006 0.03 0.977
Net Income - EBITDA 0.030 0.005 6.07 0.000
Regression Model 2 No. Observations: 29244, R-squared: 0.482
Coefficient STD Error T Stats P>|t|
Intercept -0.078 0.02 -3.88 0.000
Net Income 0.386 0.008 46.38 0.000
Analyst Consensus 0.560 0.01 53.62 0.000
Earnings Distortion -0.255 0.014 -17.91 0.000
Total Accruals 0.057 0.007 8.08 0.000
Net Income - EBITDA 0.085 0.006 13.16 0.000
Analyst vs Core Earnings Forecasts (benchmarking growth expectations with forecasts of Core Earnings)
Forecasts of next quarter’s Core Earnings can be used as a benchmark from which analyst consensus forecasts can be gauged; the resulting metric is a measure of sell-side growth expectations that is adjusted for earnings distortion:
• To forecast next quarter’s Core Earnings, we use Triple Exponential Smoothing (Holt Winters method) to account for both trend and seasonality in the quarterly Core Earnings data.
• See component Analyst vs Core Earnings in Table 2 of the next section - backtesting methodology - for an explanation of this property.
• Table 5 in the Historical Performance section shows the improved results from benchmarking analyst consensus forecasts using forecasts of Core Earnings, as opposed to using forecasts of net income.
• Table 6 in the Historical Performance section shows the signal’s performance with and without Analyst vs Core Earnings Forecasts component.
ITEM DEFINITION LONG (GOOD) SHORT (BAD) ECONOMIC RATIONALE
CO
MP
ON
EN
TS
Earnings Distortion
Earnings distortion, scaled by market capitalization,
4-quarter moving average Negative
(Core Earnings is larger than reported net
income)
Positive (Reported net
income is larger than
Core Earnings)
Inflated net income, due to a large and positive distortion,
means net income is overstated and is therefore
unsustainable and unlikely to persist. Alternatively, a
negative distortion means net income is understated.
Hidden Distortion
Hidden distortion, scaled by market capitalization,
4-quarter moving average
Analyst vs Core Earnings
Forecasts
Core Earnings forecast for next quarter (Holt Winters
method) MINUS
sell-side analysts consensus earnings forecast for same quarter, scaled by absolute
value of Core Earnings
Negative (Consensus
forecast larger than Core Earnings)
Positive (Core Earnings
larger than consensus forecast)
When the sell-side consensus forecast is larger than our Core Earnings forecast, it
means the sell-side's estimate of future profitability is genuinely high (despite
benchmarking this against our Core Earnings forecast, which
is more accurate than forecasted net income).
SIG
NA
L Core Earnings
Signal (raw)
Equal weighted rank average of the 3 components above
(as rankings) Negative Positive
Core Earnings Signal (final)
Inverse of the raw signal above
Positive signal Negative
signal
The table above explains the signal and its components, feature engineering, and signal construction. We identified three key features which are predictive of future stock returns. Some additional notes:
• Although Hidden Distortion is already a component of Earnings Distortion, we find it to be the most influential subcomponent within Earnings Distortion; thus we’ve added it as a separate component to reflect its importance. Additionally, Hidden Distortion is unique to NC’s data; identified by deep AI-empowered analyses of corporate financial filings.
• The Analyst vs Core Earnings Forecasts component is different from Earnings Distortion in that it is distinctly forward looking; its value is derived from benchmarking consensus forecasts against our Core Earnings forecast, therefore providing an undistorted measure of sell-side growth expectations.
• The Analyst vs Core Earnings Forecasts component is independent from the Earnings Distortion based components due to the forecasting nature of the former. For the former, we are strictly considering the absolute difference between forecasts, whereas the latter measures distortion in the present.
• Table 3 (next page) shows that the correlation among the 3 components is low
• The final Core Earnings signal that we backtest is an equally weighted average of the three components’ rankings; we choose equal weighting to avoid the risk of overfitting or data mining, and we reverse the sign of the final signal to keep it intuitive (positive signal equates to going long and vice versa).
Investible universe EA’s investible universe, which requires at least US$100m in market capitalization, US$1m in average daily trading volume, and $4 in nominal stock price. This universe is updated point in time and is without survivorship bias.
Rebalancing frequency: Monthly
Time of trade Our signal measurement date is the last day of each month based on all available information. The distortion features are usually available two days after the filing date of annual and quarterly financial reports. Only the records with filing dates of 3 or more days before the measurement date are incorporated in the current rebalancing cycle. Our trade execution is at the close on the first trading day of the next month.
Long-short percentiles: Unless otherwise specified, our baseline long-short model is to go long the top 10% and to go short the bottom 10%. We also test a more extreme setting where we go long the top 5% and go short the bottom 5%. For long-short portfolios constructed within each sector, we choose the top 20% / bottom 20% to ensure a sufficient number of stocks in the long and short buckets
Sample coverage The signal is built from the quarterly Core Earnings data which is available from 2012. Because Earnings Distortion and Hidden Distortion require 4 quarter of data for smoothing, their backtesting sample will start from 2013. For the Analyst vs Core Earnings component, we use the first 3 years of data to initialize the Holt-Winters model. Hence, its backtesting sample starts from 2015.
Table 4 shows the decile long-short portfolio returns and Sharpe ratios for all 3 components: Earnings Distortion, Hidden Distortion, and Analyst vs Core Earnings. The portfolio is long stocks with large negative earnings distortion and large positive growth expectations from the sell-side relative to our Core Earnings forecast (short stocks with large positive earnings distortion and large negative growth expectations). All three features produce positive alpha over their sample periods, and the performance is particularly strong in recent years. Additionally, their performances are not perfectly synchronized, suggesting potential benefits of combining them to form a blended signal.
Table 4: Long-short portfolio returns of the Core Earnings signal’s three components
Earnings Distortion Hidden Distortion Analyst vs Core Earnings
Annual Return
Sharpe Ratio
Annual Return
Sharpe Ratio
Annual Return
Sharpe Ratio
Full Sample 6.6% 0.69 5.2% 0.89 4.7% 0.61
2013 12.2% 2.65 3.8% 0.80
2014 -7.1% -1.41 -5.0% -1.11
2015 -11.0% -1.56 -1.1% -0.22 0.8% 0.16
2016 19.8% 1.46 8.1% 1.15 5.7% 0.95
2017 6.2% 0.91 -0.2% -0.05 3.9% 0.87
2018 -3.2% -0.65 1.4% 0.24 3.9% 0.95
2019 7.4% 1.05 1.8% 0.39 12.5% 2.28
2020 15.3% 0.91 22.8% 2.99 1.3% 0.09
2021 42.3% 3.20 30.2% 3.31 5.1% 0.85
Table 5 shows the difference in results from benchmarking analyst forecasts with Core Earnings forecasts versus net income forecasts.
Table 5: Long-short portfolio returns for Analyst vs Core Earnings Forecasts component only (benchmarking analyst consensus forecasts using Core Earnings forecasts and net income forecasts)
Analyst consensus forecast vs. Core Earnings forecast
Analyst consensus forecast vs. net income forecast
Annual Return Sharpe Ratio Annual Return Sharpe Ratio
As described in the prior Backtesting Methodology section, we combine three components using a static, equal-weighted approach. Figure 2 shows the average annualized return of deciles portfolios formed using the final Core Earnings signal. In general, the signal is positively related to future stock returns and the relationship is monotonic. The relationship is much stronger on the top and bottom decile, where the difference in annualized return is over 10%.
Figure 2: Average return by decile
10.9%
14.8% 14.8%
15.9%
14.3%
16.2% 16.1% 16.0%
17.5%
21.1%
10%
12%
14%
16%
18%
20%
22%
1 2 3 4 5 6 7 8 9 10
Core Earnings Signal: average annualized return by signal deciles
Figure 3 shows the long-short returns of the signal and its components: overall, the annualized return is 10.1% with Sharpe ratio of 1.44. Since the rebalancing frequency is monthly, the daily average turnover is very low at only 1.2%; net return (9.1% p.a.) is very similar to the gross return (10.1% p.a.).
Figure 3: Long-short returns of Core Earnings signal and components
In Table 7, we show the signal’s detailed performance and breakdown by year. The basic decile portfolio is sufficiently diversified, with about 220 stocks in each of the long and short sides on average. If we form a more extreme portfolio using the top 5% and bottom 5%, the annualized return improves to 13.0% with nearly identical Sharpe ratio of 1.43. With the exception of 2015, the signal generates positive returns for all years and its performance is particularly strong in years 2020 and 2021. Furthermore, the signal seems to work better among small caps (a group roughly analogous to Russell 2000 constituents), possibly because market information for them is more opaque and, thus, their distortion is less likely to be anticipated by the market.
Table 7: Long-short portfolio returns of the Core Earnings signal, details and breakdown by year
Table 8 (next page) shows the signal’s performance if we form the long-short portfolio within each sector. To ensure a reasonably diversified portfolio, we adjust our settings to long-short 80%/20% (hence a smaller magnitude of return than previously shown).
Among all sectors, the signal performs well in consumer discretionary, materials, and commercial services, but not in healthcare, finance, and utilities. If we exclude the worst-performing 5 sectors and rerun the backtest, the signal generates an annualized return of 14.1% (Table 9, next page) which is much larger than the 10.1% generated when using the full universe.
2 The Large Cap refers to the largest 500 stocks by market cap in our investible universe, Mid Cap refers to the next 500 stocks by market cap ranking and Small Cap refers to all remaining stocks in the universe.