New Developments in Surface Profile Measurement for Blast Cleaned Surfaces J F Fletcher, Technical Support Manager & D Leonard, Customer Support Engineer Elcometer Limited Edge Lane Manchester M43 6BU UK Tel: +44 (0) 161 371 6000 Fax: +44 (0) 161 371 6010 e-mail: [email protected][email protected]Abstract: When protective coatings are to be applied to structures, it is important that the surface is clean and dry if premature failure of the coating is to be prevented and the full coating service life achieved. In many situations for both new build and repair of structures, blast cleaning of the surface is required to remove contamination and to create an anchor pattern to enhance the adhesion of the coating system to the substrate. The measurement of the profile is important in achieving the specification but also to ensure that the blast cleaning process is in control and not producing inadequate or excessive profile height. There are two ASTM standards that deal with surface profile assessment, D 4417, Standard Test Methods for Field Measurement of Surface Profile of Blast Cleaned Steel, and D 7127, Standard Test Method for Measurement of Surface Roughness of Abrasive Blast Cleaned Metal Surfaces Using a Portable Stylus Instrument. D 4417 describes three methods for either assessing the profiled surface, Method A the surface comparator, or measuring the profile height, Method B, the Depth Gauge and Method C, Replica Tape. D 7127 describes the stylus measurement technique giving results for both profile height and peak density. This paper describes the equipment that is currently available for these test methods and discusses the differences in both the methods and the resulting measurements including the calibration of the surface comparators. The significance of these differences will be analysed in the context of typical grit and shot blasted surfaces. Introduction Blast cleaning of steel substrates to remove mill scale, rust, contaminants such as oil and grease and soluble salts is a commonplace process for steel fabrications of all types. Several different methods are available including dry abrasive blasting, wet abrasive blasting, hand and power tool cleaning, etc. In general, the assessment of the surface for rust removal after the process is by visual comparison with cleanliness standards such as the Swedish Rust Standard, ISO 8501 - 1 or the SSPC VIS 1, VIS 3 or VIS 5. However, these substrate cleaning processes are also intended to roughen the surface to provide a profile or anchor pattern to which the coating will adhere more strongly than if it were applied to a smooth surface. In addition to the removal of contaminants, the creation of a profile affects other
Transcript
New Developments in Surface Profile Measurement for Blast Cleaned Surfaces
Abstract: When protective coatings are to be applied to structures, it is important that the surface is clean and dry if premature failure of the coating is to be prevented and the full coating service life achieved. In many situations for both new build and repair of structures, blast cleaning of the surface is required to remove contamination and to create an anchor pattern to enhance the adhesion of the coating system to the substrate. The measurement of the profile is important in achieving the specification but also to ensure that the blast cleaning process is in control and not producing inadequate or excessive profile height. There are two ASTM standards that deal with surface profile assessment, D 4417, Standard Test Methods for Field Measurement of Surface Profile of Blast Cleaned Steel, and D 7127, Standard Test Method for Measurement of Surface Roughness of Abrasive Blast Cleaned Metal Surfaces Using a Portable Stylus Instrument. D 4417 describes three methods for either assessing the profiled surface, Method A the surface comparator, or measuring the profile height, Method B, the Depth Gauge and Method C, Replica Tape. D 7127 describes the stylus measurement technique giving results for both profile height and peak density. This paper describes the equipment that is currently available for these test methods and discusses the differences in both the methods and the resulting measurements including the calibration of the surface comparators. The significance of these differences will be analysed in the context of typical grit and shot blasted surfaces.
Introduction Blast cleaning of steel substrates to remove mill scale, rust, contaminants such as oil and grease and soluble salts is a commonplace process for steel fabrications of all types. Several different methods are available including dry abrasive blasting, wet abrasive blasting, hand and power tool cleaning, etc. In general, the assessment of the surface for rust removal after the process is by visual comparison with cleanliness standards such as the Swedish Rust Standard, ISO 8501 - 1 or the SSPC VIS 1, VIS 3 or VIS 5. However, these substrate cleaning processes are also intended to roughen the surface to provide a profile or anchor pattern to which the coating will adhere more strongly than if it were applied to a smooth surface. In addition to the removal of contaminants, the creation of a profile affects other
aspects of the coating process such as adhesion and paint coverage, hence the volume of the coating used to achieve a given thickness. The measurement of the peak-to-valley height for the profile is an important parameter to consider in the control of the coating process in order to prevent excessive paint usage when the profile height is too great or insufficient adhesion when the profile height is too low. ASTM D4417 – 11, “Standard Test Methods for Field Measurement of Surface Profile of Blast Cleaned Steel” describes three methods for profile assessment or measurement, one of which is a visual/tactile comparison method. The other two methods measure the peak-to-valley height in different ways. ASTM D7127 – 05, “Standard Test Method for the Measurement of Surface Roughness of Abrasive Blast Cleaned Metal Surfaces using a Portable Stylus Instrument” describes a method based on a further technique and this method is currently under review by ASTM sub-committee D01.46, Industrial Protective Painting. A draft SSPC document called “Procedure for Determining Conformance to Steel Profile/Surface Roughness/Peak Count Requirements” is being prepared for publication and was balloted by the technical committee during 2012. This document is intended to give guidance on the number of readings or assessments for each of the methods described in D4417, D7127 and ISO 8503 parts 4 and 5. The draft document also references NACE RP0287. Blast cleaned profiles are complex three dimensional surfaces and figure 1 below illustrates the scale and variation of the profile that can be expected.
Figure 1 - 3-D view of a Grit Blast Surface (Courtesy of Corus)
Surface Profile Measurement Methods D4417 lists three methods for the field measurement of surface profile, Method A—The blasted surface is visually compared to standards prepared with various surface profile depths and the range determined, Method B—The depth of profile is measured using a fine pointed probe at a number of locations and the arithmetic mean determined, Method C—A composite plastic tape is impressed into the blast cleaned surface forming a reverse image of the profile and the maximum peak to valley distance measured with a micrometre.
Method A is commonly referred to as the Surface Comparator and the most commonly used version is the “ISO Surface Comparator”, which meets the requirements of ISO 8503 – 1. There are two versions of this comparator, one for grit blasted surfaces and one for shot blasted surfaces. The difference can be seen in the shape of the profile, the grit profile is angular and the shot profile is more rounded. Figure 2 shows a typical ISO comparator. Each ISO comparator has four segments representing grades of profile depth. The comparator is used by either visual or tactile comparison with the surface to be inspected and the two segments that bracket the test surface are determined.
Figure 2 – The ISO Comparator for Grit. Other similar comparators include the Keene-Tator Surface Comparator, the Rubert Surface Comparator and the Rugotest Surface Comparator. These are less commonly used since the ISO test method was published, but as paint specifications have a relatively long life they are still used. Figure 3 shows the Keene-Tator Surface and Rubert Comparators.
Figure 3 – The Keene-Tator Surface Comparator with Magnifier and Shot, Grit and Sand Discs On the Left and the Rubert Surface Comparators on the Right
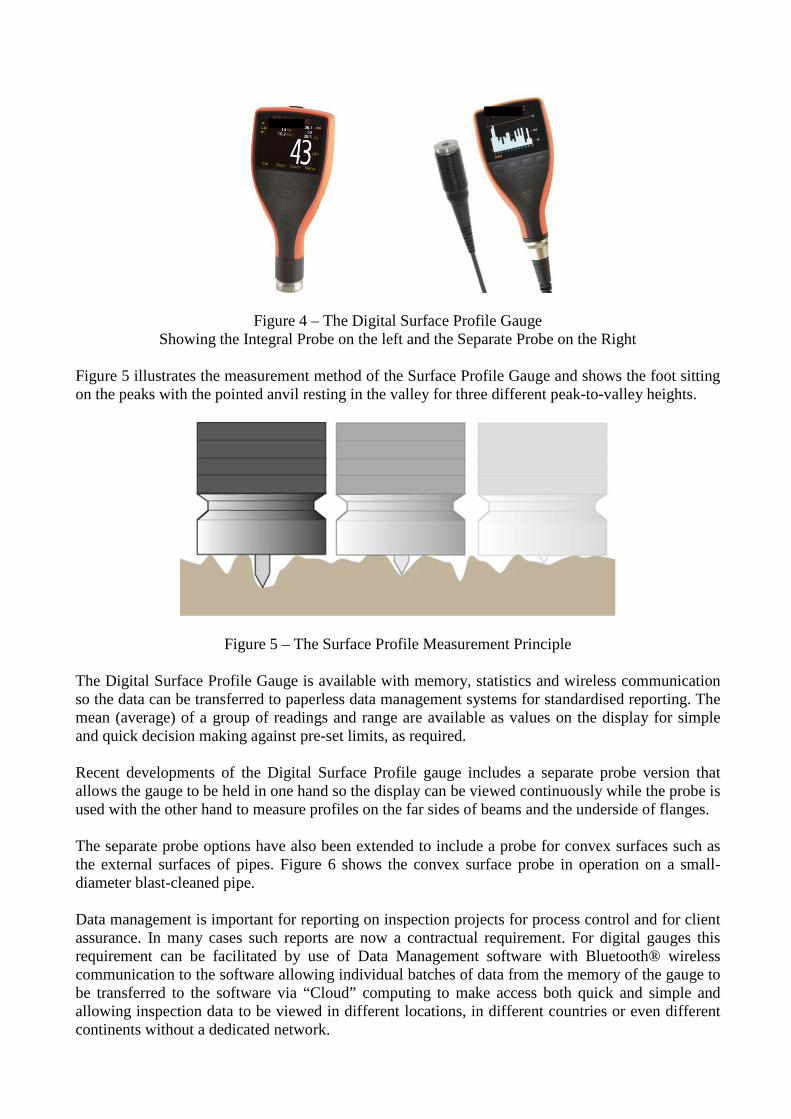
Method B describes the dial gauge depth micrometre, also known as the Surface Profile Gauge. This gauge measures the depth of the valleys relative to the peaks using a pointed probe. The base of the foot sits on the peaks while the spring-loaded pointed probe or tip projects in to the valleys. The tip is defined as having a 60° angle with a nominal radius of 50 µm. Figure 4 shows a current version of the surface profile gauge with the choice of an integrated probe or a separate probe.
Figure 4 – The Digital Surface Profile Gauge Showing the Integral Probe on the left and the Separate Probe on the Right
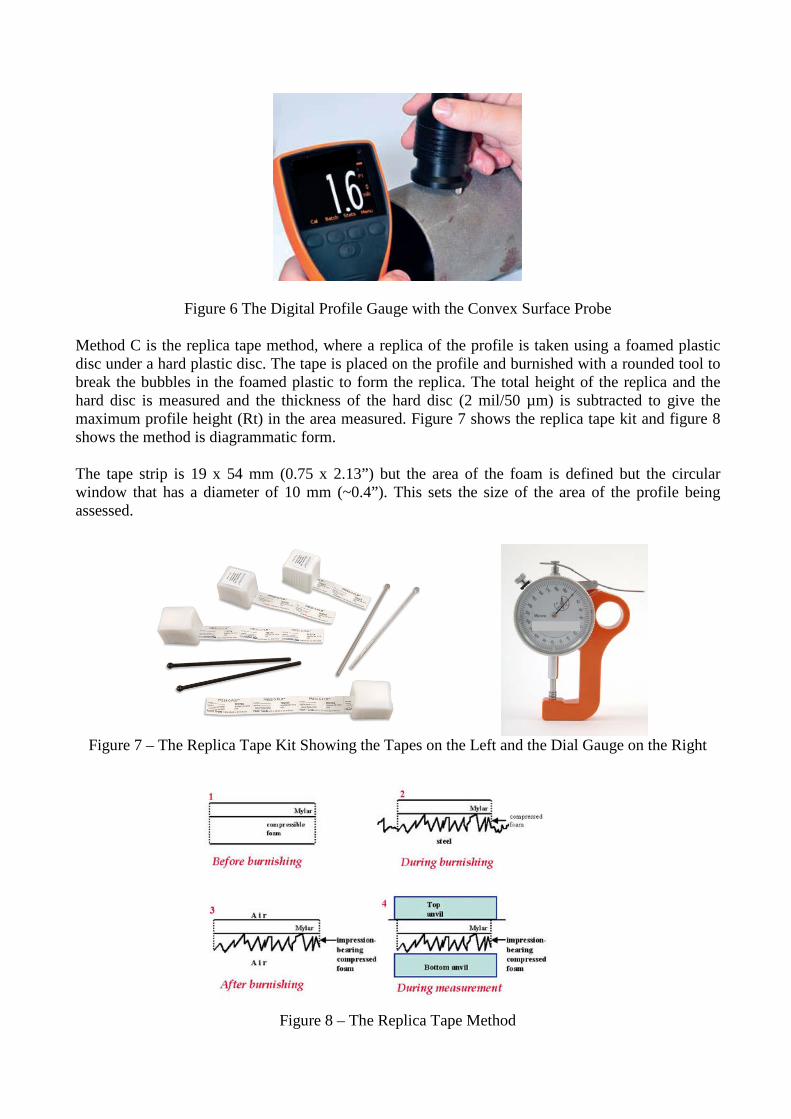
Figure 5 illustrates the measurement method of the Surface Profile Gauge and shows the foot sitting on the peaks with the pointed anvil resting in the valley for three different peak-to-valley heights.
Figure 5 – The Surface Profile Measurement Principle The Digital Surface Profile Gauge is available with memory, statistics and wireless communication so the data can be transferred to paperless data management systems for standardised reporting. The mean (average) of a group of readings and range are available as values on the display for simple and quick decision making against pre-set limits, as required. Recent developments of the Digital Surface Profile gauge includes a separate probe version that allows the gauge to be held in one hand so the display can be viewed continuously while the probe is used with the other hand to measure profiles on the far sides of beams and the underside of flanges. The separate probe options have also been extended to include a probe for convex surfaces such as the external surfaces of pipes. Figure 6 shows the convex surface probe in operation on a small-diameter blast-cleaned pipe. Data management is important for reporting on inspection projects for process control and for client assurance. In many cases such reports are now a contractual requirement. For digital gauges this requirement can be facilitated by use of Data Management software with Bluetooth® wireless communication to the software allowing individual batches of data from the memory of the gauge to be transferred to the software via “Cloud” computing to make access both quick and simple and allowing inspection data to be viewed in different locations, in different countries or even different continents without a dedicated network.
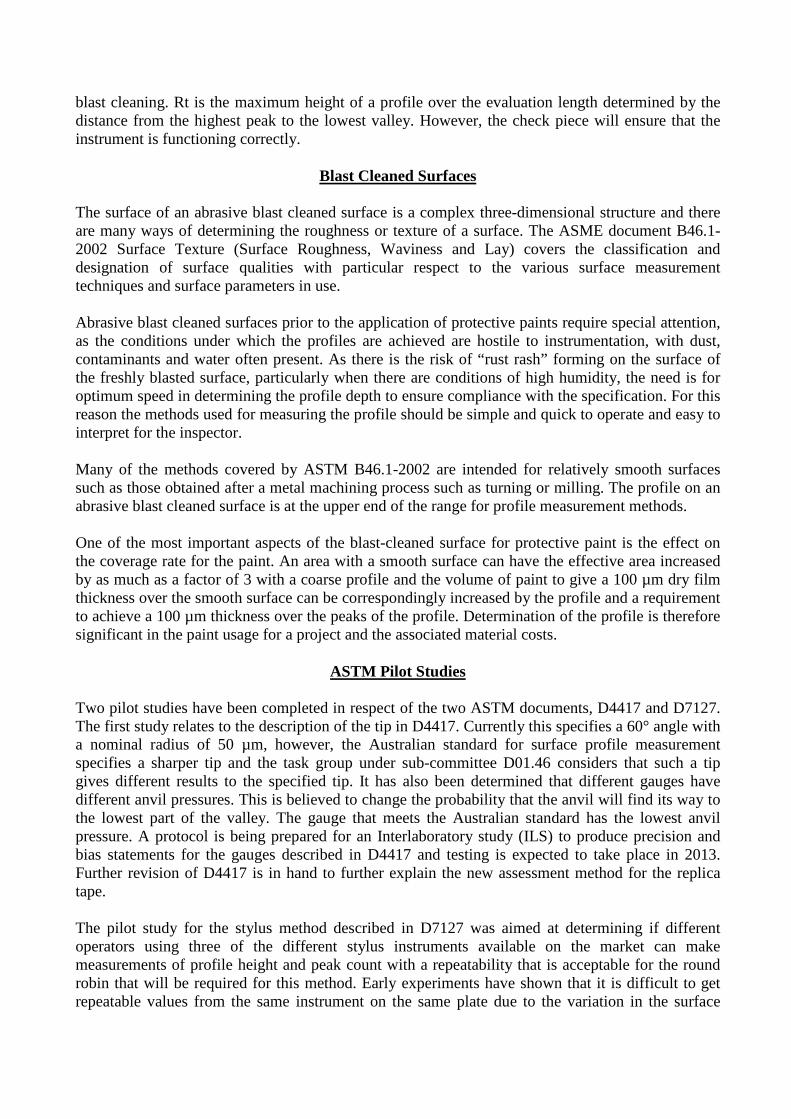
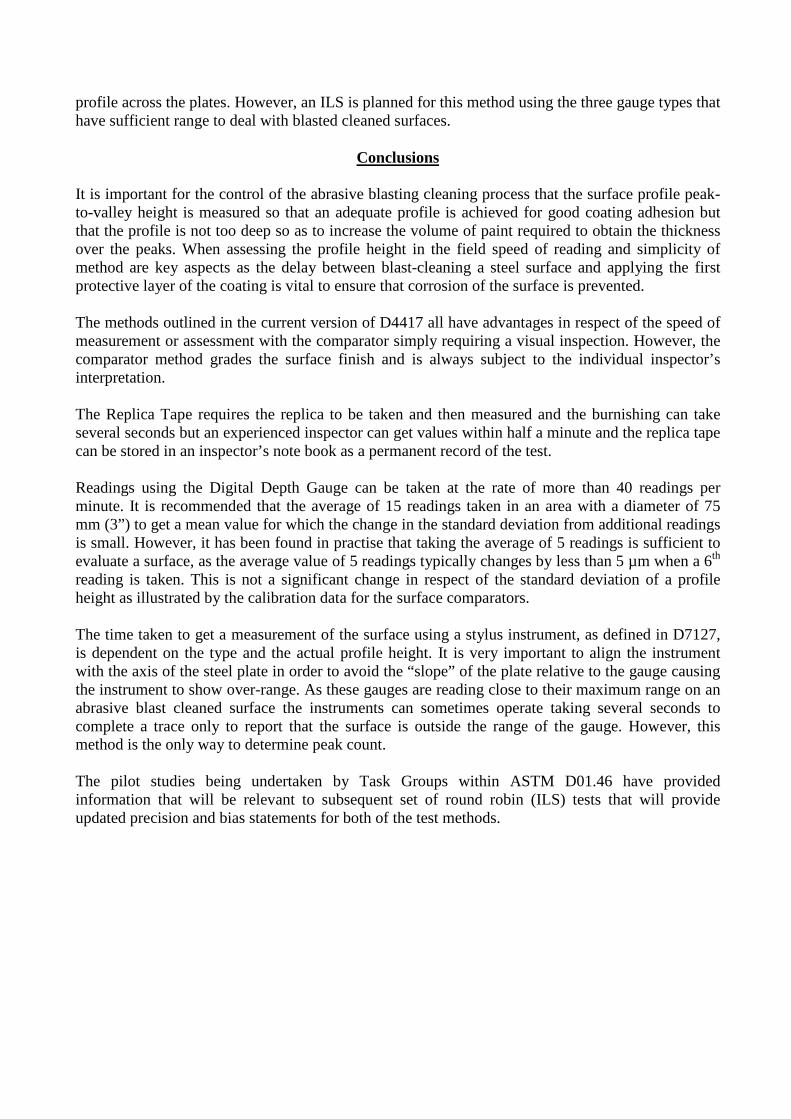
Figure 6 The Digital Profile Gauge with the Convex Surface Probe Method C is the replica tape method, where a replica of the profile is taken using a foamed plastic disc under a hard plastic disc. The tape is placed on the profile and burnished with a rounded tool to break the bubbles in the foamed plastic to form the replica. The total height of the replica and the hard disc is measured and the thickness of the hard disc (2 mil/50 µm) is subtracted to give the maximum profile height (Rt) in the area measured. Figure 7 shows the replica tape kit and figure 8 shows the method is diagrammatic form. The tape strip is 19 x 54 mm (0.75 x 2.13”) but the area of the foam is defined but the circular window that has a diameter of 10 mm (~0.4”). This sets the size of the area of the profile being assessed.
Figure 7 – The Replica Tape Kit Showing the Tapes on the Left and the Dial Gauge on the Right
Figure 8 – The Replica Tape Method
The method described in D7127 uses a stylus profile tracing instrument to measure Rt and Pc, where Rt is the distance between the highest peak and lowest valley within any evaluation length and Pc (Peak Count) is the number of peak/valley pairs per unit length. The method is limited to the measurement of surface roughness where Rt is in the range 10 to 150 µm (0.4 to 6.0 mil) and where the peak count is less than 180 peaks/cm (450 peaks/in). A typical stylus instrument is shown in figure 9.
Figure 9 – A Portable Stylus Profile Gauge
Field Verification
Surface Comparators Field verification of the Surface Comparators is limited to the inspection of the condition of the comparator. ISO 8503 – 2 describes the calibration of the surface comparator defined in ISO 8503 – 1 using one of two methods. Method 1 is the focusing microscope technique, where the microscope is first focused on the top of a peak and then on the next valley and the difference in the position of the focusing vernier is the peak to valley height at that point (h max). Method 2 is the stylus method using Rtm as the measurement parameter. However, the cost of carrying out these measurements on a comparator far exceeds the cost of a new comparator and replacement rather than re-calibration is the norm. Field verification is therefore achieved by the user ensuring that the comparator is in good condition and undamaged. Dial Gauge Depth Micrometers Verification of the Surface Profile Gauges also relies heavily on the user ensuring that the gauge is in good condition with particular reference to the condition of the tip. Made of tungsten carbide for the wear properties these tips can be cracked with material falling off the tip making it unfit for use. A simple visual inspection ensures that the tip is in good condition and before use the gauge should be set to zero by placing the foot on a piece of flat glass such as a microscope slide to align the tip and the foot and ensure that the gauge is set to zero. Calibration and re-calibration of these gauges is possible with the use of matched pairs of gauge blocks to control the height of the foot relative to the probe tip, one block either side of the tip and using a disposable gauge block to hold the tip in position while the gauge reading is checked. A calibration certificate can be issued based on the readings obtained using the stacks of gauge blocks and as these gauge blocks are themselves certified with traceability to the National Physical Laboratory in the UK or to NIST in the US, the certificate also has this traceability. Field checks can be carried out using a ceramic shim with a thickness measurement carried out in the same way that coating thickness shims are measured. The shim is nominally 500 µm thick but is
measured at four points round the hole in the centre of the shim that allows the tip through to a base plate such as the glass plate used to set the gauge to zero. The gauge should read the same value as the ceramic shim to confirm the correct function of the measurement. 500 µm is the top end of the scale of the Digital Surface Profile Gauge but it has been found that thinner ceramic shims are not sufficiently rugged for this purpose and crack easily. A method has been determined for metal shims of measured thickness with a laser-cut hole to allow the anvil to pass through to the reference surface. Stainless steel shims with values of 125 µm, 250 µm and 380 µm can be used on the glass reference piece to determine if the gauge is measuring correctly on these intermediate thickness values. Replica Tape The only verification that can be undertaken for the replica tape is for the dial gauge used to measure the total tape thickness after the replica has been formed. The dial gauge readings can be checked using the same measured thickness foils or shims that are provided for coating thickness gauges using values in the range 50 to 250 µm. A typical set of foils is shown in figure 10. Foils of this type can be supplied with a calibration certificate and the measurements are traceable to NIST or other National Standards such as the National Physical Laboratory in the UK.
As part of the verification process, it is essential to ensure that the correct grade of replica tape is used to measure the profile in question. Each tape has an upper and lower limit for the range of profile height. Table 1 below shows the profile ranges for the three commonly used tapes.
Tape Type Profile Range (Metric) Profile Range (Imperial) Coarse 20 – 50 µm 0.8 – 2.0 mil
X-Coarse 38 – 114 µm 1.5 – 4.5 mil X-Coarse Plus 115 – 152 µm 4.5 – 5.8 mil
Table 1 – Profile Ranges for the Common Replica Tape Types
Stylus Gauge The stylus gauges are normally supplied with a check piece that can be used to confirm that the gauge is functioning correctly. It should be noted that the check piece is normal measured using the roughness average method, Ra. This is defined as the arithmetic average of the absolute values of the profile height deviations recorded within the evaluation length and measured from the mean line. This is not the same as the Rt value required for the assessment of profiles achieved by abrasive
blast cleaning. Rt is the maximum height of a profile over the evaluation length determined by the distance from the highest peak to the lowest valley. However, the check piece will ensure that the instrument is functioning correctly.
Blast Cleaned Surfaces The surface of an abrasive blast cleaned surface is a complex three-dimensional structure and there are many ways of determining the roughness or texture of a surface. The ASME document B46.1-2002 Surface Texture (Surface Roughness, Waviness and Lay) covers the classification and designation of surface qualities with particular respect to the various surface measurement techniques and surface parameters in use. Abrasive blast cleaned surfaces prior to the application of protective paints require special attention, as the conditions under which the profiles are achieved are hostile to instrumentation, with dust, contaminants and water often present. As there is the risk of “rust rash” forming on the surface of the freshly blasted surface, particularly when there are conditions of high humidity, the need is for optimum speed in determining the profile depth to ensure compliance with the specification. For this reason the methods used for measuring the profile should be simple and quick to operate and easy to interpret for the inspector. Many of the methods covered by ASTM B46.1-2002 are intended for relatively smooth surfaces such as those obtained after a metal machining process such as turning or milling. The profile on an abrasive blast cleaned surface is at the upper end of the range for profile measurement methods. One of the most important aspects of the blast-cleaned surface for protective paint is the effect on the coverage rate for the paint. An area with a smooth surface can have the effective area increased by as much as a factor of 3 with a coarse profile and the volume of paint to give a 100 µm dry film thickness over the smooth surface can be correspondingly increased by the profile and a requirement to achieve a 100 µm thickness over the peaks of the profile. Determination of the profile is therefore significant in the paint usage for a project and the associated material costs.
ASTM Pilot Studies Two pilot studies have been completed in respect of the two ASTM documents, D4417 and D7127. The first study relates to the description of the tip in D4417. Currently this specifies a 60° angle with a nominal radius of 50 µm, however, the Australian standard for surface profile measurement specifies a sharper tip and the task group under sub-committee D01.46 considers that such a tip gives different results to the specified tip. It has also been determined that different gauges have different anvil pressures. This is believed to change the probability that the anvil will find its way to the lowest part of the valley. The gauge that meets the Australian standard has the lowest anvil pressure. A protocol is being prepared for an Interlaboratory study (ILS) to produce precision and bias statements for the gauges described in D4417 and testing is expected to take place in 2013. Further revision of D4417 is in hand to further explain the new assessment method for the replica tape. The pilot study for the stylus method described in D7127 was aimed at determining if different operators using three of the different stylus instruments available on the market can make measurements of profile height and peak count with a repeatability that is acceptable for the round robin that will be required for this method. Early experiments have shown that it is difficult to get repeatable values from the same instrument on the same plate due to the variation in the surface
profile across the plates. However, an ILS is planned for this method using the three gauge types that have sufficient range to deal with blasted cleaned surfaces.
Conclusions It is important for the control of the abrasive blasting cleaning process that the surface profile peak-to-valley height is measured so that an adequate profile is achieved for good coating adhesion but that the profile is not too deep so as to increase the volume of paint required to obtain the thickness over the peaks. When assessing the profile height in the field speed of reading and simplicity of method are key aspects as the delay between blast-cleaning a steel surface and applying the first protective layer of the coating is vital to ensure that corrosion of the surface is prevented. The methods outlined in the current version of D4417 all have advantages in respect of the speed of measurement or assessment with the comparator simply requiring a visual inspection. However, the comparator method grades the surface finish and is always subject to the individual inspector’s interpretation. The Replica Tape requires the replica to be taken and then measured and the burnishing can take several seconds but an experienced inspector can get values within half a minute and the replica tape can be stored in an inspector’s note book as a permanent record of the test. Readings using the Digital Depth Gauge can be taken at the rate of more than 40 readings per minute. It is recommended that the average of 15 readings taken in an area with a diameter of 75 mm (3”) to get a mean value for which the change in the standard deviation from additional readings is small. However, it has been found in practise that taking the average of 5 readings is sufficient to evaluate a surface, as the average value of 5 readings typically changes by less than 5 µm when a 6th reading is taken. This is not a significant change in respect of the standard deviation of a profile height as illustrated by the calibration data for the surface comparators. The time taken to get a measurement of the surface using a stylus instrument, as defined in D7127, is dependent on the type and the actual profile height. It is very important to align the instrument with the axis of the steel plate in order to avoid the “slope” of the plate relative to the gauge causing the instrument to show over-range. As these gauges are reading close to their maximum range on an abrasive blast cleaned surface the instruments can sometimes operate taking several seconds to complete a trace only to report that the surface is outside the range of the gauge. However, this method is the only way to determine peak count. The pilot studies being undertaken by Task Groups within ASTM D01.46 have provided information that will be relevant to subsequent set of round robin (ILS) tests that will provide updated precision and bias statements for both of the test methods.