42
ECC Report LTE coverage measurements Approved 17 October 2016 ECC Report 256

ECC Report
LTE coverage measurements
Approved 17 October 2016
ECC Report 256

ECC REPORT 256 - Page 2
0 EXECUTIVE SUMMARY
This report gives an overview of different approaches of LTE coverage measurements. Important and within this document considered concepts are: measurement of service quality parameters; signal strength measurements; indirect and direct throughput measurements. This Report on LTE coverage measurements may be viewed from different perspectives. It addresses the measurement of the conformity with coverage obligations (which are considered in the ambit of an Administration). But it also provides many elements which might be useful for the mobile network operators (for example aiming at optimizing its network). The measurements in general can either be performed as passive measurements with receive-only equipment or active measurements with commercial user equipment. This document additionally focuses on: coverage defined by minimum field strength; coverage defined by specific parameters of service quality, like uplink and downlink throughput; coverage for mobile and fixed reception; population and area coverage. To give the reader a better understanding of the issue of LTE coverage measurements the first chapter of the document focus on the explanation of technical key parameters.
This report in particular is for administrations, which so far did execute either no or just a few measurements in the field of LTE coverage. Administrations which already fulfilled measurements on a broader scale may use this report to get new impulse by the several different approaches presented in this document.

ECC REPORT 256 - Page 3
TABLE OF CONTENTS
0 EXECUTIVE SUMMARY ............................................................................................................................ 2
1 INTRODUCTION ......................................................................................................................................... 7
2 BASICS, TERMS AND DEFINITIONS ....................................................................................................... 8 2.1 the LTE Radio system ....................................................................................................................... 8 2.2 Network structure ............................................................................................................................ 11
3 OVERVIEW OF DIFFERENT COVERAGE OBLIGATIONS .................................................................... 12 3.1 Coverage defined by minimum field strength .................................................................................. 12 3.2 Coverage defined by specified service quality ................................................................................ 13
3.2.1 Uplink and downlink throughput ............................................................................................ 13 3.2.2 Gross and net throughput ...................................................................................................... 13 3.2.3 Minimum, average and maximum throughput ....................................................................... 13
3.3 Coverage defined for mobile and fixed reception............................................................................ 14 3.4 population and area coverage ......................................................................................................... 15
4 KEY PARAMETERS ................................................................................................................................. 16 4.1 Field strength and Received signal level ......................................................................................... 16 4.2 RSRP (reference signal received power) ........................................................................................ 17 4.3 CQI (Channel quality indicator) ....................................................................................................... 18 4.4 Throughput (or bitrate) in kbps ........................................................................................................ 19 4.5 Dependency between parameters .................................................................................................. 19 4.6 Additional requirements ................................................................................................................... 20
5 MEASUREMENT CONCEPTS ................................................................................................................. 21 5.1 General considerations ................................................................................................................... 21
5.1.1 Passive measurements with receive-only equipment ........................................................... 21 5.1.2 Active measurements with commercial user equipment ....................................................... 21 5.1.3 Measurement speed .............................................................................................................. 21 5.1.4 Comparison between measurements with active and passive equipment............................ 22 5.1.5 Measurement antenna setup ................................................................................................. 23
5.2 Direct measurement of obligation criteria ........................................................................................ 23 5.3 Verifying coverage prediction data from operator ........................................................................... 24 5.4 Crowdsourcing to verify coverage ................................................................................................... 27
6 COVERAGE MEASUREMENTS .............................................................................................................. 30 6.1 General measurement setup ........................................................................................................... 30 6.2 Measurement of CQI ....................................................................................................................... 30 6.3 RSRP measurement ....................................................................................................................... 30 6.4 Throughput measurement ............................................................................................................... 31
6.4.1 Direct throughput measurement ............................................................................................ 31 6.4.2 Indirect throughput measurement.......................................................................................... 32
7 EXAMPLES OF COMMON MEASUREMENTS ....................................................................................... 35 7.1 Received Signal strength measurement ......................................................................................... 35
7.1.1 Introduction ............................................................................................................................ 35 7.1.2 Format of the files .................................................................................................................. 35 7.1.3 Measurement route ............................................................................................................... 35 7.1.4 Measurement equipment ....................................................................................................... 36 7.1.5 Drive Test .............................................................................................................................. 36 7.1.6 Aggregation (binning) ............................................................................................................ 36 7.1.7 Criteria for measuring the coverage of a test point ............................................................... 36

ECC REPORT 256 - Page 4
7.1.8 Analysis per pixel ................................................................................................................... 37 7.1.9 Global analysis ...................................................................................................................... 38 7.1.10 Acceptance criteria .......................................................................................................... 38 7.1.11 Data presentation............................................................................................................. 38 7.1.12 Approval phase ................................................................................................................ 40
8 CONCLUSION .......................................................................................................................................... 41
ANNEX 1: LIST OF REFERENCE .................................................................................................................. 42
ECC REPORT 256 - Page 5
LIST OF ABBREVIATIONS Abbreviation Explanation 3GPP 3rd Generation Partnership Project BEREC Body of European Regulators for Electronic Communications CEPT European Conference of Postal and Telecommunications Administrations C/N+I Carrier to (Noise and Interference) COFDM Coded Orthogonal Frequency Division Multiplex CPICH Common pilot channel CQI Channel Quality Indicator dBµV/m Decibel above 1 microvolt per meter dBm Decibel referenced to milliwatts DTM Digital terrain model ECC Electronic Communications Committee ECC PT1 ECC Project Team 1 - IMT matters eNodeB Evolved Node B (=LTE base station) GIS Geographic information system GSM Global System for Mobile Communications IP Internet protocol ITU International Telecommunication Union JRC Joint Research Council kbit/s kilobit per second LTE Long Term Evolution Mbit/s Megabit per second MFCN Mobile/fixed communications networks MIMO Multiple Input – Multiple Output NRA National regulatory authority OFDM Orthogonal frequency division multiplex P-RACH Physical Random Access Channel PBCH Physical broadcast channel PDCCH Physical downlink control channel PDSCH Physical downlink shared channel PSS Primary synchronisation signal QAM Quadrature Amplitude Modulation QPSK Quarterly Phase Shift Keying RB Resource block RS Reference Signal RSCP Received signal code power RSPG Radio Spectrum Policy Group RSRP Reference signal received power RSRQ Reference Signal Received Quality RSSI Received Signal Strength Indicator RxLEV Received signal level

ECC REPORT 256 - Page 6
RxQUAL Received signal quality SINR Signal-to-interference-plus-noise ratio SSS Secondary synchronisation signal UE User equipment UMTS Universal Mobile Telecommunications System UTRA UMTS terrestrial radio access WCDMA Wide Code Division Multiple Access WG FM Working Group Frequency Management

ECC REPORT 256 - Page 7
1 INTRODUCTION
In 2014, ECC had noted the need to assess the various coverage obligations in force and how they are controlled and assessed in general. In the following a questionnaire on coverage obligations and coverage control mechanisms (measurements and/or simulations) was developed and shared. The information from the Administrations that answered the questionnaire has been collected and the ECC Report 231 [1] on mobile coverage obligations was issued 6 March 2015.
The ECC Report 231 takes the following aspects into account:
Overview of the situation regarding coverage obligations in CEPT and identifying the types of coverages in practice;
Analysis of the criteria’s for the availability of coverage per type of service; Analysis of the enforcement of coverage obligations for Rights of Use/authorisations to use the spectrum; Additional possibility for future practice. Based on the analysis done in the ECC Report 231, it can be said that many different approaches have been chosen throughout the CEPT concerning coverage obligations and relevant enforcement measures. It is difficult to seek to establish one harmonised approach to coverage obligations and enforcement, largely due to the different policy reasons for national administrations deciding to set coverage obligations, such as specific areas of population or geographical coverage requirements. Because of this wide range of approaches to coverage obligations and enforcement and the number of countries that indicated a significant interest in the subject of measurement, this Report on hand with focus on measuring the LTE coverage was developed.
This report provides information on different concepts like obligations by field strength, specified service quality or populations and area coverage. Due to the wide range of approaches various key parameters of measurements like field strength, RSRP, CQI or throughput have been described. The ECC Report 231 reveals that especially the measurement concepts for coverage specification differ throughout the countries. Since it depends on the situation and background of a country which concept will turn out to be the most suitable, different measurement concepts are described in a dedicated chapter.

ECC REPORT 256 - Page 8
2 BASICS, TERMS AND DEFINITIONS
2.1 THE LTE RADIO SYSTEM
LTE (Long Term Evolution) specifies a system mainly designed to provide access (mobile or stationary) to data services via radio. The key specifications of the RF signal in the frequency domain are laid down in ETSI TS 136 104 [3] and in ETSI EN 301 908 [2] the harmonised European standard allowing to put this equipment on the market in Europe according to the Radio Equipment Directive.
The downlink signal uses OFDMA with a varying number of subcarriers having a separation of 15 kHz. The possible RF bandwidths are as follows:
Table 1: RF bandwidth relevant parameters of the LTE downlink
Channel width No. of subcarriers (incl. centre carrier)
Signal bandwidth
1.4 MHz 73 1.095 MHz
3 MHz 181 2.715 MHz
5 MHz 301 4.515 MHz
10 MHz 601 9.015 MHz
15 MHz 901 13.515 MHz
20 MHz 1201 18.015 MHz
The properties of the downlink signal in the time domain is described in ETSI TS 136 211 [4]. The information is transmitted in frames of 10 ms length. Each frame consists of 10 sub-frames carrying different physical channels. The OFDM symbol duration is 71.3 µs for a CP (Cyclic Prefix) of 4.7 µs.
To minimise destructive interference from overlapping neighbour cells, the LTE base stations are normally exactly time-synchronised so that the repetition rate for each physical channel is kept very constant over a long time.

ECC REPORT 256 - Page 9
Figure 1: LTE downlink physical channels and resulting power vs. time
fc 1.08MHz
5 ms t
A
5 ms t

ECC REPORT 256 - Page 10
The broadcast channel occupies the inner 1.08 MHz in the LTE spectrum and is transmitted with full power. The same applies to the reference signals. These signals have to be received and decoded by user equipment (UE) in order to recognise the LTE base station and log into the network.
User data is transmitted in so-called “Resource Blocks” (RB) consisting of a group of 12 subcarriers for a time of 0.5 ms (7 OFDM symbols). The carriers of each resource block can be modulated QPSK, 16QAM or 64QAM, and their power is reduced so that UE can just decode them. Depending on the number of active UEs, the current data requirement of each UE, and the radio link quality to each active UE, the so-called “scheduler” decides how many RBs are allocated to each UE in a radio frame, where inside the spectrum each UE’s RBs are positioned, and which modulation and RF power is used for each of these RBs. Because this situation constantly changes, the resulting LTE radio signal is highly dynamic.
In real operation modes it is rather unlikely that all user data carriers need to be transmitted with maximum possible power. Therefore, the principle LTE downlink spectrum - when recorded with a spectrum analyser - looks as follows:
Figure 2: Simplified LTE downlink spectrum
In some LTE networks certain signals such as PBCH, PSS/SSS and RS are “boosted” which mean that their level can be up to 3 dB higher than the maximum level of the user data carriers. This has influence on the part of the LTE signal that has to be measured when the maximum possible power of the LTE station is to be assessed. The information if and which of the signals are boosted has to be taken from the network provider or measured with specialised equipment.
The LTE standard specifies MIMO in the downlink channel. The transmit antenna at the base station is therefore cross-polarised (typically +/-45°) and allows transmission of different data over the two polarisation planes to increase throughput.
A
f 1.08 MHz

ECC REPORT 256 - Page 11
2.2 NETWORK STRUCTURE
LTE uses the IP Protocol to connect the user equipment via a radio link to the Internet or other networks. From the viewpoint of the user, the principle network structure is as follows:
Figure 3: Functional components for internet access through LTE
www
UE Radio link
Serving eNodeB
Back-bone
Internet Target server
Target provider
Other eNodeB

ECC REPORT 256 - Page 12
3 OVERVIEW OF DIFFERENT COVERAGE OBLIGATIONS
The following functionality may be expected by the user, and may therefore also be considered as coverage obligations.
Being able to log on to the network;
Being able to establish an active connection with a destination (server) in the internet;
Achieving a certain throughput in a connection.
The first two stages can be achieved with relatively low signal quality. However, they are not sufficient for the customer to make practical use of the system. As a practical means to specify the performance of a network in the view of the end user, a certain throughput is often defined as a coverage obligation.
3.1 COVERAGE DEFINED BY MINIMUM FIELD STRENGTH
In order to detect the presence of an LTE network and log on a certain minimum field strength has to be available at the location of the user equipment (UE). The field strength is also a parameter that computerised tools use for the planning of the network. Therefore, a minimum field strength or an assumed minimum signal level present at the UE receiver is often used as a coverage criterion. However, in order to be of practical value, it has to be assumed that a customer can actually use the system when this minimum field strength is present at his location. It is therefore important to specify a value that is realistic in a way that commonly available UE can work at this level. In particular, it depends on:
Sensitivity of the UE receiver;
Gain of the UE antenna;
Presence of external interference reducing the SINR;
Theoretical minimum SINR of the LTE radio system.
For currently available LTE UEs a realistic value of the receiver noise figure may be 9 dB which means that the noise floor of the UE is -165 dBm in 1 Hz bandwidth. The total receiver noise level may then be calculated using logarithmic bandwidth correction, for example in the bandwidth of one LTE subcarrier it would be -165 dBm + 10*log(15kHz/1Hz) = -123 dBm.
The antenna used in the UE is often modelled by an omnidirectional antenna which has a gain of 0 dBi.
When specifying pure LTE signal coverage, it is assumed that no external interference is present. Inside an LTE network with overlapping coverage areas of the base stations, the signal from a neighbouring base station running on the same frequency does produce a certain amount of co-channel interference which may be accounted for. At the coverage border of the whole LTE network, however, a UE usually only “sees” the signal from the outmost base station in which case interference from the next base station may be neglected.
The theoretical SINR or C/(N+I) for the LTE system depends on the channel that is to be decoded. The most robust subcarrier modulation used in LTE is QPSK. Together with the minimum code rate of 78/1024 and with a certain system gain through correlation techniques and integration over multiple symbols the system requires about 3 dB C/(N+I).
When combining these figures and assumptions, the minimum signal level present at the UE receiver input to decode the LTE signal would be about -120 dBm (receiver noise in 15 kHz bandwidth + C/(N+I)). The resulting necessary field strength can then be calculated depending on the LTE frequency range and channel width.

ECC REPORT 256 - Page 13
3.2 COVERAGE DEFINED BY SPECIFIED SERVICE QUALITY
As said before, the performance and practical usefulness of a network for the end user is commonly specified in terms of available throughput (respectively data rate). However, there are certain issues that need to be considered when specifying service quality in terms of throughput.
3.2.1 Uplink and downlink throughput
Nowadays the typical use of internet services requires more data to be transmitted to the UE than from the UE. This means that the downlink carries more data than the uplink. Common examples are viewing of html pages, download of files, streaming of audio and/or video. To satisfy this requirement, internet access networks such as LTE are designed asymmetrical which means that the downlink capacity and speed is usually higher than the uplink.
When throughput is specified as a coverage obligation, usually downlink rates are meant.
3.2.2 Gross and net throughput
Like all digital transmissions, the LTE system needs a certain “overhead” consisting of error correction data and information for link management, measurement and control. Furthermore, the IP definition requires information on source and destination addresses to be transmitted. Altogether it is obvious that the LTE link has to carry more information than just the user data (also so-called useful bitrate or payload bitrate).
When throughput is defined as a coverage obligation, usually the rate for one UE is meant. When there is only one active UE in the cell, it may get all possible resource blocks in which case the throughput is equal to the total capacity of the base station. However, the network provider may limit the maximum possible number of RBs that can be allocated to one UE. The gross throughput is the total amount of bits transmitted over the LTE radio link in the RBs allocated to one UE per second.
When throughput is defined as a coverage obligation, it would be useful that the net throughput is defined. However usually the data rates known to the consumers by the mobile operators are based on the theoretical data rate defined in the standards (e.g. 150 Mbps). In the case of LTE, the number of bits in the UE’s IP stream per second is meant, i.e. including the overhead implied by the IP stack. However, common applications often measure the pure user data (without IP stack).
When designing the measurement setup it is important that the criterion for the data rate is defined exactly.
3.2.3 Minimum, average and maximum throughput
The LTE network doesn’t provide an exclusive “line” for one UE which always delivers a constant throughput. User data is rather transmitted in blocks. Even the download of large files could be split up in several blocks by the LTE scheduler. Length and delay times of each block vary considerably depending on the current total traffic load the base station has to handle and the time-varying radio channel.

ECC REPORT 256 - Page 14
Figure 4: Timing during data transfer
Due to the flexible way the scheduler organises data transfer, length and throughput for each block may be different. It is therefore obvious that the indication of “momentary throughput” is useless in such a system. Any throughput that is defined (and measured) has to be an average rate, integrated over a certain time.
From the user’s point of view, the time it takes to get the requested data is the total time from t0 to t4. However, when assessing the speed of the LTE system, the latency introduced by the reaction time of the target server in the internet would have to be excluded, so the total time for assessment of LTE throughput would be from t1 to t4.
The minimum throughput of the LTE system is the rate that one single UE gets even when an assumed maximum number of other UEs in the cell request data at the same time. This rate depends on
The maximum number of active UEs in the LTE cell; The radio link quality; The total throughput of the LTE system (Gross throughput) with QPSK modulation and maximum error
correction.
The maximum throughput would be the rate that a UE gets when it is the only active UE in the LTE cell. This rate depends on
The radio link quality, including channel conditions; The total throughput of the LTE system (Gross throughput) with 64QAM modulation and minimum error
correction; Additional higher layer limitations implied by the network operator.
The average throughput is the rate that one UE gets when averaged over an agreed integration time with typical network activity.
3.3 COVERAGE DEFINED FOR MOBILE AND FIXED RECEPTION
Both mobile (portable) and fixed reception are common in the use of LTE. For the definition of a coverage obligation, however, it is important to define which of the two scenarios are assumed.
A typical setup for fixed reception is an LTE modem connected to an outside antenna. This antenna may even have a directional pattern and/or is mounted at height of several meters above ground. At least, a line-of sight to the nearest LTE base station can be assumed. Network planning often assumes an antenna height of 10 m above ground.
User requests download
Reaction time of target server
Requested data is
available at base station
Scheduler assigns
RBs
Data transfer begins
Transfer of block 1
Scheduler assigns
RBs Transfer
of block 2 Transfer of block n
Download complete
t
…
t0 t1 t2 t4 t3

ECC REPORT 256 - Page 15
The typical mobile setup is a handheld receiver (e. g. smartphone) with a built-in antenna at street level. Typical antenna heights are around 1.5 m above ground.
The minimum requirements to decode an LTE signal not only depend on the field strength and C/(N+I) but also on the receive channel. There are three different types of receive channels:
Gauss channel: The direct line-of-sight signal is dominant or the only signal that is received; Rice channel: The received signal consists of the direct wave and reflections; Rayleigh channel: There is no line of sight to the transmitter, so that the received signal only consists of
reflections.
Depending on the local surroundings like urban, sub-urban and rural areas, for fixed reception, Gauss or Rice channels are assumed, for mobile receptions, a Rayleigh channel is assumed. The receive channel has direct influence on the signal quality, so in the planning of some systems the assumed receive channel reduces or increases the value for the minimum necessary field strength.
In any case the minimum necessary LTE field strength is higher for mobile reception than for fixed reception.
3.4 POPULATION AND AREA COVERAGE
Often the coverage obligations discussed above are defined as a certain percentage. It is, however, important to distinguish between population and area coverage. If, for example, the obligation is that the LTE network should cover 50% of the area of a country, urban areas are regarded equal to rural areas. This may require setting up base stations even in areas with little or no population. If, on the other hand, the obligation would be to cover 50% of the country’s population, it may be sufficient to cover the biggest cities of a country to fulfil the requirements. Therefore, in some cases, both population and area obligations can be imposed.
Usually, covering a certain percentage of the population requires far less base stations than covering the same percentage of the area. How far these two approaches divert in terms of number of base stations (and hence necessary investments) depend on the spreading of population over a country.
The obligations (percentage of area or percentage of population or both) depend on the political aim that is expected to be satisfied by the network.

ECC REPORT 256 - Page 16
4 KEY PARAMETERS
4.1 FIELD STRENGTH AND RECEIVED SIGNAL LEVEL
The field strength is a parameter that is usually stated in dBµV/m over the total subcarrier bandwidth. This is the only parameter that is independent of any receiving (or measurement) equipment properties and can directly be calculated (or predicted) at a location by network planning tools. It depends on the radiated RMS power of the LTE base station and the attenuation of the radio path to the receiving point.
The received signal level is the RMS RF power available at the receiver input over the whole signal bandwidth. It is directly related to the field strength by the characteristics of the receiving antenna described in the antenna factor:
dBAKEP C 107−−−= (1)
with
P = received signal level in dBm
E = field strength in dBµV/m
K = antenna factor in dB/m
AC = cable loss in dB
107 dB = conversion between dBm and dBµV at 50 Ohm
In the planning process of many networks as well as in the definition of coverage obligations, often the received signal level is stated instead of the field strength. However, this already assumes a certain receiving antenna, the properties of which have to be defined. In LTE networks, the standard receiving antenna of a mobile device is assumed to be omnidirectional and has a gain of 0 dBi (relative to an isotropic radiator). With this assumption, and using the centre frequencies of the bands as a calculation basis, the antenna factors for the relevant LTE frequency bands are as in the following table (source: ETSI TS 136 104V13.1.0(2016-04)) [3]
Table 2: Antenna factors for dipoles with a gain of 0 dBi
E-UTRA band Downlink frequency Antenna factor
1 2110 – 2170 MHz 36.8 dB/m
2 1930 – 1990 MHz 36.0 dB/m
3 1805 – 1880 MHz 35.5 dB/m
4 2110 – 2155 MHz 36.7 dB/m
5 869 – 894 MHz 29.1 dB/m
6 875 – 885 MHz 29.1 dB/m
7 2620 – 2690 MHz 38.7 dB/m
8 925 – 960 MHz 29.7 dB/m
9 1844.9 – 1879.9 MHz 35.6 dB/m
10 2110 – 2170 MHz 36.8 dB/m
11 1475.9 – 1500.9 MHz 33.6 dB/m

ECC REPORT 256 - Page 17
E-UTRA band Downlink frequency Antenna factor
12 728 – 768 MHz 27.5 dB/m
13 746 – 756 MHz 27.7 dB/m
14 758 – 768 MHz 27.6 dB/m
17 734 – 746 MHz 27.8 dB/m
33 1900 – 1920 MHz 35.8 dB/m
34 2010 – 2025 MHz 36.3 dB/m
35 1850 – 1910 MHz 35.7 dB/m
36 1930 – 1990 MHz 36.0 dB/m
37 1910 – 1930 MHz 35.8 dB/m
38 2570 – 2620 MHz 38.5 dB/m
39 1880 – 1920 MHz 35.7 dB/m
40 2300 – 2400 MHz 37.6 dB/m
42 3400 – 3600 MHz 41.1 dB/m
43 3600 – 3800 MHz 41.6 dB/m
It should be noted that the performance of commercially available user equipment may differ considerably from the figures above, mainly due to design restrictions resulting in different antenna gain or loss. This fact should be considered when measuring coverage using commercial UEs.
4.2 RSRP (REFERENCE SIGNAL RECEIVED POWER)
RSRP is the linear average of the received power (in watt) of the downlink reference signals contained in one radio frame at the UE receiver input terminal expressed in dBm. The averaging contains at least the power of the RS-carriers contained in the innermost subcarriers.
Because of the structure of the LTE signal, this value can only be measured with dedicated LTE UE or measurement equipment that is able to decode the LTE downlink signal.
Dedicated LTE UE report the RSRP as a value between 0 and 97 which corresponds to signal levels between -140 and -44 dBm according to Table 9.1.4-1 of ETSI TS 136 133 [5]:
Table 3: RSRP measurement report mapping
Reported value
Measured quantity value
RSRP_00 RSRP < -140 dBm
RSRP_01 -140 dBm ≤ RSRP ≤ -139 dBm
RSRP_02 -139 dBm ≤ RSRP ≤ -138 dBm
… …
RSRP_95 -46 dBm ≤ RSRP ≤ -45 dBm
RSRP_96 -45 dBm ≤ RSRP ≤ -44 dBm
RSRP_97 -44 dBm ≤ RSRP

ECC REPORT 256 - Page 18
Experimental tests with commercial UEs have shown that in a “clean” RF environment (i.e. without interference), decoding of the RS is possible from about -126 dBm RSRP on. Professional measurement receivers (e.g. scanners) may be able to decode the RS even below -140 dBm.
4.3 CQI (CHANNEL QUALITY INDICATOR)
The CQI parameter is a representation of the quality with which the UE receives the downlink signal from the base station. It is calculated from various other parameters during and/or after the decoding process. The value of CQI ranges from 0 (no demodulation possible) to 15 (best possible signal quality). The UE reports the current CQI value to the base station every 2 ms. Depending on the CQI value the scheduler at the base station determines the possible subcarrier modulation and code rate.
Table 7.2.3-1 of ETSI TS 136 213 [6] lists the following dependencies between CQI value, modulation and code rates:
Table 4: CQI index, modulation and code rates
CQI index Modulation Code rate x 1024
0 - -
1 QPSK 78
2 QPSK 120
3 QPSK 193
4 QPSK 308
5 QPSK 449
6 QPSK 602
7 16QAM 378
8 16QAM 490
9 16QAM 616
10 64QAM 466
11 64QAM 567
12 64QAM 666
13 64QAM 772
14 64QAM 873
15 64QAM 948
Empirical tests with a commercially available UE have shown that a typical interference-free RF channel results in a reported CQI of 10 or higher at RSRP-levels of approx. -109 dBm.

ECC REPORT 256 - Page 19
4.4 THROUGHPUT (OR BITRATE) IN KBPS
As described in section 3.2, the throughput is the most important network performance indicator in the view of the UEs. In particular, the throughput available to one UE is important.
Considering that the LTE radio link is a shared medium and that the scheduler may define different modulation schemes and code rates for each RB, the actual throughput for a UE depends on
The link quality;
The number of allocated RBs per UE;
The bandwidth of the LTE channel defining the maximum capacity (number of RBs) of the base station.
With a given radiated power of the base station, the link quality depends on
The distance between base station and UE;
The presence of obstacles in the radio path causing non line of sight conditions and/or reflections that may degrade the signal;
The signal level of the neighbour cells;
The presence of interference on the radio channel reducing the SINR.
4.5 DEPENDENCY BETWEEN PARAMETERS
Due to the nature of the LTE system and due to physical restrictions, some of the key parameters described above have a certain dependency. It is therefore possible – and often even advisable – to measure a key parameter indirectly, i.e. by direct measurement of another, dependent parameter followed by calculations.
One example is the throughput, which is quite difficult to measure directly (see sections 3.2 and 4.4). Assuming that a certain average throughput per UE is defined as a coverage criterion, this may be derived as follows:
Measure the CQI parameter during an active connection using commercial UE. This parameter already depends on the received signal strength and the quality of the received RF signal;
Using the values for modulation and code rate in Table 4 together with the system bandwidth in MHz and symbol length of 71 µs, the total maximum throughput of the downlink from the LTE base station to the receiving location can be calculated;
Using agreed numbers of concurrent UEs on the base station, the desired throughput per UE can be calculated.
Example:
A received signal strength of -109 dBm leads to a CQI indicator value of 10. According to Table 4 this CQI value allows a modulation scheme of 64 QAM with a code rate of 466 kbit/s per resource block. If the LTE channel is 10 MHz wide (signal bandwidth = 9 MHz, see Table 1), a maximum of 50 resource blocks can be allocated to a UE (10 MHz / 180 kHz). The maximum net throughput in this situation would then be 466 kbit/s * 50 = 23.3 Mbit/s.
This is an example where the CQI indicator is used for coverage measurements in cases where a certain throughput is expected.
Another dependency exists between field strength and received signal level through the antenna factor as described in section 4.1.
There is also a dependency between the RSRP value and received signal. First, the RSRP indicator as reported by the UE has to be converted into the received signal level of one subcarrier carrying a reference signal (RS) according to Table 3. The total received signal level can be calculated using the number of

ECC REPORT 256 - Page 20
subcarriers for the respective system bandwidth according to Table 1. Finally, if the RS power is boosted, the boost level (e. g. 3 dB) has to be deducted from the result.
4.6 ADDITIONAL REQUIREMENTS
Apart from the fact that the selected key parameter to be measured exceeds a defined threshold, some other additional requirements have to be met in order to define a measurement location as “covered”:
The LTE base station configuration allows restriction of the maximum radio path length to the UE. This ensures that the delay between assigned time slot and actual reception of the UE signal is not too long to interfere with transmission from other UEs in the next time slot. The configured maximum delay can be read from the physical random access channel (PRACH). When measurements are done in passive mode (UE does not maintain a connection to the network) it must be ensured that the actual length of the radio path to the serving base station never exceeds the configured maximum length. When measuring in active mode, the connection is automatically dropped if the actual path length gets too long.
The LTE base station can be configured to accept only connections with UEs that receive their signal with a certain minimum RSRP level. Below this level, the connection is dropped (or not established) regardless of the possible capability of the UE to hold such a connection. The configured minimum level is called RxLevMin. The actual level with which the UE receives the base station is reported by the UE in the uplink. During measurements with active equipment it must be considered that measurement results are only available when the actual RSRP is higher than the configured RxLevMin.

ECC REPORT 256 - Page 21
5 MEASUREMENT CONCEPTS
5.1 GENERAL CONSIDERATIONS
The core of the coverage measurements is the measurement receiver that is interfaced to read out the required measurement data. Typically the receiver is placed inside a measurement vehicle.
The measurement results from the receiver(s) must be linked to the geographical location of the measurement point. Usually the combined results will be stored electronically for later evaluation and presentation. In this case the receiver must have an interface where the measurement results can be accessed in real-time.
The receiver used for the measurements can be active or passive as described in the following sections.
5.1.1 Passive measurements with receive-only equipment
Passive measurements with receive-only equipment are generally only possible with LTE-specific receivers.
For this, only scanners systems for signal analysers with decoding capability can be used.
Only, with system-specific measurement equipment it is possible to read out all information that is broadcasted by the base stations such as the network-codes, cell-ID and certain configuration parameters. Furthermore, direct measurement of the RSRP value is possible. The same applies to certain commercial user equipment. However, in order to be suitable for coverage measurements, the UE must have a data interface to read out measurement results.
5.1.2 Active measurements with commercial user equipment
When the UE actively establishes a connection to the LTE network, measurements of all relevant parameters is principally possible, especially direct measurement of CQI and throughput, in addition to fast measurements of the RSRP. However, in order to be suitable for coverage measurements, it must be possible to force the UE to the LTE network to be measured (prevent fall back to other networks and inter-RAT handover if the desired LTE network is not available).
It should be noted that measurements with commercial UE are always influenced by certain properties of the particular UE such as sensitivity and implemented firmware. For example, a connection loss or interfered RF signals are handled differently by firmware of different manufacturers. While one UE could keep the connection as long as possible, even with increased error rates, another may drop it much earlier. Especially the recovery times after a connection loss are quite different between UEs, but during connection losses, no measurement data is available. This may result in longer parts of the route that are marked “not covered”, although enough signal level would be available, just because the UE wasn’t able to re-establish the connection fast enough. At least equal UEs have to be used when measuring multiple providers simultaneously.
5.1.3 Measurement speed
When field strength is measured with measurement receivers, the maximum driving speed is determined by the sample rate of the measurement receiver and the Nyquist criterion (1 sample every 0.8 λ).
When quality parameters are measured with active equipment, the “sample speed” is limited by the rate at which the measured parameter is updated. Usually this update rate is far too slow to satisfy the Nyquist criterion at practicable vehicle speeds. In this case, only measurements at distinct locations along the route will be obtained. Increased vehicle speed will then lead to a lower spatial resolution of the result.
When multiple operators and/or RF channels are to be measured simultaneously with one measurement receiver/UE, the maximum vehicle speed determined above has to be divided by the number of measurement channels.

ECC REPORT 256 - Page 22
5.1.4 Comparison between measurements with active and passive equipment
Table 5 shows principal issues and advantages of coverage measurements with both active and passive equipment. Note that the table is not comprehensive and further differences may exist that are not listed.
Table 5: Advantages of active and passive measurement
Advantages of passive measurement Advantages of active measurement
Measurement is undetected by network operator and can therefore not be influenced by him
Measurement under realistic operation in the network
Parallel measurement of multiple frequency ranges / networks with only one equipment
Extensive set of possible measurement parameters available, including measurements of throughput
Very fast measurements deliver high spatial resolution of measurement results
Measurement also delivers information about the true functionality of the network, including the connection to the internet
No SIM-cards needed, thus no operator costs
Independent of frequency band (Frequency limitation depends on the used scanning system)
Number of RS-subcarriers for RSRP-measurement is known
Table 6: Issues with active and passive measurement
Issues with passive measurement Issues with active measurement
No information about functionality of the network Measurements can be detected by network operator, possible influence through granting priority access to measurement SIMs
No measurements of virtual cells in LTE advanced networks
Throughput measurements require downloads of large files. SIM cards with sufficient data volume or flat rate necessary
Measured levels only valid if boosting of RS and/or PBCH is known (relies on information of network operator)
Availability of measurement data only when active connection is established
One UE per network operator is required
Temporary / spatial resolution of results depends on connection state of UE
Depending on parameters measured result contains large amount of data, special post-processing tools required
No data available after connection loss, recovery time depends on UE
High complexity of the total setup
Throughput measurements need a file hosting server with high-speed (internet) connection. For example measurement with 3 LTE-UE´s (each 150 Mbit/s) need a file hosting server that supports 450 Mbit/s download speed

ECC REPORT 256 - Page 23
The main advantage of passive measurement is that the parameters can be measured with calibrated equipment very accurately. Measurements with commercial UEs are always to a certain extent dependent on the properties of the UE itself and therefore not neutral.
The main advantage of active measurement is that all quality of service parameters can be measured, including throughput, and no prior information of the network configuration (e. g. RS boost level) is necessary. Measurements in passive mode are limited to certain parameters only.
5.1.5 Measurement antenna setup
The measurement receiver is connected to external antennas. Because LTE base stations commonly use cross-polarised antennas, the downlink signal is transmitted in both +/-45° polarisation planes. The typical UE also uses a cross-polarised antenna system in which case no additional loss due to polarisation mismatch has to be considered. If external measurement antennas are deployed and the measurement receiver has MIMO capability, the use of a cross-polarised antenna is recommended. Alternatively, two vertical receive antennas may be used to maintain an omnidirectional pattern. However, the two antennas must be separated as far as possible on the measurement vehicle because in this case only the spatial difference between two received radio paths can be used to separate the MIMO channels. If only one measurement antenna is used, a correction of 1.5 dB may be added to the measured levels in order to compensate for the polarisation loss.
The attenuation between antenna and measurement receiver has to be added to the readings of the input levels. If field strength is measured with a measurement receiver, the setup is suitable as long as the minimum input level defined as coverage criterion, reduced by this attenuation, is above the sensitivity of the measurement receiver. If the active measurements are performed with commercial UE, any attenuation between antenna and UE will result in parts of the driven route where no data can be obtained and coverage cannot be assessed. Because this will be the case around the “interesting” regions around the coverage border, any attenuation between antenna and receiver decreases the value of the measurement and has to be kept to a minimum.
5.2 DIRECT MEASUREMENT OF OBLIGATION CRITERIA
Direct coverage measurements aim to assess the coverage of specific points in an area (or even country – however it does not seem feasible to perform measurements to assess a country coverage) with the LTE service independent of any information from the network planners. It requires, however, much more measurement time compared to the methods described in the following sections. To gain a coverage result with reasonable accuracy, measurements have to be taken at as many locations as possible throughout the country (ideally on all roads). However, for areas where no measurements were done it will not be possible to get direct realistic results and conclusions about the coverage.
For a countrywide coverage, measurements on all roads are not practical in most cases. To reduce measurement effort, test areas could be defined and the results of measurements inside the test areas extrapolated to the whole country. If this (simplified) method is to deliver results with reasonable accuracy, care must be taken when selecting the test areas. If the obligation is to cover a certain percentage of the country’s area with LTE services, the location of the test areas have to be selected on a purely random basis. If the obligation is to cover a certain percentage of the population, the test areas would have to be selected in descending order relative to the population density (the most densely populated areas have to be measured first).
It is obvious that in any case the accuracy of the result will increase with the number of test areas measured.
The main advantage of a direct coverage measurement is that the monitoring service does not need planning information or coverage prediction maps from the network operator prior to the measurement.

ECC REPORT 256 - Page 24
5.3 VERIFYING COVERAGE PREDICTION DATA FROM OPERATOR
Nowadays, all radio networks are planned using computerised tools. Based on detailed maps of the country, the planned locations of base stations, their radiated power and radiation pattern, and applicable propagation models, the field strength at any location in the country can be predicted. The areas being covered or not covered can be calculated quite accurately, if the maps are detailed enough and the propagation model as well as the assumed minimum field strength required by commercial UE is realistic.
If the planning results (coverage maps), from the network planner, together with the assumed receiver and antenna characteristics, are available to the monitoring service, it is possible to determine the coverage of the whole country with relatively low measurement effort as follows:
Determine a predefined number of test areas or test routes;
Measure the field strength (or received signal level at a standard antenna) on as many locations inside each test area or along each test route as possible;
Compare the measurement result with the predicted result, using an agreed minimum value for field strength or received signal level.
The test areas are typically rectangular. Their number and size depends on
The size of the country;
The size of the predicted coverage area (percentage of country’s area);
The required confidence level of the measurement results.
Typical values may be around 10 test areas with a side length of 10 to 25 km each. Each test area has to be positioned in a way that it contains covered as well as not-covered areas according to the prediction. Ideally, about 50% inside the test areas are predicted to be covered, and 50% would have no coverage. The spatial resolution of the coverage prediction tools is usually lower than the available resolution on digital street maps, so that they appear to be a field of “tiles” or “pixels”. The following figure shows a quadratic test area of 10 km x 10 km length. The blue area is predicted to be covered. The resolution of this area (tile size) is about 100 m x 100 m.

ECC REPORT 256 - Page 25
Figure 5: Example of test area result
Measurement is done most efficiently while driving along (nearly) all roads inside the test area. If the coverage prediction maps contain only field strength or received signal levels as a criterion (which is usually the case), the measurement can be done using passive equipment. Typically measurement results are available at a much faster rate as new positioning data from the GNSS system. In this case, all measurement results attached to the same coordinate have to be combined, so that for later evaluation each coordinate from the GNSS system has one result value of the parameter that was measured. The combination of multiple measurement values for one tile allows the determination of a coverage probability of that tile. For example, if 30 out of 40 measurements made in a tile result in coverage, the location probability that this tile to be covered is 90%.
The result of the measurement may be presented on a map showing the driven route together with an evaluation of the measured parameter according to the agreed threshold (e. g. RSRP ≥ -109 dBm = “covered”, otherwise “not covered”) as in the following example. Green indicates the threshold was reached or exceeded, red indicates no coverage.
tile

ECC REPORT 256 - Page 26
Figure 6: Example of measurement result
A Comparison between measurement results and coverage prediction can be made as follows:
Determine the spatial resolution of the provided coverage prediction map (e. g. 100 m per tile on the map);
Average all measurement results made inside each “tile”; From each averaging result, determine whether the tile was covered or not covered; For each tile where measurement results exists (each tile on the driven route), compare the
measurement result with the prediction according to the following scheme.
Table 7: Coverage evaluation scheme
Measurement result for tile Prediction for tile Evaluation points
“covered” “covered” 0
“covered” “not covered” +1
“not covered” “covered” -1
“not covered” “not covered” 0
If the sum of evaluation points for all tiles is positive, the result is that the coverage inside the test area is even higher than predicted. If it is negative, the coverage is lower than predicted.
The above described exact evaluation of the measurement may not be necessary in many cases because often it can be seen on first sight whether the coverage prediction was reached or not. In Figure 6, for example, the coverage is clearly higher than predicted because there are many more green dots outside the predicted blue area than there are red dots inside.
If the result is that the inside the measured test areas the actual coverage was equal to – or higher than – the prediction, it can be assumed that the parameters used in the planning tool were realistic (or even

ECC REPORT 256 - Page 27
pessimistic). Because the same tool is normally used with the same parameters for the whole network, it can then be assumed that the coverage is the same as inside the test areas throughout the country.
Another method of evaluating the measurement results in a more statistical way is to count the number of measurements inside a tile where the coverage criterion was exceeded against the ones where it was not reached. As a result, the probability that a tile is actually covered can be calculated. The decision whether on a presentation map a tile is shown covered or not can then be based on a certain confidence value (e. g. 90%).The main advantage of this method is that it allows a very accurate determination of a nationwide LTE coverage with relatively low measurement effort. The main disadvantage is that the method requires information (prediction maps) from the network planners.
5.4 CROWDSOURCING TO VERIFY COVERAGE
In general crowdsourcing is the process of obtaining needed information by soliciting contributions from a large group of people.
With respect to an ongoing network expansion in the mobile communication sector operators, regulators and users are interested in the existing network coverage and the quality or performance of the network. Beside qualified measurements of operators or regulators possibilities in gaining data via crowdsourcing due to the continuously growing number of smart phone users arise. The crowdsourcing method may have the potential to produce interesting and valuable data for operators and regulators and the idea of data crowdsourcing in this field is a fairly new an interesting approach. However, beside its potential this approach does also have disadvantages and unsolved issues that need to be taken care of. Like this the question about the benefit for the client is of high importance. If the client is not motivated to collect the data this crowdsourcing method may become dead before arrival.
Network data crowdsourcing via mobile phones is usually organised by operators or even governmental regulators. The operator or regulator provides a smart phone application which can usually be downloaded for free for the user’s device. After installation by the user the application gathers information concerning the network parameters and documents the geographical position of the measurement.
A basic indicator for the received signal strength is the RSSI value. The mobile phone uses this indicator to find an appropriate channel. Thus, in the case that the signal strength falls below a certain threshold the RSSI value is used to switch to a more optimal channel. By referencing the RSSI value to a device dependent scaling factor this value can even be expressed in dBm. On the one hand are mobiles non calibrated devices, thus the given dBm value cannot be compared to qualified measurements carried out by an operator or regulator. On the other hand the measurement via mobiles provides elementary information about the network coverage, but these are only related to the area where the measurements were done.
Many applications on the market also make use of the GNSS data provided by the mobile phone. With this information network coverage heat maps can be created. A heat map is a graphical representation of data where the individual values or group of values contained in a matrix are represented as colours. These maps provide information about the coverage only in the area where the measurements were done and can usually be reviewed within the application itself or at the web pages of operators or regulators.
The general technical setup of an application is quite simple. Usually the following parameters are measured or documented:
Upload and download speed; Latency of connection (“ping”); Time of loading a reference webpage; Signal strength; Date and time of measurement; Location of the client; Type of device and operating system; Type of connection (GSM, UMTS, LTE); Name of service provider.
ECC REPORT 256 - Page 28
The setup of the applications that are available for free on the market is in general the same. Differences are only in details. Some applications provide background information of the measured parameters and explanations why, for example, a DNS service is an important parameter to be measured. With respect to the listed parameters the initiator of a crowdsourcing campaign needs to comply with protection rules of data privacy. Thus it needs to be transparent for the end user which data is collected and stored.
Like listed, various parameters of interest can be measured and transmitted by a mobile phone. However, there are major differences compared to a measurement carried out by the staff of an operator or a regulator. One of the most important aspects in measurements is the aspect of reproducibility. In contrast to measurement devices used by professionals mobile phones are not calibrated and the results given by the phones include an unspecified measurement error. Thus reproducibility cannot be achieved in this context.
Beyond that it is known that results of measurements depend heavily on the outer conditions. When professional measurements are carried out, the conditions are part of the entire scenario, for example a field strength measurement in one meter height or in 10 meter height. In any case the conditions are known and well documented. In the case of mobile phone measurements the conditions are unknown. The person that is carrying out the measurement can either be on the top of a roof, in the basement of the building or anywhere in between. These various positions can lead to major differences in the results. For instance, a client´s position is in the centre or in the basement of a building. Measurements run in this location will both lead to very low upload and download speeds and a huge latency of connection or a connection will not even be established. If the client will be at the same GPS position, but 10 meters above the former position, for instance on a balcony, the measurements can lead to almost perfect results. In addition to the issue of the location of the end user, the individual data rate of end users equipment can turn out to be a problem. If, for instance, the data rate of a UE is reduced to a lower data rate because of exceeding a volume limit, the application has to be able to identify this forced reduction or the data rate measurement will lead to wrong results. This example shows, how important a vast and evenly distributed amount of measurements is to relay on measurements done by a crowdsourcing approach.
If allowed by the application, information like the position (basement, outdoors, etc.) of the client can be documented by the user. However with a list of questions given by the application, the application itself will exhaust the client what finally will lower the acceptance to use the application. In addition, questions asked to the clients may be answered wrong and operators or regulators would have to handle a certain amount of incorrect answers that lead to measurement mistakes. This problem may be tackled by a vast amount of application users, which would ideally represent the average of mobile phone users in order to keep the mistake in a statistical irrelevant dimension. However, a problem would be that if applications will not be preinstalled by a manufacturer and still need to be downloaded by the clients those clients probably will not reflect an ideal average. A majority of the users will be persons with a focus on technology and have a tendency in monitoring technical issues.
Beside the aspect of technical possibilities and measurement accuracy the financial aspect, like costs and benefit needs to be evaluated. With the approach of data crowdsourcing via mobile phones the operators need to develop and maintain the mobile application. Since the clients will not be willingly to pay money for the application, the operator cannot expect a refund from this direction. In addition the data that is collected by the applications need to be processed by technical staff. Finally the clients need to be motivated to download and to use the application. This may be done by additional functionalities or prize competitions. However, it will cost additional money for the operator or regulator, respectively the tax payer, which finally will raise the costs for a single measurement.
The download of the application will usually be for free for the client. But the measurements that will be taken out by the user’s mobile phone will not be for free at a closer look. Typical pay plans of users provide a certain volume of data that can be downloaded. By exceeding this volume the operator will reduce the throughput to a level with a basically non practical use. To retrieve the high throughput additional volume needs to be purchased. Taking this into respect a certain reward needs to be given from the operator to the client. This may be done in the form of additional data volume or information that other users will not be able to get. Will this reward be insufficient the number of users will not become that substantial that a crowdsourcing approach can be run.
Due to the heavy utilisation of mobile phones the idea of crowdsourcing data of existing network coverage and the quality or performance of the networks can be developed to a gainful approach. However, the possibilities of crowdsourcing depend on various aspects and are still restricted at the end.

ECC REPORT 256 - Page 29
Crowdsourcing is an action that is not free of charge, neither for the client and of course nor for the initiator, for instance an operator or a regulator. The major part of the costs needs to be spent by the initiator, for example for development and maintenance of the application and a subsequent evaluation of the gained data. The question “How to make the people install the application?” needs to be answered by the initiator and will, depending on the answer, cost additional money. Clients may get information other persons do not get, or the clients are allured by prize competitions, additional phone minutes or higher possible throughput compared to the clients contract.
The most important question, in the entire context will be, if an operator or a regulator will be able to recruit a sufficient number of clients in order to achieve statistical relevant predictions. Only by a vast amount of users problems like building attenuation or simply different reception characteristics due to different cell phone models can be tackled. In the best case crowdsourcing measurements may provide an average concerning the measured network parameters. However, in many situations crowdsourcing cannot replace on site measurements by professional teams. This is especially in areas of weak network coverage or simply the situation when mobile phone users are complaining because of a bad reception. In other words, if everything works well, crowdsourcing measurements are fine, if any problems occur, measurements need to be carried out by professions teams. Thus crowdsourcing may be used as an indicator for operators which areas within the network are not coved well. These areas consequently need to be inspected on site.

ECC REPORT 256 - Page 30
6 COVERAGE MEASUREMENTS
The following sections describe different types of measurements concerning LTE which may be carried out for the verification of compliance with coverage obligations as well as in the context of “benchmarking” of coverage/quality of the different operators in a country.
6.1 GENERAL MEASUREMENT SETUP
In order to determine the coverage of a larger area with LTE, measurements at many locations are required. It is therefore practical to perform the measurements using measurement vehicles while they are moving around (mobile measurement). If mobile LTE coverage is specified, the antennas used for measurement should be between 1.5 and 3 m above ground. 1.5 m is the typical height when the service is used in cars or with handhelds on street level. 3 m is the typical height when using the service indoors (ground or 1st floor).
According to the 3GPP LTE specification, the use of 2x2 MIMO is mandatory both on the transmitter and receiver side. It is therefore necessary to use two antennas for the measurement, having a polarisation difference of 90°. A typical example is a cross-polarized antenna with +/-45° polarised elements. The attenuation of the RF cables between measurement antennas and receiver has to be eliminated in the final result.
The maximum speed during the measurements is determined by
The measurement system (Scanner or UE); The environment (motorway or inside habitations); The rate at which results for the parameter to be measured can be obtained and the required spatial
resolution of the result. For example, if the parameter to be measured is RSRP, the measurement UE delivers one value per second and one result value is required every 10 m, the maximum driving speed is 36 km/h.
6.2 MEASUREMENT OF CQI
Because the CQI value can only be calculated by the UE during an active connection with the network, the use of dedicated UEs is mandatory if this parameter is to be measured as a coverage criterion. It is usually possible to obtain a new CQI value every 2 ms. Together with a maximum vehicle speed of 50 km/h during measurement, this allows a spatial resolution better than 1.5 m.
For the CQI measurement it is not necessary to download user data. However, it must be ensured that the connection is not truncated by the UE or base station. This may be gained by repeatedly sending ICMP pings to known and stable server in the internet. If no response is received to these pings it can be assumed that the connection is lost. In that case the system must automatically try to re-establish the connection after a certain time (e. g. 10 seconds). It should be considered that during this “delay” time until the connection is re-established, no CQI data is available. This does not mean, however, that there is no network coverage on the distance driven by the measurement vehicle during that time. It is therefore necessary to record the connection state together with the CQI value for later evaluation.
6.3 RSRP MEASUREMENT
Because of the structure of the LTE signal, the RSRP value can only be measured directly with dedicated LTE UE or measurement equipment that is able to decode the LTE downlink signal.
In order to deliver an RSRP value, the measurement receiver must be able to decode the LTE signal, but it can be measured in passive mode which means that the measurement equipment does not need to establish an active connection. It is possible that no RSRP value is available from the measurement equipment at certain locations. However, this situation only occurs at received signal levels below the minimum level necessary to use the network and can therefore be interpreted as “no coverage”.

ECC REPORT 256 - Page 31
6.4 THROUGHPUT MEASUREMENT
The throughput measurement (measurement of the data rate) can either be done directly or indirectly.
The throughput measurements described here may also be used to assess the performance of the public mobile network independent of the technology used (GSM, UMTS). However, the current document only covers measurements on LTE networks. An end user who has a UE able to switch between technologies may experience better performance of the network than the results gained with the methods described in this report. In the direct measurements professional equipment or a commercial phone is used to determine the download and upload speed of a certain file in Mbit/s.
When performing the indirect throughput measurement parameters like CQI or RSRP are determined. The conclusion concerning the throughput can then be drawn via statistical approaches.
6.4.1 Direct throughput measurement
Considering the different possible “definitions” of throughput it is important to agree on the kind of throughput that is relevant as a coverage criterion. In many cases the average net downlink throughput per UE is meant when coverage obligations are defined.
However, the following practical reasons usually prevent direct measurement of this throughput during normal network operation:
The number of concurrent UEs in the cell during measurement is unknown; Measuring throughput over a period of 24 hours at each receiving location lasts far too long. It may be possible to determine the average throughput through measurements during certain times, followed by calculation under the following assumptions:
The average use of the network occurs during certain times of the day (e.g. between 09:00 and 15:00 on working days);
There is an assumed average number of active UE in each network cell during these times (e. g. 10).
If the above conditions can be agreed upon, measurement could be performed using standard UE by downloading files or streams from a dedicated server. Considering the data transfer shown in Figure 4 and the network structure shown in section 2.2, the following issues have to be observed when making direct throughput measurements:
When using file downloads for measurement, the size of the files has to be sufficiently large to reduce the influence of the network latency time;
When using streaming data for measurement, the source throughput of the stream (e. g. video stream) has to be larger than the expected throughput used as coverage obligation;
When performing a mobile measurement, the rate at which the measurement result is available, in combination with the vehicle speed, must be high enough to provide the desired spatial resolution;
On the way from UE to the target server, all connections must provide a higher throughput than the LTE radio link.
The simplest way to measure the throughput may be to measure the time it takes to download a file with a certain size. In this case, however, the third issue may have strong influence on the final result, because it is per definition valid for the whole distance the measurement vehicle has driven during the download. If, for example, the test file size is 10 MByte, the average throughput is 2 Mbit/s, we will only get one result every 40 seconds. If the measurement is done mobile at a speed of 50 km/h, this would result in a spatial resolution of more than 0.5 km. To achieve reasonable resolution, the file size and/or maximum vehicle speed have to be reduced considerably, or UE has to be used that allows measurement of the download speed during file transfer.
An issue with a fixed file size is that the setup time to start the download may be dependent on the operator. To achieve a common benchmark of the download speed and to equalise the spatial resolution of the result, it is possible to download a very large file (e.g. 1 GByte) and divide the download into data sessions of fixed time length (e.g. 10 Sec.).

ECC REPORT 256 - Page 32
The following example describes this approach as used in the Former Yugoslav Republic of Macedonia.
The measurement is done by using commercial UE´s controlled via a software running on a dedicated laptop;
Download file size is 1 GByte and is placed on an IP server for measuring the download speed; The same file is copied to the UE for measuring the upload speed; The servers is connected to support the maximum LTE technology throughput; File transfer is done by using the FTP/HTTP protocol; Before starting the actual measurement of each data session a maximum setup time of 30 seconds is
granted to allow the UE to connect to the server. This long time allows recovering from a network connection loss;
Session length is 10 seconds; Waiting time between consecutive data session is 10 seconds; Like in other approaches the number of sessions depend on size of the measurement area, in order to
gain a common spatial resolution in every measured area; All operators are measured simultaneously; Software for post processing is used to average the measured samples. Maximum and minimum throughput per UE may be measured in the same way as described above. However, the requirement that the LTE radio link is slower than the remaining way to the target server may be critical especially when measuring maximum throughput that are close to the total capacity of the LTE base station. Furthermore, the direct measurement of maximum throughput is only possible during times where (nearly) no other UEs are active in the cell, or with SIMs that are granted priority access over other users by the network operator. Minimum throughput may be measured during busy hours or, alternatively, calculated from measurement of average throughput and calculation using agreed average and maximum numbers of concurrent UEs in a cell.
6.4.2 Indirect throughput measurement
Due to the described practical problems involved in direct throughput measurements it may be feasible to determine the physical maximum throughput of a LTE base station by measuring other, dependant parameters such as CQI or RSRP, and then calculate the available throughput per UE with agreed numbers of maximum, average or minimum UEs in one cell. Since the typical use of internet services requires more data to be transmitted to the UE than the uplink, the indirect throughput measurement focuses on the downlink rate of an LTE system.
In Sweden the Post and Telecom authority (PTS) together with the operators have defined an indirect throughput measurement concept aimed to determine the so-called functional coverage. This concept requires coverage prediction data from the operator and is used for data services only. In the area were Functional coverage is given the end users can expect a certain quality of service in terms of throughput (bitrate).
The method assumes that within the functional coverage area the users can expect a certain throughput that is related to the peak rate (theoretical maximum) of the serving cell. Within the area of functional coverage the relation between the throughput per user and the peak rate of the cell can be expressed by a fixed divisor, representing the number of concurrent users assumed to be present in the same cell. This number needs to be determined by the administration. In Sweden it is assumed that the functional coverage in terms of throughput is 1/5th of the downlink peak rate of the LTE cell. Thus the peak rate is divided by 5 to get the functional coverage. In order to get handy values it is thereafter rounded to 1, 10 or 30 Mbit/s.
Table 8 shows overview of an exemplary functional coverage setup. The system configuration in terms of access technology, the 3GPP release and the system bandwidth corresponds to a theoretical peak rate (see column 1 to 3 in Table 8). The peak rate is divided by five and rounded to 5, 10, 15, 20, 25 or 30 Mbit/s (note that in this example the resolution is increased in comparison to the approach of the Swedish administration). Thus an LTE signal, 15 MHz FDD, has a peak rate of 112.5 MHz which corresponds to 20 Mbit/s “functional coverage” (rounded) according to Table 8. This means that in areas that are covered by a system using LTE with 15 MHz bandwidth the users can “expect” a downlink bitrate of 20 Mbit/s. The round-off value (resolution of the functional coverage) and the divisor of the peak rate has to be set by an administration individually.

ECC REPORT 256 - Page 33
Table 8: System configuration and corresponding functional coverage and throughput (example)
Access Technology
System Configuration
Peak rate, downlink
Peak rate divided by 5
Corresponding functional coverage and functional throughput
Mbit/s
LTE
5 MHz FDD 37.5 Mbit/s 7.5 5
10 MHz FDD 75 Mbit/s 15 15
15 MHz FDD 112.5 Mbit/s 22.5 20
20 MHz TDD 112.5 Mbit/s 22.5 20
20 MHz FDD 150 Mbit/s 30 30 The size of the functional coverage area is related to the RSRP value from the serving system (i.e. the signal strength of the LTE reference signal) that is necessary to operate at its maximum theoretical speed. The minimum RSRP value shall be determined by operators assuming a certain percentage of location probability (in Sweden 80 % location probability is used). Each operator reports which RSRP threshold corresponds to a certain functional coverage, based on the frequency band and system configuration (Table 9). For example, operator X has an RSRP threshold of -111 dBm when using a 5 MHz LTE block in the 800 MHz band. Using this example, all measurement locations where we measure an RSRP value that is above -111 dBm can be considered to be covered with a “functional bitrate” of 5 Mbit/s.
Table 9: Signal strength thresholds of operator X (example)
Technology Configuration Peak rate per cell
RSRP threshold (dBm) using 80 % location probability
Frequency band
800 1800 2600
LTE
5 MHz FDD 37.5 Mbit/s -111 -110 -109
10 MHz FDD 75 Mbit/s -111 -110 -109
15 MHz FDD 112.5 Mbit/s -111 -110 -109
20 MHz TDD 112.5 Mbit/s -111 -110 -109
20 MHz FDD 150 Mbit/s -111 -110 -109

ECC REPORT 256 - Page 34
The method described above can be used as a simplified and practical way of how to measure the LTE throughput. Suggested steps to execute measurements and subsequent evaluation of the data are described below: Table 8 and Table 9 include exemplary values that are used by the Swedish administration. However,
since different administrations may use other key values the key values of these tables (divisor in Table 8 and signal strength threshold in Table 9) need to be evaluated by each administration;
The LTE signal strength (i.e. RSRP level) has to be measured. Each measurement value has to be related to a certain GPS position. The measurement in general should be performed using a measurement vehicle equipped with an LTE scanner tuned to the target frequency band and connected to a suitable measurement antenna at the roof top (see section 5.1.2 Active measurements with commercial user equipment);
After the measurement the resulting RSRP values have to be analysed using Table 8 and Table 9;
The next step is to convert the coverage in terms of RSRP and system configuration into functional coverage. In areas were an RSRP value above the threshold in Table 9 has been measured are considered to be covered, whereas areas were the RSRP value was below the threshold are considered not covered;
The applied method of averaging the measurement results over a certain area (“tile”) is in the responsibility of the administration performing the measurement. For example, the RSRP values could be averaged over a number of measurement tiles of a certain size (see chapter 5.3 Verifying coverage prediction data from operator);
The result of the analyses could be visualised as a coverage map where areas with functional coverage are shown. In these areas the users can expect a bitrate according to the functional coverage previously defined.
Advantages and disadvantages of the functional coverage approach On the one hand this approach is a practical and easy way of displaying a certain throughput than an end user can really expect, because functional coverage is a load independent approach. In addition, since the measurement is only considering the LTE signal strength, a simple LTE scanner measuring RSRP can be used.
One the other hand this concept highly depends on the defined relation between the theoretical peak rate of a cell and the corresponding functional coverage. Though the evaluation of this value is in the responsibility of the administration, different operators could have different opinions of the relation between these two parameters. The “real” end user throughput is not measured directly. Furthermore, the method only results in an area where a minimum defined throughput can be expected. This means that measurement points which are closer to an LTE site will not show to have a higher bitrate than measurement points further away from the LTE site.

ECC REPORT 256 - Page 35
7 EXAMPLES OF COMMON MEASUREMENTS
7.1 RECEIVED SIGNAL STRENGTH MEASUREMENT
7.1.1 Introduction
The Belgium regulator (BIPT) carries out measurements in the field in order to verify the validity of coverage prediction files provided by the operators. The data is validated in a statistical form according to a method determined in cooperation between BIPT and the mobile operators. For 4G systems like LTE, the predefined coverage threshold is an RSRP value of -115 dBm.
7.1.2 Format of the files
The territory is divided into squares with a 200 m side length, called pixels. The computer files provide data regarding the coverage of each pixel. A pixel is considered to be 'covered' when the pixel's coverage probability exceeds 95%, namely when the field is bigger than or equal to the threshold value with a probability of at least 95%.
The computer file gives the information regarding the coverage of 2,187,500 pixels, defined as follows:
Use of the Lambert projection for the geographical coordinates;
Origin: X=0 km ; Y=250 km;
1,750 columns of pixels;
1,250 rows of pixels;
The left upper corner (northwest) of the pixel of column i and row j has as coordinates (in metres): 𝑋𝑋 = 200 × (𝑖𝑖 − 1) and 𝑌𝑌 = 250.000 − 200 × (𝑗𝑗 − 1).
The computer file is an ASCII file with 1,250 lines corresponding with the 1,250 rows of pixels. Line j of the ASCII file repeats the information regarding the coverage of the pixels of row j.
Each line of the file contains 1,750 ASCIII characters that correspond with the 1,750 columns.
Each character is either "1" if the pixel is considered to be covered or "0" in the opposite case.
7.1.3 Measurement route
BIPT carried out measurements in the field for 40 test routes. The test routes are picked at random across the entire territory.
The choice of each route is made in two steps:
a first point is chosen at random on the territory of one of the 10 provinces or of the Brussels Capital Region1;
a second point, situated on the Belgian territory, at a 20 to 30 km distance from the first point, is chosen at random.
For the measurements BIPT covers the route between the two points of a route suggested by a navigation program, with the option of "shortest route" and avoiding all highways and motorways.
1 Route for the province of Flemish Brabant and for the Brussels Capital Region, and 2 routes for the other 9 provinces.

ECC REPORT 256 - Page 36
7.1.4 Measurement equipment
The received signal will was measured using professional measuring equipment of the RF scanner type2.
Part or all of the measurements could be carried out aboard a vehicle moving at a regular speed compared to the type of road taken. For each measuring point the corresponding GPS coordinates was harvested.
It is asked that the measurements carried out in the vehicle take into account the situation outside of the vehicle by means of an external antenna.
7.1.5 Drive Test
The scanner settings aim at performing an optimum number of measurements per second. These measurements are linked to GPS measurements. At a speed of 70 km/h for instance a distance of 200 meters is travelled in about 10 seconds, and in case of 5 measurements per second for instance this results in about 50 measurements, each 4 meters apart.
The driver maintains an adapted speed (up to 70 km/h), thus creating an optimum measuring pattern.
The requirement to have a certain number of measurements per pixel therefore translates into a minimum distance to be travelled within the pixel. For instance, in the case of 30 measurements minimum, in the example above a minimum distance of 120 meters has to be travelled within the pixel of 200 m x 200 m.
At the end of the test, the data are transmitted for all technologies (3G and 4G).
7.1.6 Aggregation (binning)
The scanner measures each band several times a second. Per operator the six strongest signals for each technology are updated in a measuring file. As soon as the route is finished the data are treated and an export file is generated. All measuring data are exported. BIPT develops its own algorithm bundling all measured values. The bundling algorithm is communicated to the operators. It will aggregate the measurements taken at the same point or very close to one another (e.g. when stopping at a red light) and will average all the other points, which will result in the highest average measured value at a given distance.
Only the measurements made in the pixels considered to be covered are taken into account for the analysis of the results. The reliability of each of the routes studied, corresponding with the percentage of successful measurements in the area declared to be covered by the operator, is calculated. Also the statistical accuracy is calculated and is an integral part of the results.
7.1.7 Criteria for measuring the coverage of a test point
First BIPT will apply for the 3G and 4G technologies at each test point a criterion to decide whether the coverage is sufficient with a view to validating the file provided by the operators.
The signal level received by the RF scanner (after aggregation or binning) has to equal at least the threshold values stipulated in part 1, i.e. -105 dBm in 3G en -115 dBm in 4G.
Based on the results of the checks carried out BIPT will later on, in consultation with the operators involved, decide about the type of information regarding mobile network coverage that will actually be published on its website.
2The TSME has been calibrated and is not used outside its valid calibration period. The antenna has an average gain of 3 dBi. Tests in the field (BMLPVMB/LTE RF Measurements, antenna with PFP240 cable) have clearly shown that the antenna-cable combination achieves this gain for an elevation of about 30 degrees, and that the gain towards the horizon drops to - 2 dBi. To counter this loss of gain and to compensate for the slightly higher losses of the RG-58/U cable a 3dB loss is allowed for when treating the results. The difference in gain depending on the frequency remains under 1 dB.

ECC REPORT 256 - Page 37
7.1.8 Analysis per pixel
For a given pixel we have NTOT test points at our disposal where a measurement has been made. The pixel's coverage can be estimated by means of the proportion of the number of test points for which a coverage has been measured to the total number of test points:
TOT
MESMES N
NCOV =
where
COVMES is the coverage of the pixel based on the measurements NMES is the number of test points for which a coverage has been measured NTOT is the total number of test points within the pixel
NMES follows a normal law of which:
the average amounts to 𝑁𝑁𝑇𝑇𝑇𝑇𝑇𝑇 × 𝐶𝐶𝑂𝑂𝑂𝑂 ; and the difference is 𝑁𝑁𝑇𝑇𝑇𝑇𝑇𝑇 × 𝐶𝐶𝑂𝑂𝑂𝑂 × (1 − 𝐶𝐶𝑂𝑂𝑂𝑂).
The margin of error for a 90% confidence interval is therefore:
TOTNCOVCOVM )1(65,1%90
−×=
where
M90% is the margin of error for a 90% confidence interval COV is the actual coverage of the pixel
If NTOT is higher than 30, COV can be replaced by COVMES in the formula that calculates the margin of error.
BIPT will not take account of any pixels for which NTOT is lower than 30.
when COVMES coverage is calculated based on NTOT measurements, there is:
a 5% chance that the actual coverage of the pixel is lower than COVMES - M90% a 90% chance that the actual coverage of the pixel is between COVMES - M90% and COVMES + M90% a 5% chance that the actual coverage of the pixel is higher than COVMES + M90% A pixel considered by the operator to be covered, will be rejected by BIPT if COVMES + M90% is less than 0.95. A pixel will be really rejected only if it is rejected in both directions of one and the same route.
The diagram below shows the minimum number of positive test points (NMES) according to the total number of test points (NTOT), needed for BIPT to validate a pixel the operator deems covered. If NTOT is lower than 30 the pixel is not taken into consideration during the analysis.

ECC REPORT 256 - Page 38
Figure 7: Minimum and total number of test points
7.1.9 Global analysis
For the entirety of the pixels which are considered to be covered by the operator, a global coverage criterion and a global margin of error are calculated:
∑∑=
TOT
MESGLOBAL N
NCOV
∑−
×=TOT
GLOBALGLOBALGLOBAL N
COVCOVM )1(65,1
BIPT will not accept the data provided by the operator when COVGLOBAL + MGLOBAL is less than 0.95.
7.1.10 Acceptance criteria
The data provided by the operator will be accepted if two criteria are met:
the global analysis criterion; the percentage of pixels rejected by the per pixel analysis is lower than the least binding value between
5% and double the average of the other operators.
7.1.11 Data presentation
The results of the measurement are published on the interactive internet site (http://www.bipt.be/en/consumers/telephone/quality-of-service/coverage-maps-mobile-networks) where the user can view the results per operator and/or per technology (2G, 3G, 4G) down to street level with a resolution of 200x200m.
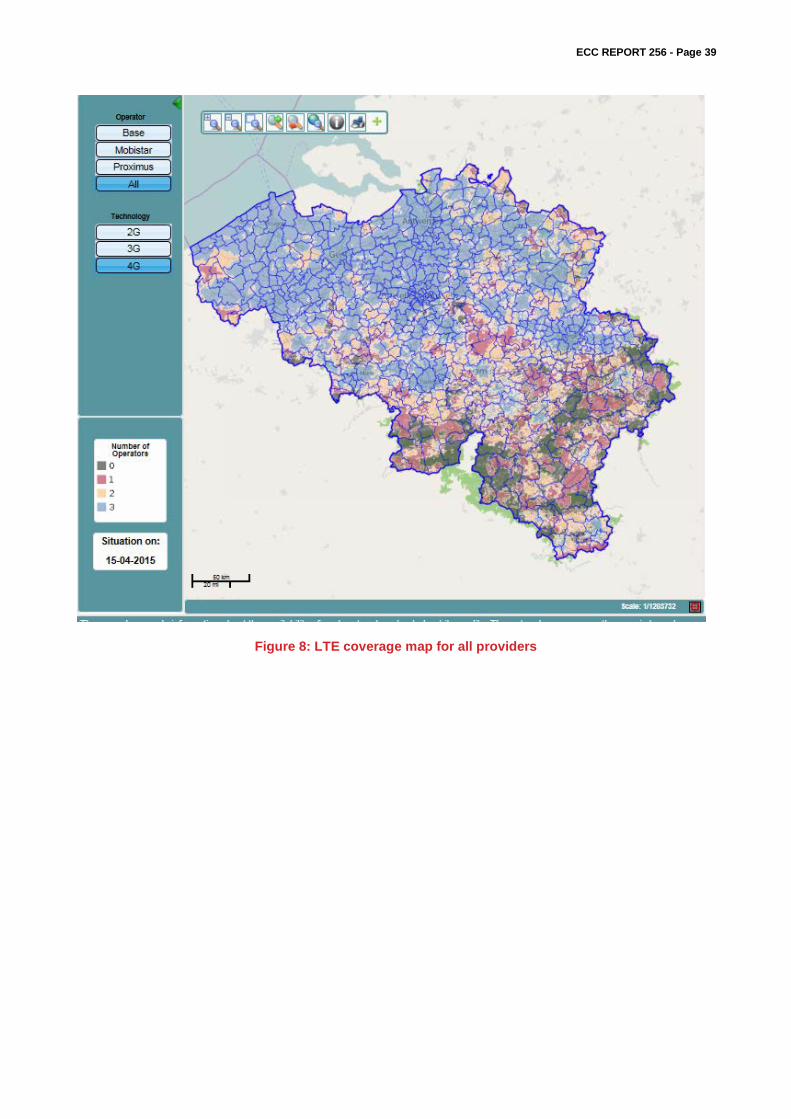
ECC REPORT 256 - Page 39
Figure 8: LTE coverage map for all providers

ECC REPORT 256 - Page 40
Figure 9: LTE coverage for one provider in a certain area
7.1.12 Approval phase
If during the analysis of the results regarding coverage reliability incoherencies between the map provided and the measurements would surface, the operator will be informed in due time in order to verify whether the measurements might have been disrupted by an incident or another event on the network.

ECC REPORT 256 - Page 41
8 CONCLUSION
This report shows that the coverage of an LTE network can be determined by various methods The measurements may be carried out for the verification of compliance with coverage obligations as well as in the context of “benchmarking” of coverage/quality of the different operators in a country.
An important statement is that within every presented approach assumptions have to be made, before a conclusion concerning the network coverage can be given. These assumptions for instance are the minimum signal level in dBm present at the UE receiver input to decode the LTE signal or the average number of UE in each network cell during a measurement. These assumptions have either to be based on field experience or calculations of engineers of administrations or operators.
Consequently it needs to be accepted that in general all assumptions are only approximations. Of course, the accuracy of every approximation can be enhanced; however, this is always directly linked to an increased effort. It is up to every administration to find a well-balanced way between accuracy and effort.
A total different approach of gaining information about coverage in specific points is the crowdsourcing method. As a new approach this method comes with several advantages but also various unsolved issues and challenges. One of the largest issues is probably the aspect that reproducibility of measurements cannot be achieved when using the crowdsourcing method. Furthermore it is mandatory for this method to acquire a vast amount of users to use a crowdsourcing application, because only by sufficient users the averaged measurement results are of value for the initiator of this method. If these requirements are given, crowdsourcing may be used as an indicator for administrations which areas within the network are not coved well. These areas consequently need to be inspected on site.

ECC REPORT 256 - Page 42
ANNEX 1: LIST OF REFERENCE
[1] ECC Report 231 ‘Mobile coverage obligations’ [2] ETSI EN 301 908 ‘IMT cellular networks’ series [3] ETSI TS 136 104 ‘LTE; Evolved Universal Terrestrial Radio Access (E-UTRA); Base Station (BS) radio
transmission and reception’ [4] ETSI TS 136 211 ‘LTE; Evolved Universal Terrestrial Radio Access (E-UTRA); Physical channels and
modulation’ [5] ETSI TS 136 133 ‘LTE; Evolved Universal Terrestrial Radio Access (E-UTRA); Requirements for
support of radio resource management’ [6] ETSI TS 136 213 ‘LTE; Evolved Universal Terrestrial Radio Access (E-UTRA); Physical layer
procedures’


