47
NEW ENGLAND COMMON ASSESSMENT PROGRAM Released Items Support Materials 2017 Grade 11 Science

NEW ENGLAND COMMON ASSESSMENT PROGRAM
Released ItemsSupport Materials
2017
Grade 11Science

1NECAP 2017 Grade 11 Science Released Items_V2
NECAP 2017 RELEASED ITEMSGRADE 11 SCIENCE
Grade 11 Science Released Item Information
Item Number Big Idea1 Assessment Target
Depth of Knowledge
CodeItem Type 2 Answer Key
Total Possible Points
1 MAS PS 1-2 2 MC C 1
2 POC PS 2-5 2 MC A 1
3 SAE PS 3-10 2 MC C 1
4 NOS ESS 1-2 3 CR4 4
5 POC ESS 1-4 2 MC A 1
6 NOS ESS 3-6 2 MC D 1
7 SAE ESS 3-7 2 MC C 1
8 FAF LS 1-2 2 MC C 1
9 SAE LS 2-4 2 MC A 1
10 POC LS 3-8 2 MC C 1
Grade 11 Science Released Inquiry Task Information
Item Number Big Idea1 Inquiry ConstructDepth of
Knowledge Code
Item Type 2Total
Possible Points
1 INQ 1-2 2 SA 2
2 INQ 2-5 2 SA 2
3 INQ 4-11 2 SA 2
4 INQ 4-12 3 CR3 3
5 INQ 3-8 2 CR3 3
6 INQ 3-10 2 SA 2
7 INQ 2-4 2 SA 2
8 INQ 1-2 3 SA 2
1Big Idea: NOS = Nature of Science, SAE = Systems and Energy, MAS = Models and Scale, POC = Patterns of Change, FAF = Form and Function, INQ = Scientifi c Inquiry
2Item Type: MC = Multiple Choice, CR = Constructed Response, SA = Short Answer

2NECAP 2017 Grade 11 Science Released Items_V2
NECAP 2017 RELEASED ITEMSGRADE 11 SCIENCE
PS1 (9-11) MAS-2 Scientifi c thought about atoms has changed over time. Using information (narratives or models of atoms) provided, cite evidence that has changed our understanding of the atom and the development of atomic theory.
146877 C Choice Common
q J.J. Thomson’s “plum pudding” model, shown below, contributed to the current understanding of the atomic model.
Thomson’s“Plum Pudding” Model, 1897
Negativelycharged“plums”
Positivelycharged
“pudding”
The “plums” are negatively charged particles embedded in a positively charged region Thomson called “pudding.”
What does the “pudding” of Thomson’s model represent in the most current atomic model?
A. a solid indivisible sphere
B. the electron cloud
C. the nucleus
D. a neutron

3NECAP 2017 Grade 11 Science Released Items_V2
NECAP 2017 RELEASED ITEMSGRADE 11 SCIENCE
PS2 (9-11) POC-5 Demonstrate how transformations of energy produce some energy in the form of heat and therefore the effi ciency of the system is reduced (chemical, biological, and physical systems).
169677 A Choice Common
w The table below shows specifi cations of four types of lightbulbs.
Bulbs
Power(watts)
Type ofLightbulb
Compactfluorescent
Incandescent
Halogen
LED
13
60
50
16
900
880
790
850
Light Output(lumens)
Based on the table, which type of lightbulb converts less electrical energy into heat?
A. compact fl uorescent
B. incandescent
C. halogen
D. LED

4NECAP 2017 Grade 11 Science Released Items_V2
NECAP 2017 RELEASED ITEMSGRADE 11 SCIENCE
PS3 (9-11) SAE-10 Explain the effects on wavelength and frequency as electromagnetic waves interact with matter (e.g., light diffractions, blue sky).
265477 C Choice Common
e The Horsehead Nebula is in a distant galaxy. It is composed of dust and ice particles. A telescope on Earth gathers pink light coming from the top of the nebula.
Which statement provides the best explanation for the color of light at the top of the Horsehead Nebula?
A. Dust particles absorb infrared light from stars and emit red light.
B. Dust particles refract starlight and transmit blue light to Earth.
C. Dust particles scatter blue light and transmit mostly red light to Earth.
D. Dust particles move toward Earth and cause the light to undergo redshift.

5NECAP 2017 Grade 11 Science Released Items_V2
NECAP 2017 RELEASED ITEMSGRADE 11 SCIENCE
ESS1 (9-11) NOS-2 Trace the development of the theory of plate tectonics or provide supporting geologic/geographic evidence that supports the validity of the theory of plate tectonics.
506932 Extended Response Common
r Some continental coastlines appear to fi t together like jigsaw puzzle pieces. This observation is one piece of evidence Alfred Wegener used to support his Theory of Continental Drift. The current Theory of Plate Tectonics builds on Wegener’s idea.
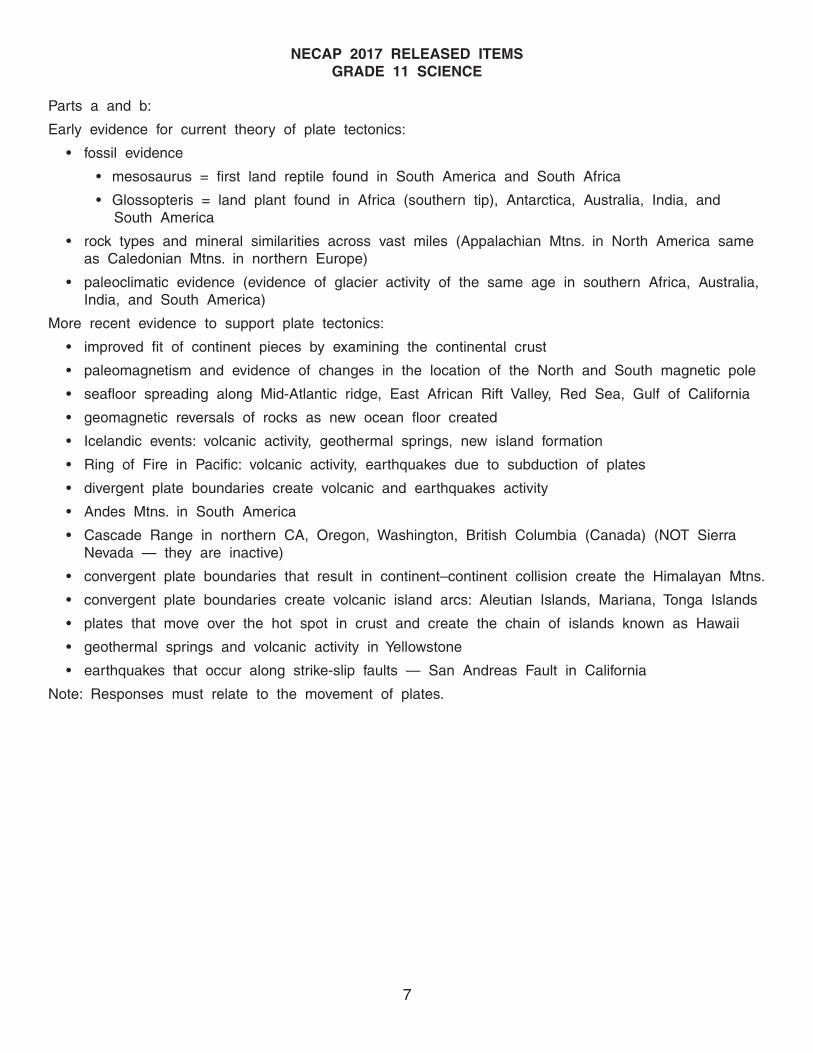
a. Describe two additional pieces of evidence that support the Theory of Plate Tectonics.
b. Explain how each piece of evidence you described in part (a) relates to the movement of plates.

6NECAP 2017 Grade 11 Science Released Items_V2
NECAP 2017 RELEASED ITEMSGRADE 11 SCIENCE
Scoring Guide
Score Description
4
The response demonstrates a thorough understanding of geologic/geographic evidence that supports the validity of the Theory of Plate Tectonics. The response describes two additional pieces of evidence that support the Theory of Plate Tectonics and relates each piece of evidence to the movement of plates.
3The response demonstrates a general understanding of geologic/geographic evidence that supports the validity of the Theory of Plate Tectonics.
2The response demonstrates a limited understanding of geologic/geographic evidence that supports the validity of the Theory of Plate Tectonics.
1The response demonstrates a minimal understanding of geologic/geographic evidence that supports the validity of the Theory of Plate Tectonics.
0 The response is incorrect or irrelevant to the skill or concept being measured.
Blank No response
7NECAP 2017 Grade 11 Science Released Items_V2
NECAP 2017 RELEASED ITEMSGRADE 11 SCIENCE
Parts a and b:
Early evidence for current theory of plate tectonics:
• fossil evidence
• mesosaurus = fi rst land reptile found in South America and South Africa
• Glossopteris = land plant found in Africa (southern tip), Antarctica, Australia, India, and South America
• rock types and mineral similarities across vast miles (Appalachian Mtns. in North America same as Caledonian Mtns. in northern Europe)
• paleoclimatic evidence (evidence of glacier activity of the same age in southern Africa, Australia, India, and South America)
More recent evidence to support plate tectonics:
• improved fi t of continent pieces by examining the continental crust
• paleomagnetism and evidence of changes in the location of the North and South magnetic pole
• seafl oor spreading along Mid-Atlantic ridge, East African Rift Valley, Red Sea, Gulf of California
• geomagnetic reversals of rocks as new ocean fl oor created
• Icelandic events: volcanic activity, geothermal springs, new island formation
• Ring of Fire in Pacifi c: volcanic activity, earthquakes due to subduction of plates
• divergent plate boundaries create volcanic and earthquakes activity
• Andes Mtns. in South America
• Cascade Range in northern CA, Oregon, Washington, British Columbia (Canada) (NOT Sierra Nevada — they are inactive)
• convergent plate boundaries that result in continent–continent collision create the Himalayan Mtns.
• convergent plate boundaries create volcanic island arcs: Aleutian Islands, Mariana, Tonga Islands
• plates that move over the hot spot in crust and create the chain of islands known as Hawaii
• geothermal springs and volcanic activity in Yellowstone
• earthquakes that occur along strike-slip faults — San Andreas Fault in California
Note: Responses must relate to the movement of plates.

8NECAP 2017 Grade 11 Science Released Items_V2
NECAP 2017 RELEASED ITEMSGRADE 11 SCIENCE
SCORE POINT 4
r
The response demonstrates a thorough understanding of geologic/geographic evidence that supports the validity of the Theory of Plate Tectonics. The response describes the formation of mountain ranges and earthquakes as two additional pieces of evidence that support the Theory of Plate Tectonics. The response explains that converging plates move the ground upward to form mountains, and transform plate boundaries sliding against each other forms earthquakes.

9NECAP 2017 Grade 11 Science Released Items_V2
NECAP 2017 RELEASED ITEMSGRADE 11 SCIENCE
SCORE POINT 3
r
The response demonstrates a general understanding of geologic/geographic evidence that supports the validity of the Theory of Plate Tectonics. The response describes that similar rocks found on different continents and the formation of mountains are two additional pieces of evidence that support the Theory of Plate Tectonics. The response gives general explanations for each piece of evidence, but leaves out relevant details, such as the types of plate boundaries that have been responsible for these phenomena.

10NECAP 2017 Grade 11 Science Released Items_V2
NECAP 2017 RELEASED ITEMSGRADE 11 SCIENCE
SCORE POINT 2
r
The response demonstrates a limited understanding of geologic/geographic evidence that supports the validity of the Theory of Plate Tectonics. The response describes that mountains and volcanoes are two additional pieces of evidence that support the Theory of Plate Tectonics. The response gives basic explanations of how these relate to plate movement in both parts with very little detail.
11NECAP 2017 Grade 11 Science Released Items_V2
NECAP 2017 RELEASED ITEMSGRADE 11 SCIENCE
SCORE POINT 1
r
The response demonstrates a minimal understanding of geologic/geographic evidence that supports the validity of the Theory of Plate Tectonics. The response describes that similar geological formations can be found on different coastlines, but this is only one valid piece of evidence that is not explained well.

12NECAP 2017 Grade 11 Science Released Items_V2
NECAP 2017 RELEASED ITEMSGRADE 11 SCIENCE
r
SCORE POINT 0
The response is incorrect or irrelevant to the skill or concept being measured. The response mentions plate movement, but this concept is directly out of the prompt and nothing else in the response demonstrates understanding of evidence that supports the Theory of Plate Tectonics.

13NECAP 2017 Grade 11 Science Released Items_V2
NECAP 2017 RELEASED ITEMSGRADE 11 SCIENCE
ESS1 (9-11) POC-4 Relate how geologic time is determined using various dating methods (e.g., radioactive decay, rock sequences, fossil records).
219204 A Choice Common
t The diagram below shows 10 layers of rock, Intrusions X and Y, and a magma chamber.
Intrusion Y
Intrusion X
12345
67
8
910
Magmachamber
Rock Profile Layers
What statement describes the relative ages of the rock layers?
A. Intrusion X is younger than Layer 6.
B. Intrusion Y is older than Layer 8.
C. Layer 10 is the youngest layer.
D. Layer 5 is the oldest layer.

14NECAP 2017 Grade 11 Science Released Items_V2
NECAP 2017 RELEASED ITEMSGRADE 11 SCIENCE
ESS3 (9-11) NOS-6 Provide scientifi c evidence that supports or refutes the “Big Bang” theory of how the universe was formed.
262423 D Choice Common
y The graph below shows the relative distances of six galaxy clusters based on their recession velocity as observed from Earth.
60
40
20
0
Rec
essi
on
Vel
oci
ty (
103
km/s
)
Distance and Velocity of GalaxyClusters as Observed from Earth
1 2
Corona Borealis
Hercules
Cluster A
Pisces
Ursa Major II
Hydra
3 4
Approximate Distance (109 lt-yr)
What evidence provided by the data supports the Big Bang Theory?
A. The data suggest that galaxies formed at different times after the Big Bang.
B. The data indicate that the early universe had far more galaxies than it does now.
C. The data show that galaxies existed before the time of the Big Bang.
D. The data confi rm that the universe is expanding.

15NECAP 2017 Grade 11 Science Released Items_V2
NECAP 2017 RELEASED ITEMSGRADE 11 SCIENCE
ESS3 (9-11) SAE-7 Based on the nature of electromagnetic waves, explain the movement and location of objects in the universe or their composition (e.g., red shift, blue shift, line spectra).
89269 C Choice Common
u The diagrams below show the emission spectra of a star and several elements commonly found in stars.
W
X
Y
Z
Blue endof spectrum
Red endof spectrum
Emission Spectrum of a Star
Emission Spectra of Elements
Which elements are present in the star?
A. elements W, X, and Y
B. elements X, Y, and Z
C. elements W, Y, and Z
D. elements W, X, and Z

16NECAP 2017 Grade 11 Science Released Items_V2
NECAP 2017 RELEASED ITEMSGRADE 11 SCIENCE
LS1 (9-11) FAF-2 Explain or justify with evidence how the alteration of the DNA sequence may produce new gene combinations that make little difference, enhance capabilities, or can be harmful to the organism (e.g., selective breeding, genetic engineering, mutations).
59038 C Choice Common
i Fragile X syndrome is a genetic disorder in which a specifi c protein called FMR1 is not produced.
What is the most likely cause of fragile X syndrome?
A. carbohydrate shape changes
B. cell membrane changes
C. chromosome structure changes
D. lipid structure changes

17NECAP 2017 Grade 11 Science Released Items_V2
NECAP 2017 RELEASED ITEMSGRADE 11 SCIENCE
LS2 (9-11) SAE-4 Trace the cycling of matter (e.g., carbon cycle) and the fl ow of energy in a living system from its source through its transformation in cellular, biochemical processes (e.g., photosynthesis, cellular respiration).
177102 A Choice Common
o The diagram below shows two steps in the transfer of energy in an organism.
Light energy Glucose ATP
Step1
Step2
How does Step 1 differ from Step 2?
A. Step 1 occurs only in plants, but Step 2 occurs in animals and plants.
B. Step 1 occurs only in fungi, but Step 2 occurs in an organelle.
C. Step 1 occurs in mitochondria, but Step 2 occurs only in plants.
D. Step 1 occurs only in plants, but Step 2 occurs only in animals.

18NECAP 2017 Grade 11 Science Released Items_V2
NECAP 2017 RELEASED ITEMSGRADE 11 SCIENCE
LS3 (9-11) POC-8 Given information about living or extinct organisms, cite evidence to explain the frequency of inherited characteristics of organisms in a population, OR explain the evolution of varied structures (with defi ned functions) that affected the organisms’ survival in a specifi c environment (e.g., giraffe, wind pollination of fl owers).
48399 C Choice Common
a The diagram below shows the DNA fi ngerprints of six strains of Lactobacillus bacteria.
2–
3–
4–
6–
Kb
1 2 3 4 5 6
Strain
Which two strains show the greatest genetic similarity?
A. Strains 1 and 4
B. Strains 2 and 3
C. Strains 4 and 6
D. Strains 3 and 5

19NECAP 2017 Grade 11 Science Released Items_V2
NECAP 2017 RELEASED INQUIRY TASKGRADE 11 SCIENCE
Broad Area of Inquiry: Formulating Questions & Hypothesizing Inquiry Construct 2: Construct coherent argument in support of a question, hypothesis, prediction
508781
q Identify which group’s prediction about the solution that will reach the lowest temperature is supported by the data in Table 1. Describe how the data support this prediction.
Scoring Guide
Score Description
2
The response demonstrates a general understanding of how to construct a coherent argument in support of a question, hypothesis, or prediction. The response identifi es which group’s prediction about the solution that will reach the lowest temperature is best supported by the data in Table 1 and describes how the data support this prediction.
1The response demonstrates a limited understanding of how to construct a coherent argument in support of a question, hypothesis, or prediction. The overall response is limited.
0 The response is incorrect or irrelevant to the skill or concept being measured.
Blank No response
A general understanding may be exemplifi ed by the following sample response:
The green team’s prediction (potassium nitrate) is best supported by the data. Table 1 shows that potassium nitrate will produce the solution with the greatest decrease (drop) in temperature of –12.4°C.

20NECAP 2017 Grade 11 Science Released Items_V2
NECAP 2017 RELEASED INQUIRY TASKGRADE 11 SCIENCE
SCORE POINT 2
q
The response demonstrates a general understanding of how to construct a coherent argument in support of a question, hypothesis, or prediction. The response correctly identifi es that the Green team’s prediction is best supported by the data in Table 1 and describes how the data support this prediction.
SCORE POINT 1
q
The response demonstrates a limited understanding of how to construct a coherent argument in support of a question, hypothesis, or prediction. The response correctly identifi es that the Green team’s prediction is best supported by the data in Table 1 but does not describe how the data support this prediction.

21NECAP 2017 Grade 11 Science Released Items_V2
NECAP 2017 RELEASED INQUIRY TASKGRADE 11 SCIENCE
SCORE POINT 0
q
The response is incorrect or irrelevant to the skill or concept being measured. The response identifi es the incorrect compound, which is attached to an incorrect team, the Blue team.

22NECAP 2017 Grade 11 Science Released Items_V2
NECAP 2017 RELEASED INQUIRY TASKGRADE 11 SCIENCE
Broad Area of Inquiry: Planning and Critiquing of Investigations Inquiry Construct 5: Develop an organized and logical approach to investigating the question, including
controlling variables
508801
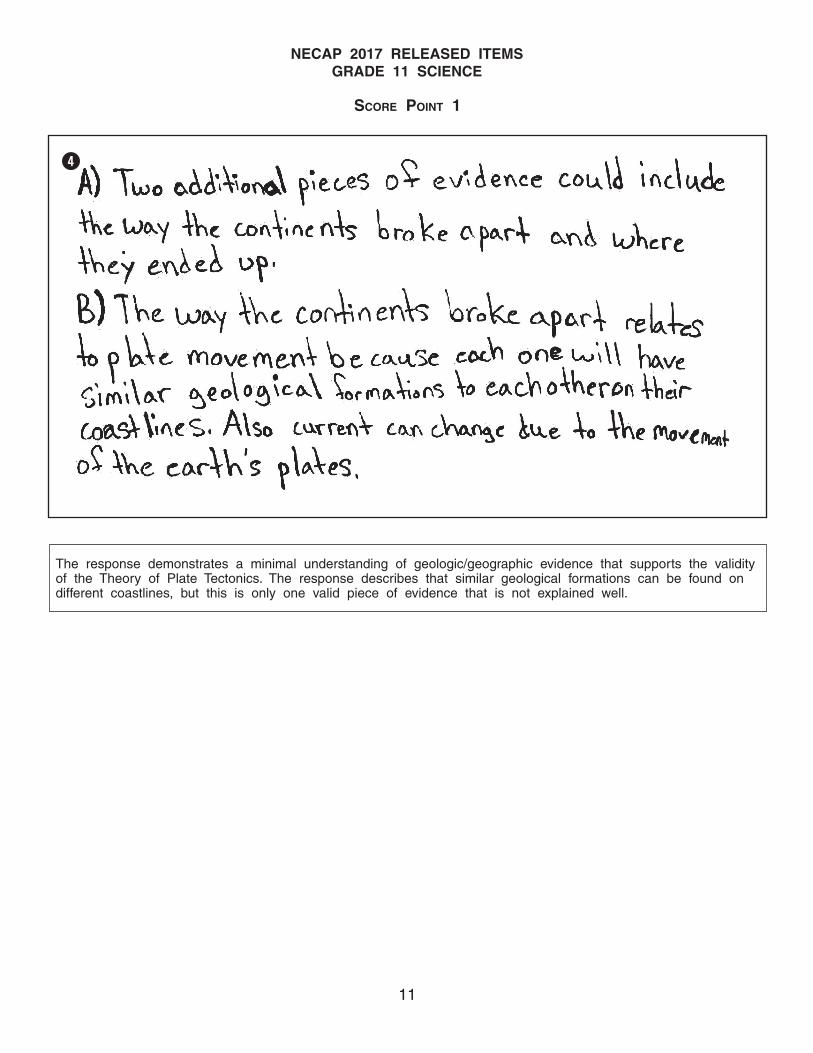
w Explain the most likely reason the students averaged the data from the four different groups. Support your explanation with evidence from the data in Tables 2–5.
Scoring Guide
Score Description
2
The response demonstrates a general understanding of how to develop an organized and logical approach to investigating the question, including controlling variables. The response explains the most likely reason why the students averaged the data from the four different groups and supports the explanation with evidence from the data in Tables 2–5.
1The response demonstrates a limited understanding of how to develop an organized and logical approach to investigating the question, including controlling variables. The overall response is limited.
0 The response is incorrect or irrelevant to the skill or concept being measured.
Blank No response
A general understanding may be exemplifi ed by one reason and support from the following sample responses:
Reasons:
• to compare multiple trials of the same test [fi nd the mean]
• to reduce the infl uence of error or to increase confi dence in data [reliability of results]
• to determine how much their group’s measurements differed from the other groups’ measurements [accuracy of results]
• to show how close to the mean (average) most of the results were [precision of results]
Support:
• In Table 2, the Blue group measured the lowest temperature and the Purple group measured the highest temperature. By averaging, the result was in the middle of the two measurements.
• In Table 5, the Purple group’s data were several degrees higher than all the other groups. The average was closer to what the other three groups measured.
Scoring note: Other logical data-based reasons and supports are acceptable.
23NECAP 2017 Grade 11 Science Released Items_V2
NECAP 2017 RELEASED INQUIRY TASKGRADE 11 SCIENCE
w
SCORE POINT 2
The response demonstrates a general understanding of how to develop an organized and logical approach to investigating the question, including controlling variables. The response explains the students most likely averaged the data from the four different groups to make the data more reliable and supports the explanation with specifi c evidence from the data tables.

24NECAP 2017 Grade 11 Science Released Items_V2
NECAP 2017 RELEASED INQUIRY TASKGRADE 11 SCIENCE
SCORE POINT 1
The response demonstrates a limited understanding of how to develop an organized and logical approach to investigating the question, including controlling variables. The response explains the students most likely averaged the data from the four different groups to simplify the data set, but does not support the explanation with specifi c evidence from the data tables.
w
SCORE POINT 0
The response is incorrect or irrelevant to the skill or concept being measured. The response is redundant, using a synonym for average as the explanation, which is insuffi cient for credit.
w

25NECAP 2017 Grade 11 Science Released Items_V2
NECAP 2017 RELEASED INQUIRY TASKGRADE 11 SCIENCE
Broad Area of Inquiry: Developing and Evaluating Explanations Inquiry Construct 11: Analyze data, including determining if data are relevant, artifact, irrelevant, or
anomalous
508803
e Identify which group’s data show the greatest amount of experimental error during Investigation 1. Use Tables 2–5 to describe a possible experimental error that may have produced the specifi c data results.
Scoring Guide
Score Description
2
The response demonstrates a general understanding of how to analyze data, including determining if data are relevant, artifact, irrelevant, or anomalous. The response identifi es which group’s data show the greatest amount of experimental error during Investigation 1 and uses Tables 2–5 to describe a possible experimental error that may have produced the specifi c data results.
1The response demonstrates a limited understanding of how to analyze data, including determining if data are relevant, artifact, irrelevant, or anomalous. The overall response is limited.
0 The response is incorrect or irrelevant to the skill or concept being measured.
Blank No response
A general understanding may be exemplifi ed by the following sample response:
The Purple group’s data have the greatest amount of experimental error.
The response may include one of the following possible sources of error descriptions:
• inaccurate measurement (too much solvent, too little solute, reading thermometer scale incorrectly, reading graduated cylinder scale incorrectly or not accounting for water meniscus/surface curvature)
• inconsistent/improper procedure (not mixing all the compound in the water at once, taking readings at the wrong times, not subtracting container mass from total mass to get net mass of compound, not cleaning the equipment between tests)
• improper construction/operation of the calorimeter (using only one cup and allowing more heat to escape the system than from the calorimeters of the other groups, not placing the thermometer far enough inside the solution, not keeping the lid on during the four minutes of measurements)
• lack of thermometer, cylinder, or balance calibration (balance reading below correct value, thermometer reading above correct value, graduated cylinder reading below correct value)
Scoring note: Other sources of error are acceptable if accompanied by logical reasoning consistent with the factors involved in the investigation and the data results.

26NECAP 2017 Grade 11 Science Released Items_V2
NECAP 2017 RELEASED INQUIRY TASKGRADE 11 SCIENCE
SCORE POINT 2
e
The response demonstrates a general understanding of how to analyze data, including determining if data are relevant, artifact, irrelevant, or anomalous. The response identifi es that the Purple group’s data show the greatest amount of experimental error during Investigation 1 and uses Tables 2–5 to describe that a measurement error in the amount of solute may have produced the anomalous data.

27NECAP 2017 Grade 11 Science Released Items_V2
NECAP 2017 RELEASED INQUIRY TASKGRADE 11 SCIENCE
SCORE POINT 1
e
The response demonstrates a limited understanding of how to analyze data, including determining if data are relevant, artifact, irrelevant, or anomalous. The response identifi es that the Purple group’s data show the greatest amount of experimental error during Investigation 1, but the description of a measurement error is insuffi cient.
SCORE POINT 0
e
The response is incorrect or irrelevant to the skill or concept being measured. The response chooses an incorrect group and does not suggest a valid form of experimental error.

28NECAP 2017 Grade 11 Science Released Items_V2
NECAP 2017 RELEASED INQUIRY TASKGRADE 11 SCIENCE
Broad Area of Inquiry: Developing and Evaluating Explanations Inquiry Construct 12: Use evidence to support and justify interpretations and conclusions or explain how
the evidence refutes the hypothesis
508804
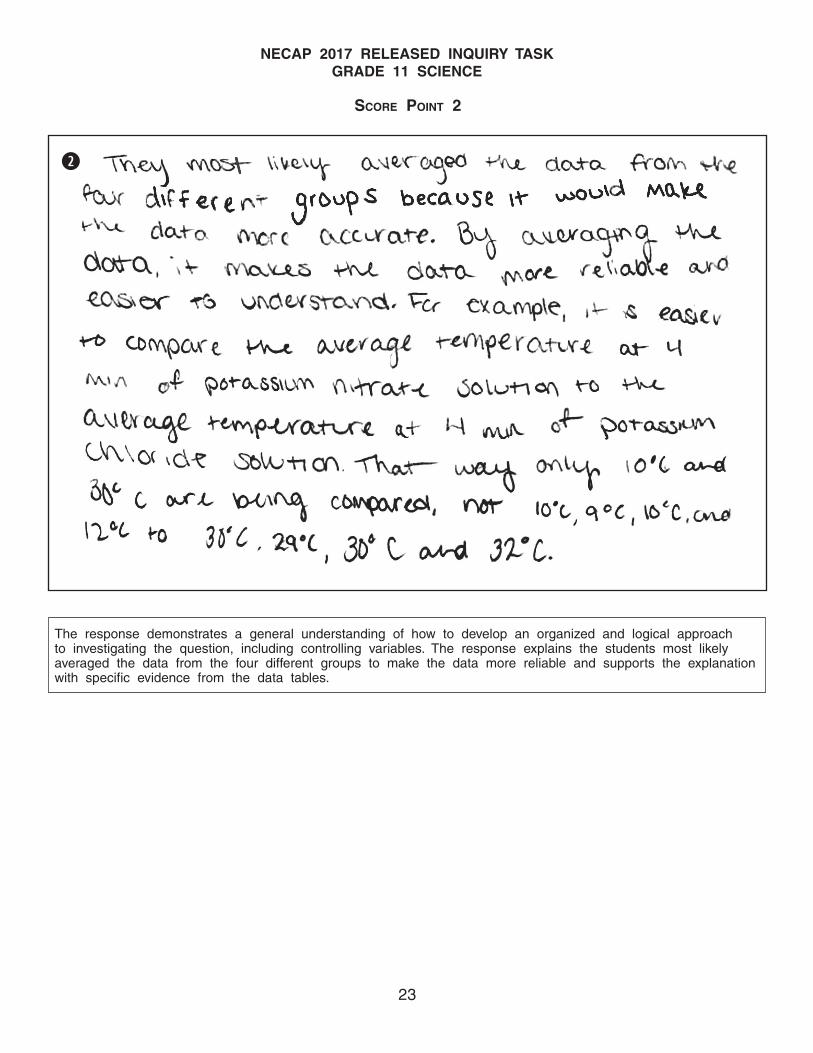
r Use the specifi c data for each of the four compounds in Tables 2–5 from Investigation 1 to justify the students’ choice of potassium nitrate (KNO3) as the best compound to use in a cold pack.
Scoring Guide
Score Description
3
The response demonstrates a thorough understanding of how to use evidence to support and justify interpretations and conclusions or explain how the evidence refutes the hypothesis. The response uses the specifi c data for each of the four compounds in Investigation 1 in Tables 2–5 to justify the students’ choice of potassium nitrate (KNO3) as the best compound to use in a cold pack.
2The response demonstrates a general understanding of how to use evidence to support and justify interpretations and conclusions or explain how the evidence refutes the hypothesis. The overall response is general.
1The response demonstrates a limited understanding of how to use evidence to support and justify interpretations and conclusions or explain how the evidence refutes the hypothesis. The overall response is limited.
0 The response is incorrect or irrelevant to the skill or concept being measured.
Blank No response
A thorough understanding may be exemplifi ed by the following sample response:
The response compares potassium nitrate’s results to the other three compounds’ results and explains why it is a better choice.
Potassium nitrate will likely take the least amount of compound to cool to 1°C because 30 g (an equal amount as the other compounds) cooled the most during the four minutes with a –12°C average. An equal amount of ammonium chloride (30 g) had the next most cooling and averaged –11°C. An equal amount of potassium chloride (30 g) had a temperature increase of +8°C. An equal amount of sodium nitrate (30 g) had the least cooling and averaged –9°C.

29NECAP 2017 Grade 11 Science Released Items_V2
NECAP 2017 RELEASED INQUIRY TASKGRADE 11 SCIENCE
SCORE POINT 3
r
The response demonstrates a thorough understanding of how to use evidence to support and justify interpretations and conclusions or explain how the evidence refutes the hypothesis. The response uses specifi c data for each of the four compounds in Investigation 1 in Tables 2–5 to justify the students’ choice of potassium nitrate (KNO3) as the best compound to use in a cold pack.

30NECAP 2017 Grade 11 Science Released Items_V2
NECAP 2017 RELEASED INQUIRY TASKGRADE 11 SCIENCE
SCORE POINT 2
r
The response demonstrates a general understanding of how to use evidence to support and justify interpretations and conclusions or explain how the evidence refutes the hypothesis. The response uses specifi c data for two out of the four compounds (ammonium chloride and potassium nitrate) to justify which compound would be the best to use in a cold pack, but uses a general statement to justify the other two compounds (potassium chloride and sodium nitrate) as poorer choices.
31NECAP 2017 Grade 11 Science Released Items_V2
NECAP 2017 RELEASED INQUIRY TASKGRADE 11 SCIENCE
SCORE POINT 1
r
The response demonstrates a limited understanding of how to use evidence to support and justify interpretations and conclusions or explain how the evidence refutes the hypothesis. The response justifi es potassium nitrate as the best compound to use in a cold pack, but does not use specifi c evidence from any of the tables to support the justifi cation.
SCORE POINT 0
r
The response is irrelevant to the skill or concept being measured. The response does not take a position on which compound would be best to use in a cold pack.

32NECAP 2017 Grade 11 Science Released Items_V2
NECAP 2017 RELEASED INQUIRY TASKGRADE 11 SCIENCE
Broad Area of Inquiry: Conducting Investigations Inquiry Construct 8: Use accepted methods for organizing, representing, and manipulating data
508805
t Create a graph that compares the average temperatures recorded by the class over four minutes in Table 6 during Investigation 2. Be sure to include all required elements of a graph and choose a scale that will clearly show the data.
Scoring Guide
Score Description
3
The response demonstrates a thorough understanding of how to use accepted methods for organizing, representing, and manipulating data. The response includes a graph that compares the average temperatures recorded by the class over four minutes in Table 6 during Investigation 2. The graph has all the required elements and a scale that clearly shows the data.
2The response demonstrates a general understanding of how to use accepted methods for organizing, representing, and manipulating data. The overall response is general.
1The response demonstrates a limited understanding of how to use accepted methods for organizing, representing, and manipulating data. The overall response is limited.
0 The response is incorrect or irrelevant to the skill or concept being measured.
Blank No response

33NECAP 2017 Grade 11 Science Released Items_V2
NECAP 2017 RELEASED INQUIRY TASKGRADE 11 SCIENCE
A thorough understanding may be exemplifi ed by the following sample response:
1 2 3 4
20
16
12
8
4
1 2 3 41 2 3 4
0
–4
Time (min)
Key
Tem
per
atu
re (°C
)
Average KNO3 Solution Temperatures(dissolved in 200 mL water)
KNO3Mass (g)
40
60
70
50
Scoring note: Error tolerance for data points is +/– 0.5°C. Refer to Table 6 for data values as follows. Graph should be a line graph including title, labeled axes, an appropriate scale, and labels or a key to show the four different masses of KNO3.
Table 6: Average Potassium Nitrate (KNO3)Solution Temperatures (dissolved in 200 mL water)
Temperature (°C)
0min
22
22
22
22
1min
2min
3min
4min
8 7 7 6
3 3 2 2
0 –2 –2 –2
–5 –7 –7 –6
40
50
60
70
1
2
3
4
TestMass of
DissolvedKNO3 (g)

34NECAP 2017 Grade 11 Science Released Items_V2
NECAP 2017 RELEASED INQUIRY TASKGRADE 11 SCIENCE
SCORE POINT 3
t
The response demonstrates a thorough understanding of how to use accepted methods for organizing, representing, and manipulating data. The response includes a graph that compares the average temperatures recorded by the class over four minutes in Table 6 during Investigation 2. The graph has correctly plotted data points, an appropriate title and axis labels with units, appropriate axis scales, and a legend.

35NECAP 2017 Grade 11 Science Released Items_V2
NECAP 2017 RELEASED INQUIRY TASKGRADE 11 SCIENCE
SCORE POINT 2
t
The response demonstrates a general understanding of how to use accepted methods for organizing, representing, and manipulating data. The graph has mostly correctly plotted data points, labels on the axes, mostly appropriate axis scales, and labeled lines. The graph is missing a title, units on the y-axis, and one data point on the Test 2 line. The x-axis scale does not start at the origin, and the lack of a title along with the weak legend makes it diffi cult to discern what information the graph is conveying. Overall, the response demonstrates a general understanding of graphing, but lacks several elements of a thorough response.

36NECAP 2017 Grade 11 Science Released Items_V2
NECAP 2017 RELEASED INQUIRY TASKGRADE 11 SCIENCE
SCORE POINT 1
t
The response demonstrates a limited understanding of how to use accepted methods for organizing, representing, and manipulating data. The graph has two correctly plotted data sets, labels on the axes with units, and a consistent scale. However the y-axis scale does not include the negative data points, which makes two data sets incomplete, the title is weak, and there is no legend. These missing elements make it diffi cult to compare the four data sets or to discern what information is being conveyed.

37NECAP 2017 Grade 11 Science Released Items_V2
NECAP 2017 RELEASED INQUIRY TASKGRADE 11 SCIENCE
SCORE POINT 0
t
The response is totally incorrect or irrelevant to the skill or concept being measured. There is insuffi cient demonstration of understanding of constructing a line graph with the given data sets.

38NECAP 2017 Grade 11 Science Released Items_V2
NECAP 2017 RELEASED INQUIRY TASKGRADE 11 SCIENCE
Broad Area of Inquiry: Conducting Investigations Inquiry Construct 10: Summarize results based on data
508813
y Explain why Eva’s claim that the class can make a cold pack that cools to 1°C using potassium nitrate is supported by the data in Table 6 even though Victor’s statement that the class did not match the fi nal temperature of 1°C is true.
Scoring Guide
Score Description
2
The response demonstrates a general understanding of how to summarize results based on data. The response explains why Eva’s claim that the class can make a cold pack that cools to 1°C using potassium nitrate is supported by the data in Table 6 even though Victor’s statement that the class did not match the fi nal temperature of 1°C is true.
1The response demonstrates a limited understanding of how to use evidence to support and justify interpretations and conclusions or explain how the evidence refutes the hypothesis. The overall response is limited.
0 The response is incorrect or irrelevant to the skill or concept being measured.
Blank No response
A general understanding may be exemplifi ed by one of the following sample responses:
• Investigation 2 provides evidence that a specifi c mass (between 50 and 60 g) of KNO3 dissolved in 200 mL of water would reach (be close to) a minimum observed temperature of 1°C; the relationship between the mass of KNO3 and the resulting solution temperature shows that the cold pack can reach 1°C with an amount of KNO3 that wasn’t tested (was between the amounts tested).
• The temperatures in Table 6 show that a temperature colder than 1°C was reached. A different ratio (different relative amounts) of the ingredients of the cold pack (decreasing the amount of KNO3 or increasing the amount of water, or both) could result in an exact temperature of 1°C.
Training note: Supportive reasoning other than those listed are acceptable with supporting evidence clearly identifi ed/explained.

39NECAP 2017 Grade 11 Science Released Items_V2
NECAP 2017 RELEASED INQUIRY TASKGRADE 11 SCIENCE
SCORE POINT 2
y
The response demonstrates a general understanding of how to summarize results based on data. The response clearly explains why Eva’s claim is supported by the data in Table 6 using specifi c evidence from the table.
SCORE POINT 1
y
The response demonstrates a limited understanding of how to summarize results based on data. The response explains why Eva’s claim is supported by the data in Table 6, but the evidence given from the table in support of the claim is vague.

40NECAP 2017 Grade 11 Science Released Items_V2
NECAP 2017 RELEASED INQUIRY TASKGRADE 11 SCIENCE
y
SCORE POINT 0
The response is incorrect or irrelevant to the skill or concept being measured. The response does not adequately explain why Eva’s claim is supported by the data in Table 6.

41NECAP 2017 Grade 11 Science Released Items_V2
NECAP 2017 RELEASED INQUIRY TASKGRADE 11 SCIENCE
Broad Area of Inquiry: Planning and Critiquing of Investigations Inquiry Construct 4: Identify information/evidence that needs to be collected in order to answer the
question, hypothesis, prediction
508816
u Identify the three most important independent or controlled variables from Investigation 2 that would need to be used in the new investigation to be able to compare the results of both investigations. Explain why using these variables would allow a fair comparison.
Scoring Guide
Score Description
2
The response demonstrates a general understanding of how to identify information/evidence that needs to be collected in order to answer the question, hypothesis, or prediction. The response identifi es the three most important independent or controlled variables from Investigation 2 that would need to be used in the new investigation to be able to compare the results of both investigations. The response explains why using these variables would allow a fair comparison.
1The response demonstrates a limited understanding of how to identify information/evidence that needs to be collected in order to answer the question, hypothesis, or prediction. The overall response is limited.
0 The response is incorrect or irrelevant to the skill or concept being measured.
Blank No response
A general understanding may be exemplifi ed by the following sample response:
The students would need to use the same amounts of the potassium nitrate, 200 mL of water, and measure the temperature each minute for four minutes. This would produce data for the same solutions over the same time period to show if the temperature change was greater or less with the plastic bag.
Scoring note: The three essential variables are amount (mass) of compound (independent variable), amount (volume) of water (controlled variable/constant), and time (independent variable).

42NECAP 2017 Grade 11 Science Released Items_V2
NECAP 2017 RELEASED INQUIRY TASKGRADE 11 SCIENCE
SCORE POINT 2
u
The response demonstrates a general understanding of how to identify information/evidence that needs to be collected in order to answer the question, hypothesis, or prediction. The response identifi es the mass of potassium nitrate, the amount of the water, and the time intervals for the temperature readings as the three most important independent or controlled variables from Investigation 2 that would need to be used in the new investigation to be able to compare the results of both investigations. The response also explains why using these variables would allow a fair comparison.

43NECAP 2017 Grade 11 Science Released Items_V2
NECAP 2017 RELEASED INQUIRY TASKGRADE 11 SCIENCE
SCORE POINT 1
u
The response demonstrates a limited understanding of how to identify information/evidence that needs to be collected in order to answer the question, hypothesis, or prediction. The response identifi es the mass of potassium nitrate and the amount of the water as the three most important independent or controlled variables. The initial temperature is not accepted as one of the most important variables, and there is no explanation offered for why any of these variables would allow for a fair comparison.
SCORE POINT 0
u
The response is incorrect or irrelevant to the skill or concept being measured. The response does not demonstrate understanding of independent or controlled variables.
44NECAP 2017 Grade 11 Science Released Items_V2
NECAP 2017 RELEASED INQUIRY TASKGRADE 11 SCIENCE
Broad Area of Inquiry: Formulating Questions & Hypothesizing Inquiry Construct 2: Construct coherent argument in support of a question, hypothesis, prediction
Scoring Guide
Score Description
2
The response demonstrates a general understanding of how to construct a coherent argument in support of a prediction. The response explains how the evidence from both Investigation 1 and Investigation 2 support the prediction that a 40°C heat pack can be made from one of the four compounds.
1The response demonstrates a limited understanding of how to construct a coherent argument by explaining the cause and effect relationship within the prediction. The overall response is limited.
0 The response is incorrect or irrelevant to the skill or concept being measured.
Blank No response
A general understanding may be exemplifi ed by the following sample response:
Only KCl produced a temperature increase (heat release) in Investigation 1. Additional amounts of the compound (KNO3) in Investigation 2 resulted in an additional temperature decrease (heat absorbed). Therefore, using an additional amount of KCl could result in an additional temperature increase up to 40°C.
508817
i Explain how the evidence from both Investigation 1 and Investigation 2 support the prediction that a 40°C heat pack can be made from one of the four compounds.
45NECAP 2017 Grade 11 Science Released Items_V2
NECAP 2017 RELEASED INQUIRY TASKGRADE 11 SCIENCE
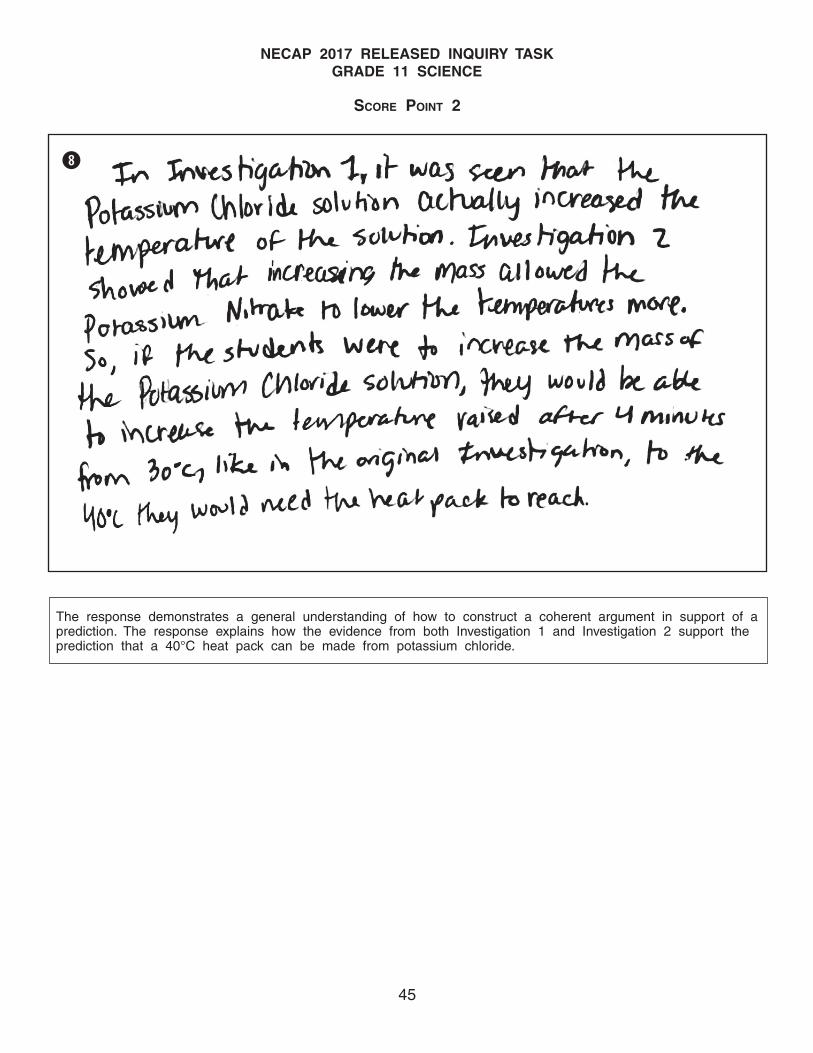
SCORE POINT 2
i
The response demonstrates a general understanding of how to construct a coherent argument in support of a prediction. The response explains how the evidence from both Investigation 1 and Investigation 2 support the prediction that a 40°C heat pack can be made from potassium chloride.

46NECAP 2017 Grade 11 Science Released Items_V2
NECAP 2017 RELEASED INQUIRY TASKGRADE 11 SCIENCE
SCORE POINT 1
i
The response demonstrates a limited understanding of how to construct a coherent argument in support of a prediction. The response uses evidence from Investigation 1 to explain that potassium chloride could be used in a heat pack, but does not support the answer with evidence from Investigation 2.
SCORE POINT 0
i
The response is incorrect or irrelevant to the skill or concept being measured. The response does not adequately explain how the evidence from the investigations could support the prediction.


![[Sprin co] tm swot & global direction](https://static.documents.pub/doc/80x56/547cfbb6b37959532b8b5149/sprin-co-tm-swot-global-direction.jpg)


