New Evidence on the Brain Drain from South Africa Dr Thomas Höppli Economic Research Analyst at SAIPA ([email protected]) School of Economics University of Cape Town PRISM Working Paper Series Number 1/2014
Figure 1: Skills Composition in Traditional Immigration Countries .............................................. 7
Figure 2: Growth of South African Born Population in Traditional Immigration Countries ........... 9
Figure 3: Growth of Total South African Born Population in Traditional Immigration Countries .................................................................................................................. 10
Figure 4: Estimated Number of South Africans in the United Arab Emirates ............................ 12
Figure 5: Skilled South African born Immigrants in Selected Designation Countries (Persons with a Tertiary Education in % of Total) ..................................................... 13
Figure 6: Stock of South African born Population in Other OECD Countries ............................ 14
Figure 7: The Total Stock of South African Born Persons Overseas ........................................ 16
3
1. Introduction
Recent media reports suggest that the South African brain drain is reversing and that highly-
skilled South Africans have been returning in large numbers since the onset of the global
financial crisis in 2008. Examples of these news reports include articles proclaiming that
“Expertise flows back into SA as brain drain is reversed” (Business Day live; Hedley, 2014),
“Returning expatriates – South Africans return from abroad” (Financial Mail; Bisseker, 2014) or
“Brain gain as expats come home” (IOL News; Nicholson, 2014). Even the SABC (2014)
reported in mid-January that the “Brain drain shows signs of reverse”.
These media reports are largely based on recent estimates by Adcorp (2014). According to
Adcorp, there has been a net return migration of 359,000 highly-skilled South Africans since
the beginning of the global financial crisis in 2008. The announcement that such a large num-
ber of highly-skilled South Africans have returned from work assignments abroad is most en-
couraging, particularly given the skills shortage from which the country has been suffering con-
tinuously over the past years. The emigration of highly skilled South Africans over the past
decades has led to a brain drain that has further aggravated the persistent skills shortage in
South Africa which has been caused by several reasons (see Höppli, 2014).
The persistence of this shortage of skills has had a detrimental economic effect and still con-
tinues to hold back South Africa’s development goals. Business leaders have repeatedly high-
lighted the unavailability of a skilled workforce in South Africa as a key growth constraint (see
Grant Thornton, 2013). In combination with other constraints, the skills shortage has thwarted
significant economic growth, which in turn has remained below levels that would facilitate
large-scale job creation. The recent media reports about a reversal of the brain drain are
therefore very good news for the South African economy as it means that the country now
gains more of the much-needed skills than it loses.
However, a closer look at the data casts some doubts on Adcorp’s estimates. In fact, even
Adcorp labour economist Loane Sharp is cited to concede that the estimates are based on
some “heroic assumptions” (Bisseker, 2014). A net return migration of 359,000 highly-skilled
South Africans seems indeed very high, even more so given that the total number of South
Africans residing overseas (i.e. not only highly-skilled persons) was estimated at 758,000 in
2010 (Höppli & Kaplan, 2012). The recent estimates imply that roughly one out of two South
African emigrants has returned since the beginning of the global financial crisis in 2008.
This paper examines the estimates made by Adcorp (2014) and presents an alternative ap-
proach to quantify the extent of emigration from South Africa in an effort to assess the brain
drain or reversal thereof. Based on actual immigration and census data as well as estimates
based on migration statistics, it is possible to track the development of the number of South
Africans who have emigrated over time. A total of 23 destination countries will be analysed,
thereby covering the bulk of emigration destinations. This empirical approach provides esti-
mates of the magnitude of the brain drain since the turn of the century that contradict earlier
estimates.
4
2. Methodology
Reliable and up-to-date migration data is generally hard to come by. This is particularly true
for South Africa. Statistics South Africa (Stats SA) ceased to collect emigration statistics in
February 2004, following the Immigration Act No. 13 of 2002. Moreover, the statistics collected
prior to 2004 were incomplete as only self-declared emigrants were captured. The official sta-
tistics thus understated the true number of emigrants significantly. Kaplan, Meyer & Brown
(2000a) showed that the number of skilled emigrants from South Africa was in fact about 3.2
times higher than official Stats SA figures indicated.
In view of the lack of official South African statistics on emigration and return migration, any
research on the South African brain drain necessarily has to rely on other data sources and/or
estimates to determine the approximate extent of immigration to and emigration from South
Africa. The approach chosen by Adcorp to estimate the net number of high-skilled immigrants
(immigrants minus emigrants) is based on wage data for high-skilled workers in South Africa.1
Adcorp’s recruitment subsidiaries that specialise in the placement of highly-skilled staff (de-
fined for that purpose as staff earning more than R400,000 per annum in 2013) provided the
data basis to estimate the net number of return migrants since 2008. The supply of foreign
high-skilled workers is assumed to be negligible due to strict immigration rules that were
adopted by the Department of Home Affairs in 2002, and further tightened in 2008 and 2010.
At the same time, the demand for high-skilled workers in South Africa is assumed to have re-
mained ‘relatively stable’ over the past decade. This assumption is explained by the following
reasons (Adcorp, 2014):
(1) A persistent state of excess demand for high-skilled workers in the local labour
market, as evidenced by a consistent shortage of high-skilled workers of around
829,000 unfilled vacancies.
(2) A negligible and almost constant unemployment rate for high-skilled workers of
about 0.4%, compared to the significantly higher unemployment rate of the whole
workforce.
The underlying assumption of Adcorp’s estimates is thus that the demand for high-skilled
workers has remained relatively stable and that the local skills shortage could not be eased
through foreign high-skilled workers. Based on this set of assumptions, Adcorp estimated the
change in supply of high-skilled workers using the (real) wage rate of high-skilled workers.
Adcorp’s average real wage figures for high-skilled workers show a decline of 23.0% since the
onset of the global financial crisis in 2008. Adcorp (2014) concludes that: “This decline is con-
sistent with an increased supply of 359,000 additional workers, i.e. a net return of 359,000
South Africans who were on work assignments abroad.” (p. 3)
This paper uses an alternative approach to estimate the extent of the brain drain (or the pre-
sumed reversal thereof). As official South African statistics on emigrants and return migrants
are not available, we use data on migrants from South Africa that was recorded by the destina-
tion countries. After all, a migration flow always affects two countries: when a person leaves a
country, that country usually records this event as an emigration, while the country that this
person moves to (destination country) records this person as an immigrant. Since South Africa
ceased to record emigrants, the migration flows of South Africans are only recorded in one of
1 See Adcorp (2014) for more details on the methodology used for their estimate.
5
those two countries. The focus will therefore necessarily be put on the data provided by the
destination countries of South African emigrants.
The use of destination country data is in fact even recommended for research on migration as
it is generally more accurate and reliable than source country data for the following three rea-
sons (see Kaplan, Meyer & Brown, 2000b, and Höppli, 2010). Firstly, emigrants often do not
declare themselves when they leave their country of origin, which makes it virtually impossible
for authorities to accurately track the number of persons who emigrate. Some persons may in
fact leave with the intention of returning after a few months and are thus not leaving with the
intention of staying overseas permanently. Secondly, most emigrants from South Africa travel
to their destination country by air. Entering a foreign country through an airport illegally is al-
most impossible, which means that virtually all immigrants from South Africa can be expected
to be recorded in the destination country. Thirdly, it is very unlikely that illegal immigrants will
be appointed to highly skilled formal positions. Highly skilled migrants – the focus in this paper
and the cause of the brain drain – can therefore be expected to be in the destination country
legally and to be officially recorded.
In practice, national data on migration flows is often inaccurate and unreliable. As a conse-
quence, researchers often rather rely on stock data to analyse the migration between two
countries (i.e. the total number of persons from a specific country of origin who are present in
the destination country at a particular point in time – often at the time of a national census).
The use of stock data instead of flow data has indeed some economic and statistical reasons.
For instance, it prevents problems of endogeneity of certain variables and achieves better
validity as stock data is generally more accurate and reliable (Docquier & Marfouk, 2006).
Due to the lack of South African data and the disadvantages of actual flow data, this paper
uses stock data published by the statistical offices of destination countries with significant
numbers of South African immigrants. Most of these countries carry out censuses in regular
intervals, which include the number of persons by their country of origin, or even publish an-
nual estimates of the number of persons born overseas that are present. As the quality of im-
migration or census data is generally better than that of emigration data, it is safe to assume
that the data recorded by the local statistical offices represents a fairly true picture of the net
number of persons who have immigrated from South Africa.
It is important to keep in mind that numerous South Africans are dual nationals. A focus on
South African immigrants in a destination country would therefore not take into account that a
person from South Africa who holds a passport from that particular country will not be recorded
as a South African immigrant, but rather as a local return migrant. The reported numbers of
South African immigrants would therefore be likely to underestimate the true number of per-
sons who immigrated from South Africa. To avoid this problem, the following figures are based
on the concept of ‘place of birth’ instead of ‘nationality’. The figures thus include all persons
who were born in South Africa and who have left the country at some stage, including for ex-
ample South African dual nationals who immigrated and settled in the UK as British nationals.
6
3. South African Born Persons Overseas
3.1. Traditional Immigration Countries
As a first step, the traditional English speaking immigration countries Australia, New Zealand,
Canada, the United Kingdom and the United States are scrutinised. Kaplan, Meyer & Brown
(2000b) established that these five countries absorb the bulk of emigrants from South Africa of
about 75%. With the Stats SA figures at their disposal, the authors confirmed that the United
Kingdom, Australia, New Zealand, Canada and the United States accounted for some 79% of
the total emigration before 1994 and 71% after 1994.
The popularity of these destination countries is in line with migration theory. The five countries
not only share a common language with South Africa but also have historical and cultural simi-
larities. This makes it much easier for South African immigrants to establish themselves in the
labour market and to integrate into the local society than in other, non-English speaking coun-
tries. At the same time, there has been a considerable demand for skilled professionals in
these five countries, which has added to their appeal as emigration destinations.
The most recent brain drain database of the World Bank (2004)2 corroborates the popularity of
these five English speaking countries. Over 90% of all immigrants from South Africa in the 30
OECD countries in 2000 resided in one of these five countries. In terms of skills, the results
are even more biased: over 95% of the emigrants from South Africa with a tertiary education
were to be found in one of these five countries.
The inclusion of these five destination countries is therefore indispensable when assessing the
brain drain from South Africa. Not only have these countries absorbed a high absolute number
of emigrants from South Africa, but the emigrants in these countries also tend to be highly
skilled. Rather strict immigration laws that favour highly-skilled immigration have contributed to
this bias in the skills composition of the immigrants in these countries. Canada, Australia and
New Zealand, for example, use point systems to recruit highly skilled workers that their local
economies need; and the United Kingdom introduced such a system in 2002 (OECD, 2005).
Similarly, immigration laws in the USA have traditionally caused a positive selection of immi-
grants in terms of their education (Massey et al, 1998).
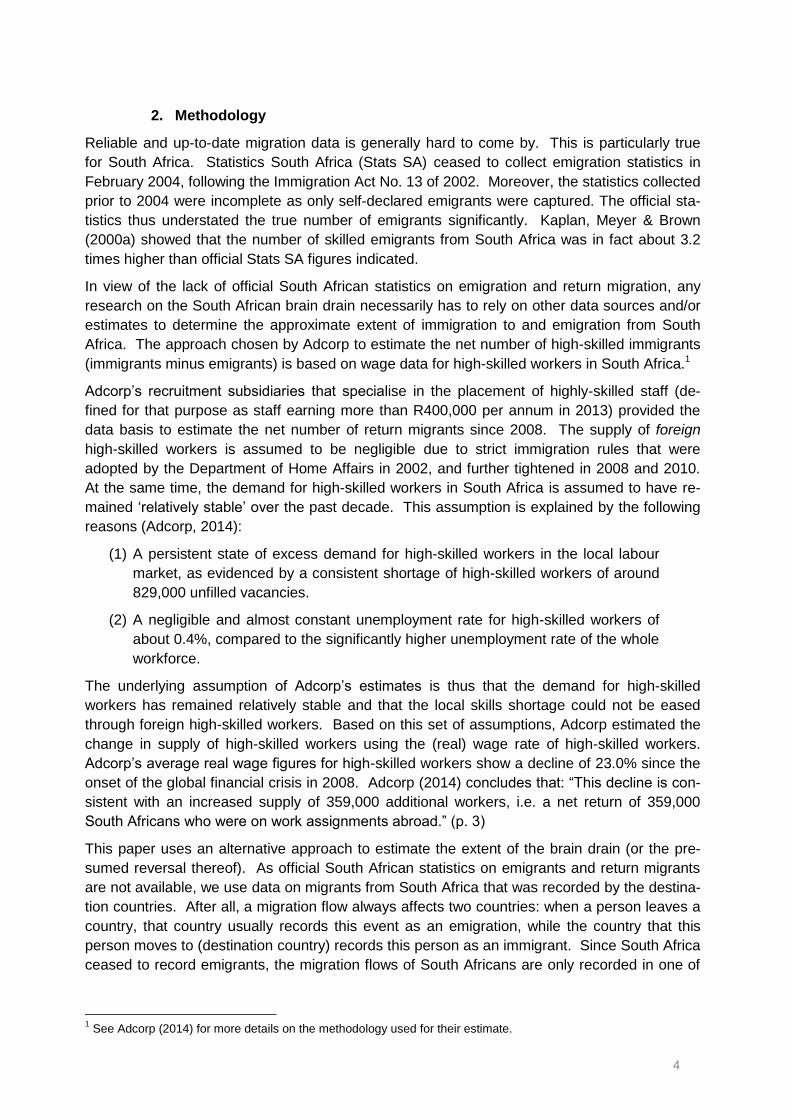
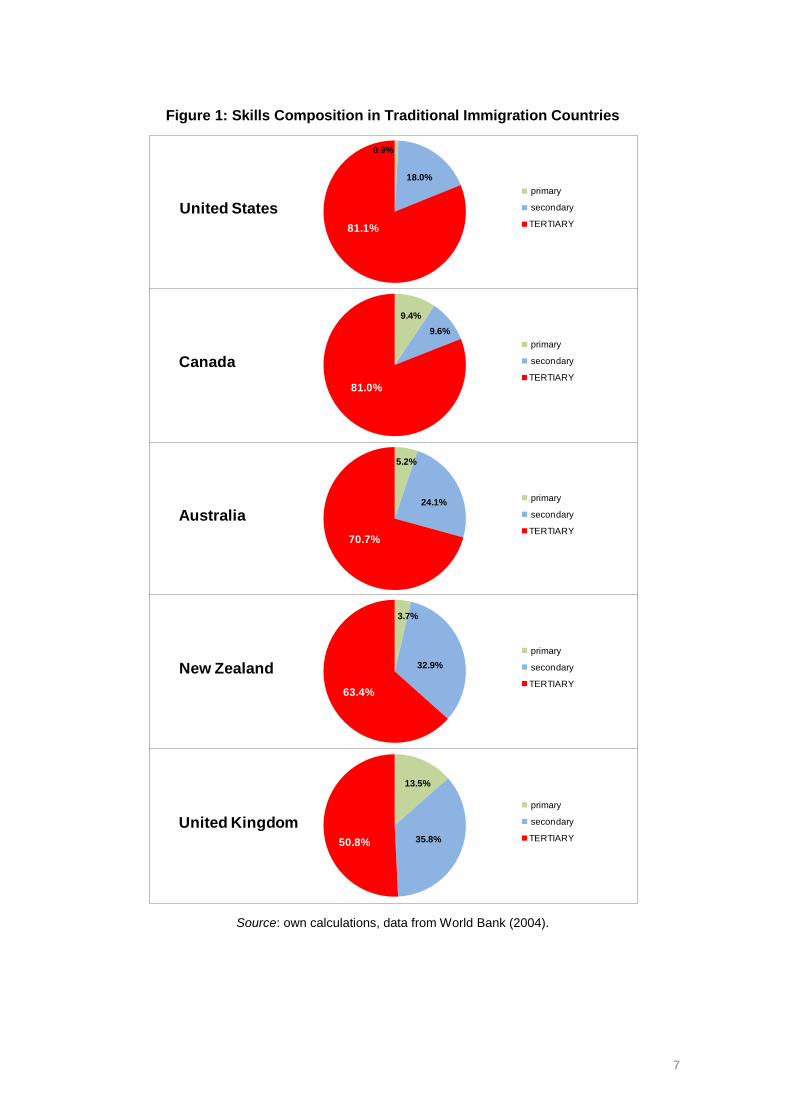
The skills composition of the immigrants from South Africa in those five countries confirms that
emigrants from South Africa are mostly highly-skilled (persons with a tertiary education; see
(Figure 1), causing a brain drain from South Africa to those countries.
As Figure 1 illustrates, immigrants from South Africa generally have a high education level in
these five countries. In Canada and the United States, over 80% of the immigrants from South
Africa have some form of a tertiary education, while their share in Australia exceeds 70% and
is roughly two thirds in New Zealand. The primary reason for this high education level is that
these countries have immigration laws that favour highly skilled immigrants, while making im-
migration for unskilled persons more difficult.
.
2 Migration statistics are often published with large time delays, especially when it comes to internationally compa-rable data. Internationally comparable data on skills levels of migrants is generally scarce and only published with substantial lags after census data is published.
7
Figure 1: Skills Composition in Traditional Immigration Countries
Source: own calculations, data from World Bank (2004).
0.9%
18.0%
81.1%
United States
primary
secondary
TERTIARY
9.4%
9.6%
81.0%
Canada
primary
secondary
TERTIARY
5.2%
24.1%
70.7%
Australia
primary
secondary
TERTIARY
3.7%
32.9%
63.4%
New Zealand
primary
secondary
TERTIARY
13.5%
35.8%50.8%
United Kingdom
primary
secondary
TERTIARY
8
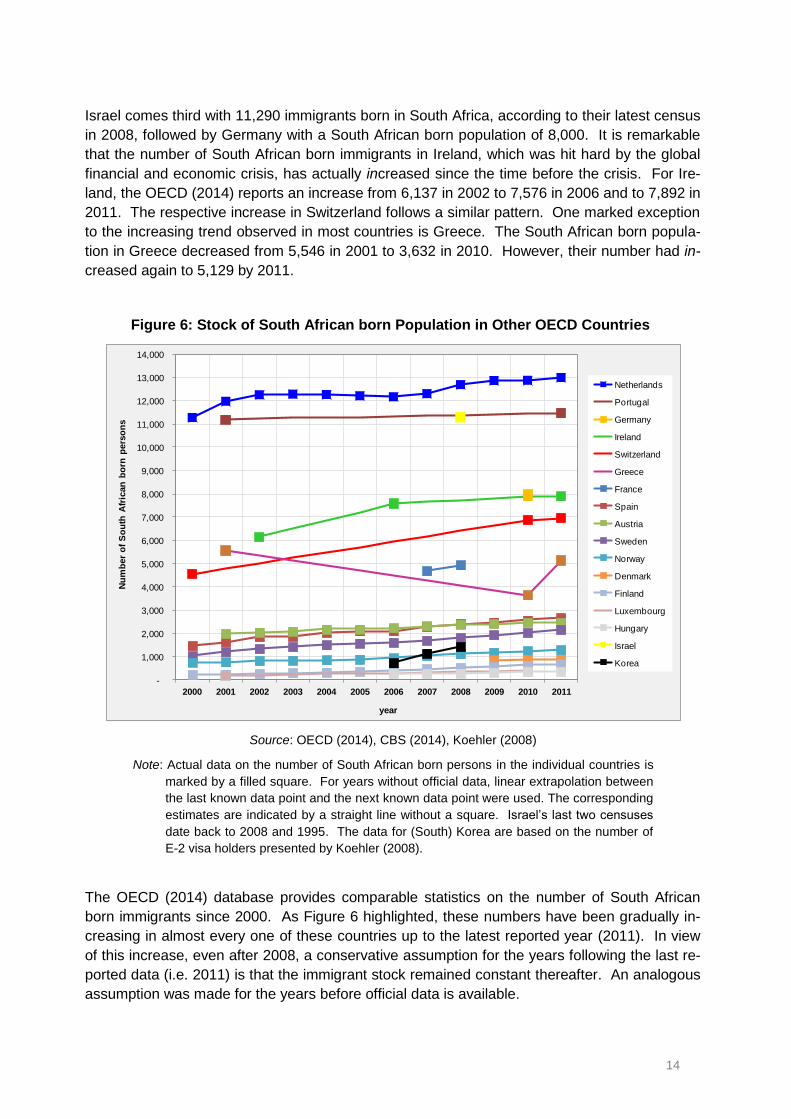
The fact that the UK – the country with the largest South African born population – has a lower
share of immigrants from South Africa with a tertiary education (just over 50%) can in part be
explained by the fact that a considerable number of South Africans hold dual citizenship. For
those emigrants, the skills level does obviously not constitute a barrier to immigrating and set-
tling in the UK. Moreover, the migration and subsequent job search may be facilitated by fam-
ily ties and existing social networks.
The World Bank brain drain database further reveals that the entire emigration from South
Africa was indeed biased towards skilled people: Some 63% of the recorded immigrants in the
OECD had some form of a tertiary education and another 27% some secondary education. As
illustrated in Figure 1, the share of emigrants from South Africa with a secondary or tertiary
education is even higher in the five English speaking countries than in the rest of the OECD
countries. The data also reveals that these five countries absorbed over 90% of all the South
African born emigrants in the OECD at that time (2000), and that these five countries were the
destination for over 95% of all the emigrants with a tertiary education.
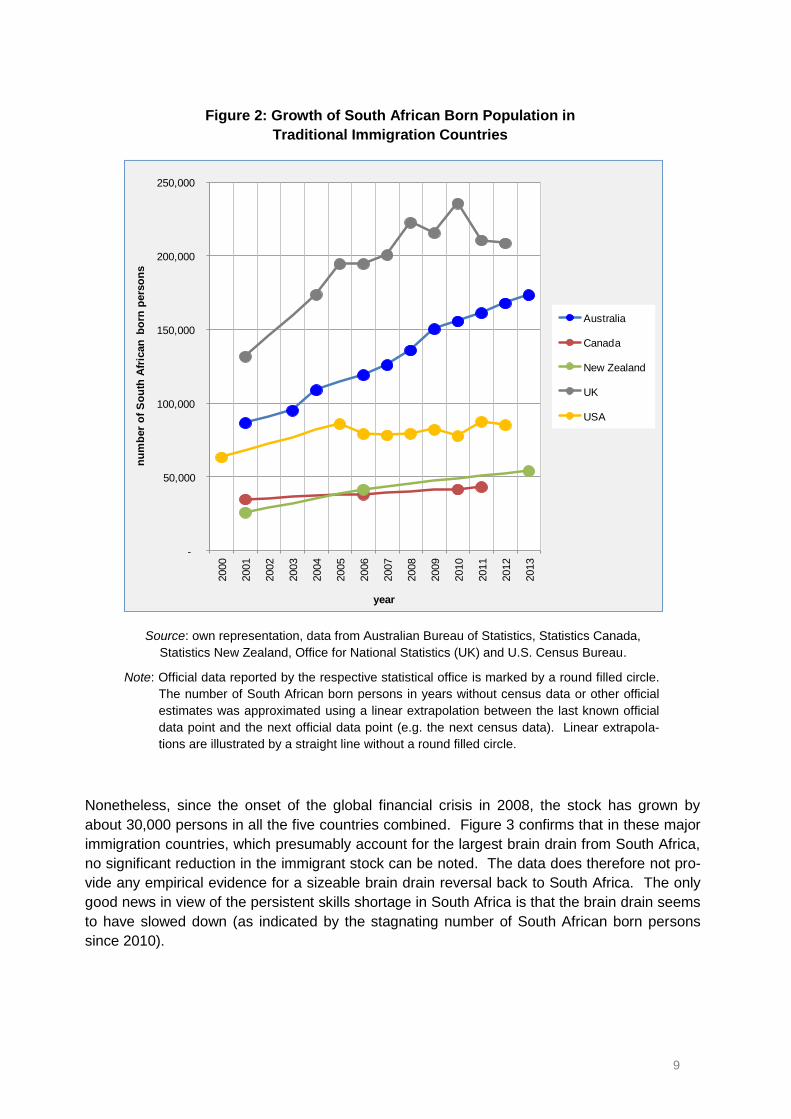
The growth in the number of South African born immigrants in these five countries is shown in
Figure 2. The figures reported by the respective statistical offices are either census data or
official estimates. All the figures are based on the concept of ‘birthplace’, which includes dual
nationals, provided that the person was born in South Africa. This is particularly important in
the case of the UK as a not insignificant number of South Africans citizens hold British citizen-
ship. Such emigrants would obviously not be included if the concept of ‘citizenship’ were to be
used instead.
The number of South African born persons in the USA, which is known for strict immigration
laws, has vacillated between 80,000 and 90,000 persons since 2005. In Australia, Canada
and New Zealand, the number of South African born persons has been gradually increasing,
even in the wake of the global financial and economic crisis that started in 2008.
The UK is the only one of the five countries where a noticeable decrease in the number of
South African born persons was recorded, especially after 2010, following a significant in-
crease in that year. The number of South African born persons decreased by about 27,000
between 2010 and 2012. However, it is worth noting again that the UK has the lowest average
skills level of immigrants from South African among these five countries (see Figure 1).
Adding up the numbers of South African born persons in these five countries, as done in Fig-
ure 3 below, provides an even clearer picture. The total number of South African born persons
in these countries, which have traditionally been the destination of the majority of the skilled
emigrants from South Africa (brain drain), has in fact seen a gradual increase over time. How-
ever, the continuous increase observed over the first decade of the century has slowed down,
and the total number of South African born immigrants has remained relatively stable at a level
of roughly 560,000 persons from 2010 onwards.
9
Figure 2: Growth of South African Born Population in
Traditional Immigration Countries
Source: own representation, data from Australian Bureau of Statistics, Statistics Canada,
Statistics New Zealand, Office for National Statistics (UK) and U.S. Census Bureau.
Note: Official data reported by the respective statistical office is marked by a round filled circle.
The number of South African born persons in years without census data or other official
estimates was approximated using a linear extrapolation between the last known official
data point and the next official data point (e.g. the next census data). Linear extrapola-
tions are illustrated by a straight line without a round filled circle.
Nonetheless, since the onset of the global financial crisis in 2008, the stock has grown by
about 30,000 persons in all the five countries combined. Figure 3 confirms that in these major
immigration countries, which presumably account for the largest brain drain from South Africa,
no significant reduction in the immigrant stock can be noted. The data does therefore not pro-
vide any empirical evidence for a sizeable brain drain reversal back to South Africa. The only
good news in view of the persistent skills shortage in South Africa is that the brain drain seems
to have slowed down (as indicated by the stagnating number of South African born persons
since 2010).
-
50,000
100,000
150,000
200,000
250,000
2000
2001
2002
2003
2004
2005
2006
2007
2008
2009
2010
2011
2012
2013
nu
mb
er
of
So
uth
Afr
ican
bo
rn p
ers
on
s
year
Australia
Canada
New Zealand
UK
USA
10
Figure 3: Growth of Total South African Born Population in
Traditional Immigration Countries
Source: see Figure 2
Note: Data for the number of South African born persons in Canada in 2012 were not yet avail-
able at the time of writing this article. Between 2001 and 2011, the South African born
population in Canada had gradually increased by an average of 2.2% per annum. Using
a conservative estimate, it was assumed that the population did not grow in 2012 at all
(i.e. that the number of South African born persons remained constant after 2011).
3.2. New Popular Destination
In recent years, the United Arab Emirates (UAE) have become a popular destination for South
African emigrants. Dubai and Abu Dhabi are two of the places in the UAE that have attracted
sizable numbers of South Africans. However, in contrast to the five destinations considered in
section 3.1, which primarily attract skilled immigrants (and also have corresponding immigra-
tion laws that favour skilled immigrants), the UAE has attracted large numbers of skilled and
unskilled immigrants from all over the world as their economy requires large numbers of both
low- and highly-skilled labour. The share of non-nationals is therefore exceptionally high in the
UAE (88.5% in 2010 according to figures of the UAE National Bureau of Statistics, 2010).
The actual number of South Africans in the UAE is unknown. Neither their statistical offices
nor their census data provide data on the number of South Africans residing in the UAE. Esti-
mates have put the number of South Africans somewhere between 40,000 and 100,000 (see
for example Gerardy, 2008, or sagoodnews, 2008). What is known though is the total number
of immigrants of all nationalities in the UAE. According to the United Nations (2013), the total
stock of immigrants in the UAE roughly tripled between 2000 and 2010, and continued to in-
crease by about 7% between 2010 and 2013.
Phampi (2013) produced a rough breakdown of the foreign population in the UAE by nationality
for 2010/11. These figures show that immigrants from India, Pakistan, the Philippines and
Based on these assumptions, it is possible to roughly estimate the development of the total
stock of South African born persons in these other countries since 2000. The estimates reveal
a similar pattern to the ones obtained for the five English speaking countries (Section 3.1) and
for the UAE (Section 3.2). The total number of South African born immigrants has continu-
ously increased from roughly 70,000 persons in 2000 to about 80,000 persons in 2011.
4. Reversal or Continuation of Brain Drain?
This paper presented official figures and estimates for the total number of South African born
persons (emigrants) in 23 destination countries since the turn of the century. The countries
analysed include the five traditional immigration countries Canada, the United States, New
Zealand, Australia and the UK (see Section 3.1), the United Arab Emirates (see Section 3.2)
as well as 17 other OECD countries for which sufficient data was available, including popular
emigration destinations such as the Netherlands, Portugal, Ireland, Greece and South Korea
(see Section 3.3).
The five traditional immigration countries absorb the bulk of emigrants from South Africa (some
560,000 South African born persons were recorded there in 2012) and arguably also absorb
the largest share of the highly skilled emigrants. These countries are therefore critical in terms
of the brain drain, which came about through the emigration of highly-skilled people who left
South Africa for these countries. However, as illustrated in Figure 3, the total number of South
African born immigrants has gradually increased in these five countries from the beginning of
the century until about 2010. Their total number stagnated in 2011 and 2012, but did not de-
cline significantly, which would be an indication of a reversal of the brain drain. In the two
countries that had already published figures for 2013, namely Australia and New Zealand, the
number of South African born immigrants has in fact further increased.
The United Arab Emirates (UAE) do not publish census or other immigration data by nationality
or country of birth. Recent figures indicate that the total number of non-nationals in the UAE
has been on an increasing trend, even following the global financial and economic crisis.
There is no sound evidence that the number of South Africans in the UAE has significantly de-
creased, while the overall number of immigrants has increased. The number of South Africans
(including both low- and highly skilled persons) is indeed estimated to have increased by over
6,000 persons between 2010 and 2013. A large-scale brain drain reversal from the UAE since
2008 is therefore unlikely, even less so as the skills composition of South Africans in the UAE
is presumably less biased towards highly skilled people than it is in the traditional five immigra-
tion countries. The same applies to South African born persons in the other OECD countries,
whose numbers have not shown any clear signs of a significant decrease either.
Figure 7 summarises and adds up the officially reported stocks and estimated stocks of the
total numbers of South African born persons in the 23 major migration destinations countries
included in this paper. It becomes evident that the overall stock of South African born persons
living overseas has increased continuously up until 2010 at an average rate of approximately
5%. Growth subsided from 2010 onwards, with an average annual growth of a mere 0.6% – a
growth rate that is markedly lower than in the years before 2010, but still positive. Figure 7
thus empirically confirms that the cumulative number of emigrants from South Africa has not
significantly reduced since the onset of the global financial crisis in 2008, but rather continued
to increase, yet at a much lower rate.
16
There is no doubt that the global financial and economic crisis has affected the job security of
these emigrants – similar to the job losses experienced in South Africa. It is unlikely though
that highly-skilled emigrants were disproportionately more affected than less skilled immi-
grants. In an economic downturn, less skilled workers are often more negatively affected.
Moreover, empirical evidence shows that when highly skilled persons emigrate, it is generally
the least skilled of those that eventually return to their country of origin (see for instance Borjas
& Bratsberg, 1996). The skills composition in the destination country then becomes even more
pronounced in favour of highly skilled persons. The brain drain from the country of origin
(South Africa in this case) is therefore not expected to be eased significantly as it is generally
not the ‘best and brightest’ who return.
Figure 7: Development of Total Stock of South African Born Persons Overseas
Source: see Figures 3, 4 and 6.
Note: The stock in the traditional five immigration countries in 2013 is based on actual
figures, if available, or alternatively on the latest available figure, assuming that the
stock did not further increase, but remained constant. It was further assumed that the
stock in 2000 is the same as in 2001 if no data was available. The data for the 17
OECD countries only cover the period up to 2011. It was conservatively assumed that
their numbers remained constant between 2011 and 2013, and did not continue the
growth pattern observed between 2000 and 2010.
Another observation that can be made in Figure 7 is that the stock of South African born immi-
grants not only continues to be highest in the five traditional immigration countries, but also
that the stock in these countries has experienced the largest increase in absolute terms be-
tween 2000 and 2013. Kaplan, Meyer & Brown (2000b) showed more than a decade ago that
these countries absorbed some 75% of all South African emigrants. These recent figures sub-
stantiate the continued popularity of these countries. These five traditional immigration coun-
tries absorbed some 76% of the estimated number of close to 750,000 South African born
emigrants in the 23 countries considered in this paper as of 2013.
0
100,000
200,000
300,000
400,000
500,000
600,000
700,000
800,000
2000
2001
2002
2003
2004
2005
2006
2007
2008
2009
2010
2011
2012
2013
Other 17 OECD countries
United Arab Emirates
Traditional 5 immigration countries
17
5. Conclusions
The official statistical data and the estimates in this paper show that the total stock of South
African born immigrants in the major 23 destination countries has reached a total of close to
750,000 persons in 2013. The numbers of South African born people overseas have continu-
ously increased between 2000 and 2010. From 2010 onwards, growth has been very slow, but
still positive. The traditional five immigration countries (United Kingdom, Australia, New Zea-
land, Canada and the United States) continue to absorb the majority of emigrants from South
Africa and host about three quarters of all the expatriates. The strict immigration laws in these
five countries favour highly skilled immigrants. This is also confirmed by the available data on
the skills composition of South African born immigrants in these countries.
Based on the findings in this paper, the following conclusions can be made:
A sizeable brain drain has taken place since 2000.
Five single countries absorb the bulk of highly skilled emigrants. Over 75% of all emi-
grants from South Africa have moved to one of the five traditional English-speaking
immigration countries.
The stock of South African born persons in these five countries has grown at a much
slower pace from 2010 onwards compared to the years before, suggesting that the
brain drain to these countries has slowed down, but not reversed.
The stock of South African born persons in the UAE and 17 other OECD countries
makes up less than 25% of the total number of South African born persons overseas.
In most of these 17 OECD countries as well as in the UAE, their numbers have been
growing continuously since 2000. However, growth appears to have slowed down from
2010 onwards too.
The skills composition of the emigrants from South Africa who moved to the UAE or to
one of the 17 other OECD countries is presumably less biased towards highly-skilled
persons than in the traditional five immigration countries.
With less than 25% of the emigrants from South Africa and a lower average skills level,
a reversal of the brain drain largely relies on the return migration from the five tradi-
tional immigration countries.
The analysis of the development of the number of persons who migrated from South Africa to a
total of 23 major migration destinations suggests that the brain drain has not reversed since
the onset of the global financial crisis in 2008. Empirical data available by early 2013 does not
corroborate the presumed reversal of the brain drain. The data does, however, provide some
empirical evidence that the brain drain has slowed down after 2010.
A slowing down of the brain drain is positive news for South Africa. The country has been ex-
periencing chronic shortages of skills in many sectors of the economy for quite some time.
While some of these shortages are sector-specific, others affect businesses in most sectors of
the economy and have severe consequences. The unavailability of a skilled workforce has of-
ten been highlighted as a key growth constraint. Together with other systemic constraints
(such as regulations and red tape), the lack of skills prevents companies from growing and
thereby thwarts efforts to jump-start economic growth and create jobs.
18
The demand for skilled labour has gradually increased over time and is bound to further in-
crease, while the supply of those skills has been lagging behind. The skills shortage not only
persists due to an increasing demand, but also because of an insufficient supply. The South
African education system has not produced sufficient numbers of highly skilled people locally
to meet the growing demand. As a consequence, many vacancies cannot be filled, while many
people remain unemployed as they lack the requisite skills to find a job in the formal economy.
The net emigration of highly skilled people (brain drain) has aggravated this shortage.
What is relevant in terms of the brain drain is the net balance (i.e. immigration minus emigra-
tion). Obviously, there are always people who come and at the same time some other people
leave. However, the latest South African census data identified only 82,801 South Africans
who had previously resided outside of the country and who had returned by 2008,3 while thou-
sands of people emigrate each single year. Moreover, as shown in this paper, a net increase
in the number of South African born persons overseas suggests that more people move to
these countries than leave. 4 It is therefore an illusion to assume that substantial numbers of
highly skilled South Africans have poured back into the country and thereby ease the skills
shortage significantly or even remove it.
In 2012, more than 829,000 unfilled vacancies for skilled people in the private sector were re-
ported (Adcorp, 2013). Based on World Bank data on the skills composition of emigrants from
South Africa, it can be inferred that as of 2013 almost 500,000 highly skilled persons were
living overseas – a significantly lower number than the number of unfilled vacancies in the
country. Return migration is therefore unlikely to solve the skills shortage challenge. Even if all
highly-skilled emigrants returned, a few hundred thousand vacancies in the country could still
not be filled.
The demand for skilled professionals will further increase as the South African economy further
develops. With a limited local supply to meet this demand, the obvious solution would be to
source the required skills from abroad. Immigration could in fact be used to help South Africa
in the achievements of its economic and developmental objectives. The skills shortage that
has been restricting the potential of the economy could be alleviated through the recruitment of
sufficient numbers of skilled immigrants.
Skilled labour is an important driver of economic growth, which is a prerequisite for sustainable
job creation for unskilled people and thus to tackle the high unemployment in the country.
South Africa is not the only country that experiences skills shortages and a brain drain. Even
many developed countries are faced with a brain drain through the emigration of their own
highly skilled, which is in general the most mobile population group. South Africa should take
more advantage of this international migration of the highly skilled. The country has so far pri-
marily participated in one side of migration, namely the emigration of its own talents (brain
drain). Increased participation in the other side of migration, namely the immigration of foreign
talents could balance the brain drain through an inflow of much needed skills (brain gain).
If South Africa unleashes the huge potential of skilled immigration (brain gain), it could not only
balance the brain drain, but even tap into a major driver of growth and job creation. Moreover,
the considerable (highly-skilled) expatriate population itself holds some potential for South Af-
3 Figure cited in Bisseker (2014).
4 The number of South African born persons overseas can only increase when new immigrants arrive. Children of these immigrants who are born in the country would obviously not be recorded as a person ‘born in South Africa’. On the other hand, decreases can be caused not only by a return migration, but also by deaths or by an onward migration (to another country).
19
rica that is still to be harnessed, even if those people do not return. 5 Although this paper has
shown that the brain drain has not reversed (as previous estimates suggested), there is no
time to dwell on this loss. While country appears to continue to lose some of its own talents
(as many other country do too), it could harness the international mobility of highly skilled peo-
ple much more to benefit from foreign skills, while also tapping into the potential that its own
expatriate population offers.
References
(1) Adcorp (2013). Adcorp Employment Index, March 2013. Release date: Wednesday, 10 April 2013. [online]. http://www.adcorp.co.za/NEws/Documents/Adcorp%20Employment%20Index%20-%20201304%20final.pdf (03/03/14)
(2) Adcorp (2014). Adcorp Employment Index, December 2013. Release date: Monday, 13 January 2014. [online]. http://www.adcorp.co.za/Industry/Documents/Adcorp%20Employment%20Index%20-%20201401.pdf (30/01/14)
(3) Bisseker, Claire (2014, January 23). Returning expatriates – South Africans return from abroad. [online]. http://www.financialmail.co.za/fm/2014/01/23/south-africans-return-from-abroad
(4) Borjas, George J. & Brent Bratsberg (1996). Who Leaves? The Outmigration of the Foreign-Born, Review of Economics and Statistics, Vol. 78(1), pp. 165–176.
(5) CBS (Central Bureau of Statistics, Israel) (2014). Population Census – 2008 Census, Tables. [online]. http://www.cbs.gov.il/census/?MIval=%2Fcensus%2Fpnimi_sub2_tables_e.html&id_topic=11&id_subtopic=2&id_subtopic2=1&Subject=1 (24/02/14)
(6) Docquier, Frédéric & Abdeslam Marfouk (2006). International Migration by Education Attainment, 1990–2000. In: Ç. Özden and M. Schiff (Eds.), International Migration, Remittances & the Brain Drain (pp. 151-199), Washington DC: World Bank.
(7) Hedley, Nick (2014, January 14). Expertise flows back into SA as brain drain is reversed. [online]. http://www.bdlive.co.za/national/labour/2014/01/14/expertise-flows-back-into-sa-as-brain-drain-is-reversed (12/02/14)
(8) Gerardy, Justine (2008). Welcome to South Africa's 10th province. [online]. http://www.iol.co.za/news/south-africa/welcome-to-south-africa-s-10th-province-1.385547#.Uwr1zzNWHmR (24/02/14)
(9) Grant Thornton (2013). Focus on: South Africa, International Business Report 2013 – Economy focus series. [online]. http://www.gt.co.za/files/IBR_2013-South_Africa_focus.pdf (06/02/14)
(10) Höppli, Thomas (2010). Auswanderung aus Hocheinkommensländern. Bamberg: Difo-Druck GmbH.
(11) Höppli, Thomas (2012). An Alternative Perspective on the Emigration of Highly Skilled People from South Africa. TIPS Policy Brief, February 2012. [online]. http://www.tips.org.za/paper/alternative-perspective-emigration-highly-skilled-people-south-africa (07/02/14)
(12) Höppli, Thomas (2014). The War on Talent – Shortages of Financial Skills in South Africa. Professional Accountant – the Official Journal of the South African Institute of Professional
(13) Höppli, Thomas & David Kaplan (2012). Skills: Out on the tide. Financial Mail, March 23, pp. 46-47 (compiled by Claire Bisseker).
(14) Kaplan, David, Jean-Baptiste Meyer & Mercy Brown (2000a). The Brain Drain: An Outline of Skilled Emigration from South Africa. Africa Insight, Vol. 30(2), pp. 41–47.
(15) Kaplan, David, Jean-Baptiste Meyer & Mercy Brown (2000b). Assessing the South African Brain Drain – A statistical comparison. DPRU Working Paper No 00/40. Development Policy Research Unit University of Cape Town
(16) Koehler, Robert (2008). South Africans on the Increase in Korea. [online]. http://www.rjkoehler.com/2008/12/15/south-africans-on-the-increase-in-korea/ (21/02/14)
(17) Massey, Douglas S., Joaquin Arango, Graeme Hugo, Ali Kouaouci, Adela Pellegrino & J. Edward Taylor (1998). Worlds in Motion – Understanding International Migration at the End of the Millennium. New York/Oxford: Oxford University Press.
(18) Nicholson, Zara (2014, January 20). Brain gain as expats come home. [online]. http://www.iol.co.za/news/south-africa/western-cape/brain-gain-as-expats-come-home-1.1633666#.Uwb0jjNWFMs (21/02/14)
(19) OECD (2005). Trends in International Migration (SOPEMI 2004 Edition), Paris: OECD.
(20) OECD (2014). International Migration Database. Stock of foreign-born population by country of birth. [online]. http://stats.oecd.org/Index.aspx?DataSetCode=MIG (18/02/14)
(21) Phampi, Abu (2013). UAE MythBuster #3: UAE’s population pie. [online]. http://abuphampi.wordpress.com/2013/01/18/uae-mythbusters-3-uaes-population-pie-only-in-abuphampi-english/ (23/02/14)
(22) SABC (2014, January 16). Brain drain shows signs of reverse. [online]. http://www.sabc.co.za/news/a/cc9625004293f47da140fb56d5ffbd92/Brain-drain-shows-signs-of-reverse-20140116 (12/02/14)
(23) sagoodnews (2008). Reeling them in from Dubai. [online]. http://www.sagoodnews.co.za/employment/reeling_them_in_from_dubai.html (24/02/14)
(24) UAE National Bureau of Statistics (2010). Methodology of estimating the population in UAE. [Online]. http://www.uaestatistics.gov.ae/ReportPDF/Population%20Estimates%202006%20-%202010.pdf (24/02/14).
(25) United Nations – Department of Economic and Social Affairs (2013). Trends in International Migrant Stock: The 2013 revision (United Nations database, POP/DB/MIG/Stock/Rev.2013). [Online]. http://esa.un.org/unmigration/TIMSA2013/migrantstocks2013.htm?mtotals (24/02/14).
(26) World Bank (2004). The Brain Drain Database. (compiled by Frédéric Docquier and Abdeslam Marfouk). [Online]. http://go.worldbank.org/9YZ0EKSMT0 (18/02/14).