68
Mark Drayson University of Birmingham New guidelines for MGUS Update on MRC Myeloma Trials

Mark Drayson
University of Birmingham
New guidelines for MGUS
Update on MRC Myeloma Trials

UK Myeloma Forum (UKMF)
Robert Beetham, Judith Behrens, Jenny Bird, Mark Drayson, Shirley D’Sa,
Richard Soutar
Nordic Myeloma Study Group (NMSG)
Jan Westin, Ingemar Turesson, Anders Waage, Nina Gulbrandsen, Henrik
Gregerson
Myeloma UK (patient advocate group)
Mr Eric Low
UK Nordic Guidelines on MGUS
Monoclonal Gammopathy of Undetermined Significance

Levels of evidence
Ia Evidence obtained from meta-analysis of randomised
controlled trials
Ib Evidence obtained from at least one randomised
controlled trial
IIa Evidence obtained from at least one well-designed,
non-randomised study, including phase II trials and
case-control studies
IIb Evidence obtained from at least one other type of
well-designed, quasi-experimental study, i.e. studies
without planned intervention, including observational
studies
III Evidence obtained from well-designed, non-
experimental descriptive studies
Evidence obtained from meta-analysis or randomised
controlled trials or phase II studies which is published
only in abstract form
IV Evidence obtained from expert committee reports or
opinions and/or clinical experience of respected
authorities
Evidence based on
observational studies
Epidemiology
Prognosis
Establishing diagnosis
Monitoring
MGUS does not
require therapy

An M-protein (or paraprotein) is monoclonal immunoglobulin
secreted by an abnormally expanded clone of plasma cells
in an amount that can be visualised by immunofixation
of serum and/or urine.
M-proteins can be whole (heavy and light chain)
or just free light chain immunoglobulin.

Types of plasma cells
Spleen and lymph nodes / secrete IgM
Waldenstroms macroglobulinaemia
2) Bone marrow / secrete IgG, IgA
Multiple myeloma
Mucosal plasma cells secrete IgA
Malignancy is rare

Neoplastic expansions of plasma cells may cause damage:
By what their M-protein does
By other secretions or actions of the neoplastic clone
Diseases caused by M-protein aggregation
Light chain-cast nephropathy
AL amyloidosis
Light chain-deposition disease
Crystal-storing histiocytosis: adult Fanconi syndrome
Cryoglobulinemia type I
Diseases caused by M-protein antibody activity
Mixed cryoglobulinemia type II
Monoclonal cold agglutinins
Polyneuropathies

Plasma cell dyscrasias
(neoplastic clonal plasma cell expansions) include:
MGUS
AL amyloidosis
Solitary plasmacytoma (skeletal or extra-medullary)
Multiple myeloma
Waldenstrom's macroglobulinaemia other
B cell lymphoma / lymphoproliferative disorder

M-protein in serum <30g/l
Bone marrow plasma cells <10% and low level
infiltration in trephine biopsy
No evidence of other B-cell proliferative disorder
No related organ or tissue impairment
Criteria for the classification of monoclonal gammopathies, multiple
myeloma and related disorders
International Myeloma Working Group B. J Haem 2003, 121 749-757
Definition of MGUS
Monoclonal gammopathy of uncertain significance

Myeloma related organ or tissue impairment (ROTI)
C calcium >0.25mmol/l above normal / >2.75mmol/l
R renal impairment attributable to myeloma
A anaemia 2g/dl below normal or <10g/dl
B bone lesions lytic or osteoporosis with compression fracture
O other symptomatic hyperviscosity, amyloidosis,
recurrent bacterial infection
-

Epidemiology of MGUS
N Engl J Med 2006;354:1362-9.
Normal Minnesota population 21,463 people >50yrs
694 MGUS (2.3%) Age 50s 1 - 2%
Male 3.7% 60s 2 - 4%
Female 2.9% 70s 4 - 5%
Black x2 whites
69% IgG, 17% IgM, 11% IgA and 3% biclonal
<10g/l 63.5% 30% have immunoparesis
10 - 1.49g/l 16.6% 20% have urinary flc
15 – 19.9 15.4%
20+ g/l 4.5%

Epidemiology of M-proteins
Prevalence >65 yrs age
MGUS 5%
Myeloma 0.1%
Other <0.1%

New M-proteins in a Hospital Laboratory
Mayo Malmo St Helier
Diagnosis (1510) (930) (200)
MGUS 51% 72% 74%
Myeloma 24% 19% 16%
WM 3% 2% 2%
AL 11% 1% 1%
Other 11% 6% 7%

Prognosis of MGUS
1384 MGUS patients 11,009 years follow up 1960 – 1994
115 progressed – Disease specific RR
75 Myeloma 25
7 Waldenstroms 46
19 lymphoma 2
10 primary amyloid 8
3 CLL 0.9
1 plasmacytoma 8.5
Overall risk of progression 1% per year
The risk remains even after 25 years
A long-term study of prognosis in monoclonal gammopathy of undetermined
significance.
N Engl J Med. 2002 Feb 21;346(8):564-9.

1324 Danish patients with MGUS
Danish death registry North Jutland 1978 - 1993
7785 patient years follow up
868 deaths -409.6 expected
107 cases malignant transformation (6 expected)
76% of that increased risk was not attributable to
malignant transformation and occurred in first 4
years
2001 British Journal of Haematology 112: 353±357


Prognostic indicators for
malignant transformation of MGUS
IgA and IgM have a higher risk of progression
Paraprotein level 20 year risk of progression to disease:-
5g/l 14%
10g/l 16%
15g/l 25%
20g/l 41%
25g/l 49%
Bone marrow plasmacytosis >5%
% aberrant plasma cells >95%
Bone marrow angiogenesis
Plasma cells in the blood

Abnormal serum free light chain ratio
1148 Mayo patients with MGUS – 87 progressed in a
median follow up of 15 years
Multivariate Analysis of Prognostic Factors
Prognostic factor Hazard ratio (95%confidence interval) p value
Abnormal FLC ratio 2.6 (1.7 - 4.2) <0.001
Serum M protein size 2.4 (1.7 - 3.5) <0.001
IgA, IgM, 2.6 (1.7 - 4.0) <0.001
379 (33%) had an abnormal ratio
and their relative risk of
progression was higher than those
with normal ratios
500
50
5.0
0.5
0.01 0.1 0.26 1.65 10 100
free light chain ratio

Risk Group No. of patients Relative risk (95%CI) Absolute risk of accounting
progression at 20 for death
years as competing
risk at 20 yr s
Low-risk 449 1 5% 2%
Low-Intermediate-risk
(Any 1 factor abnormal) 420 5.4 21% 10%
High-Intermediate-risk
Any 2 factors abnormal) 226 10.1 37% 18%
High-risk
(All 3 factors abnormal) 53 20.8 58% 27%
Risk stratification model incorporating all 3 predictive factors
(Serum M protein <15g/l), IgG subtype, normal FLC ratio (0.26-1.65)

IgG PP < 15g/l
IgA PP < 10g/l
Asymptomatic
No other abnormal results
BJP pos or neg
Uninvolved Igs low or normal
Symptomatic / physical signs suggestive
of underlying treatable B lineage disorder
Unexplained abnormal investigation results
(blood or X-ray)
IgG PP > 15g/l
IgA PP > 10g/l
FLC >0.5 g/l urine 500mg/l serum
Any IgD or IgE paraprotein
Distant follow up:
Supply GP & patient with info leaflet
Repeat blood tests 3 monthly initially
Review if abnormality or symptoms arise
Out Patient assessment
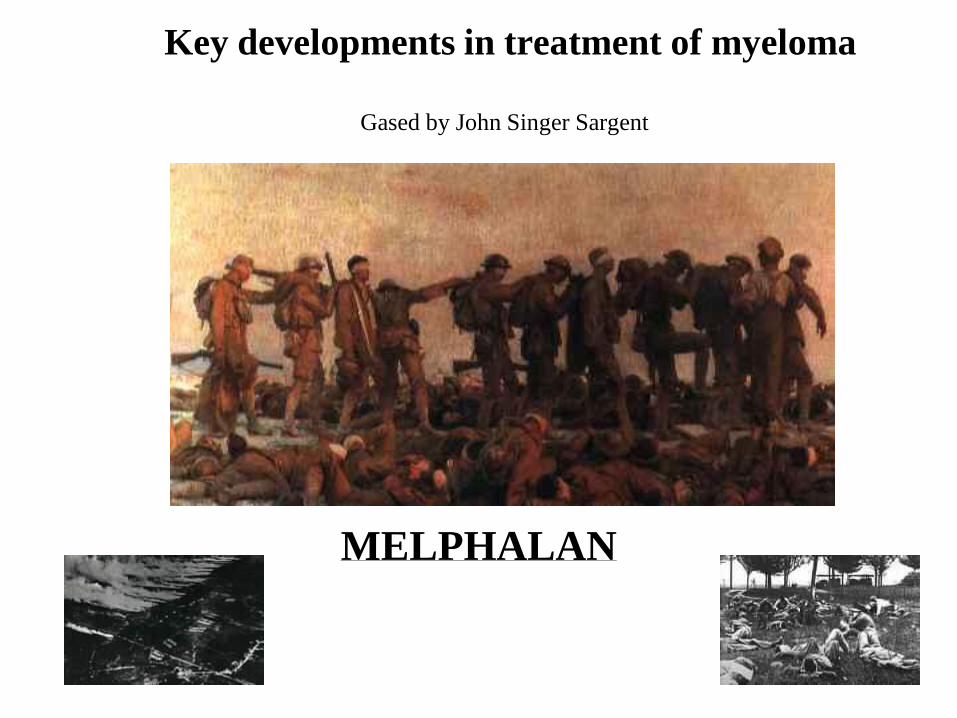
Key developments in treatment of myeloma
MELPHALAN
Gased by John Singer Sargent

1958 melphalan
1964 - 68 cyclophosphamide versus melphalan 276 nd
1968 - 75 intermittent melphalan +/- P or cyclo 372 nd
1975- 78 MP vs 3wkly cylco + maintenance 353 nd
1980 – 82 MP vs MVP + maintenance 532 nd
1982 – 86 M7 vs ABCM 691 sd
1986 – 91 ABCM vs ABCMP 1011 nd
1993 – 02 ABCM vs Cweekly 468 nd
1993 – 00 ABCM vs Intensive 405 sd
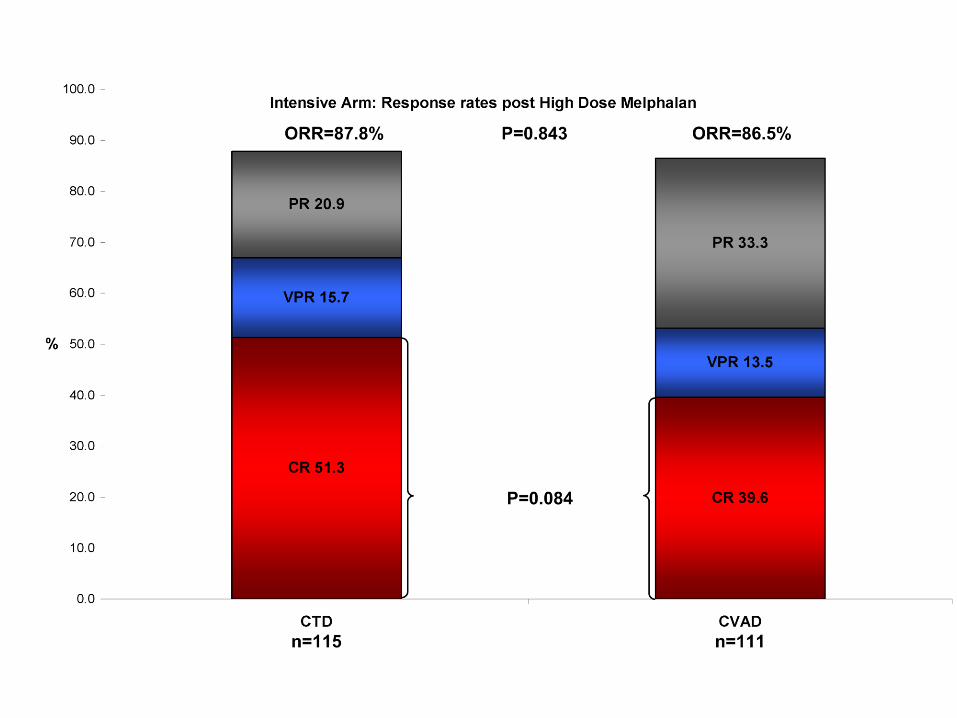
2002 - MP vs CTDa / CVAD vs CTD 1871 ip
UK MRC Myelomatosis trials

Overall survival with conventional chemotherapy
In patients randomised to receive ABCM based therapy in
MRC Vth and VIth myeloma trials
428 patients were aged >65
571 patients were aged <65
651 patients reached plateau
348 patients did not reach plateauOverall survival by age
and by plateau status
0
25
50
75
100
0 1 2 3 4 5 6 7 8 9 10
Years from entry to trial
% a
liv
e
>65 years
< 65 years
<65 years >65 years
No plateau 7.9 (6.2-9.0) 3.8 (2.6-4.9)
Plateau 51.4 (47.2-55.8) 45.0 41.4-49.1)
Median survival (95% CI) in months
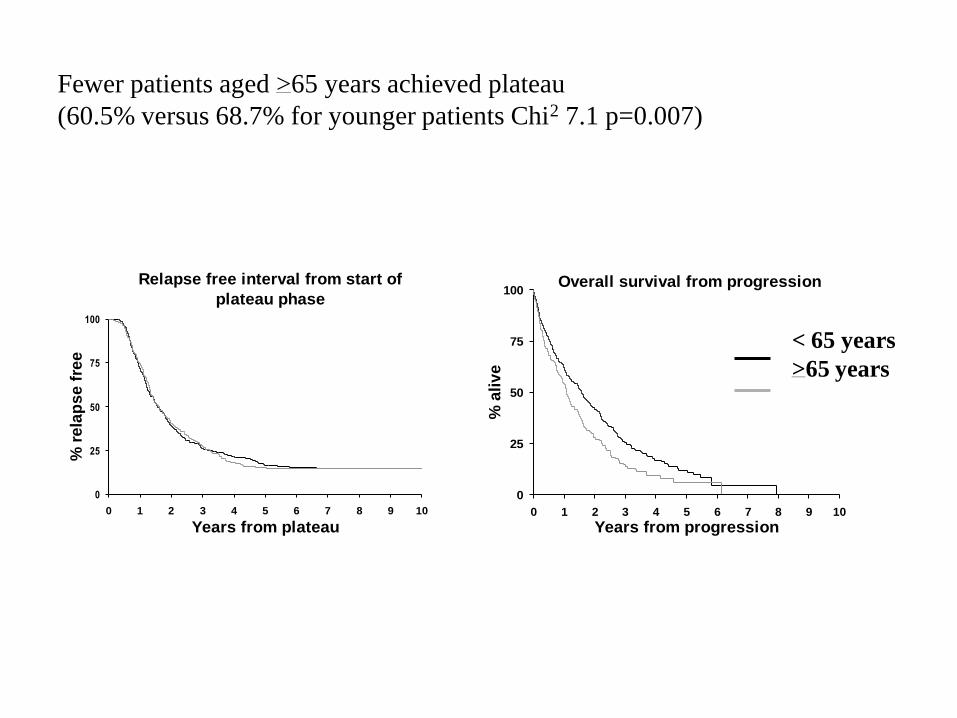
Fewer patients aged >65 years achieved plateau
(60.5% versus 68.7% for younger patients Chi2 7.1 p=0.007)
Relapse free interval from start of
plateau phase
0
25
50
75
100
0 1 2 3 4 5 6 7 8 9 10
Years from plateau
% r
ela
ps
e f
ree
< 65 years
>65 years
Overall survival from progression
0
25
50
75
100
0 1 2 3 4 5 6 7 8 9 10
Years from progression
% a
liv
e

0
10
20
30
40
50
60
70
80
90
100
compl partial stable
MRC responseCompl P3A P3B P3C stable
SWOG response
75% Median 25% survival
95 80 62 percentage achieving plateau
Su
rviv
al in
mo
nth
s
Achievement of plateau phase and survival from entry stratified by response
M-protein Response
Percentage patients reaching plateau

Overall survival by response for 999 ABCM patients
0
25
50
75
100
0 2 4 6 8 10 12
Years from entry to trial
% a
liv
e
CR
PR
STABLE
c2=1.15, P=0.56
89
552
133

Response percent of all patients
Complete 9
Partial 55
Stable 13
Non-secretor 2
Progression ab initio 2
Trial deviation 5
No data 2
Death <90 days 12
100
M-protein Response

Response percent of all patients
Complete 9
Partial 55
Stable 13
Non-secretor 2
Progression ab initio 2
Trial deviation 5
No data 2
Death <90 days 12
100
Can we reduce the proportion of patients who do not survive
long enough to reap the benefits of anti-tumour therapy?
M-protein Response

Deaths within 60 days of entry to MRC myeloma IVth – VIIIth trials
Trial Total Age (yrs) Trial dates Induction
Treatment
No
pts
Total
early
death
early
Deaths %
all pts
IVth 532 <80 1980-1982 MP
MPV
264
268
37
28 12
Vth 691 <75 1982-1986 C-weekly -plts
<80
M7
ABCM
61
316
314
8
44
33 12
VIth 712
299
<75
<75
1986-1991
1991-1993
HDM (M140)
HDMP
ABCM
ABCM-P
NR ABCM
15
13
342
342
299
3
1
30
39
159
VIIth 405 <66 1993-2000 ABCM
C-VAMP
202
203
8
9 4
VIIIth 468 >65 or
<65 if HDT
contraindicated
1993-2002 ABCM to plateau
ABCM X3 then
C-weekly
NR
125
119
224
0
0
44 9
Total 3107 3107 299 10
0
10
20
30
40
50
60
70
80
90
100
Nu
mb
er
of
pati
en
ts
Pneum
onia
Other
infe
ctio
n
Renal
failu
re
Vascu
lar
Sudde
n de
ath
Cardi
ac fa
ilure
Bleed
Pulm
onary
Em
bolu
s
Skelet
al ev
ent
Other
Treat
men
t with
drawn
No Info
rmat
ion
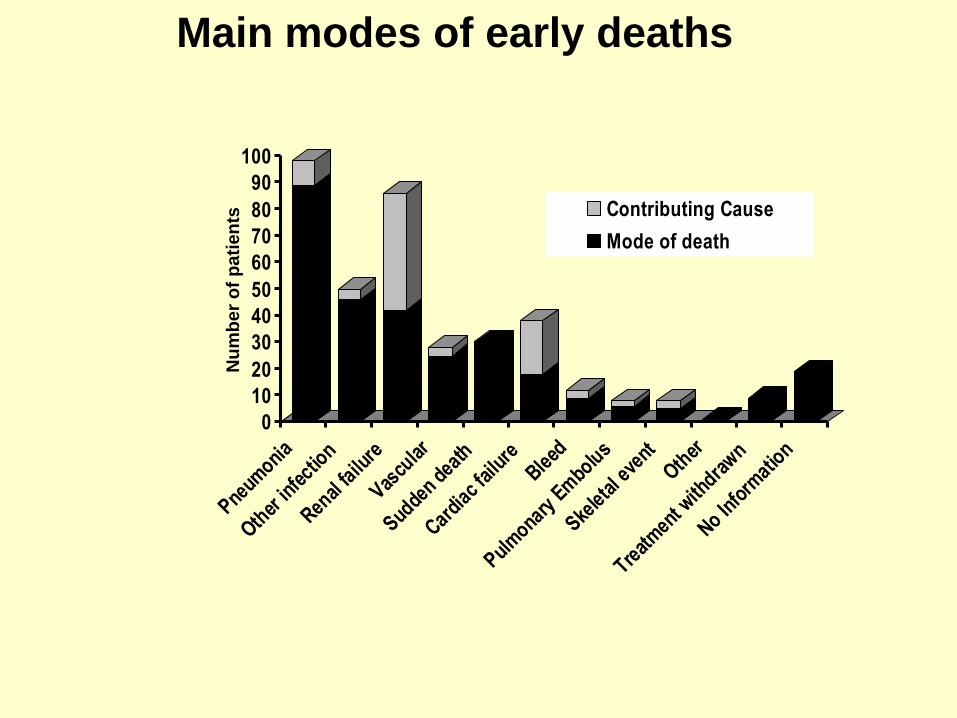
Contributing Cause
Mode of death
Main modes of early deaths

0
10
20
30
40
50
60
70
80
90
100
Nu
mb
er
of
pati
en
ts
Pneum
onia
Other
infe
ctio
n
Renal
failu
re
Vascu
lar
Sudde
n de
ath
Cardi
ac fa
ilure
Bleed
Pulm
onary
Em
bolu
s
Skelet
al ev
ent
Other
Treat
men
t with
drawn
No Info
rmat
ion
Contributing Cause
Mode of death
Main modes of early deaths
Infection
8% neuts <2.0 x 10⁹/l
15% neuts 2 - 3 x 10⁹/l
1/3 developed at home with delay to hospital in ½
Iv IgG replacement trial nd ?antibiotic prophylaxis

0
10
20
30
40
50
60
70
80
90
100
Nu
mb
er
of
pati
en
ts
Pneum
onia
Other
infe
ctio
n
Renal
failu
re
Vascu
lar
Sudde
n de
ath
Cardi
ac fa
ilure
Bleed
Pulm
onary
Em
bolu
s
Skelet
al ev
ent
Other
Treat
men
t with
drawn
No Info
rmat
ion
Contributing Cause
Mode of death
Main modes of early deaths
Renal failure
½ FLC, ¾ hyper Ca
¼ presented with Cr <200
NSAIDs, post chemo dehydration
MERIT trial

Factor Grouping Patients
surviving >60
days (n=2809)
Early death
pts (n=299)
p
n % n %
Age <65 1650 59 118 7.1 <0.0001
651157 41 176 15.2
Performance
status
Asymptomatic 267 12 10 3.7 <0.0001
Minimal symptoms 856 38 52 6.1
Restricted activity
/ bedridden
1099 50 204 18.6
S2M 4637 28 29 4.6 <0.0001
4-8 947 41 64 6.8
>8 713 31 171 24.0
Predicting early deaths
Best model sensitivity 67%
specificity 69%J Clin Oncol 2005

MRC 1980 – 1997 so minimum of 7.5 yrs follow up
Melphalan - 845 pts ABCM - 1622 pts
1372 (54%) achieved stable plateau phase
Overall median survival 3.9 yrs
Median survival from relapse 1.2yrs
Duration of plateau <1yr 423 (37%)
1 – 3yrs 567 (49%)
>3yrs 161 (14%)
(no progression or non-myeloma death 221)

0
25
50
75
100
0 1 2 3 4 5 6 7 8 9 10
Years from Progression
% A
live >3 yrs
1-3 yrs
<1 yr
No at risk:
>3 yrs 161 104 69 47 37 25 16 12 9 8 5
1-3 yrs 567 338 209 129 73 49 23 17 9 5 2
<1 yr 423 200 106 57 34 18 13 6 3 2 2
c2=44.73, p<0.0001
Survival following relapse for patients with plateau durations of:
< 1year, 1-3 Years and > 3 Years

1st 2nd 3rd Overall survivalfrom 1st relapse
Duration of plateau
Tim
e in
yea
rs
1st 2nd 3rd Overall survivalfrom 1st relapse
Duration of plateau
Tim
e in
yea
rs
Cases Controls Controls ControlsDuration Overall survival
Time to plateau of 1st from 1st relapseplateau
Tim
e in
yea
rs
Cases Controls Controls ControlsDuration Overall survival
Time to plateau of 1st from 1st relapseplateau
Tim
e in
yea
rs
Cases only Cases & controls
Plateau duration, time to plateau and survival
following relapse for:
cases - 225 patients survived >7.5yrs
controls – 225 shortest lived patients
56%
37%

0
25
50
75
100
0 1 2 3 4 5 6 7 8 9 10
Years from Progression
% A
live
Melphalan
ABCM
VAD
Cyclophosphamide
No at risk:
ABCM 176 123 73 42 27 16 11 6 3 3 1
Cyclo 124 69 41 24 13 10 6 2 2 2 2
Melph 212 149 95 64 47 31 10 10 7 4 4
VAD 100 60 28 18 14 10 7 5 2 2 2
c2=10.07, p=0.02
Non-randomised second line treatment
For 612 patients (45% of total) second line treatment was known

Same versus different second line treatment
0
25
50
75
100
0 1 2 3 4 5 6 7 8 9 10
Years from Progression
% A
live 1st trt same as 2nd trt
1st trt different from 2nd trt
No at risk:
Same 232 168 102 67 45 29 17 12 8 5 4
Different 370 227 131 80 55 38 16 11 5 5 4
c2=8.03, p=0.005
Stratified for beta-2 microglobulin c2= 7.85 p = 0.005
Stratified for duration of plateau c2= 4.45 p = 0.04

The clodronate trial showed:
Reduced morbidity from skeletal disease
Patients (155) without overt skeletal disease at presentation
appeared to benefit more than patients with fractures at presentation
No overall survival benefit
Overall survival by treatment
0
25
50
75
100
0 2 4 6 8 10 12Years from entry to trial
% a
liv
e
CLODRONATE
PLACEBO
c2=0.94, P=0.33
Overall survival by treatment for those patients presenting with no fractures
0
25
50
75
100
0 2 4 6 8 10 12Years from entry to trial
% a
live
CLODRONATE
PLACEBO
c2=8.24, P=0.004
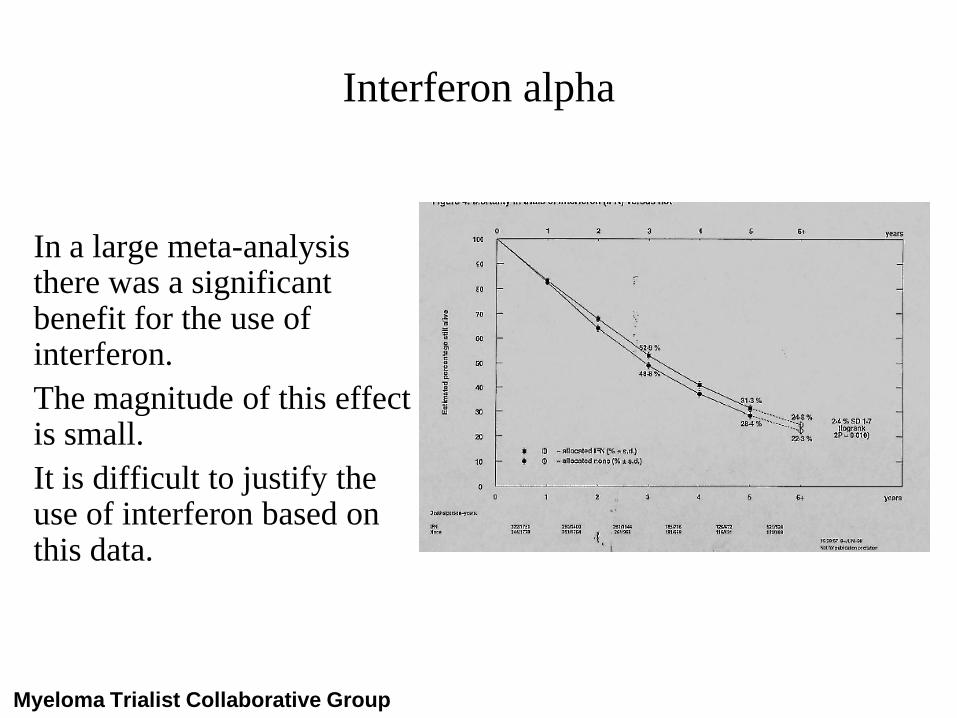
Interferon alpha
Myeloma Trialist Collaborative Group
In a large meta-analysis there was a significant benefit for the use of interferon.
The magnitude of this effect is small.
It is difficult to justify the use of interferon based on this data.


mean 8.36 (Range 3.3 - 19.4)
mean 13.43 (Range 5.71 - 26.3)
/ ratio Mean 0.63 (Range 0.26 - 1.65)
Serum Free Light Chains – Normal Ranges (mg/L)
The serum flc ratio becomes abnormal at much
lower levels of malignant flc secretion than are required
to overcome renal tubular reabsorption

Non-secretory myeloma (no M-protein detectable in serum
or urine by immunofixation)
64 of 2323 patients from MRC Trials 1983 – 1999
had Non-secretory myeloma (3.6%). 28 cases studied.
Blood 2001 97, 9: 2900 – 2902
Serum flc ratio more sensitive than Bence Jones protein in urine

1
10
100
1000
10000
Seru
m f
ree l
igh
t ch
ain
co
ncen
trati
on
s (
mg
/L)
Normal
range
12 elevated free
and increased
/ ratio
7 elevated free
with reduced /
ratio
4 suppression
of either /
or both flc
5 / normal or
borderline and
normal / ratio
Serum free light chain results for 28 cases of nonsecretory myeloma

1
10
100
1000
10000
0 1 2 3 4
Se
rum
fre
e lig
ht
ch
ain
co
nc
en
tra
tio
ns
(m
g/L
)
PlateauPresentation Relapse
Kappa NR
Lambda NR
2
5
4
18
10
11
Changes in serum flc concentrations and clinical status in
patients with nonsecretory myeloma.

MRC trials 1983 – 1999 (13% of all patients)
Kappa FLC only – 122 patients
Lambda FLC only – 103 patients
In all 225 cases serum flc measurements identified
the abnormal production of flc.
LANCET 2003 361 489 - 490
Free light chain only myeloma
(No whole M-protein in serum. FLC in urine)

Advantages of measuring flc in serum
Malignant flc production must exceed renal threshold for
reabsorption before flc become detectable in urine
At time of diagnosis of these 225 patients:-
>60% significant renal morbidity
>60% significant skeletal morbidity
Could wider use of serum flc assays enable earlier diagnosis
Patient with FLC in urine but urine not sent to the
laboratory
False impression of complete remission
Using urine flc assays 26 patients (32%) achieved CR
Using serum flc assays 9 patients (11%) achieved CR
Earlier diagnosis of relapse


Myeloma, free light chains and renal failure
Co-incident pre-existing renal disease
hypercalcaemia
infection / dehydration
Causal histology
Urinary flc/24 hours Percentage patients with renal failure
None 2%
<8 grams 9%
8 – 24 grams 29%
> 24 grams 49% (2362 patients)

SERUM FREE LIGHT CHAIN LEVELS AT ENTRY TO TRIAL
0 1 2 3 4 5
1e-1
1e+0
1e+1
1e+2
1e+3
1e+4
1e+5
1e+6
29 patients
monoclonal kappa
polyclonal lambda
(mk / pl) flc
32 patients
monoclonal lambda
polyclonal kappa
(ml / pk) flc
SE
RU
M F
RE
E L
IGH
T C
HA
IN L
EV
EL
S
1 mg/l
10 mg/l
100 mg/l
1 G/l
10 G/l
100 G/lmk
pl
pk
ml
Norm
al
ran
ge
MERIT
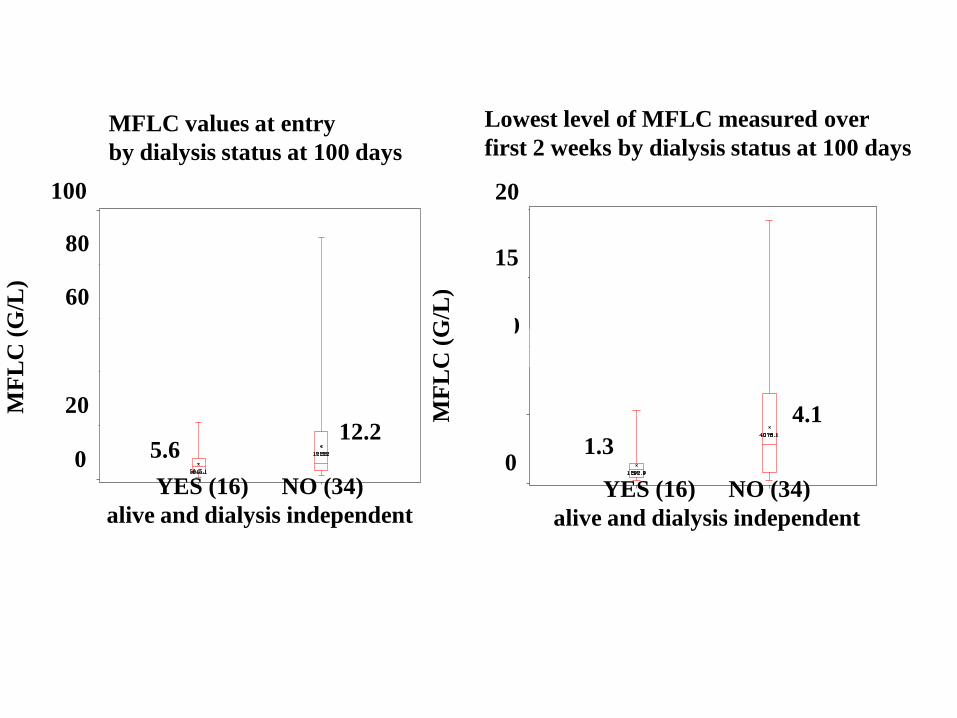
MFLC values at entry
by dialysis status at 100 days
YES (16) NO (34)
alive and dialysis independent
20
40
60
80
100
5.612.2
MF
LC
(G
/L)
YES (16) NO (34)
alive and dialysis independent
Lowest level of MFLC measured over
first 2 weeks by dialysis status at 100 days
5 5
10
15
20
00M
FL
C (
G/L
)1.3
4.1

Serum free light chains
Grams / l
Malignant plasma cells
FLC production
Renal excretion
Grams / litre

Serum free light chains
Grams / l
Malignant plasma cells
FLC production
dexamethasone
Renal excretion
Grams / litre
Plasma exchange 7 x 3 litres
For half of these patients
17 – 587 grams removed
Renal
failure

Non-intensive
therapy
Med survival 2 – 3 years
Melphalan
Cyclophosphamide
Combination eg. ABCM
Key developments
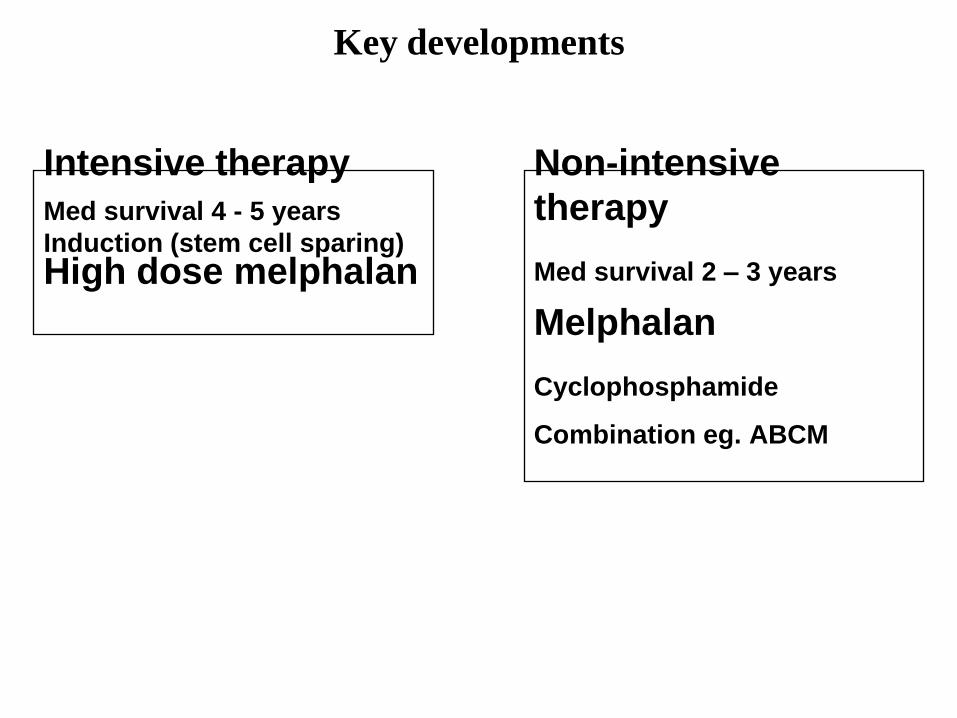
Non-intensive
therapy
Med survival 2 – 3 years
Melphalan
Cyclophosphamide
Combination eg. ABCM
Intensive therapy
Med survival 4 - 5 years
Induction (stem cell sparing)
High dose melphalan
Key developments
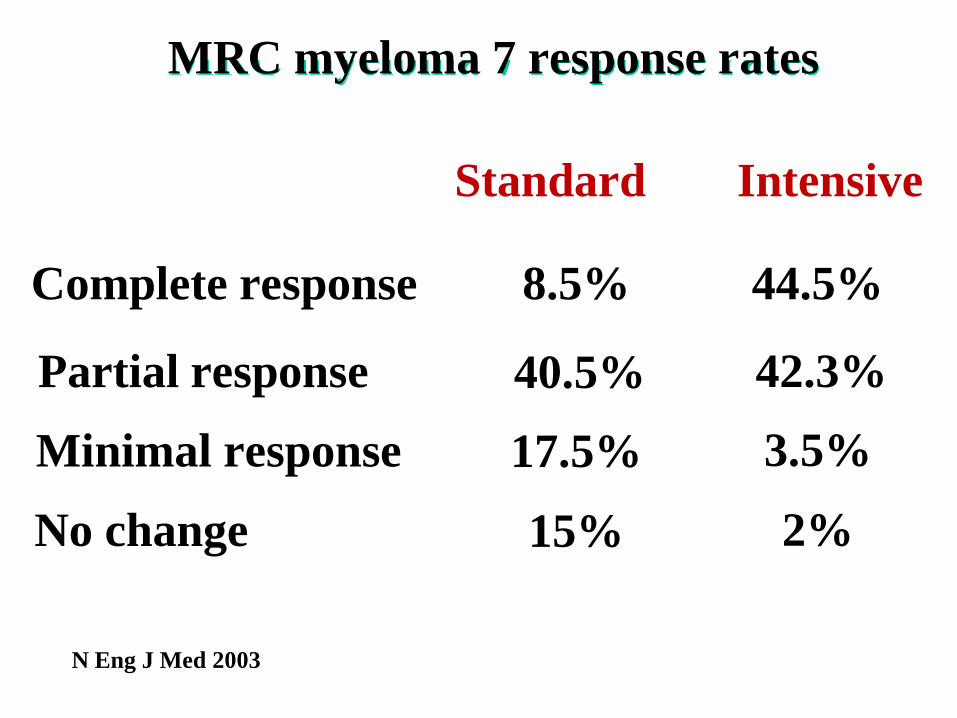
8.5%
40.5%
17.5%
15%
Standard
44.5%
42.3%
3.5%
2%
Intensive
Complete response
Partial response
Minimal response
No change
MRC myeloma 7 response rates
N Eng J Med 2003

MRC VII; Progression-free Survival
Excluded MRC Myeloma V

Overall Survival - ITT

Overall Survival: 2m >8mg/l
27 trials with 6633 patients
Excluded MRC Myeloma V

Non-intensive
therapy
Med survival 2 – 3 years
Melphalan
Cyclophosphamide
Combination eg. ABCM
Intensive therapy
Med survival 4 - 5 years
Induction (stem cell sparing)
High dose melphalan
Key developments
Mortality statistics for England and Wales.
Deaths attributed to multiple myeloma
0
2
4
6
8
10
12
14
16
18
20
<45
45-4
9
50-5
4
55-5
9
60-6
4
65-6
9
70-7
4
75-7
9
80-8
4
85-8
990
+
Age Cohort (years)
1988 -
97 d
eath
s i
n a
ge c
oh
ort
as
perc
en
tag
e t
ota
l 21,2
57 d
eath
s
Age %
<45 1.0
45-54 5.0
55-64 15.4
65-74 31.6
75+ 47.0
Intensive Non-intensive
Therapeutic dichotomy
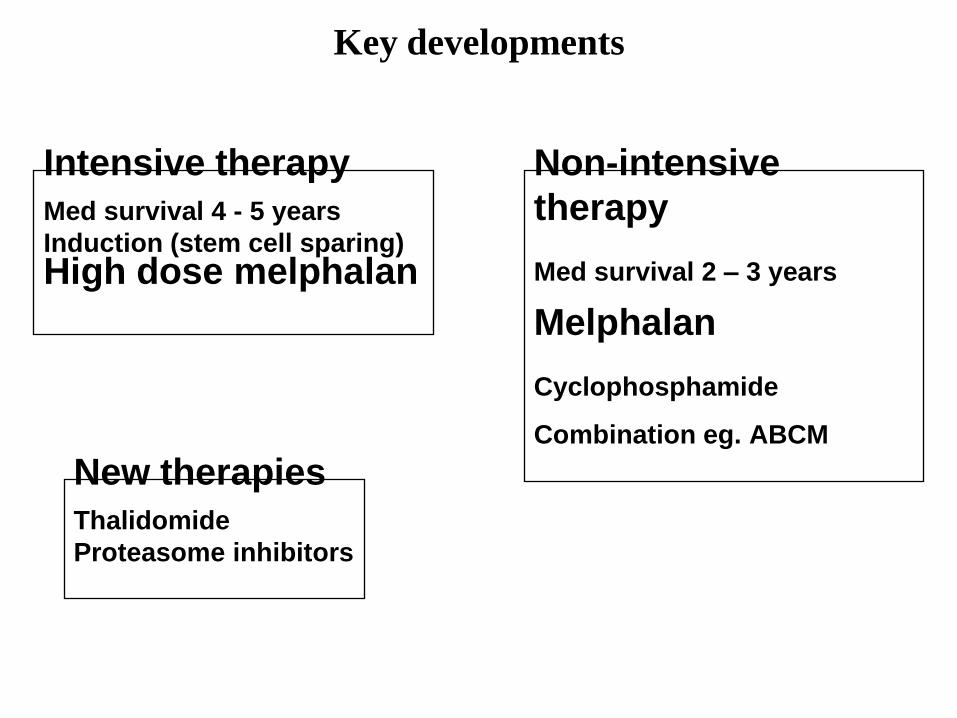
Non-intensive
therapy
Med survival 2 – 3 years
Melphalan
Cyclophosphamide
Combination eg. ABCM
Intensive therapy
Med survival 4 - 5 years
Induction (stem cell sparing)
High dose melphalan
Key developments
New therapies
Thalidomide
Proteasome inhibitors

C-VAD
4-6 courses
C-TD
4-6 courses
Bisphosphonate:
Randomise
Clodronate Zoledronate
Thalidomide No ThalidomideMaintenance:
Randomise
HDM200
+
PBSCT (autograft)
Myeloma IX Intensive pathway
VS
VS
VS
Chemotherapy:

Myeloma IX Recruitment - Initial Randomisation
(Intensive pathway)
13
5
9
22
151516
1918
24
2628
26
30
24
26
22
2628
2524
25
37
25
20
2424
32
18
2525
15
3735
31
25
19
25
38
26
29
26
2222
17
9
24
19
8
1114 1080
0
5
10
15
20
25
30
35
40
May-0
3
Aug-0
3
Nov-0
3
Feb-0
4
May-0
4
Aug-0
4
Nov-0
4
Feb-0
5
May-0
5
Aug-0
5
Nov-0
5
Feb-0
6
May-0
6
Aug-0
6
Nov-0
6
Feb-0
7
May-0
7
Aug-0
7
Nov-0
7
Feb-0
8
May-0
8
Mo
nth
ly a
ccru
al
0
200
400
600
800
1000
1200
Cu
mu
lati
ve a
ccru
al
Thalidomide randomisation = 405 patients

MP CTDa
Bisphosphonate:
Randomise
Clodronate Zoledronate
Thalidomide No ThalidomideMaintenance:
Randomise
VS
VS
VS
Myeloma IX Non-Intensive pathway
Chemotherapy:

Myeloma IX Recruitment
(Initial randomisation - Non-intensive pathway)
0
42
4
1516
1113
20
26
23
1315
17
21
18
12
20
13
10
16
2625
19
24
16
2119
1615
17
2321
23
18
14
21
12
24
16
12
6
1818
4
9
19
11
1816
790
850
0
5
10
15
20
25
30
35
40M
ay-0
3
Au
g-0
3
No
v-0
3
Fe
b-0
4
Ma
y-0
4
Au
g-0
4
No
v-0
4
Fe
b-0
5
Ma
y-0
5
Au
g-0
5
No
v-0
5
Fe
b-0
6
Ma
y-0
6
Au
g-0
6
No
v-0
6
Fe
b-0
7
Ma
y-0
7
Au
g-0
7
No
v-0
7
Fe
b-0
8
Ma
y-0
8
Mo
nth
ly a
ccru
al
0
100
200
300
400
500
600
700
800
900
1000
Cu
mu
lati
ve a
ccru
al
Thalidomide randomisation = 265 patients


Myeloma IX Laboratory studies
Prospective study of utility of serum flc
Non-secretory / Crypto-secretory (50 patients)
Light chain only (300 patients)
Early indicator of response and relapse
Minimal Residual Disease
Flowcytometry and sflc
Prognostic markers
Sol CD40, CD80, CD138
Cytogenetics and FISH studies
Inherited SNPs and copy number variation
Selected myeloma cells Affymetrix U135 Plus 2.0 expression arrays
Myeloma XI (results for IX, running costs, drug costs)
ACKNOWLEDGEMENTS


