1 Institute for the Study of Earth, Oceans, and Space, UNH 2 Whittemore School of Business and Economics, UNH The New Hampshire Climate Change Policy Task Force New Hampshire Climate Action Plan A Plan for New Hampshire’s Energy, Environmental and Economic Development Future Appendix 7.1: Residential, Commercial, and Industrial Carbon Emissions and Economic Modeling: Approach and Assumptions Prepared by: Cameron Wake 1 , Matt Frades 1 , George Hurtt 1 , Matt Magnusson 2 , and Ross Gittell 2 March 2009
Transcript
1 Institute for the Study of Earth, Oceans, and Space, UNH
2 Whittemore School of Business and Economics, UNH
The New Hampshire Climate Change Policy Task Force
New Hampshire Climate Action Plan
A Plan for New Hampshire’s Energy, Environmental and Economic Development Future
Appendix 7.1:
Residential, Commercial, and Industrial
Carbon Emissions and Economic Modeling: Approach and Assumptions
Prepared by: Cameron Wake1, Matt Frades1, George Hurtt1, Matt Magnusson2, and Ross Gittell2
March 2009
NH Climate Change Policy Task Force Carbon Emissions and Economic Modeling: Approach and Assumptions
RCI Carbon Emissions and Economic Modeling: CSNE Approach and Assumptions 2 March 2009
NH Climate Change Policy Task Force Carbon Emissions and Economic Modeling: Approach and Assumptions
RCI Carbon Emissions and Economic Modeling: CSNE Approach and Assumptions 3 March 2009
Introduction This document details the approach taken and the assumptions made in order to provide emissions and economic analyses of potential Actions proposed by the Working Groups and the Task Force. The results of the analyses are presented separately in the Analysis Results table. Detailed descriptions of the potential Actions are presented in the Action Reports produced by the Working Groups.
Total State Emissions Business-as-Usual Model: The business-as-usual New Hampshire fossil fuel greenhouse gas emissions by sector were projected out to 2050 by extrapolating historical emissions data. Linear extrapolations of 1990-2005 emissions data1 were used to project emissions in the Transportation, Residential, Commercial, and Industrial sectors. Emissions in the Electricity Generation sector were calculated differently because the historical New Hampshire emissions record is punctuated by large fluctuations due to the expansion and retirement of major generation plants. Linear extrapolation of total New England generation was extrapolated, and future New Hampshire generation was projected based on the assumption that New Hampshire will continue to contribute 17.3% of New England generation. Projected emissions were calculated based on the assumption that all future expansion of New Hampshire generation capacity is provided by natural gas plants.
Carbon Emissions Model: Residential Model The residential model uses Energy Information Administration (EIA) Fuel Use data2 to characterize the total thermal and non-thermal energy use in NH residences, and the fuels profile used to satisfy those energy demands. Historical energy use data is used along with historical NH population data3 to determine the average per capita energy intensity. Population growth projections4 are multiplied by average per capita energy intensity to project future energy demand. For the business-as-usual (BAU) case, the total energy demand rises due to population growth while the fuel profile used to meet the energy demand remains constant.
1 EPA report: "Inventory of U.S. Greenhouse Gas Emissions and Sinks 1990-2006"
2 Sources: Energy Information Administration, Residential Energy Consumption Surveys, 1978, 1979, 1980, 1981,
1982, 1984, 1987, 1990, 1993, 1997, and 2001. 3 Historical population records: http://www.nh.gov/oep/programs/DataCenter/Population/90web.htm
4 New Hampshire Office of Energy & Planning Population Projections Published - November 2006.
NH Climate Change Policy Task Force Carbon Emissions and Economic Modeling: Approach and Assumptions
RCI Carbon Emissions and Economic Modeling: CSNE Approach and Assumptions 4 March 2009
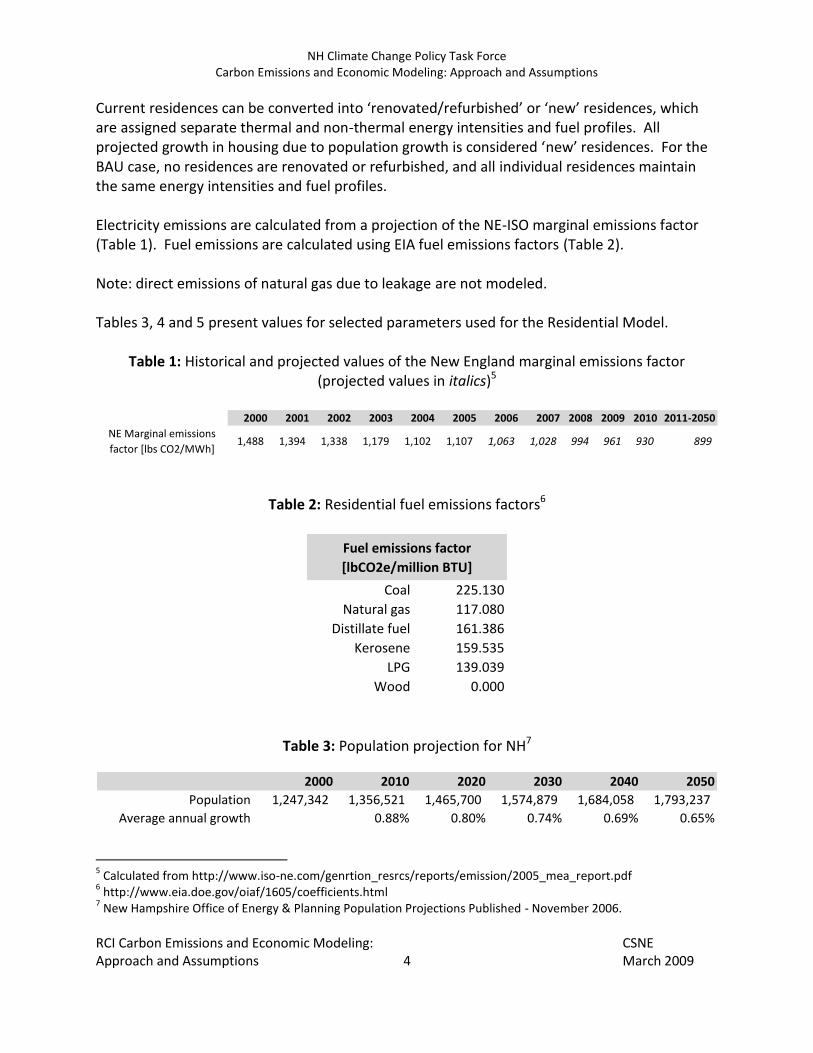
Current residences can be converted into ‘renovated/refurbished’ or ‘new’ residences, which are assigned separate thermal and non-thermal energy intensities and fuel profiles. All projected growth in housing due to population growth is considered ‘new’ residences. For the BAU case, no residences are renovated or refurbished, and all individual residences maintain the same energy intensities and fuel profiles. Electricity emissions are calculated from a projection of the NE-ISO marginal emissions factor (Table 1). Fuel emissions are calculated using EIA fuel emissions factors (Table 2). Note: direct emissions of natural gas due to leakage are not modeled. Tables 3, 4 and 5 present values for selected parameters used for the Residential Model.
Table 1: Historical and projected values of the New England marginal emissions factor (projected values in italics)5
7 New Hampshire Office of Energy & Planning Population Projections Published - November 2006.
NH Climate Change Policy Task Force Carbon Emissions and Economic Modeling: Approach and Assumptions
RCI Carbon Emissions and Economic Modeling: CSNE Approach and Assumptions 5 March 2009
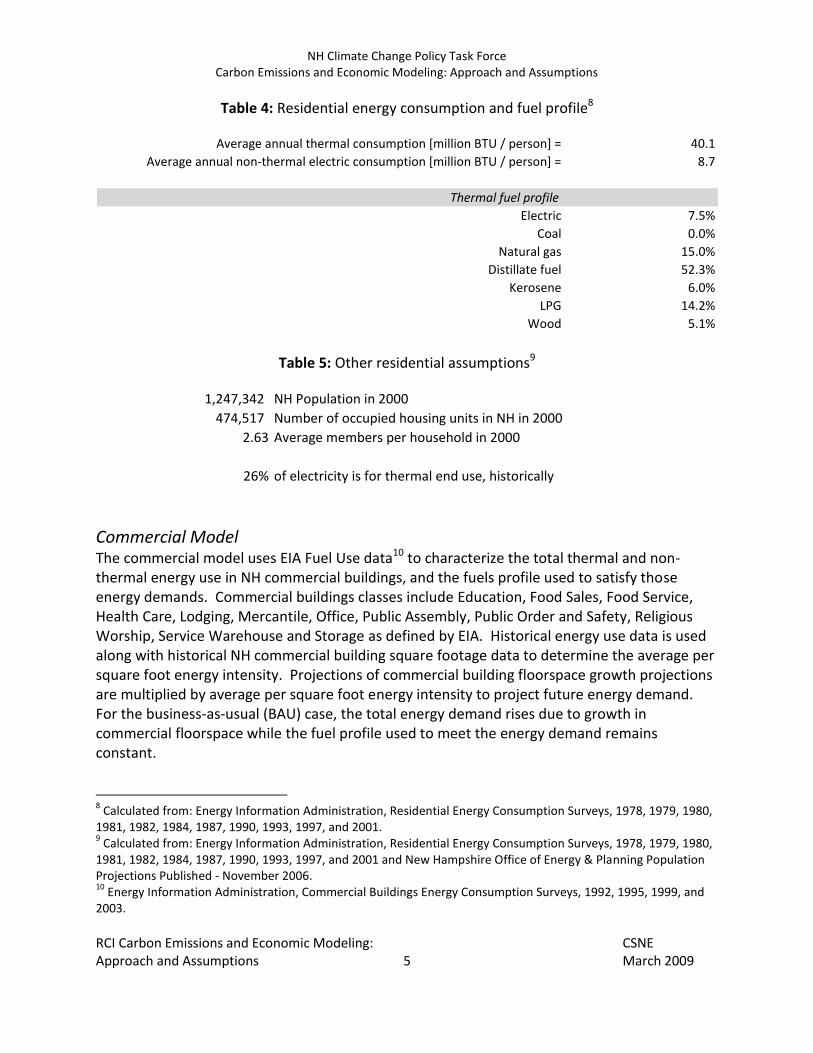
Table 4: Residential energy consumption and fuel profile8
Average annual thermal consumption [million BTU / person] = 40.1
Average annual non-thermal electric consumption [million BTU / person] = 8.7
Thermal fuel profile
Electric 7.5%
Coal 0.0%
Natural gas 15.0%
Distillate fuel 52.3%
Kerosene 6.0%
LPG 14.2%
Wood 5.1%
Table 5: Other residential assumptions9
1,247,342 NH Population in 2000
474,517 Number of occupied housing units in NH in 2000
2.63 Average members per household in 2000
26% of electricity is for thermal end use, historically
Commercial Model The commercial model uses EIA Fuel Use data10 to characterize the total thermal and non-thermal energy use in NH commercial buildings, and the fuels profile used to satisfy those energy demands. Commercial buildings classes include Education, Food Sales, Food Service, Health Care, Lodging, Mercantile, Office, Public Assembly, Public Order and Safety, Religious Worship, Service Warehouse and Storage as defined by EIA. Historical energy use data is used along with historical NH commercial building square footage data to determine the average per square foot energy intensity. Projections of commercial building floorspace growth projections are multiplied by average per square foot energy intensity to project future energy demand. For the business-as-usual (BAU) case, the total energy demand rises due to growth in commercial floorspace while the fuel profile used to meet the energy demand remains constant.
8 Calculated from: Energy Information Administration, Residential Energy Consumption Surveys, 1978, 1979, 1980,
1981, 1982, 1984, 1987, 1990, 1993, 1997, and 2001. 9 Calculated from: Energy Information Administration, Residential Energy Consumption Surveys, 1978, 1979, 1980,
1981, 1982, 1984, 1987, 1990, 1993, 1997, and 2001 and New Hampshire Office of Energy & Planning Population Projections Published - November 2006. 10
Energy Information Administration, Commercial Buildings Energy Consumption Surveys, 1992, 1995, 1999, and 2003.
NH Climate Change Policy Task Force Carbon Emissions and Economic Modeling: Approach and Assumptions
RCI Carbon Emissions and Economic Modeling: CSNE Approach and Assumptions 6 March 2009
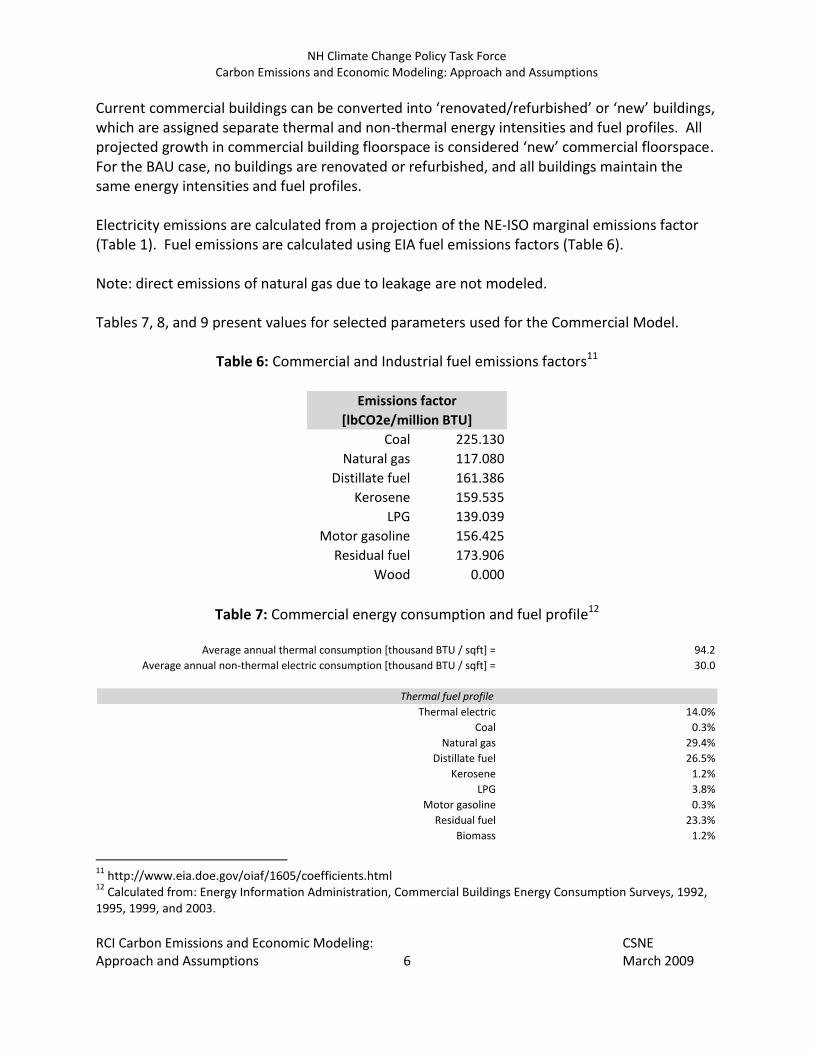
Current commercial buildings can be converted into ‘renovated/refurbished’ or ‘new’ buildings, which are assigned separate thermal and non-thermal energy intensities and fuel profiles. All projected growth in commercial building floorspace is considered ‘new’ commercial floorspace. For the BAU case, no buildings are renovated or refurbished, and all buildings maintain the same energy intensities and fuel profiles. Electricity emissions are calculated from a projection of the NE-ISO marginal emissions factor (Table 1). Fuel emissions are calculated using EIA fuel emissions factors (Table 6). Note: direct emissions of natural gas due to leakage are not modeled. Tables 7, 8, and 9 present values for selected parameters used for the Commercial Model.
Table 6: Commercial and Industrial fuel emissions factors11
Coal 225.130
Natural gas 117.080
Distillate fuel 161.386
Kerosene 159.535
LPG 139.039
Motor gasoline 156.425
Residual fuel 173.906
Wood 0.000
Emissions factor
[lbCO2e/million BTU]
Table 7: Commercial energy consumption and fuel profile12
Average annual thermal consumption [thousand BTU / sqft] = 94.2
Average annual non-thermal electric consumption [thousand BTU / sqft] = 30.0
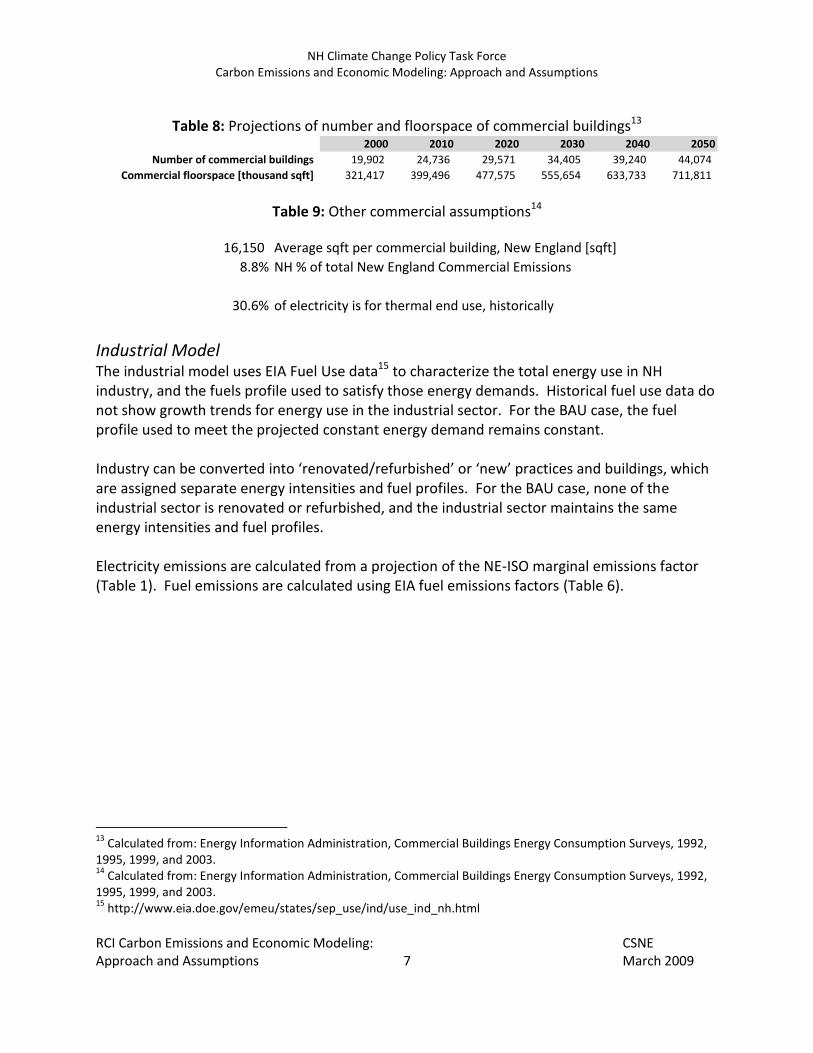
16,150 Average sqft per commercial building, New England [sqft]
8.8% NH % of total New England Commercial Emissions
30.6% of electricity is for thermal end use, historically Industrial Model The industrial model uses EIA Fuel Use data15 to characterize the total energy use in NH industry, and the fuels profile used to satisfy those energy demands. Historical fuel use data do not show growth trends for energy use in the industrial sector. For the BAU case, the fuel profile used to meet the projected constant energy demand remains constant. Industry can be converted into ‘renovated/refurbished’ or ‘new’ practices and buildings, which are assigned separate energy intensities and fuel profiles. For the BAU case, none of the industrial sector is renovated or refurbished, and the industrial sector maintains the same energy intensities and fuel profiles. Electricity emissions are calculated from a projection of the NE-ISO marginal emissions factor (Table 1). Fuel emissions are calculated using EIA fuel emissions factors (Table 6).
13
Calculated from: Energy Information Administration, Commercial Buildings Energy Consumption Surveys, 1992, 1995, 1999, and 2003. 14
Calculated from: Energy Information Administration, Commercial Buildings Energy Consumption Surveys, 1992, 1995, 1999, and 2003. 15
NH Climate Change Policy Task Force Carbon Emissions and Economic Modeling: Approach and Assumptions
RCI Carbon Emissions and Economic Modeling: CSNE Approach and Assumptions 8 March 2009
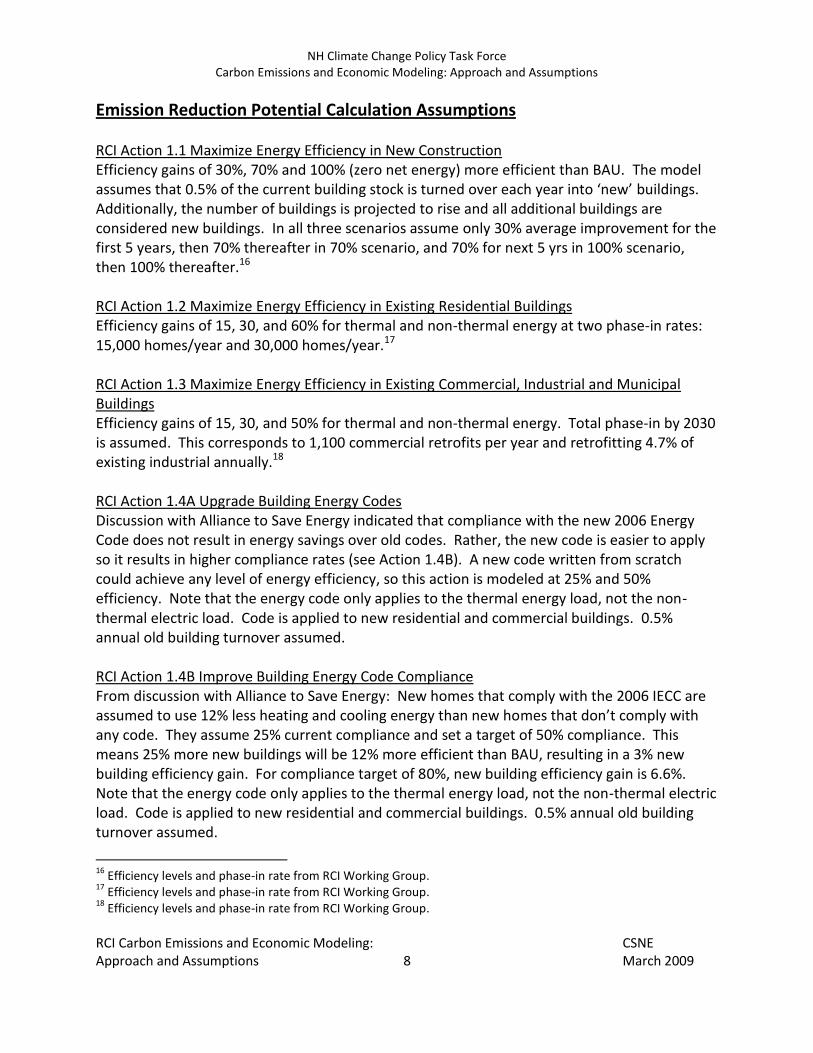
Emission Reduction Potential Calculation Assumptions RCI Action 1.1 Maximize Energy Efficiency in New Construction Efficiency gains of 30%, 70% and 100% (zero net energy) more efficient than BAU. The model assumes that 0.5% of the current building stock is turned over each year into ‘new’ buildings. Additionally, the number of buildings is projected to rise and all additional buildings are considered new buildings. In all three scenarios assume only 30% average improvement for the first 5 years, then 70% thereafter in 70% scenario, and 70% for next 5 yrs in 100% scenario, then 100% thereafter.16 RCI Action 1.2 Maximize Energy Efficiency in Existing Residential Buildings Efficiency gains of 15, 30, and 60% for thermal and non-thermal energy at two phase-in rates: 15,000 homes/year and 30,000 homes/year.17 RCI Action 1.3 Maximize Energy Efficiency in Existing Commercial, Industrial and Municipal Buildings Efficiency gains of 15, 30, and 50% for thermal and non-thermal energy. Total phase-in by 2030 is assumed. This corresponds to 1,100 commercial retrofits per year and retrofitting 4.7% of existing industrial annually.18 RCI Action 1.4A Upgrade Building Energy Codes Discussion with Alliance to Save Energy indicated that compliance with the new 2006 Energy Code does not result in energy savings over old codes. Rather, the new code is easier to apply so it results in higher compliance rates (see Action 1.4B). A new code written from scratch could achieve any level of energy efficiency, so this action is modeled at 25% and 50% efficiency. Note that the energy code only applies to the thermal energy load, not the non-thermal electric load. Code is applied to new residential and commercial buildings. 0.5% annual old building turnover assumed. RCI Action 1.4B Improve Building Energy Code Compliance From discussion with Alliance to Save Energy: New homes that comply with the 2006 IECC are assumed to use 12% less heating and cooling energy than new homes that don’t comply with any code. They assume 25% current compliance and set a target of 50% compliance. This means 25% more new buildings will be 12% more efficient than BAU, resulting in a 3% new building efficiency gain. For compliance target of 80%, new building efficiency gain is 6.6%. Note that the energy code only applies to the thermal energy load, not the non-thermal electric load. Code is applied to new residential and commercial buildings. 0.5% annual old building turnover assumed.
16
Efficiency levels and phase-in rate from RCI Working Group. 17
Efficiency levels and phase-in rate from RCI Working Group. 18
Efficiency levels and phase-in rate from RCI Working Group.
NH Climate Change Policy Task Force Carbon Emissions and Economic Modeling: Approach and Assumptions
RCI Carbon Emissions and Economic Modeling: CSNE Approach and Assumptions 9 March 2009
RCI Action 1.5 Establish an Energy Properties Section in MLS Listings Action not individually quantified. RCI Action 1.7 Preserve Older Buildings and Neighborhoods as Components of Sustainable Communities Action not individually quantified. RCI Action 1.8 Conserve Embodied Energy in Existing Building Stock Action not individually quantified. RCI Action 2.1 Create Incentive Programs to Install Higher Efficiency Equipment, Processes, and Systems Action not individually quantified. RCI Action 2.3 Require Annual CO2 Emissions Reporting Action not individually quantified. RCI Action 2.4 Develop Best-Practice Guidelines for Energy Efficient Process Equipment Action not individually quantified. RCI Action 2.5 Promote Net-Zero or Minimal-Emissions Industrial and Commercial Clusters Action not individually quantified. RCI Action 3.1 Promote Renewable Energy and Low-CO2e Thermal Energy Systems Modeled as a renovation of 15,000 homes per year at 7% thermal efficiency gain. 19 RCI Action 4.1 Include Energy Efficiency and Conservation in School Curriculum Action not individually quantified. RCI Action 4.2 Increase Energy Efficiency through Building Management Education Programs Action not individually quantified. RCI Action 4.3 Reduce Residential Energy Demand through Education and Outreach Action not individually quantified. RCI Action 4.4 Establish a Comprehensive Energy Efficiency and Renewable Energy Education Program Action not individually quantified.
19
Efficiency levels and phase-in rate from RCI Working Group.
NH Climate Change Policy Task Force Carbon Emissions and Economic Modeling: Approach and Assumptions
RCI Carbon Emissions and Economic Modeling: CSNE Approach and Assumptions 10 March 2009
RCI Action 4.5 Create an Energy Efficiency and Sustainable Energy Systems Web Portal Action not individually quantified.
Economic Model: The CSNE economic modeling team took an “efficient analysis” approach to estimating the economic impacts of different actions proposed by the working groups, given the many different policy options considered. The modeling assumptions used in estimating economic costs and benefits are provided below. The objective of the economic analysis was to estimate approximate “levels of magnitude” of the economic impacts of each proposed action item. Given the short time frame of analysis and large number of action items under consideration, this economic analysis is not as detailed as previous UNH economic studies of RPS and RGGI. It is instead meant to provide economic context to assist in the decision making process for the task force. The analysis provided for the task force is limited to direct New Hampshire costs/benefits and does not include assessment of society wide impacts. As much as possible, direct employment impacts are estimated along with costs and benefits. The analysis does not consider potential benefits associated with actions such as reduced health costs due to reduced air pollution emissions and also does not include avoided costs in calculating economic impacts. However where appropriate, an economic multiplier was used to estimate the broader state-wide economic impacts of cost savings, such as for reduced fuel consumption. An economic multiplier is used to estimate economy-wide impacts of specific economic changes. The UNH Economic team—based on its significant knowledge of the NH economy and to be conservative—chose a $1 economic multiplier for each $1 of savings attributed to an action. The assumptions section discusses whether the economic multiplier was applied to any given action. The 1:1 multiplier is considered conservative.20 The economic analysis does not discount costs and benefits of climate change policies to reflect timing or uncertainty. This is consistent with the approach used for NH RGGI and RPS analysis and used in the Stern Report. Ken Arrow, Nobel Laureate Economist, reviewed the Stern Report21 and concluded that discounting for time and uncertainty did not change conclusions.22 In the analysis spreadsheet summarizing the carbon and economic impacts of each action item, levels of magnitude and qualitative information are provided, not precise figures for costs and
20
Federal Reserve Bank, 2002. 21
Stern Review on the economics of climate change. 2006. http://www.hm-treasury.gov.uk/independent_reviews/stern_review_economics_climate_change/stern_review_report.cfm 22
“The case for cutting emissions,” Ken Arrow, 2007.
NH Climate Change Policy Task Force Carbon Emissions and Economic Modeling: Approach and Assumptions
RCI Carbon Emissions and Economic Modeling: CSNE Approach and Assumptions 11 March 2009
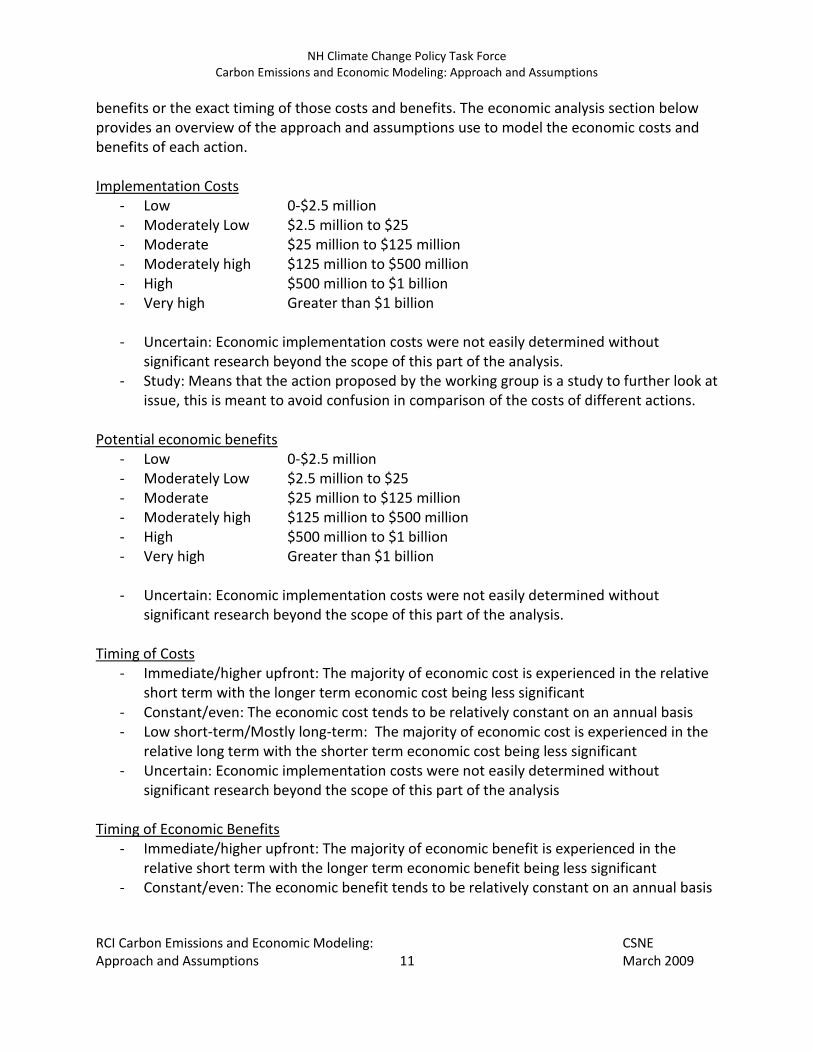
benefits or the exact timing of those costs and benefits. The economic analysis section below provides an overview of the approach and assumptions use to model the economic costs and benefits of each action. Implementation Costs
- Low 0-$2.5 million - Moderately Low $2.5 million to $25 - Moderate $25 million to $125 million - Moderately high $125 million to $500 million - High $500 million to $1 billion - Very high Greater than $1 billion
- Uncertain: Economic implementation costs were not easily determined without
significant research beyond the scope of this part of the analysis. - Study: Means that the action proposed by the working group is a study to further look at
issue, this is meant to avoid confusion in comparison of the costs of different actions.
Potential economic benefits - Low 0-$2.5 million - Moderately Low $2.5 million to $25 - Moderate $25 million to $125 million - Moderately high $125 million to $500 million - High $500 million to $1 billion - Very high Greater than $1 billion
- Uncertain: Economic implementation costs were not easily determined without
significant research beyond the scope of this part of the analysis. Timing of Costs
- Immediate/higher upfront: The majority of economic cost is experienced in the relative short term with the longer term economic cost being less significant
- Constant/even: The economic cost tends to be relatively constant on an annual basis - Low short-term/Mostly long-term: The majority of economic cost is experienced in the
relative long term with the shorter term economic cost being less significant - Uncertain: Economic implementation costs were not easily determined without
significant research beyond the scope of this part of the analysis Timing of Economic Benefits
- Immediate/higher upfront: The majority of economic benefit is experienced in the relative short term with the longer term economic benefit being less significant
- Constant/even: The economic benefit tends to be relatively constant on an annual basis
NH Climate Change Policy Task Force Carbon Emissions and Economic Modeling: Approach and Assumptions
RCI Carbon Emissions and Economic Modeling: CSNE Approach and Assumptions 12 March 2009
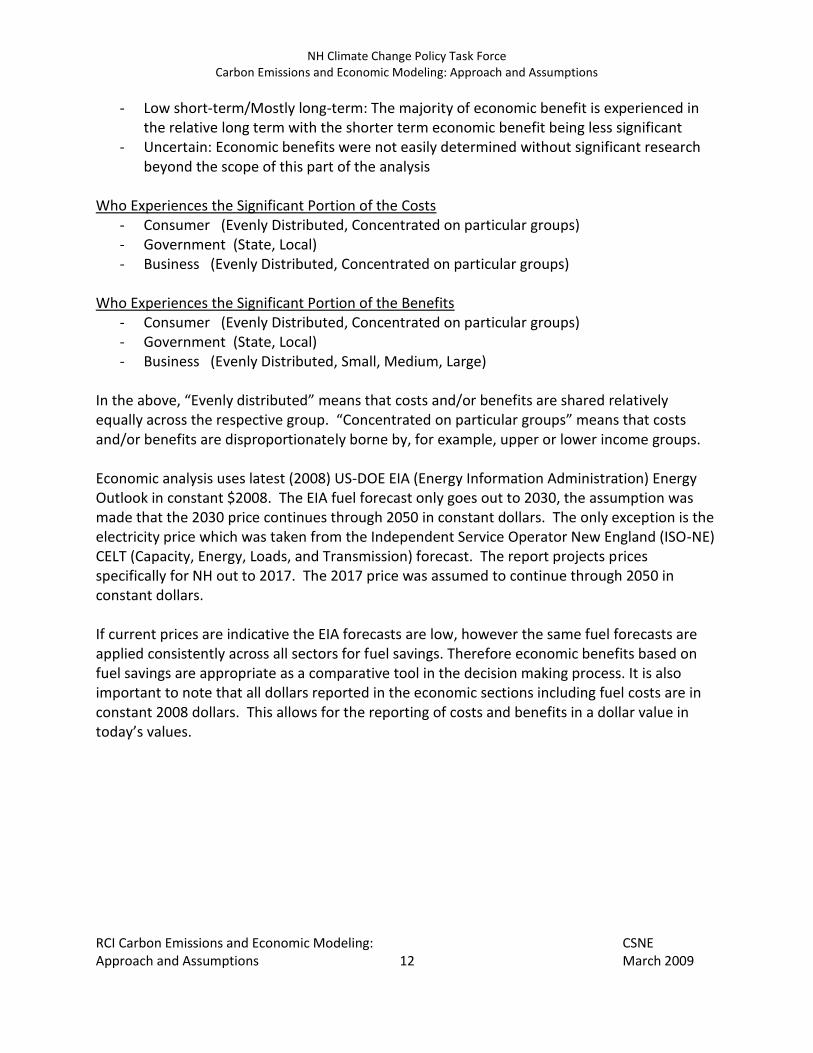
- Low short-term/Mostly long-term: The majority of economic benefit is experienced in the relative long term with the shorter term economic benefit being less significant
- Uncertain: Economic benefits were not easily determined without significant research beyond the scope of this part of the analysis
Who Experiences the Significant Portion of the Costs - Consumer (Evenly Distributed, Concentrated on particular groups) - Government (State, Local) - Business (Evenly Distributed, Concentrated on particular groups)
Who Experiences the Significant Portion of the Benefits
- Consumer (Evenly Distributed, Concentrated on particular groups) - Government (State, Local) - Business (Evenly Distributed, Small, Medium, Large)
In the above, “Evenly distributed” means that costs and/or benefits are shared relatively equally across the respective group. “Concentrated on particular groups” means that costs and/or benefits are disproportionately borne by, for example, upper or lower income groups. Economic analysis uses latest (2008) US-DOE EIA (Energy Information Administration) Energy Outlook in constant $2008. The EIA fuel forecast only goes out to 2030, the assumption was made that the 2030 price continues through 2050 in constant dollars. The only exception is the electricity price which was taken from the Independent Service Operator New England (ISO-NE) CELT (Capacity, Energy, Loads, and Transmission) forecast. The report projects prices specifically for NH out to 2017. The 2017 price was assumed to continue through 2050 in constant dollars. If current prices are indicative the EIA forecasts are low, however the same fuel forecasts are applied consistently across all sectors for fuel savings. Therefore economic benefits based on fuel savings are appropriate as a comparative tool in the decision making process. It is also important to note that all dollars reported in the economic sections including fuel costs are in constant 2008 dollars. This allows for the reporting of costs and benefits in a dollar value in today’s values.
NH Climate Change Policy Task Force Carbon Emissions and Economic Modeling: Approach and Assumptions
RCI Carbon Emissions and Economic Modeling: CSNE Approach and Assumptions 13 March 2009
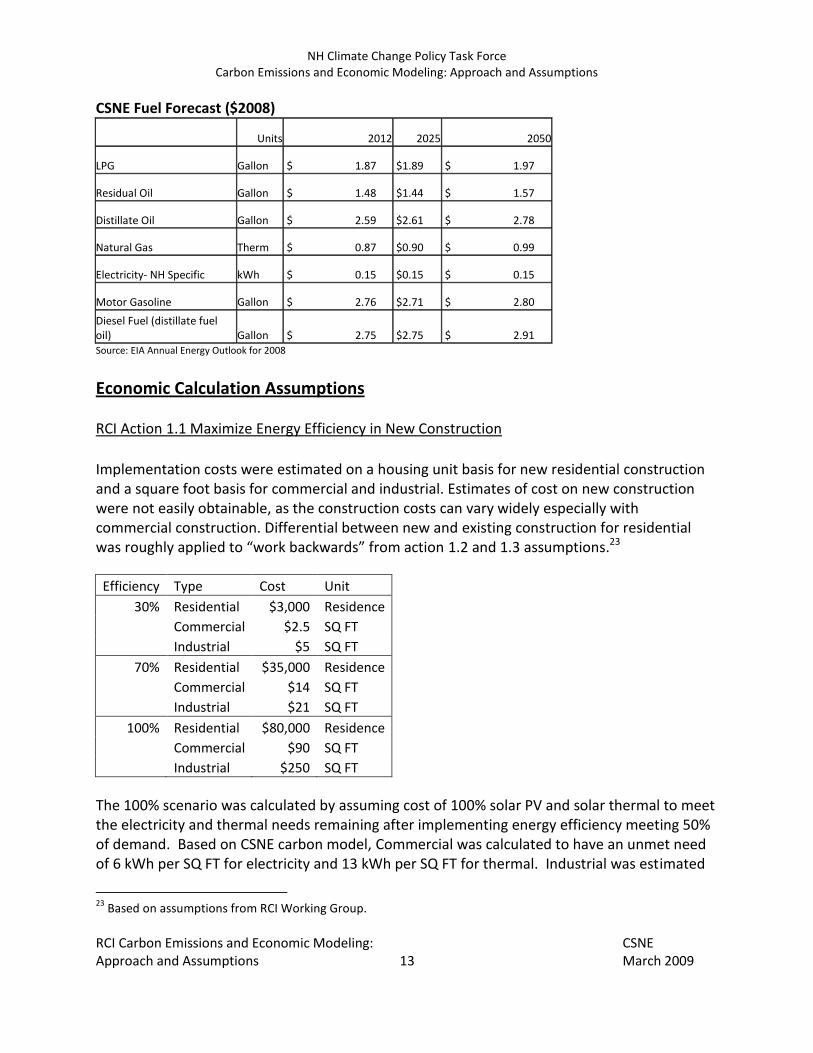
CSNE Fuel Forecast ($2008)
Units 2012 2025 2050
LPG Gallon $ 1.87 $1.89 $ 1.97
Residual Oil Gallon $ 1.48 $1.44 $ 1.57
Distillate Oil Gallon $ 2.59 $2.61 $ 2.78
Natural Gas Therm $ 0.87 $0.90 $ 0.99
Electricity- NH Specific kWh $ 0.15 $0.15 $ 0.15
Motor Gasoline Gallon $ 2.76 $2.71 $ 2.80
Diesel Fuel (distillate fuel oil) Gallon $ 2.75 $2.75 $ 2.91 Source: EIA Annual Energy Outlook for 2008
Economic Calculation Assumptions RCI Action 1.1 Maximize Energy Efficiency in New Construction
Implementation costs were estimated on a housing unit basis for new residential construction and a square foot basis for commercial and industrial. Estimates of cost on new construction were not easily obtainable, as the construction costs can vary widely especially with commercial construction. Differential between new and existing construction for residential was roughly applied to “work backwards” from action 1.2 and 1.3 assumptions.23
Efficiency Type Cost Unit
30% Residential $3,000 Residence
Commercial $2.5 SQ FT
Industrial $5 SQ FT
70% Residential $35,000 Residence
Commercial $14 SQ FT
Industrial $21 SQ FT
100% Residential $80,000 Residence
Commercial $90 SQ FT
Industrial $250 SQ FT
The 100% scenario was calculated by assuming cost of 100% solar PV and solar thermal to meet the electricity and thermal needs remaining after implementing energy efficiency meeting 50% of demand. Based on CSNE carbon model, Commercial was calculated to have an unmet need of 6 kWh per SQ FT for electricity and 13 kWh per SQ FT for thermal. Industrial was estimated
23
Based on assumptions from RCI Working Group.
NH Climate Change Policy Task Force Carbon Emissions and Economic Modeling: Approach and Assumptions
RCI Carbon Emissions and Economic Modeling: CSNE Approach and Assumptions 14 March 2009
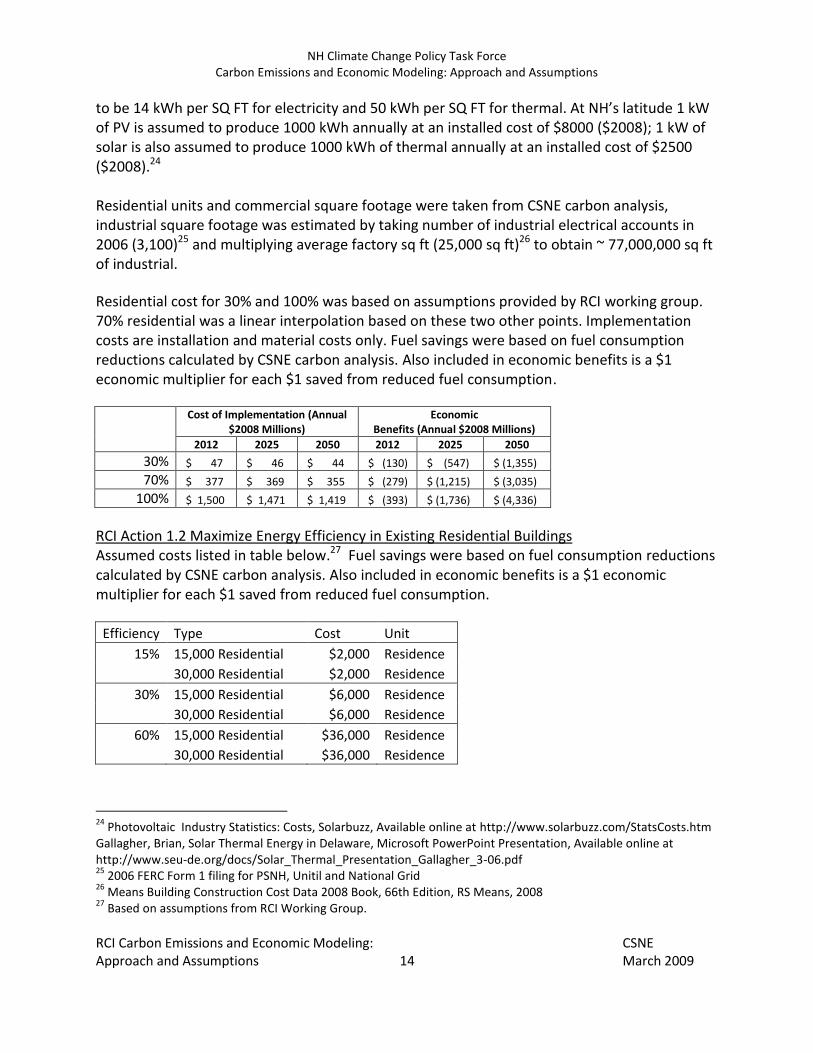
to be 14 kWh per SQ FT for electricity and 50 kWh per SQ FT for thermal. At NH’s latitude 1 kW of PV is assumed to produce 1000 kWh annually at an installed cost of $8000 ($2008); 1 kW of solar is also assumed to produce 1000 kWh of thermal annually at an installed cost of $2500 ($2008).24 Residential units and commercial square footage were taken from CSNE carbon analysis, industrial square footage was estimated by taking number of industrial electrical accounts in 2006 (3,100)25 and multiplying average factory sq ft (25,000 sq ft)26 to obtain ~ 77,000,000 sq ft of industrial.
Residential cost for 30% and 100% was based on assumptions provided by RCI working group. 70% residential was a linear interpolation based on these two other points. Implementation costs are installation and material costs only. Fuel savings were based on fuel consumption reductions calculated by CSNE carbon analysis. Also included in economic benefits is a $1 economic multiplier for each $1 saved from reduced fuel consumption.
RCI Action 1.2 Maximize Energy Efficiency in Existing Residential Buildings Assumed costs listed in table below.27 Fuel savings were based on fuel consumption reductions calculated by CSNE carbon analysis. Also included in economic benefits is a $1 economic multiplier for each $1 saved from reduced fuel consumption.
Efficiency Type Cost Unit
15% 15,000 Residential $2,000 Residence
30,000 Residential $2,000 Residence
30% 15,000 Residential $6,000 Residence
30,000 Residential $6,000 Residence
60% 15,000 Residential $36,000 Residence
30,000 Residential $36,000 Residence
24
Photovoltaic Industry Statistics: Costs, Solarbuzz, Available online at http://www.solarbuzz.com/StatsCosts.htm Gallagher, Brian, Solar Thermal Energy in Delaware, Microsoft PowerPoint Presentation, Available online at http://www.seu-de.org/docs/Solar_Thermal_Presentation_Gallagher_3-06.pdf 25
2006 FERC Form 1 filing for PSNH, Unitil and National Grid 26
Means Building Construction Cost Data 2008 Book, 66th Edition, RS Means, 2008 27
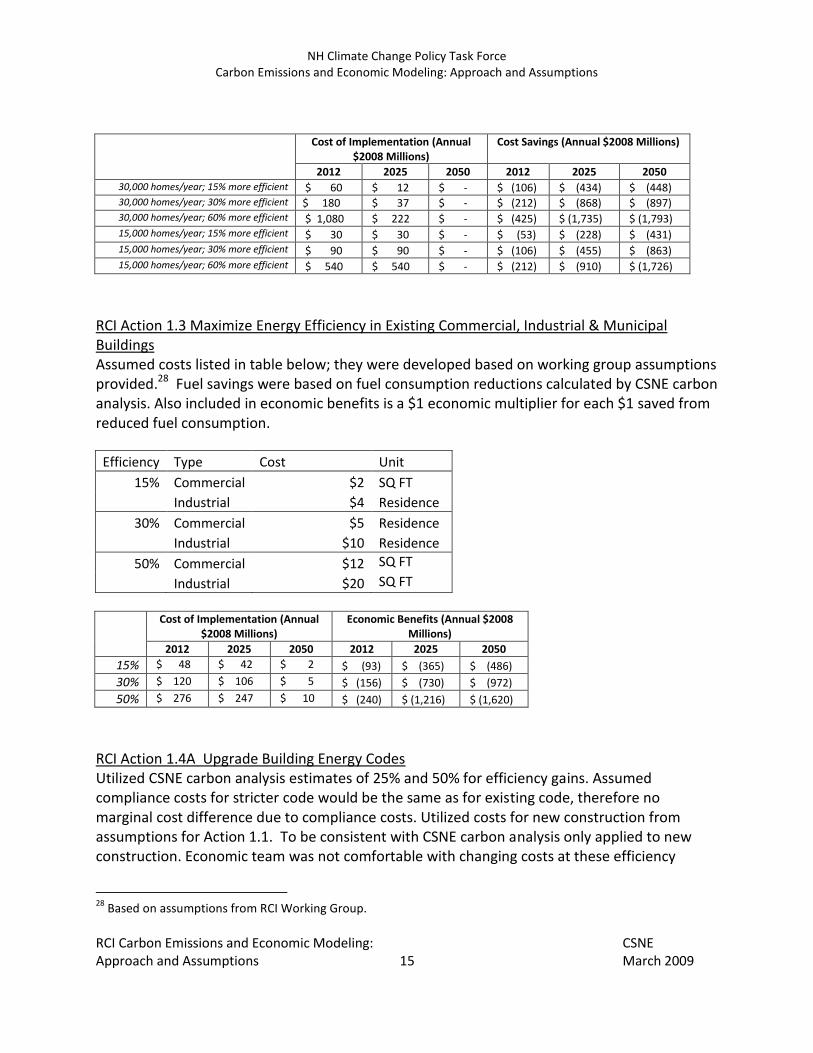
RCI Action 1.3 Maximize Energy Efficiency in Existing Commercial, Industrial & Municipal Buildings
Assumed costs listed in table below; they were developed based on working group assumptions provided.28 Fuel savings were based on fuel consumption reductions calculated by CSNE carbon analysis. Also included in economic benefits is a $1 economic multiplier for each $1 saved from reduced fuel consumption.
Efficiency Type Cost Unit
15% Commercial $2 SQ FT
Industrial $4 Residence
30% Commercial $5 Residence
Industrial $10 Residence
50% Commercial $12 SQ FT
Industrial $20 SQ FT
Cost of Implementation (Annual $2008 Millions)
Economic Benefits (Annual $2008 Millions)
2012 2025 2050 2012 2025 2050
15% $ 48 $ 42 $ 2 $ (93) $ (365) $ (486)
30% $ 120 $ 106 $ 5 $ (156) $ (730) $ (972)
50% $ 276 $ 247 $ 10 $ (240) $ (1,216) $ (1,620)
RCI Action 1.4A Upgrade Building Energy Codes Utilized CSNE carbon analysis estimates of 25% and 50% for efficiency gains. Assumed compliance costs for stricter code would be the same as for existing code, therefore no marginal cost difference due to compliance costs. Utilized costs for new construction from assumptions for Action 1.1. To be consistent with CSNE carbon analysis only applied to new construction. Economic team was not comfortable with changing costs at these efficiency
28
Based on assumptions from RCI Working Group.
NH Climate Change Policy Task Force Carbon Emissions and Economic Modeling: Approach and Assumptions
RCI Carbon Emissions and Economic Modeling: CSNE Approach and Assumptions 16 March 2009
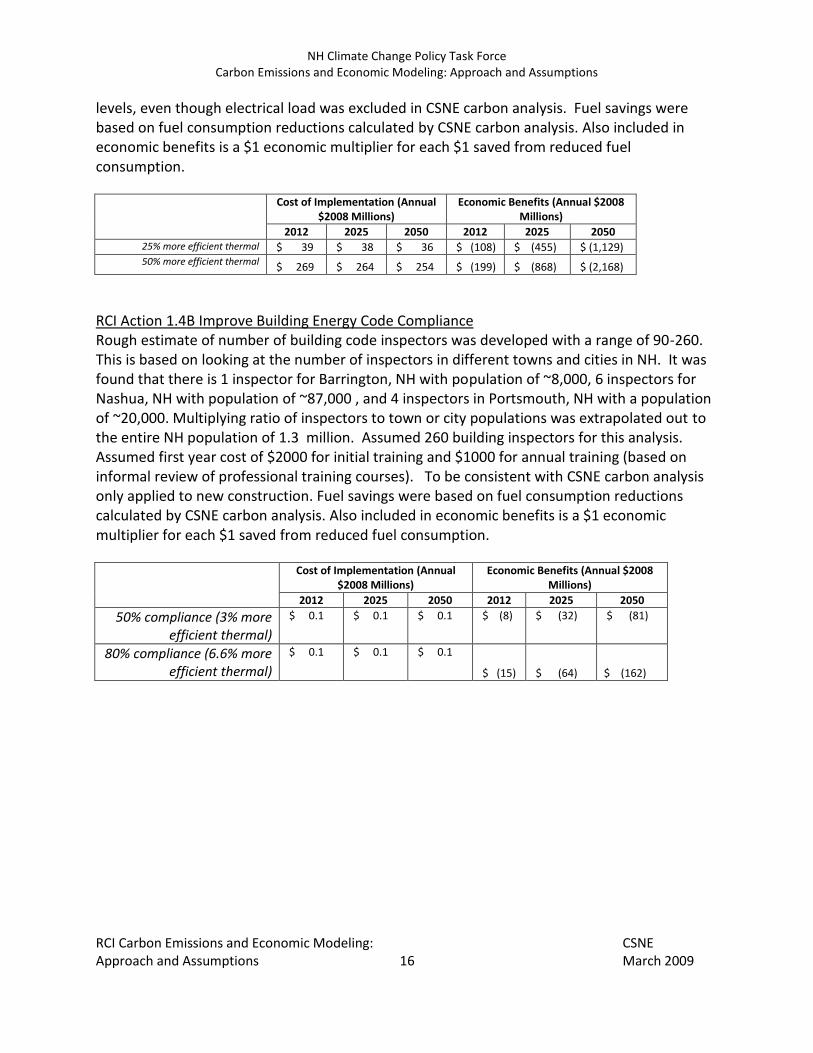
levels, even though electrical load was excluded in CSNE carbon analysis. Fuel savings were based on fuel consumption reductions calculated by CSNE carbon analysis. Also included in economic benefits is a $1 economic multiplier for each $1 saved from reduced fuel consumption.
RCI Action 1.4B Improve Building Energy Code Compliance Rough estimate of number of building code inspectors was developed with a range of 90-260. This is based on looking at the number of inspectors in different towns and cities in NH. It was found that there is 1 inspector for Barrington, NH with population of ~8,000, 6 inspectors for Nashua, NH with population of ~87,000 , and 4 inspectors in Portsmouth, NH with a population of ~20,000. Multiplying ratio of inspectors to town or city populations was extrapolated out to the entire NH population of 1.3 million. Assumed 260 building inspectors for this analysis. Assumed first year cost of $2000 for initial training and $1000 for annual training (based on informal review of professional training courses). To be consistent with CSNE carbon analysis only applied to new construction. Fuel savings were based on fuel consumption reductions calculated by CSNE carbon analysis. Also included in economic benefits is a $1 economic multiplier for each $1 saved from reduced fuel consumption.
Cost of Implementation (Annual $2008 Millions)
Economic Benefits (Annual $2008 Millions)
2012 2025 2050 2012 2025 2050
50% compliance (3% more efficient thermal)
$ 0.1 $ 0.1 $ 0.1 $ (8) $ (32) $ (81)
80% compliance (6.6% more efficient thermal)
$ 0.1 $ 0.1 $ 0.1
$ (15) $ (64) $ (162)
NH Climate Change Policy Task Force Carbon Emissions and Economic Modeling: Approach and Assumptions
RCI Carbon Emissions and Economic Modeling: CSNE Approach and Assumptions 17 March 2009
RCI Action 1.5 Establish an Energy Properties Section in MLS Listings Assumed an incremental cost of $20 per listing that would be necessary for a MLS listing. Cost of home energy audit assumed to be $200 determined by quick web review and conversation with home energy auditors.29 Total cost estimated at $220 per listing. Annual number of listings for existing home sales estimated to be 20,000, based on existing home sales for NH from Realtor.org for 200830, new homes derived from CSNE carbon calculations (approximately 6,200 per year). Total annual listings estimated at 27,000 for a recurring annual cost of ~$6 million. Supporting mechanism for residential energy efficiency.
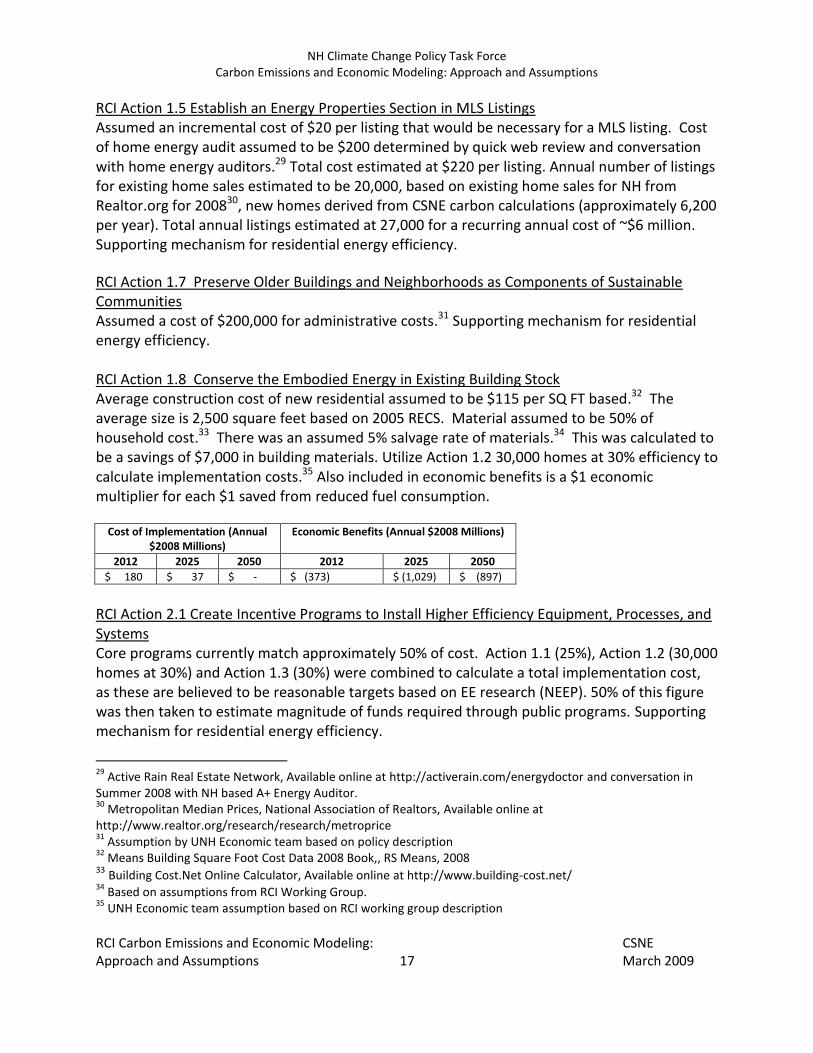
RCI Action 1.7 Preserve Older Buildings and Neighborhoods as Components of Sustainable Communities Assumed a cost of $200,000 for administrative costs.31 Supporting mechanism for residential energy efficiency. RCI Action 1.8 Conserve the Embodied Energy in Existing Building Stock Average construction cost of new residential assumed to be $115 per SQ FT based.32 The average size is 2,500 square feet based on 2005 RECS. Material assumed to be 50% of household cost.33 There was an assumed 5% salvage rate of materials.34 This was calculated to be a savings of $7,000 in building materials. Utilize Action 1.2 30,000 homes at 30% efficiency to calculate implementation costs.35 Also included in economic benefits is a $1 economic multiplier for each $1 saved from reduced fuel consumption.
Cost of Implementation (Annual $2008 Millions)
Economic Benefits (Annual $2008 Millions)
2012 2025 2050 2012 2025 2050
$ 180 $ 37 $ - $ (373) $ (1,029) $ (897)
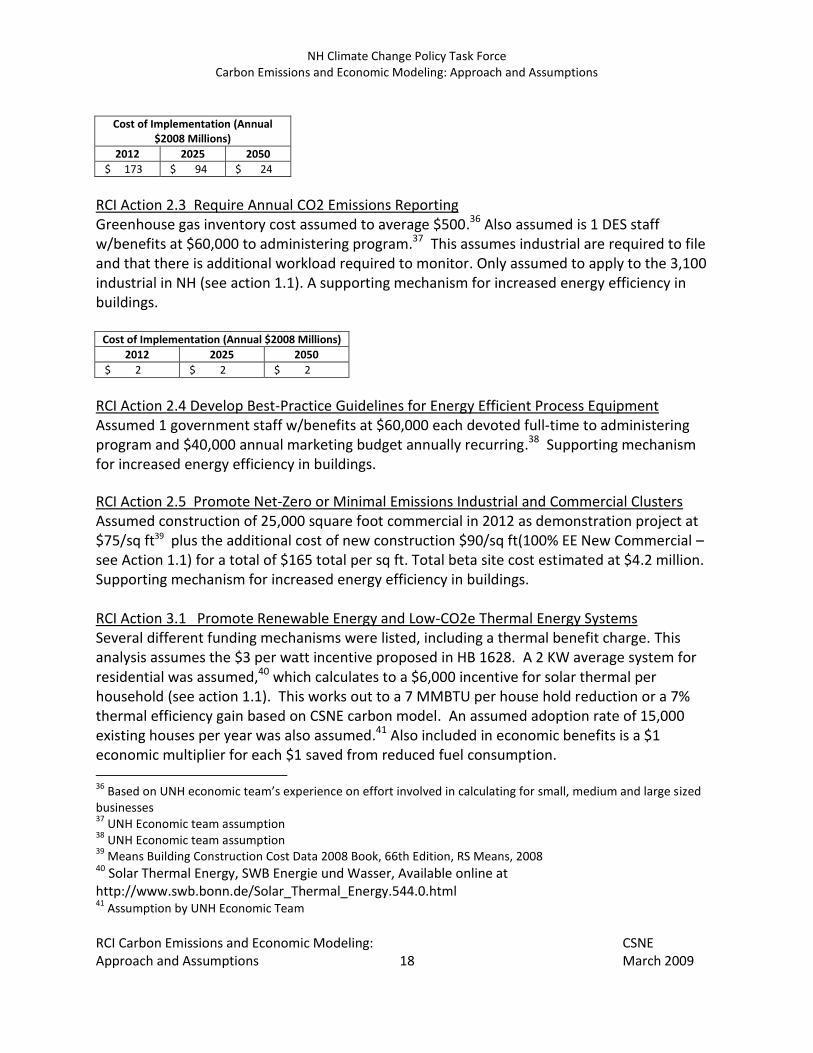
RCI Action 2.1 Create Incentive Programs to Install Higher Efficiency Equipment, Processes, and Systems Core programs currently match approximately 50% of cost. Action 1.1 (25%), Action 1.2 (30,000 homes at 30%) and Action 1.3 (30%) were combined to calculate a total implementation cost, as these are believed to be reasonable targets based on EE research (NEEP). 50% of this figure was then taken to estimate magnitude of funds required through public programs. Supporting mechanism for residential energy efficiency.
29
Active Rain Real Estate Network, Available online at http://activerain.com/energydoctor and conversation in Summer 2008 with NH based A+ Energy Auditor. 30
Metropolitan Median Prices, National Association of Realtors, Available online at http://www.realtor.org/research/research/metroprice 31
Assumption by UNH Economic team based on policy description 32
Means Building Square Foot Cost Data 2008 Book,, RS Means, 2008 33 Building Cost.Net Online Calculator, Available online at http://www.building-cost.net/ 34
Based on assumptions from RCI Working Group. 35
UNH Economic team assumption based on RCI working group description
NH Climate Change Policy Task Force Carbon Emissions and Economic Modeling: Approach and Assumptions
RCI Carbon Emissions and Economic Modeling: CSNE Approach and Assumptions 18 March 2009
Cost of Implementation (Annual
$2008 Millions)
2012 2025 2050
$ 173 $ 94 $ 24
RCI Action 2.3 Require Annual CO2 Emissions Reporting Greenhouse gas inventory cost assumed to average $500.36 Also assumed is 1 DES staff w/benefits at $60,000 to administering program.37 This assumes industrial are required to file and that there is additional workload required to monitor. Only assumed to apply to the 3,100 industrial in NH (see action 1.1). A supporting mechanism for increased energy efficiency in buildings.
Cost of Implementation (Annual $2008 Millions)
2012 2025 2050
$ 2 $ 2 $ 2
RCI Action 2.4 Develop Best-Practice Guidelines for Energy Efficient Process Equipment Assumed 1 government staff w/benefits at $60,000 each devoted full-time to administering program and $40,000 annual marketing budget annually recurring.38 Supporting mechanism for increased energy efficiency in buildings.
RCI Action 2.5 Promote Net-Zero or Minimal Emissions Industrial and Commercial Clusters Assumed construction of 25,000 square foot commercial in 2012 as demonstration project at $75/sq ft39 plus the additional cost of new construction $90/sq ft(100% EE New Commercial – see Action 1.1) for a total of $165 total per sq ft. Total beta site cost estimated at $4.2 million. Supporting mechanism for increased energy efficiency in buildings. RCI Action 3.1 Promote Renewable Energy and Low-CO2e Thermal Energy Systems
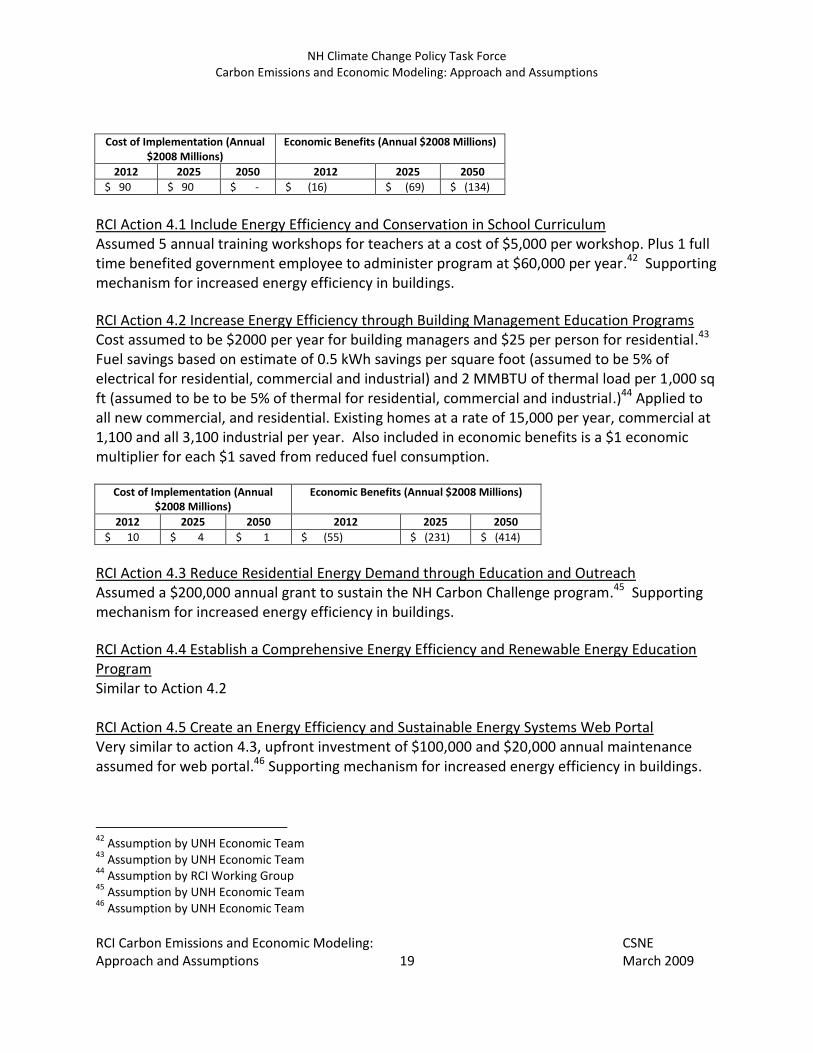
Several different funding mechanisms were listed, including a thermal benefit charge. This analysis assumes the $3 per watt incentive proposed in HB 1628. A 2 KW average system for residential was assumed,40 which calculates to a $6,000 incentive for solar thermal per household (see action 1.1). This works out to a 7 MMBTU per house hold reduction or a 7% thermal efficiency gain based on CSNE carbon model. An assumed adoption rate of 15,000 existing houses per year was also assumed.41 Also included in economic benefits is a $1 economic multiplier for each $1 saved from reduced fuel consumption. 36
Based on UNH economic team’s experience on effort involved in calculating for small, medium and large sized businesses 37
UNH Economic team assumption 38
UNH Economic team assumption 39
Means Building Construction Cost Data 2008 Book, 66th Edition, RS Means, 2008 40 Solar Thermal Energy, SWB Energie und Wasser, Available online at http://www.swb.bonn.de/Solar_Thermal_Energy.544.0.html 41
NH Climate Change Policy Task Force Carbon Emissions and Economic Modeling: Approach and Assumptions
RCI Carbon Emissions and Economic Modeling: CSNE Approach and Assumptions 19 March 2009
Cost of Implementation (Annual $2008 Millions)
Economic Benefits (Annual $2008 Millions)
2012 2025 2050 2012 2025 2050
$ 90 $ 90 $ - $ (16) $ (69) $ (134)
RCI Action 4.1 Include Energy Efficiency and Conservation in School Curriculum Assumed 5 annual training workshops for teachers at a cost of $5,000 per workshop. Plus 1 full time benefited government employee to administer program at $60,000 per year.42 Supporting mechanism for increased energy efficiency in buildings.
RCI Action 4.2 Increase Energy Efficiency through Building Management Education Programs Cost assumed to be $2000 per year for building managers and $25 per person for residential.43 Fuel savings based on estimate of 0.5 kWh savings per square foot (assumed to be 5% of electrical for residential, commercial and industrial) and 2 MMBTU of thermal load per 1,000 sq ft (assumed to be to be 5% of thermal for residential, commercial and industrial.)44 Applied to all new commercial, and residential. Existing homes at a rate of 15,000 per year, commercial at 1,100 and all 3,100 industrial per year. Also included in economic benefits is a $1 economic multiplier for each $1 saved from reduced fuel consumption.
Cost of Implementation (Annual $2008 Millions)
Economic Benefits (Annual $2008 Millions)
2012 2025 2050 2012 2025 2050
$ 10 $ 4 $ 1 $ (55) $ (231) $ (414)
RCI Action 4.3 Reduce Residential Energy Demand through Education and Outreach Assumed a $200,000 annual grant to sustain the NH Carbon Challenge program.45 Supporting mechanism for increased energy efficiency in buildings.
RCI Action 4.4 Establish a Comprehensive Energy Efficiency and Renewable Energy Education Program Similar to Action 4.2 RCI Action 4.5 Create an Energy Efficiency and Sustainable Energy Systems Web Portal Very similar to action 4.3, upfront investment of $100,000 and $20,000 annual maintenance assumed for web portal.46 Supporting mechanism for increased energy efficiency in buildings.