© 2014. American Geophysical Union. All Rights Reserved.
Eos, Vol. 95, No. 35, 2 September 2014
PAGE 324
New insight into substormcurrent wedges
Magnetic substorms, disruptions in the cou-
pled magnetosphere- ionosphere system that
cause brightening of the aurora, are driven
by magnetic activity that starts in the Earth’s
magnetotail—the stretched- out region of
Earth’s magnetic field on the far side from the
Sun—and are transmitted to the ionosphere
through a phenomenon called a substorm
current wedge. New findings from simulations
provide insight into the nature of these cur-
rent wedges.
In a substorm current wedge, a portion of
the electric current that usually flows across
the magnetotail (in a direction perpendicular
to Earth’s magnetic field in the plane of the
equator) is instead diverted in the direction
along Earth’s magnetic field toward the iono-
sphere. In the traditional picture of the sub-
storm current wedge, the current then travels
westward through the ionosphere, then back
out toward the magnetotail, forming a wedge-
shaped loop of current.
Now Birn and Hesse show that the loop
structure could be different than commonly
thought. Building on their work in a previous
paper, in which they used magnetohydro-
dynamic simulations to study the formation
of current wedges following bursts of mag-
netic activity in the magnetotail, the authors
further investigate the current wedges and
accompanying changes in the magnetic field
components.
In particular, their simulations show that in
addition to the westward current flow in the
ionosphere, substorm current wedges could
include a north–south component of current
flow in the ionosphere that is almost twice
as large as the westward currents. The
study could help scientists better under-
stand the connection between magnetotail
activity and disturbances observed in the ion-
osphere. (Journal of Geophysical Research:
Space Physics, doi:10.1002/ 2014JA019863,
2014) —EB
What controls the reliefof rocky headlands?
Rocky headlands are a common feature of
coastlines but vary in their cross-shore “relief”
(i.e., how far a headland extends offshore
from the coastline), causing some coastlines
to be more sinuous and others smoother.
What controls headland relief? Most models
of headland relief are qualitative and focus on
the relationship between wave energy and
rock strength but leave out other factors.
Now, in a pair of companion papers,
Limber et al. describe a simple quantitative
model that includes wave energy and rock
strength as well as other factors such as the
production and distribution of beach sedi-
ment, variable lithology, and buffering of cliff
erosion by beach sediment.
The researchers used the model to explore
the evolution of headland shape and found
that headland amplitude is larger where there
are greater alongshore variations in rock
strength but smaller where there is more
Proposed satellite would
improve study of cloud physics
Aerosols can have a profound impact on
cloud formation and thus an impact on the
global climate. Cloud droplets forming
around aerosols tend to be smaller, increas-
ing the cloud’s ability to reflect radiation
back into space, thus shading the Earth.
However, how much light is scattered by
different types of aerosols and how that
relates to climate change still represent the
largest uncertainty in climate change
research.
In the past few years, some climate scien-
tists have suggested that a new satellite
capable of taking sensitive and complex
measurements of cloud microphysics could
improve understanding of aerosol- cloud
interactions by leaps and bounds. But is
building such an instrument even possible?
Rosenfeld et al. provide new research
demonstrating that one of the main compo-
nents of the proposed satellite—simultane-
ous measurement, from space, of the way
cloud droplets form around aerosol particles
and cloud microstructure—is possible. The
authors extrapolated the needed data from
satellite- based measurements and then com-
pared them to ground-based measurements,
which are traditionally used to study cloud-
aerosol interactions, and found that the sat-
ellite’s measurements were accurate.
The next step, the authors note, is to
assess whether collecting other required
measurements from space, such as wind
updraft speeds on the base of clouds, is
technically possible by satellite. (Geo-
physical Research Letters, doi:10.1002/
2014GL059453, 2014) —JW
NO
AA
/NW
S/J
erry
Pen
ry
Could detailed measurements of cloud microphysics improve scientific understanding of
aerosol-cloud interactions?
Scientists working on the ice streams that feed
into the Ross Sea.
Pou
l Chr
isto
ffers
en
Eos, Vol. 95, No. 35, 2 September 2014
© 2014. American Geophysical Union. All Rights Reserved.
sediment or more focusing of waves. The
authors also show how model results can
be compared to field observations, providing
a framework for studying natural coastline
evolution. (Journal of Geophysical Research:
Earth Surface, doi:10.1002/ 2013JF002950,
2014) —EB
Tracking the sources and sinksof Antarctica’s subglacial waterways
Deep beneath Antarctica’s kilometers-thick
layer of glacial ice is a complex network of
rivers and lakes. Research suggests that this
water may affect the flows of the southern
continent’s massive ice streams, though the
nature of its effect remains unclear. Adding
to scientists’ understanding of Antarctica’s
subglacial hydrology, Christoffersen et al. stud-
ied five ice streams that flow into the Ross
Sea.
Ice streams’ fast flow rates make them Ant-
arctica’s dominant contributors to sea level
rise. Ice streams tend to overlay glacial till,
loose sediments that create little frictional
drag, driving their fast flows. Subglacial water
is also thought to contribute, though how and
by how much is uncertain.
Using observations of ice motion, bedrock
topography, ice thickness, and sediment
thickness and an ice sheet model, the re-
searchers estimated the amount of water pro-
duced by the ice streams. Comparing these
quantities with the amount that flows through
pores in the underlying till layer and along
the rock surface, they found that the quan-
tity of water produced by each ice stream
is surprisingly low and that external hydro-
logical sources are needed to explain the ice
streams’ fast motion. For three of the ice
streams—Whillans, Mercer, and Kamb—the
researchers identified the external source as a
large subglacial groundwater reservoir. For
the two remaining ice streams, Bindschadler
and MacAyeal, the extra water was produced
in the ice sheet interior and moved to the ice
streams through the regional hydrological
network.
The authors found that the amount of
water flowing from the ice sheet interior to
the Whillans, Mercer, and Kamb ice streams
is insufficient to provide sustained fast flows.
The recent observed slowdown of these ice
streams should be attributed to increasing
friction between the ice and the rock bed
caused by strengthening and compaction of
the underlying glacial till, which is losing wa-
ter. (Geophysical Research Letters, doi:10.1002/
2014GL059250, 2013) —CS
Peering into the microphysicsof the Madden-Julian Oscillation
The onset of the active phase of the
Madden- Julian Oscillation (MJO) is marked
by the formation of a region of deep convec-
tion and enhanced precipitation over the
Indian Ocean. Generally persisting from 30 to
60 days as it progresses slowly eastward, the
MJO consists of wet active phases alternating
with suppressed periods of lower rainfall and
reduced storm activity.
Although the Madden- Julian Oscillation is
an important driver of intraseasonal weather
variability, especially in the tropics, many
competing hypotheses exist as to how or
why it forms. Even less is known about the
intricate details of what goes on inside the
storm clouds, where and how the clouds form,
and whether every active- phase storm is the
same.
In October, November, and December
2011, researchers used radar to determine
the type and arrangement of raindrops and
ice particles within the precipitating clouds.
Analyzing the radar output, Rowe and Houze
determined the distributions of these differ-
ent types of particles, identifying every-
thing from wet and dry snow to graupel and
drizzle. They found that while these distribu-
tions were generally similar, active- phase
storm clouds reached farther into the atmo-
sphere than clouds during inactive MJO
phases.
They found that during MJO active phases,
precipitating clouds not only extend to greater
altitudes but organize into large storm clusters
known as mesoscale convective systems.
Each stage of this process brings different dis-
tributions of the different types of precipi-
tation. The authors note that the October,
November, and December storms were not all
the same. The December active- phase storms
consisted of shallower mesoscale convection
and a lower concentration of melting snow
than the storms during the other active pe-
riods. The authors suggest that different wind,
humidity, and temperature profiles prevailed
during the December active phase, account-
ing for the differences. (Journal of Geophys-
ical Research: Atmospheres, doi:10.1002/
2013JD020799, 2014) —CS
How should fl ood risk assessmentsbe done in a changing climate?
Growing consensus on climate and land
use change means that it is reasonable to
assume, at the very least, that flood levels in a
region may change. Then why, ask Rosner
et al. in a new study, do the dominant risk
assessment techniques used to decide
whether to build new flood protection infra-
structure nearly always start with an assump-
tion of “no trend” in flood behavior?
In an argument grounded in an analysis of
the inherent limitations of statistical analyses,
the authors suggest that researchers’ typical
starting assumption that flood behavior is not
changing—even in the face of suspected
trends in extreme events and knowledge of
how difficult such trends are to detect—causes
water managers to undervalue flood pro-
tection benefits, opening the door to un-
necessary losses down the line.
When researchers assume no trend, statisti-
cal errors could cause them to overlook the
risks of underpreparing for changing flood
conditions. Often, potential flood damage due
to underpreparedness far exceeds the poten-
tial cost of overinvesting in flood protection
infrastructure. Flipping the process, starting
with an assumption that a change in flood
conditions is occurring rather than only con-
sidering the risk of wasting money on un-
needed infrastructure, would give critical
attention to the risk of underestimating future
floods.
The authors propose a method of risk
assessment that starts with the null hypoth-
esis of no trend but that explicitly assesses
the effect of statistical uncertainties that
may cause it to misidentify real trends and
the damages those trends might produce.
(Water Resources Research, doi:10.1002/
2013WR014561, 2014) —CS
A new earthquake model may explaindiscrepancies in San Andreas fault slip
Investigating the earthquake hazards of
the San Andreas fault system requires an
accurate understanding of accumulating
stresses and the history of past earthquakes.
Faults tend to go through an “earthquake
cycle”—locking and accumulating stress, rup-
turing in an earthquake, and locking again
in a well- accepted process known as “elastic
rebound.” One of the key factors in preparing
for California’s next “big one” is estimating
the fault slip rate, the speed at which one side
of the San Andreas fault is moving past the
other.
Broadly speaking, there are two ways geo-
scientists study fault slip. Geologists formulate
estimates by studying geologic features at
key locations to study slip rates through time.
Geodesists, scientists who measure the size
and shape of the planet, use technologies like
GPS and satellite radar interferometry to esti-
mate the slip rate, estimates which often differ
from the geologists’ estimations.
In a recent study, Tong et al. developed a
new three- dimensional viscoelastic earth-
quake cycle model that represents 41 major
fault segments of the San Andreas fault sys-
tem. While previous research has suggested
that there are discrepancies between the fault
slip rates along the San Andreas as measured
by geologic and geodetic means, the authors
found that there are no significant differences
between the two measures if the thickness
of the tectonic plate and viscoelasticity are
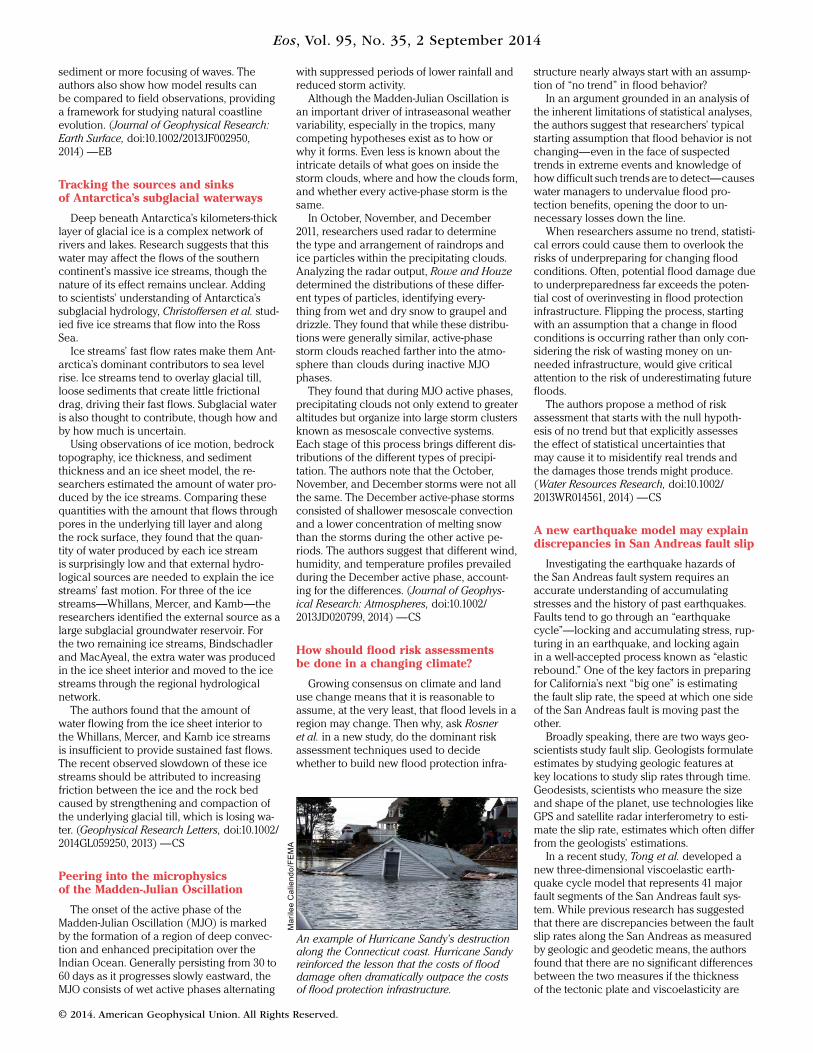
An example of Hurricane Sandy’s destruction
along the Connecticut coast. Hurricane Sandy
reinforced the lesson that the costs of flood
damage often dramatically outpace the costs
of flood protection infrastructure.
Mar
ilee
Cal
iend
o/FE
MA