E ffective June 18, 2013, we will be adding new investment options and making a few other changes to the Halliburton Retirement and Savings Plan investment option lineup. The changes are designed to simplify your investment decisions by providing an investment option with an asset mix appropriate for your age. Why is this important? Asset allocation is one of the key factors that can help you reach your goal: having enough for retirement, the longest vacation you will ever take. Invest too conservatively, and you may not have enough money to retire. Trust Talk Current news concerning your retirement plan Spring 2013 Invest too aggressively, and you face the risk of losing the money you saved. Halliburton is committed to providing you the building blocks you need for asset allocation, starting with a great selection of investment options, including new choices. You will be able to choose Target Date Portfolios; retirement portfolios that are professionally managed for you based on your age and expected retirement date. Alternatively, you may choose among 10 custom investment options to build your own retirement portfolio. New Investment Options Coming in June SPECIAL EDITION
Transcript
Effective June 18, 2013, we will be adding new investment options and making a few other changes to the Halliburton Retirement and Savings Plan investment option lineup. The changes are designed to simplify your investment decisions by providing
an investment option with an asset mix appropriate for your age. Why is this important? Asset allocation is one of the key factors that can help you reach your goal: having enough for retirement, the longest vacation you will ever take. Invest too conservatively, and you may not have enough money to retire.
TrustTalk Current news concerning your retirement plan
Spring 2013
Invest too aggressively, and you face the risk of losing the money you saved.
Halliburton is committed to providing you the building blocks you need for asset allocation, starting with a great selection of investment options, including new choices. You will be able to choose Target Date Portfolios; retirement portfolios that are professionally managed for you based on your age and expected retirement date. Alternatively, you may choose among 10 custom investment options to build your own retirement portfolio.
New Investment Options Coming in June
SPECIAL EDITION
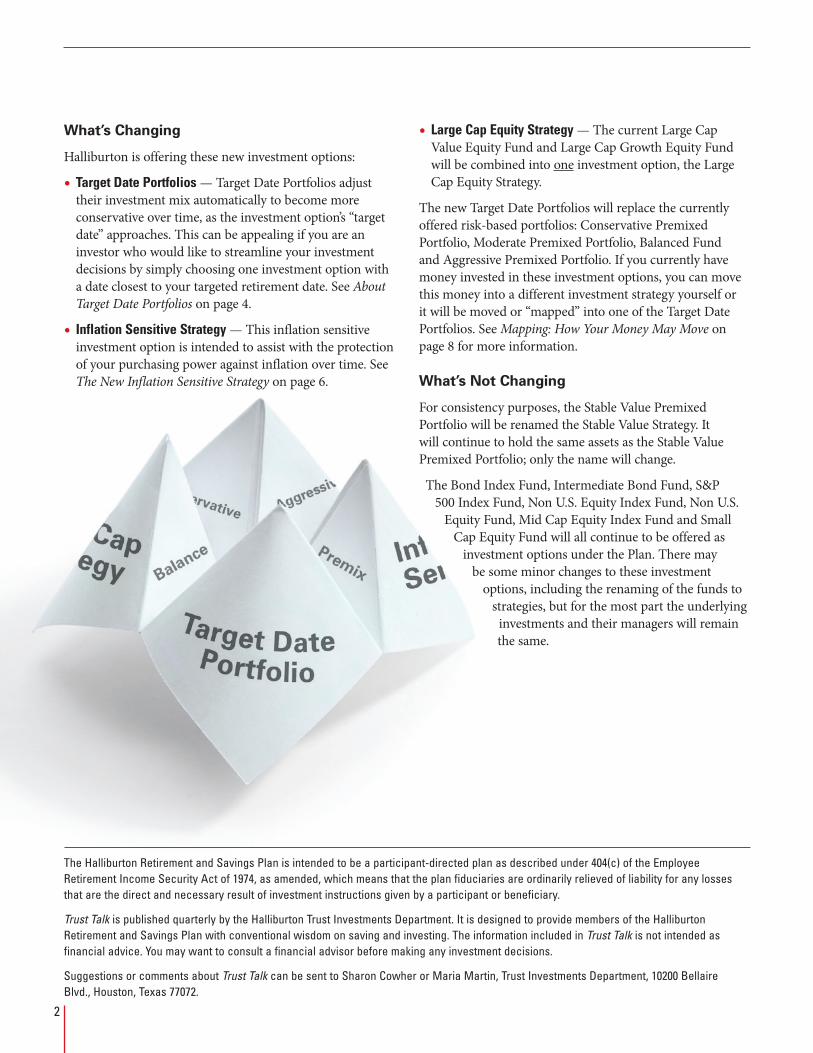
What’s Changing
Halliburton is offering these new investment options:
• Target Date Portfolios — Target Date Portfolios adjust their investment mix automatically to become more conservative over time, as the investment option’s “target date” approaches. This can be appealing if you are an investor who would like to streamline your investment decisions by simply choosing one investment option with a date closest to your targeted retirement date. See About Target Date Portfolios on page 4.
• Inflation Sensitive Strategy — This inflation sensitive investment option is intended to assist with the protection of your purchasing power against inflation over time. See The New Inflation Sensitive Strategy on page 6.
The Halliburton Retirement and Savings Plan is intended to be a participant-directed plan as described under 404(c) of the Employee Retirement Income Security Act of 1974, as amended, which means that the plan fiduciaries are ordinarily relieved of liability for any losses that are the direct and necessary result of investment instructions given by a participant or beneficiary.
Trust Talk is published quarterly by the Halliburton Trust Investments Department. It is designed to provide members of the Halliburton Retirement and Savings Plan with conventional wisdom on saving and investing. The information included in Trust Talk is not intended as financial advice. You may want to consult a financial advisor before making any investment decisions.
Suggestions or comments about Trust Talk can be sent to Sharon Cowher or Maria Martin, Trust Investments Department, 10200 Bellaire Blvd., Houston, Texas 77072.
• Large Cap Equity Strategy — The current Large Cap Value Equity Fund and Large Cap Growth Equity Fund will be combined into one investment option, the Large Cap Equity Strategy.
The new Target Date Portfolios will replace the currently offered risk-based portfolios: Conservative Premixed Portfolio, Moderate Premixed Portfolio, Balanced Fund and Aggressive Premixed Portfolio. If you currently have money invested in these investment options, you can move this money into a different investment strategy yourself or it will be moved or “mapped” into one of the Target Date Portfolios. See Mapping: How Your Money May Move on page 8 for more information.
What’s Not Changing
For consistency purposes, the Stable Value Premixed Portfolio will be renamed the Stable Value Strategy. It will continue to hold the same assets as the Stable Value Premixed Portfolio; only the name will change.
The Bond Index Fund, Intermediate Bond Fund, S&P 500 Index Fund, Non U.S. Equity Index Fund, Non U.S.
Equity Fund, Mid Cap Equity Index Fund and Small Cap Equity Fund will all continue to be offered as
investment options under the Plan. There may be some minor changes to these investment
options, including the renaming of the funds to strategies, but for the most part the underlying
investments and their managers will remain the same.
2
In mid-May, you will receive a mailing to your home with in-depth information about your investment options, Fact Sheets and Frequently Asked Questions, and details about how your current money and future contributions in the Conservative Premixed Portfolio, Moderate Premixed Portfolio, Balanced Fund, Aggressive Premixed Portfolio, Large Cap Growth Equity Fund and Large Cap Value Equity Fund may “map” or move into the new investment options. In the
meantime, review this high-level overview of upcoming important dates.
Time Period What Will Happen
Mid-May, 2013 You will receive more detailed information about the new investment options and mapping, mailed to your home address.
Now Until June 13, 2013 at 4:00 p.m. E.T.
Access your account and make any changes as usual.
No action is required, but if you have money in the Conservative Premixed Portfolio, Moderate Premixed Portfolio, Balanced Fund, Aggressive Premixed Portfolio, Large Cap Growth Equity Fund and/or Large Cap Value Equity Fund, and you do not make investment changes, your money in these investment options will automatically map during the black-out period. See page 8 for details.
Black-out Period from June 14 - June 17, 2013
There will be a brief “black-out” period from June 14 - June 17, 2013. Fidelity will be using this temporary period in preparation for getting the new options in place and moving balances from the current investments into the new investments. This means the last time you will be able to make changes before the black-out period will be Thursday, June 13 at 4:00 p.m. E.T. You will remain fully invested during the black-out period.
During the black-out period you cannot:•Change any investments you have in the Conservative Premixed Portfolio, Moderate Premixed
Portfolio, Balanced Fund, Aggressive Premixed Portfolio, Large Cap Growth Equity Fund or Large Cap Value Equity Fund.
•Request a loan, withdrawal or a distribution from the Halliburton Retirement and Savings Plan if you have money in the investment options listed above.
During the black-out period you can:•View your account.•Change any investments you have in the Stable Value Premixed Portfolio, Bond Index Fund,
Intermediate Bond Fund, S&P 500 Index Fund, Non U.S. Equity Index Fund, Non U.S. Equity Fund, Mid Cap Equity Index Fund or Small Cap Equity Fund.
•Request loans, withdrawals or a distribution if you do not have any money in the investment options that are being eliminated.
June 18, 2013 New investment options become available for investment. As you do now, you may change the way your money is invested, view your account, make contributions and other changes, and request loans and distributions as normal, subject to plan rules.
To view your account information, go to www.halliburton.com/totalrewards if you are an active employee (or, if you are a former employee, go to www.netbenefits.com) or call the Halliburton Benefits Center automated telephone system at (866) 321-0964.
Important Dates: What You Need to Know
I M P O R T A N T
I M P O R T A N T
I M P O R T A N T
I M P O R T A N T
Black-out Period from June 14 - June 17, 2013
Now until June 13, 2013
at 4:00 p.m. E.T.
Mid-May 2013
By June 18, 2013at 9:30 a.m E.T.
3
On June 18, 2013, Halliburton will add a set of new Target Date Portfolios to enhance our investment option lineup. The Target Date Portfolios have been custom-designed to provide a single retirement portfolio for those
participants who prefer to invest in one investment option that is professionally managed on their behalf. Investing in a Target Date Portfolio is like investing in a portfolio built for you. The idea is to simplify your investment decisions: just choose the Target Date Portfolio closest to your retirement date.
Built FOR You: How Target Date Portfolios Work
Target Date Portfolios are designed to provide an investment portfolio for individuals who will retire in or around a
About Target Date Portfolios certain target year. These investment options adjust their investment mix automatically to become more conservative over time, as the “target retirement date” approaches. This can be appealing to investors who would like to streamline their investment decisions. You select the Target Date Portfolio with the date closest to the year you plan to retire. For example, if you turn age 65 in 2029 and plan to retire that year, you might choose the 2030 Retirement Portfolio.
Each Target Date Portfolio will include a diversified investment mix of growth assets (i.e., stocks), income assets (i.e., bonds and short-term investments) and inflation sensitive assets. The investment mix is automatically adjusted by the professional investment manager (or “glide path” manager) over time to become more conservative as the target retirement year approaches.
Important!
Your account balance and future contributions to the current Conservative Premixed Portfolio, Moderate Premixed Portfolio, Balanced Fund and Aggressive Premixed Portfolio will move or “map” into one of the new Target Date Portfolios unless you take action.
In addition, if any portion of your account balance continues to be invested in the Large Cap Value Equity Fund or the Large Cap Growth Equity Fund, then these balances will be mapped into the Large Cap Equity Strategy unless you take action.
See page 8 for details.
TARGET DATE PORTFOLIO
HOW A TARGET DATE PORTFOLIO CHANGES OVER TIME
Early years Middle years Target years(when you’ll
need the money)
Low
Hig
hRi
sk
Growth
Income
Inflation Sensitive
4
When the targeted retirement date is far in the future, the portfolio emphasizes higher return and risk growth assets to maximize potential returns and asset accumulation during these saving years. As the targeted retirement date approaches, a Target Date Portfolio shifts its investment strategy over time to focus more on income assets so as to reduce risk and provide capital preservation.
The Halliburton Target Date Portfolios are designed to provide you with retirement savings not only at your retirement age, age 65, but through retirement. Since most people will live for at least 20 years after they retire, it is important to keep your retirement assets working even after retirement. This means keeping a reasonable proportion of your retirement portfolio in growth assets past the retirement age. Halliburton’s Target Date Portfolios are designed to reach their lowest risk level approximately 10 years after retirement.
As you can see from the chart below, someone who chooses the 2040 Retirement Portfolio today would be invested in 80% growth assets, and 4% income assets and 16% inflation sensitive assets, since the 2040 “target” is still very far away.
By contrast, someone who is age 63 now and chooses the 2015 Retirement Portfolio will have an anticipated asset mix, today, of 54% growth assets, 34% income assets and 12% inflation sensitive assets. Over time, the 2015 Retirement Portfolio, like all Target Date Portfolios, will shift to a more conservative asset mix. It would be expected to reach its most conservative asset allocation, generally, 10 years after the target date – in 2025, in this case. At that point, the target asset allocation will include approximately 16% growth assets, 58% income assets and 26% inflation sensitive assets.
As You Review Target Date Portfolios, take into consideration that this investment option can help take some time, stress and guesswork out of selecting and managing investment choices. You will still need to monitor and review your account to ensure it is meeting your retirement savings goals, but the Target Date Portfolios make it a little easier.
Unlike the current premixed portfolios, with a Target Date Portfolio, you do not need to take any action to move your current balances from more aggressive assets to more conservative assets as your expected retirement date approaches. The Target Date Portfolio automatically shifts investment strategy from growth assets to income assets based on a predetermined “glide path” designed for Halliburton participants. The Halliburton Company Investment Committee has selected Mercer Investments, LLC as the glide path manager for the new Target Date Portfolios.
Target Date Portfolios are not right for everyone; you may want to build and maintain your own retirement portfolio. But for investors who want a portfolio built for them, Target Date Portfolios can be very appealing. See Choose the Right Investments for You on page 7.
For those participants who prefer more choice and who would like to build their own retirement portfolio, Halliburton will continue to offer single-focus funds, which will now be referred to as the single focus strategies. To enhance the single-focus strategy line-up, an Inflation
The New Inflation Sensitive Strategy
Inflation can lower the real buying power of your money. That is why it is important that long-term investors factor inflation risk into their planning. The Inflation Sensitive Strategy is a new investment option that aims to:
•Help participants with a way to potentially increase diversification,
•Protect purchasing power against the effects of inflation, and
•Enhance long-term returns by seeking real (inflation-adjusted) returns by investing in real assets (commodities, precious metals and real estate), as well as Treasury Inflation-Protected Securities (TIPS).
Sensitive Strategy will be added, and the current Large Cap Value Equity Fund and Large Cap Growth Equity Fund will be combined into one investment option, the Large Cap Equity Strategy.
Evaluating Risk
As with any of the investment options under the Plan, the principal value of a Target Date Portfolio is not guaranteed at any time, including at the targeted retirement date. Although the Target Date Portfolios are intended to help simplify investing, it is important to be aware that all investments carry the risk that you could lose money. Target Date Portfolios use strategies to manage risk, such as diversification and asset allocation, but like all investments, they are subject to performance of the underlying investments, which can go up or down in value at any time. Returns are not guaranteed.
There is also a risk that you will not have enough money to retire. This could happen if you don’t contribute enough, your investments do not grow or if they do not grow enough to outpace the rate of inflation. Over time, a disciplined contribution and investment strategy can help deal with this type of risk. Consider talking to an investment professional as you review the new investment options, including discussing other money that you may be entitled to at retirement such as social security, IRAs or other employer retirement plans in which you have participated.
6
As you consider how to invest your money, you may want to start by thinking about what type of investor you are. Do you prefer Target Date Portfolios built for you or do you prefer a portfolio built by you, taking direct control of the investment of your assets? With the introduction of the new Target Date Portfolios later this year, now is the time to think about what type of investor you are.
Do you prefer a portfolio... What investment option might be best for you?
Built FOR me?Do you like the way the Target Date Portfolios can help simplify your investment choices? Each Target Date Portfolio starts out more growth-oriented and then becomes more conservative as the target date approaches, adjusting the investment mix based on the target retirement date.
One of the new Target Date Portfolios might appeal to you. Just choose the one with the target date closest to the year you plan to retire.
Your actual retirement date might be different from the name of the option: for example, if you reach age 65 in 2029 and plan to retire in that year, the 2030 Retirement Portfolio is the closest to your estimated retirement year.
If you plan to retire before or after age 65, choose the Target Date Portfolio with the date closest to your actual anticipated retirement date. If you are over age 65, you may want to consider the 2010 Retirement Portfolio, 2005 Retirement Portfolio or the Income Retirement Portfolio.
If your retirement date falls between two Target Date Portfolios, you could choose to split your money between them. For instance, if you plan to retire in 2032, you could put some of your money in the 2030 Retirement Portfolio and the rest in the 2035 Retirement Portfolio. Experts strongly advise against investing in more than two Target Date Portfolios.
Built BY me?Do you prefer to build a diversified portfolio, choosing from custom investment options across major asset classes with high-quality investment managers?
Choose among 10 single focus strategies to build a diversified portfolio with an appropriate asset allocation based on your tolerance for risk, time horizon and investment goals.
Whatever your investment style — if you want to one-stop shop or do it yourself — it’s important to review your investments periodically to ensure your investment decisions support your retirement goals.
Choose the Right Investments for You
7
When the new investment options become available on June 18, some of your investments (if you do not take action before that date) may move or “map” to the new investment options. You will receive
specific information in May about how your investments will map. Here is a high-level overview of how it will work:
If you do not currently have money invested in the Balanced Fund, the Aggressive, Moderate or Conservative Premixed Portfolios, Large Cap Value Equity Fund and/or Large Cap Growth Equity Fund, your money will stay
Mapping: How Your Money May Move
invested where you currently have it — mapping will not apply to you.
If you have money invested in either the Large Cap Value Equity Fund or the Large Cap Growth Equity Fund and you do not take action, this money and any future contributions directed to go to the Large Cap Value Equity Fund or Large Cap Growth Equity Fund will be mapped into the new Large Cap Equity Strategy effective June 18.
If you have current balances (or future contributions) in the Balanced Fund and/or the Aggressive, Moderate
Current Investment Options New Investment Options
Conservative Premixed Portfolio
Moderate Premixed Portfolio
Balanced Fund
Aggressive Premixed Portfolio
The Target Date Portfolio closest to when you reach age 65.
If you are over age 65, your balances will be mapped to the 2010 Retirement Portfolio, 2005 Retirement Portfolio or the Income Retirement Portfolio. You will receive more information about how your balances will map in May.
Large Cap Value Equity Fund
Large Cap Growth Equity FundLarge Cap Equity Strategy
Balances and future contributions will map to:
Balances and future contributions will map to:
Target Date Portfolio
Retirement PortfolioLarge Cap Equity S
trategy
8
Newsstand
or Conservative Premixed Portfolios and do not take action, this money will be automatically “mapped” during the black-out period into the Target Date Portfolio with the target date closest to the year when you will turn age 65. For example, if you were born in 1972, you will turn age 65 in the year 2037 and your current balances and any future contributions will map automatically into the 2035 Retirement Portfolio (which is closest to 2037).
If you do not want your balances to be mapped as described here, you can make a different investment election as long as you do so before the black-out period begins on June 13, 2013 at 4:00 p.m. E.T. To make changes, go to www.halliburton.com/totalrewards (if you are a former employee, go to www.netbenefits.com). If your contributions are going to any of the options that are changing, your contributions will get mapped to the new options. Therefore, you will need to transfer your balances
Target Date Portfolio
Retirement PortfolioLarge Cap Equity S
trategy
AND change your future contribution investment elections before June 13 at 4:00 p.m. E.T. Of course, you can also move your balance anytime after the black-out period ends.
Take Notice: Default Investment Change
Effective June 18, 2013, the Target Date Portfolios will replace the Moderate Prefixed Portfolio as the Qualified Default Investment Alternative (QDIA) under the plan. In accordance with applicable law, your account balance, if you do not have investment elections on file, will automatically be invested in the Target Date Portfolio that closely aligns with your date of birth and expected retirement date at age 65. Please refer to the Auto Enrollment and QDIA Notice for further information. They are posted on www.halliburton.com/totalrewards (if you are a former employee, go to www.netbenefits.com).
9
As you review the new investment options and decide how to invest your money going forward, you will need to take into consideration your asset allocation — how you will divide your investment among different asset classes to
protect your portfolio from major ups and down. The new Target Date Portfolios manage this for you, if you choose to invest in them. Whether you like this approach or prefer to build your own portfolio, now is a good time to evaluate your asset allocation strategy and future financial goals.Fidelity offers an Investor Profile Questionnaire that you can use to help make investment decisions and it takes only 10 minutes to complete. To access the worksheet, go
to www.halliburton.com/totalrewards (former employees should go to www.netbenefits.com), select “Tools & Resources” on the home page. Then under “Related Items” on the right choose “Investor Profile Questionnaire.”
To manage your asset allocation and/or to change your contributions, go to www.halliburton.com/totalrewards, login and select “Wealth.” Once you are on the Halliburton Retirement and Savings Plan screen, click on “Change Investments” located on the left side of the screen. Former employees should go to www.netbenefits.com.
Investment Resources
Stable Value Premixed Portfolio – Name Change Only
For consistency purposes, the Stable Value Premixed Portfolio will be renamed the Stable Value Strategy in June. Only the name will change. The Stable Value Strategy will continue to hold the same assets as the Stable Value Premixed Portfolio.
10
Newsstand
negative returns for the quarter. The index’s top performers included the financials (+5.1%), industrials (+4.9%) and the materials (+3.3%) sectors, while results posted by the telecommunications (-5.6%) and information technology (-5.2%) sectors were not as strong.
International equities generally outperformed domestic equities for the quarter, as well as for the year. Strains on the Eurozone continued to ease throughout the fourth quarter, as central banks across the world declared that they would support their regions with unlimited capital. Within the
emerging markets, preliminary reports indicating a recovery in China’s industrial sector and rising housing prices aided their momentum. The structural growth outlook for emerging economies remains attractive, as they are not exposed to the same debt issues as the developed world. Europe, on the other hand, continues to face an ongoing headwind and is likely to remain in a recession for at least the first half of 2013.
Within fixed income markets, the Fed purchased more long-term Treasuries on top of its existing mortgage-backed securities purchases. This policy is expected to increase the Fed’s balance by more than a third in 2013. Despite this, the yield on the 10-year Treasury increased slightly during the fourth quarter, rising 1.65% to 1.78%.
Consequently, fixed income performance was mixed for the trailing three-month period. As investors sought out yield, credit spreads narrowed significantly throughout the year. Corporate bonds outperformed Treasuries with riskier fixed income products posting the strongest results, largely due to investors’ lack of opportunities in higher quality fixed income products. For the fourth quarter, the Barclays Capital U.S. Aggregate Index returned 0.2%, the Barclays Capital High Yield Index rose 3.3% and the Barclays U.S. TIPS Index was up 0.7%, despite the increase in real yields. Conversely, U.S. Treasuries (-0.1%) and mortgage-back securities (-0.2%) posted negative returns for the quarter, but still finished positive for the year.
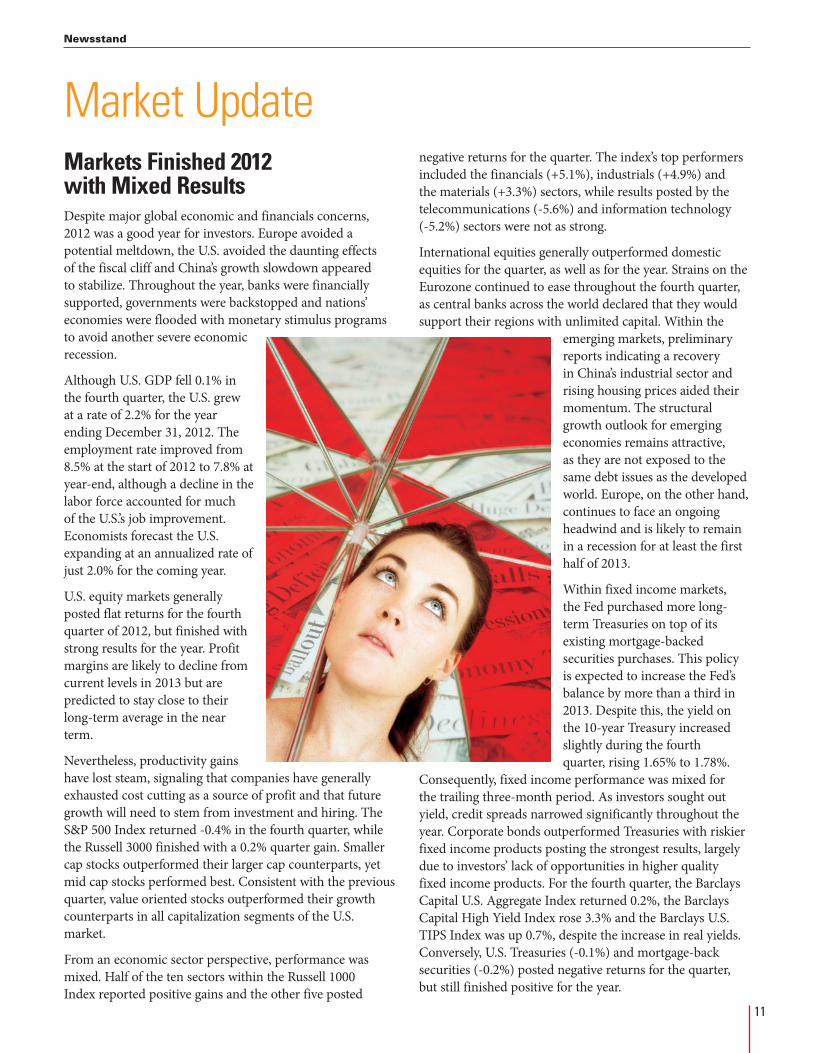
Markets Finished 2012 with Mixed ResultsDespite major global economic and financials concerns, 2012 was a good year for investors. Europe avoided a potential meltdown, the U.S. avoided the daunting effects of the fiscal cliff and China’s growth slowdown appeared to stabilize. Throughout the year, banks were financially supported, governments were backstopped and nations’ economies were flooded with monetary stimulus programs to avoid another severe economic recession.
Although U.S. GDP fell 0.1% in the fourth quarter, the U.S. grew at a rate of 2.2% for the year ending December 31, 2012. The employment rate improved from 8.5% at the start of 2012 to 7.8% at year-end, although a decline in the labor force accounted for much of the U.S.’s job improvement. Economists forecast the U.S. expanding at an annualized rate of just 2.0% for the coming year.
U.S. equity markets generally posted flat returns for the fourth quarter of 2012, but finished with strong results for the year. Profit margins are likely to decline from current levels in 2013 but are predicted to stay close to their long-term average in the near term.
Nevertheless, productivity gains have lost steam, signaling that companies have generally exhausted cost cutting as a source of profit and that future growth will need to stem from investment and hiring. The S&P 500 Index returned -0.4% in the fourth quarter, while the Russell 3000 finished with a 0.2% quarter gain. Smaller cap stocks outperformed their larger cap counterparts, yet mid cap stocks performed best. Consistent with the previous quarter, value oriented stocks outperformed their growth counterparts in all capitalization segments of the U.S. market.
From an economic sector perspective, performance was mixed. Half of the ten sectors within the Russell 1000 Index reported positive gains and the other five posted
The table below includes important information to help you compare the investment options under your retirement plan. It shows how the investment options have performed over time and allows you to compare them with an appropriate benchmark for the same time periods. Keep in mind that you cannot invest in the benchmark indices, which are set forth in italics on the chart underneath the name of each investment option.
* The Moderate Premixed Portfolio was selected as the default investment option in accordance with the guidelines set by federal law if participants do not have an investment election on file.** Where the investment option has been in existence for less than 10-years, performance provided is for the Life of the investment option, which is since the inception date.*** Represents actual expenses since the July 31, 2012 inception date.**** Most investment options use institutionally managed separate accounts; this means the accounts are managed only for participants in the Halliburton Plans. Individual securities are bought
and sold by professional investment managers selected by the Investment Committee. Collective Trusts are investment vehicles operated by banks or trust companies. Neither collective trust funds nor separate accounts are mutual funds. Unlike mutual funds, separate accounts and collective trust funds are not subject to and are not registered under the Securities Act of 1933 or the Investment Company Act of 1940.
Trading Restrictions focuses on what is known as a “round-trip” transaction. A round-trip is an exchange into and out of the same investment option, in excess of $1,000, within 30 days. Under the Policy, participants are limited to one round-trip transaction in any investment option within any rolling 90-day period, subject to an overall limit of four round-trip transactions across all investment options over a rolling 12-month period. The Policy governing the Stable Value Premixed Portfolio (SVPP) works differently. If money is transferred or reallocated into the SVPP, the number of units acquired in the transaction cannot be transferred out of the SVPP for 30 calendar days. However, any units already in the SVPP prior to the transaction are not subject to the 30-day waiting period.
Annualized Net of Fees Returns as of March 31, 2013 Annual Net of Fees Return
Annual Turnover Ratio as of
December 31, 2012
Expense One Year Ending March 31, 2013
Investment Option Name / Benchmark Name 1-Year 3-Years 5-Years10-Years /Life ** 2008 2009 2010 2011 2012 Inception Date
Management Style
Investment Structure ****
Market Risk
Inflation Risk
Potential Return % of Assets
Per $1,000 Invested
STABLE VALUEStable Value Premixed Portfolio 3.4% 3.5% 3.9% 4.5% 5.4% 4.2% 3.6% 3.6% 3.3% 880% 1/2/87 Active Separate Account Low High Low 0.52% $5.20 Hueler Stable Value Pooled Fund Universe 2.1% 2.6% 3.0% 3.8% 4.6% 3.1% 3.1% 2.7% 2.3%90 Day TBills 0.1% 0.1% 0.4% 1.8% 2.1% 0.2% 0.1% 0.1% 0.1%BONDSBond Index Fund 3.6% 5.4% 5.4% 4.9% 5.4% 5.9% 6.4% 7.7% 4.0% 60% 4/1/99 Passive Collective Trust Low High Low 0.15% $1.50 Barclays Capital US Aggregate Bond Index 3.8% 5.5% 5.5% 5.0% 5.2% 5.9% 6.5% 7.8% 4.2%Intermediate Bond Fund ** n/a n/a n/a 1.7% n/a n/a n/a n/a n/a 16% 7/31/12 Active Separate Account Low High Low 0.13% *** $ 1.30 *** Barclays Capital US Aggregate Bond Index n/a n/a n/a 0.3% n/a n/a n/a n/a n/aBLENDED FUNDSConservative Premixed Portfolio (CPP) ** 7.1% 7.2% 5.7% 5.8% -15.9% 19.8% 10.1% 1.0% 9.9% 242% 1/2/06 Active Separate Account Medium Medium Low 0.40% $4.00 26% Russell 3000, 12% MSCI ACWI ex. U.S., 20% BarCap US Aggregate, 4% BofA ML High Yield Bond, 38% Hueler Stable Value Pooled Fund Universe
7.0% 6.7% 4.8% 5.3% -15.6% 16.8% 9.2% 1.5% 8.6%
Moderate Premixed Portfolio (MPP) * 10.4% 10.3% 6.7% 9.6% -29.2% 31.1% 14.7% 0.2% 14.9% 364% 1/2/87 Active Separate Account Medium Medium Medium 0.51% $5.10 43.5% Russell 3000, 18.5% MSCI ACWI ex. U.S., 33% BarCap US Aggregate, 5% BofA ML High Yield Bond
9.9% 9.1% 5.5% 8.6% -26.3% 24.8% 12.7% 0.8% 12.5%
Balanced Fund 12.0% 10.2% 6.5% 9.3% -22.3% 22.2% 10.9% 3.8% 12.5% 38% 4/1/99 Active Separate Account Medium Medium Medium 0.28% $2.80 65% S&P 500, 35% BarCap US Aggregate 10.5% 10.4% 6.1% 7.6% -24.1% 19.4% 12.5% 4.4% 11.9%STOCKSAggressive Premixed Portfolio (APP) 12.4% 11.6% 5.4% 10.6% -41.0% 34.7% 17.5% -3.6% 18.5% 55% 1/3/94 Active Separate Account High Low High 0.59% $5.90 70% Russell 3000, 30% MSCI ACWI ex. U.S. 12.7% 10.4% 4.3% 10.0% -39.9% 32.6% 15.1% -3.7% 16.6%S&P 500 Index Fund 13.8% 12.5% 5.7% 8.4% -37.0% 26.4% 15.0% 2.0% 15.9% 4% 4/1/99 Passive Collective Trust High Low High 0.13% $1.30 S&P 500 Index 14.0% 12.7% 5.8% 8.5% -37.0% 26.5% 15.1% 2.1% 16.0%Large Cap Growth Equity Fund 7.9% 12.8% 5.3% 7.8% -42.4% 31.8% 15.5% 1.0% 18.1% 40% 4/1/99 Active Separate Account High Low High 0.51% $5.10 Russell 1000 Growth Index 10.1% 13.1% 7.3% 8.6% -38.4% 37.2% 16.7% 2.6% 15.3%Large Cap Value Equity Fund 18.9% 13.0% 5.7% 9.3% -38.5% 23.1% 16.8% -1.3% 19.0% 89% 4/1/99 Active Separate Account High Low High 0.51% $5.10 Russell 1000 Value Index 18.8% 12.7% 4.8% 9.2% -36.8% 19.7% 15.5% 0.4% 17.5%Non US Equity Index Fund ** n/a n/a n/a 15.7% n/a n/a n/a n/a n/a 5% 7/31/12 Passive Collective Trust High Low High 0.05% *** $ 0.50 *** MSCI All Country World ex. U.S. Index n/a n/a n/a 15.7% n/a n/a n/a n/a n/aNon US Equity Fund 9.9% 6.9% 1.3% 12.2% -44.1% 40.5% 13.4% -11.8% 20.2% 39% 4/1/99 Active Separate Account High Low High 0.59% $5.90 MSCI All Country World ex. U.S. Index 8.4% 4.4% -0.4% 10.8% -47.1% 37.4% 8.4% -16.1% 16.8%Mid Cap Equity Index Fund ** 17.7% 14.9% 9.7% 8.3% -36.2% 37.0% 26.4% -1.9% 17.7% 14% 1/3/05 Passive Collective Trust High Low High 0.15% $1.50 S&P MidCap 400 Index 17.8% 15.1% 9.9% 8.5% -36.2% 37.4% 26.6% -1.7% 17.9%Small Cap Equity Fund 13.1% 11.6% 9.2% 10.5% -37.3% 41.3% 27.6% -5.1% 10.7% 97% 4/1/99 Active Separate Account High Low High 0.87% $8.70 Russell 2000 Index 16.3% 13.5% 8.2% 11.5% -33.8% 27.2% 26.9% -4.2% 16.3%
12
Fees and Expenses include all charges to the investment options except for individual service that a participant may select such as overnight mailing fees of $25 per transaction. The investment option does not charge fees to contribute, transfer or withdraw from the option. Investment option performance is compared with benchmark index. Indices are unmanaged portfolios of specified securities and the indices do not reflect any initial or ongoing expenses. The investment option’s portfolio may differ significantly from the securities in the indices. Investment performance is determined after fees are charged to the options and assumes reinvestment of dividends and capital gains. Transaction costs incurred for buying and selling securities becomes part of the cost basis of the securities and are not included in the expense ratio. These costs, along with management fees, plan administration fees and other fees are paid out of the investment option’s assets, reducing the rate of return realized by participants. Cumulative effect of fees and expenses can substantially reduce the growth of a participant’s retirement account. Participants are encouraged to visit the Employee Benefits Security Administration website at: www.dol.gov/ebsa/publications/401k_employee.html for information and example demonstrating the long-term effect of fees and expenses. Fees and expenses are only one of several factors that participants and beneficiaries should consider when making investment decisions.
Plan Administrator: Halliburton Company Benefits Committee - 2107 City West Blvd., Bldg 2.601A Houston, TX 77042-3051, telephone number (281) 575-3000.
To direct or change your Plan investment options or for current information, including month-end performance and free paper copy of available information, please visit www.halliburton.com/totalrewards (if you are a current employee) or www.netbenefits.com (if you are a former employee). You may also call the Halliburton Benefits Center at (866) 321-0964 (international toll free, use your country’s AT&T access code, then (866) 321-0964) or for toll call (857) 362-5980, select option 2. Mailing address is Fidelity Investments, P.O. Box #770003, Cincinnati, OH 45277-0065.
Annualized Net of Fees Returns as of March 31, 2013 Annual Net of Fees Return
Annual Turnover Ratio as of
December 31, 2012
Expense One Year Ending March 31, 2013
Investment Option Name / Benchmark Name 1-Year 3-Years 5-Years10-Years /Life ** 2008 2009 2010 2011 2012 Inception Date
Management Style
Investment Structure ****
Market Risk
Inflation Risk
Potential Return % of Assets
Per $1,000 Invested
STABLE VALUEStable Value Premixed Portfolio 3.4% 3.5% 3.9% 4.5% 5.4% 4.2% 3.6% 3.6% 3.3% 880% 1/2/87 Active Separate Account Low High Low 0.52% $5.20 Hueler Stable Value Pooled Fund Universe 2.1% 2.6% 3.0% 3.8% 4.6% 3.1% 3.1% 2.7% 2.3%90 Day TBills 0.1% 0.1% 0.4% 1.8% 2.1% 0.2% 0.1% 0.1% 0.1%BONDSBond Index Fund 3.6% 5.4% 5.4% 4.9% 5.4% 5.9% 6.4% 7.7% 4.0% 60% 4/1/99 Passive Collective Trust Low High Low 0.15% $1.50 Barclays Capital US Aggregate Bond Index 3.8% 5.5% 5.5% 5.0% 5.2% 5.9% 6.5% 7.8% 4.2%Intermediate Bond Fund ** n/a n/a n/a 1.7% n/a n/a n/a n/a n/a 16% 7/31/12 Active Separate Account Low High Low 0.13% *** $ 1.30 *** Barclays Capital US Aggregate Bond Index n/a n/a n/a 0.3% n/a n/a n/a n/a n/aBLENDED FUNDSConservative Premixed Portfolio (CPP) ** 7.1% 7.2% 5.7% 5.8% -15.9% 19.8% 10.1% 1.0% 9.9% 242% 1/2/06 Active Separate Account Medium Medium Low 0.40% $4.00 26% Russell 3000, 12% MSCI ACWI ex. U.S., 20% BarCap US Aggregate, 4% BofA ML High Yield Bond, 38% Hueler Stable Value Pooled Fund Universe
7.0% 6.7% 4.8% 5.3% -15.6% 16.8% 9.2% 1.5% 8.6%
Moderate Premixed Portfolio (MPP) * 10.4% 10.3% 6.7% 9.6% -29.2% 31.1% 14.7% 0.2% 14.9% 364% 1/2/87 Active Separate Account Medium Medium Medium 0.51% $5.10 43.5% Russell 3000, 18.5% MSCI ACWI ex. U.S., 33% BarCap US Aggregate, 5% BofA ML High Yield Bond
9.9% 9.1% 5.5% 8.6% -26.3% 24.8% 12.7% 0.8% 12.5%
Balanced Fund 12.0% 10.2% 6.5% 9.3% -22.3% 22.2% 10.9% 3.8% 12.5% 38% 4/1/99 Active Separate Account Medium Medium Medium 0.28% $2.80 65% S&P 500, 35% BarCap US Aggregate 10.5% 10.4% 6.1% 7.6% -24.1% 19.4% 12.5% 4.4% 11.9%STOCKSAggressive Premixed Portfolio (APP) 12.4% 11.6% 5.4% 10.6% -41.0% 34.7% 17.5% -3.6% 18.5% 55% 1/3/94 Active Separate Account High Low High 0.59% $5.90 70% Russell 3000, 30% MSCI ACWI ex. U.S. 12.7% 10.4% 4.3% 10.0% -39.9% 32.6% 15.1% -3.7% 16.6%S&P 500 Index Fund 13.8% 12.5% 5.7% 8.4% -37.0% 26.4% 15.0% 2.0% 15.9% 4% 4/1/99 Passive Collective Trust High Low High 0.13% $1.30 S&P 500 Index 14.0% 12.7% 5.8% 8.5% -37.0% 26.5% 15.1% 2.1% 16.0%Large Cap Growth Equity Fund 7.9% 12.8% 5.3% 7.8% -42.4% 31.8% 15.5% 1.0% 18.1% 40% 4/1/99 Active Separate Account High Low High 0.51% $5.10 Russell 1000 Growth Index 10.1% 13.1% 7.3% 8.6% -38.4% 37.2% 16.7% 2.6% 15.3%Large Cap Value Equity Fund 18.9% 13.0% 5.7% 9.3% -38.5% 23.1% 16.8% -1.3% 19.0% 89% 4/1/99 Active Separate Account High Low High 0.51% $5.10 Russell 1000 Value Index 18.8% 12.7% 4.8% 9.2% -36.8% 19.7% 15.5% 0.4% 17.5%Non US Equity Index Fund ** n/a n/a n/a 15.7% n/a n/a n/a n/a n/a 5% 7/31/12 Passive Collective Trust High Low High 0.05% *** $ 0.50 *** MSCI All Country World ex. U.S. Index n/a n/a n/a 15.7% n/a n/a n/a n/a n/aNon US Equity Fund 9.9% 6.9% 1.3% 12.2% -44.1% 40.5% 13.4% -11.8% 20.2% 39% 4/1/99 Active Separate Account High Low High 0.59% $5.90 MSCI All Country World ex. U.S. Index 8.4% 4.4% -0.4% 10.8% -47.1% 37.4% 8.4% -16.1% 16.8%Mid Cap Equity Index Fund ** 17.7% 14.9% 9.7% 8.3% -36.2% 37.0% 26.4% -1.9% 17.7% 14% 1/3/05 Passive Collective Trust High Low High 0.15% $1.50 S&P MidCap 400 Index 17.8% 15.1% 9.9% 8.5% -36.2% 37.4% 26.6% -1.7% 17.9%Small Cap Equity Fund 13.1% 11.6% 9.2% 10.5% -37.3% 41.3% 27.6% -5.1% 10.7% 97% 4/1/99 Active Separate Account High Low High 0.87% $8.70 Russell 2000 Index 16.3% 13.5% 8.2% 11.5% -33.8% 27.2% 26.9% -4.2% 16.3%
13
Annual Return – The amount an investment changes in value over a one-year period.
Annualized Return – The amount an investment changes in value over a specified period of time, expressed in annual terms.
Asset-Backed Investment Contracts/Synthetic Guaranteed Investment Contract (GIC) – Instruments designed specifically for use in employer-sponsored qualified retirement plans. The contracts are issued by financial institutions such as banks or insurance companies. Securing the contract is a portfolio of securities or underlying assets. In the case of the Stable Value and Conservative Premixed Portfolios, for example, large portions of the assets backing the contracts are bonds. These bonds provide for a specific rate of return over a specified period. The trustee has custody of all these bonds. Therefore, if the financial institution runs into trouble, there is a diversified portfolio of bonds to mitigate losses.
BarCap US Agg Bond TR USD is the Barclays Capital US Aggregate Bond Total Return USD Index – It is commonly used as a benchmark to measure investment performance relative to the U.S. dollar-denominated investment grade fixed-rate taxable bond market. The index currently includes U.S. Treasuries, government-related issues, corporate bonds, agency mortgage-backed pass-throughs (MBS), consumer asset-backed securities (ABS) and commercial mortgage-backed securities (CMBS).
Benchmark – A measurement of the performance of the overall bond or stock market or a particular market segment.
Bond – A debt security in which an investor loans money to an entity (corporate or governmental) for a defined period of time at a fixed interest rate. Bonds are used by companies, municipalities, states and U.S. and foreign governments to finance a variety of projects and activities. Bonds are commonly referred to as fixed-income securities.
Credit Quality – A rating of a company’s ability to repay its obligations.
Diversification – The process of spreading your savings across more than one type of investment. Diversification helps reduce market risk and protects against the volatility that can result from putting your entire savings in one type of investment.
Equity – A term that means having “ownership” in something. Stocks are considered equity investments because you, as an investor, have a stake in that company.
Expense Ratio – The amount of an investment option’s operating expenses compared with its total asset base, expressed as a percentage. Because these expenses are paid from plan assets, a lower expense ratio is desirable.
Glide path – The glide path refers to the asset changes that will be made over time in the Target Date Portfolios. The glide path specifies what the asset allocation of each Target Date Portfolio should be as the target retirement year approaches. The term glide path is used because the asset allocation of each fund will glide down over time toward a lower risk portfolio as the retirement date approaches.
Glide Path Manager – The glide path manager is responsible for the design and management of the asset allocations in the Target Date Portfolios. The glide path manager designs the glide path for each Target Date Portfolio based on Halliburton’s employee profile and benefit plan design. This design is reviewed and updated to incorporate changes in Halliburton’s employees and plans as well as changes in the capital markets and investment environment. The glide path manager is responsible for ensuring that the actual allocation of the Target Date Portfolio is consistent with the targeted glide path, and making adjustments by rebalancing the Target Date Portfolio as necessary.
Growth – Growth investors buy stock in companies with excellent potential for sales and earnings growth. Growth investors typically seek to maximize capital gains. New companies, industries and markets are exciting to growth investors because they believe these companies are capable of achieving strong sales and earnings performance. Dividend payments are not
emphasized as companies prefer to reinvest earnings into capital projects.
Growth Assets – Growth Assets refers to the broad category of investments that are expected to have a return that significantly exceeds inflation. These assets are used to grow that portfolio’s value over the long term. Growth Assets typically have high levels of short term volatility, so the investment return in any one year may swing significantly. Over time these ups and downs are expected to balance out and result in long term capital growth. Growth Assets are appropriate for investors with a long time horizon who can afford to ride out short term (three years for example) periods of negative returns without needing to sell the investment.
Hueler Stable Value Pooled Fund Index - A broadly used stable value benchmark. The index represents approximately 75% of the stable value pooled funds available to the marketplace. Stable value pooled funds are only available to investors through employer sponsored retirement plans.
Income Assets – Income Assets refers to lower return/lower risk investments that are intended to provide a stable asset value and provide a stream of earnings from interest income. Bonds and stable value are the typical income asset. Income Assets are not expected to generate returns that are significantly above inflation, but they generally do not decline significantly in value either. They are therefore used when the investor approaches and enters retirement, when safety of principal begins to outweigh growth of principal.
Inflation Risk – The likelihood that an investment’s growth will not keep pace with inflation. Inflation is the rate at which the general level of prices for goods and services is increasing. If the inflation rate grows faster than your investment’s rate of return, it can cause your savings – and your purchasing power – to erode substantially. To maintain your purchasing power, you need to earn a rate of return higher than the inflation rate.
Terms to Know
14
Management Fees – Management fees are paid out of the investment option assets to investment managers who are responsible for the strategy and specific investment buying and selling decisions of their account.
Market Capitalization – The total value of a company’s outstanding shares in the stock market, calculated by multiplying the total number of shares by the price per share.
Market Risk – The likelihood that an investment will go up and down in value, especially over the short term. Investment options with higher market risk tend to have more dramatic ups and downs in value. Yet, historically, investment options with higher market risk offer the potential for greater returns.
MSCI (Morgan Stanley Capital International) All Country World Index (ACWI) ex. U.S. USD – An index of non-U.S. stock securities listed on the stock exchanges of developed and emerging markets.
Plan Administration Fees – Plan administration fees are paid out of the investment option assets for recordkeeping and check-writing services.
Principal – The original sum of money invested.
Rate of Return – The amount an investment changes in value over a period of time expressed as a percentage of the amount invested.
Real Assets – Real Assets refers to a broad category of investments that involve physical or tangible assets. Typical real assets include real estate, commodities and precious metals. These assets derive their value from demand or use of consumption, as opposed to financial assets like stocks and bonds, which derive their value from a stream of future cash flows. Real Assets are typically beneficial in diversifying a portfolio that holds stocks and bonds and are also more sensitive to inflation than financial assets.
Russell 1000 Growth Total Return (TR) Index – Focuses on the 1,000 largest companies in the Russell 3000 Index that have lower dividend yields and above average growth rates.
Russell 1000 Value Total Return (TR) Index – Focuses on the 1,000 largest companies in the Russell 3000 Index that have higher dividend yields and below average growth rates.
Russell 2000 Total Return (TR) Index – Measures performance of the 2,000 smallest companies in the Russell 3000 Index.
Russell 3000 Index – Measures performance of the 3,000 largest U.S. companies based on total market capitalization. It is used as a general measure of U.S. stock market performance.
Security – An instrument representing ownership (stocks), a debt agreement (bonds) or the rights to ownership (derivatives).
Stable Value – An investment that is meant to protect your principal and provide a consistent rate of return. This does not mean that the investment will never experience a negative rate of return over shorter time periods; however, it is managed with the intent of reducing this possibility.
Standard & Poor’s (S&P) 500 Total Return (TR) Index – A popular standard for measuring large company U.S. stock market performance. The index includes a representative sample of 500 leading companies in prominent industries.
Standard & Poor’s (S&P) MidCap 400 Total Return (TR) Index – A popular standard for measuring mid cap U.S. stock market performance. The index includes a representative sample of 400 leading companies in prominent industries.
Stock – An ownership interest in a company. When you buy stock, you become part owner of the company that issued it. The price of the stock depends on what investors are willing to pay for it, based on such things as the company’s profitability, products, business environment and projected future earnings. Stocks typically are volatile over the
short term, but they historically offer greater returns over the long term than other types of investments.
Target Date Portfolio – A Target Date Portfolio is a diversified investment option that is structured to provide an appropriate investment portfolio for a given target retirement date. The asset allocation of a Target Date Portfolio will change over time as the target retirement date approaches. The Target Date Portfolio’s asset allocation will move from a focus on investment growth when the target date is distant to a gradually increasing focus on capital preservation as the target date approaches. Target Date Portfolios include investments in a broad array of assets, including stocks, bonds, real estate and commodities. Target Date Portfolios are designed to be comprehensive, so that retirement plan participants can place their entire account balance in the portfolio and have a well diversified portfolio.
Total Return – The return on an investment, including income from dividends and interest, as well as appreciation or depreciation in the price of the security, over a given time period, usually a year.
Turnover Ratio – Measures the funds’ trading activity. The percentage represents the number of times the portfolio’s holdings have changed over the past year.
Value – Value investors buy stocks in companies with a price that is significantly below the value that a fair marketplace should place on the stock. The reason for the price discrepancy may be temporary management or product problems, an asset that the company holds that the marketplace is not fully aware of, or simply that the company is out of favor with the market’s fads. Value investors look for stocks with low price to earnings ratio that pay dividends.
15
10200 Bellaire Blvd.
Houston, TX 77072
What's Inside
New Investment Options Coming in June
Important Dates: What You Need to Know
About Target Date Portfolios
Choose the Right Investments for You
Mapping: How Your Money May Move
Investment Resources
1 3 4 7 8 10Tr
ustTa
lk
Spring 2013
PRSRT STDU.S. POSTAGE
PAIDADDISON, TXPERMIT NO. 6
NON PROFITORGANIZATIONU.S. POSTAGE
PAIDADDISON, TXPERMIT NO. 6
PRESORTEDFIRST-CLASS MAIL
U.S. POSTAGE PAID
ADDISON, TXPERMIT NO. 6
We encourage you to call the Trust Investments Department at (281) 575-3316 with any suggestions or comments regarding Trust Talk. You can expect the next issue in August 2013.
For account information, go to www.halliburton.com/totalrewards if you are an active employee (if you are a former employee, go to www.netbenefits.com) or call the Halliburton Benefits Center automated telephone system at (866) 321-0964.