A landscape level perspective Since animals require large expanses of natural habitat for their long-term survival, the Land- scape Project focuses on large areas called land- scape regions that are ecologically similar with regard to their plant and animal communities (Illus- tration 1). Utilizing an extensive database that combines rare species location information with land use/land cover classification data, ENSP has identi- fied and mapped areas of critical habitat for rare species within each landscape region. These land- scape maps provide a highly accurate, reliable and scientifically sound basis for habitat protection within each landscape. One of the Landscape Project’s unique features is its focus on the big picture, and not just on individual locations of rare species as they be- come threatened. The project’s protection strat- egy begins with already conserved areas such as publicly owned areas and regulated wetlands. By identifying and protecting critical habitats adjacent to these already-conserved areas, large, contiguous blocks of habitat will be protected. Thus, within large landscapes, the Landscape Project identifies critical wildlife habitats that must be preserved now if we want to assure the conservation of New Jersey’s rare wildlife for future generations. New Jersey’s Landscape Project For the Protection of Rare Species New Jersey is the most densely populated state in the nation. One of the consequences of this distinction is the extreme pressure that is placed on our natural resources. As the population grows, we continue to lose or impact the remaining natural areas of the state. As more and more habitat is lost, people are beginning to appreciate the benefits — and necessity — of maintaining land in its natural state. For example, we now know that wetlands are critical for recharging aquifers, lessening the damage from flooding and naturally breaking down contaminants in the environment. Forests and grasslands protect the quality of our drinking water, help purify the air we breathe and provide important areas for outdoor recreation. Collectively, these habitats are of critical importance to the diverse assemblage of wildlife found in New Jersey, including more than 60 species classified as threatened or endangered. In 1994 the N.J. Division of Fish and Wildlife’s Endangered and Nongame Species Program (ENSP) adopted a landscape level approach to rare species protection.The goal is to protect New Jersey’s bio- logical diversity by maintaining and enhancing rare wildlife populations within healthy, functioning ecosystems. Illustration 1. Landscape project regions. Landscape Regions Skylands Piedmont/Plains Pinelands Coastal Delaware Bay 1 NOTE: This brochure is out of date (3/01); see www.njfishandwildlife.com/ensp/landscape/index.htm.
Transcript
A landscape level perspective
Since animals require large expanses of naturalhabitat for their long-term survival, the Land-scape Project focuses on large areas called land-scape regions that are ecologically similar withregard to their plant and animal communities (Illus-tration 1). Utilizing an extensive database thatcombines rare species location information with landuse/land cover classification data, ENSP has identi-fied and mapped areas of critical habitat for rarespecies within each landscape region. These land-scape maps provide a highly accurate, reliable andscientifically sound basis for habitat protection withineach landscape.
One of the Landscape Project’s unique features isits focus on the big picture, and not just onindividual locations of rare species as they be-come threatened. The project’s protection strat-egy begins with already conserved areas such aspublicly owned areas and regulated wetlands. Byidentifying and protecting critical habitats adjacent tothese already-conserved areas, large, contiguousblocks of habitat will be protected. Thus, within largelandscapes, the Landscape Project identifies criticalwildlife habitats that must be preserved now if wewant to assure the conservation of New Jersey’s rarewildlife for future generations.
New Jersey’s Landscape ProjectFor the Protection of Rare Species
New Jersey is the most densely populated state in the nation. One of the consequences of this distinctionis the extreme pressure that is placed on our natural resources. As the population grows, we continue tolose or impact the remaining natural areas of the state. As more and more habitat is lost, people arebeginning to appreciate the benefits — and necessity — of maintaining land in its natural state. Forexample, we now know that wetlands are critical for recharging aquifers, lessening the damage fromflooding and naturally breaking down contaminants in the environment. Forests and grasslands protectthe quality of our drinking water, help purify the air we breathe and provide important areas for outdoorrecreation. Collectively, these habitats are of critical importance to the diverse assemblage of wildlifefound in New Jersey, including more than 60 species classified as threatened or endangered.
In 1994 the N.J. Division of Fish and Wildlife’s Endangered and Nongame Species Program (ENSP) adopted a landscape level approach to rare species protection.The goal is to protect New Jersey’s bio-logical diversity by maintaining and enhancing rare wildlife populations within healthy, functioningecosystems.
Illustration 1. Landscape project regions.
Landscape RegionsSkylandsPiedmont/PlainsPinelandsCoastalDelaware Bay
1
NOTE: This brochure is out of date (3/01); see www.njfishandwildlife.com/ensp/landscape/index.htm.
The purpose of the Landscape Project
The Landscape Project has been designed to provide users with peer reviewed, scientifically sound information(seeAppendix V for reviewers) that is easily accessible and can be integrated with planning, protection andland management programs at every level of government — state, county and municipal, as well as nongovern-mental organizations and private landowners. Landscape maps and overlays provide a basis for proactiveplanning, such as the development of local habitat protection ordinances, zoning to protect critical habitat,management guidelines for rare species protection on public and private lands and land acquisition projects.
Most importantly, the critical habitat information that Landscape Project products provide can be usedfor planning purposes before any actions, such as proposed development, resource extraction (such astimber harvests) or conservation measures, occur. Proper planning with accurate, legally and scientifi-cally sound information will result in less conflict. Less time will be wasted, and less money spent,attempting to resolve endangered and threatened species issues.
Uses for Landscape Project maps
The ENSP has developed maps that identify critical rare species habitats based on land use classifica-tions and rare species locations. The maps will enable state, county, municipal and private agencies toidentify important habitats and protect them in a variety of ways:
Illustration 2. The area within the red circle illustrates critical habitat that would be a valuable acquisitionbecause it ties together two areas of public open space resulting in a much larger contiguous habitatparcel.
Chester Township
1 0 1 Miles
Grassland Conservation PriorityHigher
Lower
Wetland Conservation PriorityHigher
Lower
Forest Conservation PriorityHigher
Lower
Developed AreasOpen SpaceLocal RoadsMajor Roads
N
2
Grassland Conservation PriorityHigher
Lower
Wetland Conservation PriorityHigher
Lower
Forest Conservation PriorityHigher
Lower
Open Water
Municipal BoundariesOpen Space
• Prioritize conservation acquisitions: Critical area maps can be used to prioritize land parcels forpurchase through acquisition programs such as Green Acres, Farmland Preservation and the U.S. Fish andWildlife Service’s refuge system (Illustrations 2 and3).
• Guide regulators and planners: Critical area maps provide land-use regulators and state,county and local planners with the tools they need to enhance protection through the regulatory andplanning process.
• Provide citizens with conservation tools: Landscape Project products provide the tools to guidecitizen actions to protect rare species habitat at the local level. By combining critical area maps withother GIS data layers such as roads, development and publicly owned lands, important areas in need ofprotection can be easily identified. Chester Township in Morris County provides a good example of howLandscape Project maps can be used to identify important areas in need of protection (Illustration 2).
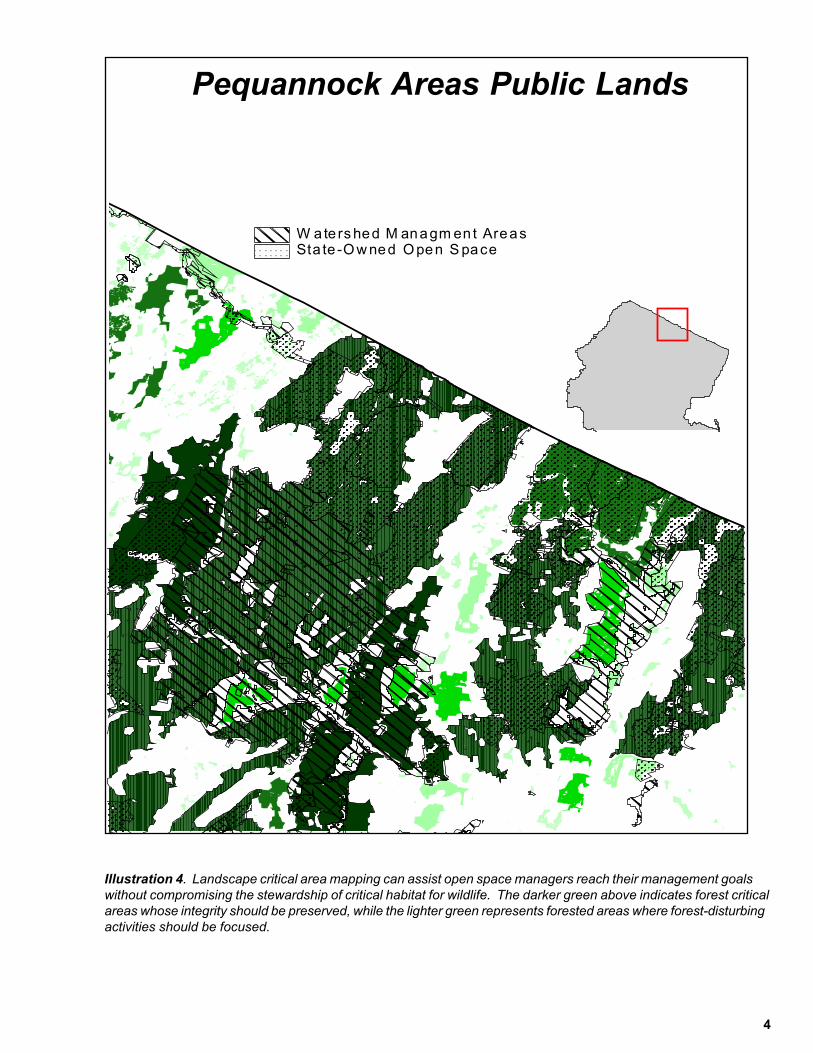
• Guide stewardship of already-conserved areas: New Jersey already has nearly 1 million acres ofopen space. These lands are managed by a variety of agencies and organizations, both public and private.Critical area maps identify important rare species habitats on these lands. ENSP biologists work hand in handwith land managers and landowners to develop appropriate best management practices for the long-termconservation of rare species (Illustration 4).
Illustration 3. Critical area maps can help identify important rare species habitat where public and private landacquisition can be targeted.
Jenny Jump State Forestand Surrounding Area
3
Pequannock Areas Public Lands
Illustration 4. Landscape critical area mapping can assist open space managers reach their management goalswithout compromising the stewardship of critical habitat for wildlife. The darker green above indicates forest criticalareas whose integrity should be preserved, while the lighter green represents forested areas where forest-disturbingactivities should be focused.
4
Sta te -O w ned O pen S paceW ate rs hed M anagm en t Areas
Why we need the Landscape Project
We live in the most densely populatedstate in the nation. As people leaveour cities to live in the “country,”suburban sprawl becomes rampant.Some of the consequences of thisrapid suburbanization are the loss anddegradation of critically importantwildlife habitats, and the fragmenta-tion and isolation of habitats thatremain. Many rare species requirelarge contiguous blocks of habitat tosurvive. Small patches of fields,forests and wetlands interspersed withdevelopment provide habitat for somecommon species, but don’t providethe necessary habitat for most of ourrare wildlife. We need to protect large,contiguous blocks of forest, grass-lands and wetlands to assure thesurvival of rare species over the long-term.
Despite New Jersey’s protection efforts,which include strict land use regulationsand an aggressive open space acquisitionprogram (Green Acres), we continue tolose critical wildlife habitat at an alarmingrate. In just the last three decades wehave lost 40 percent of the remainingcritical migratory bird stopover habitat onthe lower third of the Cape May Penin-sula (Illustration 5). During the sameperiod, approximately 50 percent of the state’s bog turtle habitat has disappeared. The Landscape Projectserves as a tool to help reverse this trend.
Who benefits
Protecting large expanses of fields, forests and wetlands helps to ensure that rare species will remain apart of New Jersey’s future. In addition to providing habitat for the conservation of rare species, theLandscape Project will result in more open space for outdoor recreation. Recent surveys by the U.S. Fishand Wildlife Service show that more than 60 percent of Americans participate in some form of wildlife-related recreation. Open spaces provide places where people can escape the confines of urban andsuburban living. Retaining habitats in their natural state provides other benefits such as reducing thethreat of flooding, allowing for the biodegradation of environmental contaminants and rechargingground water reserves. In short, everyone benefits from the Landscape Project.
Illustration 5. By using satellite imagery from different time periodsto develop critical area mapping, planners and managers canvisualize habitat changes as well as identify habitat that is beingdegraded by development or land use changes as illustrated by thismap of Cape May peninsula.
Developed Between 1972 and 1995
Forest Critical AreasMunicipal Boundaries
Cape May Peninsula
5
How to obtain additional information and Landscape Project maps
Landscape Project maps are available via the internet in several ways. GIS coverages will be availablefor download on the Division of Fish, Game and Wildlife’s website at: www.state.nj.us/dep/fgw. Oneversion is available to users employing ArcView or ArcExplorer, a free GIS program available fromEnvironmental Systems Research Institute, Inc. (www.esri.com). For those who do not need to down-load the maps or do not want to download ArcExplorer, the maps will be viewable over the internetthrough the NJDEP GIS interactive internet mapping project at: www.state.nj.us/dep/gis.
New Jersey’s Landscape Regions
Delaware Bay Landscape (including the Cape May Peninsula)
This landscape encompasses all or parts of Cape May, Atlantic and Cumberland counties. Thisarea features a stable population of bald eagles, tiger salamanders, southern gray treefrogs and 30other endangered and threatened species. The vast woodland tracts of this region are among thelargest in the state and support the majority of New Jersey’s Neotropical bird populations. Theextensive saltwater marsh and sandy overwash beaches support a shorebird migration that hasworldwide ecological implications. Despite the heavy loss of habitat, the Cape May Peninsularemains one of the country’s most important migratory “stopovers” for hundreds of bird andinsect species.
Pinelands Landscape (including pineland habitat located outside the Pinelands Reserve)
This landscape encompasses all or parts of Atlantic, Ocean, Burlington, Camden and Gloucestercounties. An internationally recognized ecosystem, the Pinelands supports extremely diverseherptile and invertebrate populations including the pine snake, corn snake, Pine Barrens treefrogand the Pine Barrens bluet, the green darner and the Arogos skipper. Extensive cedar swamps andwetland systems contain numerous insect species, as well as sustainable populations of manyNeotropical birds. Its waterways support aquatic communities unique among the Mid-AtlanticStates.
Piedmont Plains Landscape
This landscape encompasses all or parts of Burlington, Gloucester , Mercer, Middlesex, Monmouth andSalem counties. It is dominated by the Delaware and Raritan rivers, and is characterized by heavilyfarmed areas, extensive grasslands, fragmented woodlands and tidal freshwater marshes that are amongthe most productive in the world. Priority species within this landscape include the shortnose sturgeon,grassland birds such as the endangered upland sandpiper, and woodland raptors such as the barred owland coopers hawk.
Skylands Landscape
This landscape encompasses all or part of Sussex, Warren, Hunterdon, Passaic, Morris andSomerset counties. This region contains extensive tracts of contiguous upland and wetlandforests that support diverse animal populations including red-shouldered hawks, goshawks,cerulean warblers, timber rattlesnakes and long-tailed salamanders. Bog turtles and great blueherons are found throughout the extensive freshwater wetland systems found over this region.
6
Atlantic Coastal Landscape (including salt marsh and barrier beach habitats)
This landscape encompasses parts of Monmouth, Ocean and Atlantic counties. Our AtlanticCoast beaches and marshes are among the most productive coastal habitats in the country. De-spite heavy development, they support important portions of Atlantic Coast populations ofcolonial nesting birds, such as common terns, little blue herons and great egrets, and endangered beachnesting birds such as least terns and piping plovers. Our coastal habitats also support most of the state’sospreys and peregrine falcons, as well large numbers of northern harriers, blacks rails, and many othernongame species.
Landscape Priority Species
Priority species for the Landscape Project include all state and federally listed wildlife. Location data foreach priority species are used to develop critical area maps and to prioritize habitat parcels. Withincertain landscape regions, location data for a select group of non-listed, area-sensitive neotropical mi-grant landbirds are included as priority species, but carry somewhat less weight when used to prioritizehabitat parcels. For a complete list of priority species for each landscape region refer to Appendix I.
Critical Area Mapping
The Landscape Project provides mapping for three distinct land cover types: forest, wetlands and grass-lands.
Please note: there is overlap between the forest and the wetland coverages. Forested wetlands are rankedas both wetlands and forest. This is warranted by differences in species’ affinities towards the differenthabitat types. Those species that require forested wetlands for survival have been included in the wet-lands mapping and ranking. Species that require forest habitat, but not necessarily forested wetlands, areincluded in the forest mapping and ranking.
Forests
Critical area maps for forest-dependent species are generated by selecting specific features from theDepartment of Environmental Protection’s GIS and remotely sensed land use/land cover data from RutgersUniversity’s Center for Remote Sensing and Spatial Analysis (CRSSA) (Illustration 6) . Using ArcInfo andArcView GIS software the ENSP has developed a protocol to identify critical forest habitats within eachlandscape area (Illustrations 7 and 8) . The methodology includes:
• Combining all of the forest types included in the land use/land cover data into one forest coverage category.This newly created data layer shows all forested habitat.
• Overlaying priority species location information on the forest coverage and ranking each parcel on anumber of factors (See Appendix IV), such as the number of priority species found within the area and itsproximity to already conserved areas.
• Delineating a 90-meter buffer surrounding all developed areas, which is then excluded from considerationsince development and disturbance is likely to occur within these areas.
• Identifying core forested areas: contiguous forests undivided by major roads (county-level roads or higher)that are larger than 10 hectares, or 24.7 acres. All of this core forest is farther than 90 meters from anyedge. Many of the forest priority species need large expanses of interior forest for survival. Being close to aforest edge has negative consequences for the survival and reproduction of these “area sensitive” targetspecies. Parcels that do not meet the minimum area requirements are included in the forest coverage only if
Illustration 6. 1994-1995 land use/land cover map of Watershed Management Area 8,the North and South Branch Raritan watershed.
8
I II
III IV
Illustration 7. A multi-step process is used to delineate critical forest areas. (I) indicates the process ofextracting forests from the land use/cover data. (II) shows the selection of forest patches meeting theminimum core size. In (III) open spaces and species data are added to the coverage. (IV) shows eachparcel’s priority rank.
##
#
#
#
#
##
#
#
#
##
#
#
#
##
#
#
##
###
#
#
#
#
#
#
#
#
## #
#
##
#
#
#
##
#
#
#
#
# #
#
##
9
Wetlands Conservation PriorityHigher
Lower
Grassland Conservation PriorityHigher
Lower
Forest Conservation PriorityHigher
Lower
Illustration 8. Landscape Project critical areas within Watershed Management Area 8, showing criticalgrasslands, wetlands and forests.
10
they contain records of priority species. In these cases the 90 m buffer is not excluded from the parcel.• Identifying conserved areas of forest that currently have some form of protection from development - either
through ownership or regulation. These include public lands, non-government organization (NGO) conser-vation lands, wetlands with appropriate buffers, water supply management areas, Green Acres propertiesand easements.
• Combining the previously created forest coverage with the conserved area coverage to provide a picture ofall forested habitats, both protected and unprotected.
Together, key critical and conserved areas will result in large blocks of contiguous forest habitat essen-tial to the preservation of endangered and threatened species within the landscape regions.
Exceptions to this methodology occur in the Atlantic Coastal Landscape and, within the Delaware BayLandscape, on the lower 10 kilometers of the Cape May Peninsula. In the Atlantic Coastal Landscape,all forests (including scrub/shrub), regardless of size, are mapped as critical habitat. This is due to theimportance of these habitat types to migrating birds. Within the lower 10 kilometers of the Cape MayPeninsula, all forest, wetland and grassland habitats are designated as critical areas.
Wetlands
Critical area maps for wetland-dependent species are generated by selecting specific features from theDepartment of Environmental Protection’s GIS and remotely sensed land use/land cover data from RutgersUniversity’s CRSSA. Using ArcInfo and ArcView GIS software the ENSP has developed a protocol to identifycritical wetland habitats within each landscape area. The methodology includes:
• Wetlands are divided into two basic habitat types: forested and emergent.The forested wetland coverageincludes all forested and scrub/shrub wetlands. The emergent wetland coverage includes all herbaceouswetlands. These represent the vast majority of freshwater wetland habitats for priority threatened andendangered species.
• Conserved areas are then overlaid on the wetland maps. Conserved areas include the legislated 150-foot(46-meter) buffer on all wetlands that have documented occurrences of endangered and threatened species.
• A 50-foot (15-meter) buffer is placed around all other wetlands. The resulting maps identify critical wetlandhabitats and their proximity to other (upland) conserved areas.
• Priority species location information is then overlaid on the wetland coverage maps. Each wetland parcel isranked by several criteria, including the number of priority species found within it and its proximity toalready-conserved areas (See Appendix IV).
• The 150-foot buffer is often inadequate in protecting a sufficient amount of upland habitat for some wetlandspecies. Table 1 lists those wetland species that require a larger upland habitat buffer. A 300-meter buffer isused around wetlands where these species occur. Table 1 includes the wetland and upland habitat type(s)required by each of these species.
• Upland habitats that are listed in Table 1, regardless of size, that intersect with a 300- meter buffer areconsidered critical. These parcels are ranked the same as any other critical area (See Appendix IV)
Table 1. Wetland species that require a 300-meter buffer.Species Wetland Habitat Upland Habitat
Requirements RequirementsWood turtle Forest and emergent Forest and grasslandBlue-spotted salamander Forest ForestTremblay’s salamander Forest ForestEastern tiger salamander Forest Forest and barren landSouthern gray treefrog Forest ForestPine Barrens treefrog Forest Forest
11
• Within the Delaware Bay and Atlantic Coastal Landscape Regions high marsh and low marsh habitats aredifferentiated from basic wetlands. This allows for a higher ranking to be applied to high marsh habitatsbased on their importance to nesting marsh species such as northern harriers, short-eared owls and blackrails.
Grasslands
Critical area maps for grassland-dependent species were generated by selecting specific features from theDepartment of Environmental Protection’s GIS and remotely sensed land use/land cover data from RutgersUniversity’s CRSSA. Using ArcInfo and ArcView GIS software the ENSP has developed a protocol to identifycritical grassland habitats within each landscape area. The methodology includes:
• Combining all open habitat types — grassland and other open habitat classifications in the agriculture datalayer of the GIS —into one grassland coverage category.
• Eliminating all grassland parcels less than 18 hectares, or about 45.5 acres. Ten hectares, or 24.7 acres, isthe minimum size grassland parcel needed to support viable populations of several of the priority grasslandspecies. However, the literature also reports that significant predation losses occur within 50 to 55 meters ofgrassland edges. Therefore, this area of increased predation was added to the 10-hectare-minimum arearequirement, resulting in the 18 hectare minimum. Grassland parcels that do not meet the minimum arearequirement are included in the coverage only if they contain records of priority species.
• Overlaying priority species location on the grassland coverage maps. Each grassland parcel was ranked byseveral criteria, including the number of priority species found within each grassland area and its proximity toalready conserved areas.
This procedure was completed for each of the three habitat types and resulted in map products that depictcritical areas ranked by priority (Illustrations 8, 10 and 11). In determining critical habitat areas, somespecies-specific exceptions were utilized to account for their particular habitat and/or area requirements (SeeAppendix III). For example, to avoid undue disturbance, all parcels withing a one-kilometer radius aroundeach active bald eagle nest are considered critical habitat, and bald eagle foraging areas also receive specialconsideration (Illustration 9). Previously, only habitat within a 1/2 mile of a nest was given consideration fordisturbance.
Illustration 9. Bald eagle nest disturbance buffer and foraging habitat.Illustration 9. Bald eagle nest disturbance buffer and foraging habitat.
I km
13
N
Grassland Conservation PriorityHigher
Lower
Wetland Conservation PriorityHigher
Lower
Forest Conservation PriorityHigher
Lower
Illustration 10. Skylands Landscape Region critical areas map.
14
3 0 3 Miles
Wetland Conservation PriorityHigher
Lower
Forest Conservation PriorityHigher
Lower
Grassland Conservation PriorityHigher
Lower
N
Illustration 11. Delaware Bay Landscape Region critical areas map.
15
Appendix I. Target Species for the Landscape RegionsSpecies Delaware Highlands Pinelands CoastalBirds Bay * migration
**winter
Neotropical Migrants
Acadian Flycatcher x x x x*Blackburnian Warbler x x*Black-billed Cuckoo x x x x*Black and White Warbler x x x x*Black-throated Blue Warbler x x*Black-throated Green Warbler x x x*Blue-gray Gnatcatcher x x x x*Broad-winged Hawk x x x x*Canada Warbler x x*Cerulean Warbler x x*Eastern Wood-peewee x x x x*Great-crested Flycatcher x x x x*Hermit Thrush x x*Hooded Warbler x x x x*Kentucky Warbler x x x x*Least Flycatcher x x*Louisiana Waterthrush x x x x*Northern Parula Warbler x x*Northern Waterthrush x x*Ovenbird x x x x*Pine Warbler x x x x*Prothonotary Warbler x x x x*Red-eyed Vireo x x x x*Rose-breasted Grosbeak x x*Ruby-throated Hummingbird x x x x*Scarlet Tanager x x x x*Solitary Vireo x x*Summer Tanager x x x*Veery x x*Wood Thrush x x x x*Worm-eating Warbler x x x x*Yellow-billed Cuckoo x x x x*Yellow-throated Vireo x x x x*Yellow-throated Warbler x x x*
Osprey - Threatened x x
Savannah Sparrow - Threatened x x x x*Grasshopper Sparrow - Threatened x x x x*Bobolink - Threatened x x x*Upland Sandpiper - Endangered x x x x*
16
Species (cont’d.)Delaware Highlands Pinelands Coastal Bay * migration
* *winter
Birds (cont’d.)Short-distance Migrants
Bald Eagle - Endangered x x xBlack Rail - Threatened x x*Cooper’s Hawk - Endangered x x x x*Great Blue Heron x x x x*Little Blue Heron - Threatened x x x*Long-eared Owl - Threatened x x xPied-billed Grebe - Endangered x x x x*Northern Goshawk - Threatened xNorthern Harrier – Endangered x x xRed-headed Woodpecker - Threatened x x xRed-shouldered Hawk - Endangered x x xSedge Wren - Endangered x xSharp-shinned Hawk x x x*Short-eared Owl - Endangered x x* x**Winter Wren xYellow-crowned Night Heron- Threat. x x*
Vesper Sparrow - Endangered x xHenslow’s Sparrow - Endangered x x x
Resident
Barred Owl - Threatened x x x
Reptiles
Bog Turtle - Endangered x xWood Turtle - Threatened x x xNorthern Pine Snake - Threatened x xCorn Snake - Endangered x xTimber Rattlesnake - Endangered x x x
Amphibians
Blue-spotted Salamander - Endangered xLong-tailed Salamander - Threatened xEastern Tiger Salamander - Endangered x xSouthern Gray Treefrog - Endangered x xPine Barrens Treefrog - Endangered x x
Mammals
Bobcat - Endangered x x xIndiana Bat - Endangered xEastern Woodrat - Endangered x
17
APPENDIX II. Wetland Species habitat requirements
Species Wetland typeForest Emergent
Bald Eagle X XRed-shouldered hawk XNorthern harrier X*Short-eared owl X*Barred owl XBobolink XSedge wren XHenslow’s sparrow XBlack rail X*Great blue heron X XLittle blue heronYellow-crowned night heronWood turtle X XTimber rattlesnake XBlue-spotted salamander XTremblay’s salamander XLong-tailed salamander XEastern tiger salamander XSouthern gray treefrog XPine barrens treefrog XBobcat X X*Species uses high marsh habitat in the coastal area.
18
APPENDIX III. Critical area designation for select species
Bald Eagle
Nest Sites – All habitat within a 1 Km radius around each active bald eagle nest is designated ascritical habitat in order to protect it from disturbance. This is applied to any nest that has been activewithin the previous five years.
Foraging Areas –a radius around the nest site is incrementally increased, one cell (30 m) at a time,until an area of 660 ha of foraging habitat has been identified. Foraging habitat is defined as shore-line, a 100 m wide upland buffer and out to a point 1 km from the shoreline. Foraging habitat is onlycalculated on bodies of water with a minimum area of 3 km2. This 660 ha of foraging habitat isdesignated as acritical area. Bodies of water less than 3 km2 will not be included in the calculationof foraging habitat.
Great Blue Heron
All active heron colonies, including a 0.5 km wide area around its perimeter, are designated as criticalto protect nesting birds from disturbances.
Red-shouldered Hawk and Barred Owl
All records in the database represent breeding season locations. Therefore, a 1 km radius around eachsighting location is designated as critical area.
Timber Rattlesnake
Skylands Landscape
Timber rattlesnake den locations plus a 2 km radius around their perimeter are designated as criticalhabitat. A 2 km radius of habitat is adequate in protecting the vast majority of female gestating andbirthing areas, transient habitat, and some foraging habitat. Most gestating and birthing areas in thispart of the state occur within a few to several hundred meters of the den location.
Pinelands and Delaware Bay Landscapes
Any portion of a stream (including intermittent) within 2.5 km of a timber rattlesnake occurrence (sec-onds precision only) is considered “potential hibernacula.” The “critical area” will be the “potentialhibernacula” plus a 1 km wide area of habitat along the designated stream corridors.
Bog Turtle
Intensive research by the ENSP during the past five years has resulted in a very strong data set forwetland polygons where bog turtles are known to occur, and where suitable habitat exists but presencehas not yet been confirmed. These identified polygons have been digitized and form the basis for ourbog turtle critical wetland habitat mapping. We are currently tracking bog turtle populations bymetapopulations or PAS’s (population analysis sites). PAS’s are defined by a national peer groupapproved set of criteria. Basically, a PAS is a single or multiple sites within the same stream drainagewhere turtles can potentially move between sites that are not isolated by major roads, water bodies,large streams, etc. Sites within the same drainage that are isolated by these barriers are consideredseparate PAS’s. We have included potentially suitable habitats where presence has not yet beendocumented within PAS’s where turtles are known to occur for two reasons. First, there is a goodpossibility these sites support bog turtles. Secondly, they provide alternative habitats for turtles migrat-ing away from occupied sites in the same drainage that become unsuitable.
19
Bog turtle critical habitat will be defined as follows:
•All wetland polygons where turtles have been found within the last 15 years.•Potentially suitable habitats within PAS’s that have known occurrences.•In PAS’s containing multiple sites, (both occupied and suitable habitat) travel corridors are delineated
in an attempt to give conservation priority to dispersal routes important to long term populationviability. Palustrine emergent, scrub-shrub, modified agricultural wetland polygons and streamcorridors that serve as dispersal corridors between sites within a PAS are delineated as bog turtlehabitat.
•Delineated habitat (both the actual site and connecting corridors) within PAS’s that contain multiplesites is given additional weight under the ranking system.
Indiana Bat
Known Indiana bat hibernacula, including a 2 km radius around it, are designated as critical habitat toprotect the integrity of the forests around the portal.
Red-headed Woodpecker
Only point location data is used for this species. However, due to its habitat preference the red-headedwoodpecker is considered as a target species in both the forest and grassland habitat coverages.
Colonial Waterbirds and Wading Birds (Black Skimmer, Terns, Piping Plover and Coastal Herons)
Delineated nesting areas plus a 150 m area around their perimeters are designated as critical habitat inthe Atlantic Coastal Landscape.
Peregrine Falcon
All tower nesting locations with a 1 km radius are designated as critical areas.
Northern Harrier
All breeding locations with a 1 km radius are designated as critical areas.
Osprey
All nesting locations with a 1 km radius are designated as critical areas.
Black Rail
All breeding locations with a 75 m radius are designated as critical areas.
Lower 10 Km of Cape May Peninsula
All forest, wetland, scrub/shrub and grassland habitats located on the lower 10 km of the Cape Maypeninsula are designated as critical areas.
20
Appendix IV. Critical Area Ranking
All habitat parcels that were selected as critical will be ranked according to the following criteria: Therankings will provide a means of prioritizing protection for critical areas.
• Species location data are overlaid on the critical area (forests, wetlands and grasslands) maps.Each critical area is assigned a value based on the number of priority species that fall within itsboundaries. A point value of 1 is added for each species that falls within a critical area polygon.
EXCEPTIONS:Bald eagles: Due to the need to protect both the area around the nest site and critical foraging habitat, a nestwill add 1 ranking point and the foraging area will add another ranking point if they occur in the same criticalarea polygon.Northern Pine Snakes: The ENSP has developed a habitat model for northern pine snakes based on soils andvegetation resulting in the designation of primary habitat type. If mapped primary habitat types intersect withforest polygons they receive an additional ranking point. A sighting location also adds a ranking point to aforest polygon but they are not cumulative. A parcel can receive only one ranking point for northern pinesnakes – either through the occurrence of a sighting location in a critical forest polygon or the intersection of amapped primary habitat type and a critical forest polygon.Bog turtles: The following criteria adds one ranking point to a critical area polygon:A wetland polygon where turtles have been found within the last 15 years.Potentially suitable habitats within Population Analysis Sites (PAS’s) that have known occurrences.
The following criteria adds an additional ranking point to a critical area polygon:
All PAS’s containing multiple sites, (both occupied and suitable habitat) and travel corridors are delineated inan attempt to give conservation priority to dispersal routes important to long-term population viability.Palustrine, emergent, scrub-shrub, modified agricultural wetland polygons and stream corridors that serve asdispersal corridors between sites within a PAS are delineated as bog turtle habitat.
• The occurrence of three or more neotropical migrant bird species in one critical area polygon addsone ranking point.
• Conserved areas are defined as state open space and land protected through regulation. Proximityof a critical area polygon to a conserved area imparts a greater value to that parcel. However, stateopen space lands are considered more secure than those receiving only protection through stateregulations are. Therefore, after critical area polygons have been ranked according to the criteriaabove, all polygons that are directly adjacent (within 2 pixels or 60 m) to state open space con-served areas are multiplied by 1.5 to increase their ranking and priority for protection. Critical areapolygons adjacent to conserved areas protected through state regulations will be multiplied by 1.2to increase their ranking and priority for protection. Justification for this lies in the basic strategy ofthe landscape project, which is to build on existing conserved areas.
Each mapped critical area appears on the map as a shaded color from light to dark (5 categories)indicating its relative priority ranking. Category 1 parcels correspond to the lightest shade and thus thelowest priority ranking. Parcels in categories 2 through 5 are progressively darker shades andrepresent a higher priority ranking. The categories are defined as follows:
Category 1 parcels meet the minimum area requirement, but no data exists for the presence ofpriority species.
Category 2 parcels meet the minimum area requirement and are proximate to a conserved area,but no data exists for the presence of priority species.
Category 3 parcels may have one or two priority species present and may or may not meet theminimum area requirement or be proximate to a conserved area.
Category 4 and 5 parcels have at least two species present and may or may not meet theminimum area requirements or be proximate to a conserved area.
21
Appendix V. Landscape Project Peer Review Group
Name Affiliation
Dr. James Applegate Rutgers UniversityDr. Joanna Burger Rutgers UniversityDr. Tim Casey Rutgers UniversityDr. David Ehrenfeld Rutgers UniversityDr. Joan Ehrenfeld Rutgers UniversityDr. David Fairbrothers Rutgers UniversityErnie Hahn NJDEP, Office of Natural Resource DamageMarjorie Kaplan NJDEP, Division of Science and ResearchDr. Michael Klemmens Wildlife Conservation Society, Bronx ZooKim Laidig NJ Pinelands CommissionDr. Richard Lathrop Rutgers UniversityTrish Maggio NJ Office of State PlanningKristie McDonald Wildlife Conservation Society, Bronx ZooDr. Peter Morin Rutgers UniversityDr. Burt Murray Rutgers UniversityJoan Walsh New Jersey AudubonDr. Robert Zampella NJ Pinelands Commission
Appendix VI. Land Management and Land Use Regulation Working Group
Name Affiliation
Jeanette Bowers-Altman NJDEP, Endangered & Nongame Species Prog.Tom Breden NJDEP, Natural Heritage ProgramRobert J. Cartica NJDEP, Office of Natural Lands Mgmt.Andy Didun NJDEP, Division of Fish, Game & WildlifeTerry Fowler NJDEP, Office of Environmental PlanningJim Haase NJDEP, Division of Parks and ForestsRich Hall NJDEP, Division of Fish, Game & WildlifeAnne Heasly The Nature ConservancyJay Laubengeyer Cumberland County Planning OfficeDr. Larry Niles NJDEP, Endangered & Nongame Species Prog.Sharon Paul NJDEP, Endangered & Nongame Species Prog.Dana Peters USFWSTony Petrongolo NJDEP, Division of Fish, Game & WildlifeMartin Rapp NJDEP, Office of Natural Lands TrustCatherine Taylor NJDEP, Land Use RegulationLarry Torok NJDEP, Land Use RegulationAudrey Wendolowski NJDEP, Land Use RegulationKelly Wolcott USFWS, Cape May National Wildlife Refuge
22
Appendix VI. Land Use/Land Cover Report
Mapping New Jersey’s Changing LandscapeProject leader: Rick Lathrop, Rutgers University Center for Remote Sensing and Spatial Analy-sis
The land use/land cover data that forms the basis of the Landscape Project’s critical area mappingefforts was produced by the Rutgers University Center for Remote Sensing and Spatial Analysis(CRSSA). A variety of remotely sensed and geographic information system (GIS) data sets were usedto map the land cover across New Jersey during the mid-1990’s.
Digital color infrared orthophotography acquired by the U.S. Geological Survey in 1995 and 1997 wasused to update the NJ Department of Environmental Protection’s 1986 land use maps. Areas of newdevelopment (subsequent to 1986)were then interpreted and digitized on-screen. The original 1986methodology was used as a guideline for both the digitizing and quality control processes to ensureconsistency. The land use data was then integrated with satellite remotely sensed data to map landcover. Landsat Thematic Mapper (TM) imagery were acquired for cloud-free dates in 1994 and 1995(November 4, 1994 and September 4, 1995). The November “leaf-off” imagery was taken after normaldeciduous plant leaf fall, allowing the clearer differentiation of evergreen vs. deciduous forests. TheSeptember “leaf-on” imagery permits the further discrimination of cultivated, wetland and developedareas. The ground resolution cell for Landsat TM imagery is 30 meters x 30 meters. A combination ofcomputer classification approaches were used to classify the Landsat TM image using the ERDASIMAGINE image processing software. One channel from the visible, near infrared and middle infraredspectral wavelengths was used to adequately characterize the vegetation. Incorporation of additionalGIS mapped data was used to provide further improve the delineation of wetland areas. Existing digitaldata sets such as U.S. Fish and Wildlife Service National Wetland Inventory, New Jersey Department ofEnvironmental Protection Freshwater Wetlands and Soil Conservation county soils data were incorpo-rated into the classification process as either pre-classification stratification or post-classification modifi-cation. The final New Jersey land cover map includes over 30 different classes of land cover/habitattypes. The minimum mapping unit is approximately 0.5 acre.
23
Literature Cited
Ambuel, B., and S. A. Temple. 1983. Area-dependent changes in the bird communities and vegetationof southern Wisconsin forests. Ecology 64:1057-1068.
Anthony, R. G. and F. B. Isaacs. 1989. Characteristics of bald eagle nest sites in Oregon. J. Wildl.Manage. 53(1):148-159.
Askins, A., J. F. Lynch, R. Greenberg. 1990. Population declines in migratory birds in eastern NorthAmerica. Ch.1, pp. 1-57; In: D. M. Power, Ed., Current Ornithology Vol. 7. Plenum Press, NewYork.
Blake, J. G., and J. R. Karr. 1987. Breeding birds of isolated woodlots: Area and habitat relationships.Ecology 68:1724-1734.
Brittingham, M.C., and S.A. Temple. 1983. Have cowbirds caused forest songbirds to decline?BioScience 33:31-35.
Brown, W. S. 1993. Biology, status, and management of the timber rattlesnake (Crotalus horridus): aguide for conservation. Society for the Study of Amphibians and Reptiles. Herp. Cir. No. 22.78pp.
Burke, D. M. and E. Nol. 1998. Influence of food abundance, nest-site habitat, and forest fragmentationon breeding ovenbirds. Auk 115(1):96-104.
Clark, K. NINJA data base. NJ Division of Fish, Game and Wildlife.
Copeyon, C.K. 1997. Endangered and threatened wildlife and plants; final rule to list the northernpopulation of the bog turtle as threatened and the southern population as threatened due tosimilarity of appearance. Federal Register 62(213): 59605-59622.
Craighead, J.J. and F.C. Craighead, Jr. 1956. Hawks, owls and wildlife. Stackpole Publ. Co., Harrisburg,PA.
Crocoll, S. and J.W. Parker. 1989. The breeding biology of broad-winged and red-shouldered hawks inwestern New York. J. Raptor Res. 23:125-139.
Darr, L. J., D. K. Dawson, C. S. Robbins. Unpublished Manuscript. Land-use planning to conservehabitat for breeding forest birds in fragmented landscape.
Dawson, D. K., L. J. Darr, and C. S. Robbins. 1993. Predicting the distribution of breedingforest birds in a fragmented landscape. Trans. North Amer. Will. Nat. Rescuer. Con.58:35-43.
DeCalesta, D. S. 1994. Effect of white-tailed deer on songbirds within managed forests in Pennsylva-nia. J. Wildl. Manage. 58(4):711-718.
Douglas, M.E., and B.L. Monroe. 1981. A comparative study of topographical orientation in Ambystoma(Amphibia: Caudata). Copeia 1981(2):463-466.
24
Elody, B.J. and N.F. Sloan. 1985. Movements and habitat use of barred owls in the Huron Mountains ofMarquette County, Michigan, as determined by radiotelemetry. Jack-pine Warbler 63(1):3-8.
Ernst, C.H. 1986. Environmental temperatures and activities in the wood turtle, Clemmys insculpta. J.Herpetol. 20(2):222-229.
Flather, C. H., and J. R. Sauer. 1996. Using landscape ecology to test hypotheses aboutlarge-scale abundance patterns in migratory birds. Ecology 77(1):28-35.
Freda, J. and P.J. Morin. 1984. Adult home range of the Pine Barrens treefrog (Hyla andersoni) and thephysical, chemical, and ecological characteristics of its preferred breeding ponds. Unpublishedreport submitted to the Endangered and Nongame Species Program. 42pp.
Frenzel, R. 1983. Nest-site spacing of bald eagles. In Anthony, R. G., F. B. Isaacs, and R. W. Frenzel,eds. Proceedings of a workshop on habitat management for nesting and roosting bald eagles inthe western United States. Corvallis: Coop. Wildl. Res. Unit, Oregon State Univ.
Friesen, L. E., P. F. J. Eagles, and R. J. Mackay. 1995. Effects of residential development on forest-dwelling neotropical migrant songbirds. Cons. Biol. 9(6):1408-1414.
Fuller, M.R. 1979. Spatiotemporal ecology of four sympatric raptor species. Ph.D. Dissertation. Univer-sity of Minnesota, St. Paul. 396 pp.
Hoover, J. P., M. C. Brittingham, and L. J. Goodrich. 1995. Effects of forest patch size on nestingsuccess of wood thrushes. Auk 112(1):146-155.
Johnson, E. and P.J. Morin. 1985. 1985 blue-spotted salamander (Ambystoma laterale) project report.Unpublished report, NJDEP, DFGW, ENSP. 10pp.
Kiser, J.D. and C.L. Elliott. 1996. Foraging habitat, food habits, and roost tree characteristics of theIndiana bat (Myotis sodalis) during autumn in Jackson County, Kentucky. Final Report, Non-game Program, Kentucky Department of Fish and Wildlife Resources, Frankfort. 65pp.
Klemens, M.W. 1993. Standardized bog turtle site-quality analysis. Amer. Mus. Nat. His., New York,NY 7pp.
Martin, W.H. 1992. Phenology of the timber rattlesnake (Crotalus horridus) in an unglaciated section ofthe Appalachian Mountains. In Campbell, J.A. and E.D. Brodie, Jr. (Eds.) Biology of thePitvipers. Selva, Tyler, Texas. pp. 259-277.
Nichols, T.H. and D.W. Warner. 1972. Barred owl habitat use as determined by radiotelemetry. J. Wildl.Manage. 36(2):213-224.
Peterson, A. 1986. Habitat suitability index models: Bald eagle (breeding season). U.S. Fish Wildl. Serv.Biol. Rep. 82(10.126). 25 pp.
Quinn, N.W.S. and D.P. Tate. 1991. Seasonal movements and habitat of wood turtles (Clemmysinsculpta) in Algonquin Park, Canada. J. Herpetol. 25(2):217-220.
25
Reap, P.A. and R.T. Zappalorti. 1983. Notes on the diploid and triploid species of the Ambystomajeffersonianum complex in New Jersey. Unpublished rept. to the Endangered and NongameSpecies Program: 18pp.
Reinert, H.A. and R.T. Zappalorti. 1986. Habitat utilization by the timber rattlesnake, Crotalushorridus, in southern New Jersey with notes on hibernation. Final Report, Endangered andNongame Species Program, Trenton, New Jersey. 172pp.
Rich, A. C., D. S. Dobkin, and L. J. Niles. 1994. Defining forest fragmentation by corridorwidth: The influence of narrow forest-dividing corridors on forest-nesting birds insouthern New Jersey. Conservation Biology 8(4):1109-1121.
Ritke, M.E., J.G. Babb, and M.K. Ritke. 1991. Breeding-site specificity in the gray treefrog (Hylachrysoscelis). J. Herpetol. 25(1):123-125.
Robbins, C. S., D. K. Dawson, and B. A. Dowell. 1989. Habitat area requirements of breeding forestbirds of the Middle Atlantic States. Wildl. Monogr. No. 103:1-34.
Robinson, S. K., F. R. Thompson III, T. M. Donovan, D. R. Whitehead, and J. Faaborg. 1995. Regionalforest fragmentation and the nesting success of migratory birds. Science 267:1987-1990.
Semlitsch, R.D. 1981. Terrestrial activity and summer home range of the mole salamander (Ambystomatalpoideum). Canad. J. Zoology 59:315-322.
Stewart, R.E. 1949. Ecology of a nesting red-shouldered hawk population. Wilson Bull. 61:26-35.
Stihler, C. 1998. Indian bat radio telemetry study. West Virginia Nongame & Natural Heritage News.Summer, 1998. p. 5.
Strang, C.A. 1983. Spatial and temporal activity patterns in two terrestrial turtles. J. Herpetol. 17(1):43-47.
Whitcomb. R. F., C. S. Robbins, J. F. Lynch, B. L. Whitcomb, K. Klimkiewicz, and D. Bystrak. 1981.Effects of forest fragmentation on avifauna of the eastern deciduous forest. Pages 125-205 in:R. L. Burgess and D. M. Sharpe, eds.,Forest Island Dynamics in Man-dominated Landscapes.Springer-Verlag, New York, NY.
Williams, P.K. 1973. Seasonal movements and population dynamics of four sympatric mole sala-manders, genus Ambystoma. Ph.D. thesis, Indiana University, Bloomington, IN