33
New Leader in Precious Metals Denver Gold Forum September 18 – 21, 2016
| Date post: | 16-Apr-2018 |
| Category: |
Documents |
| Upload: | doannguyet |
| View: | 218 times |
| Download: | 4 times |
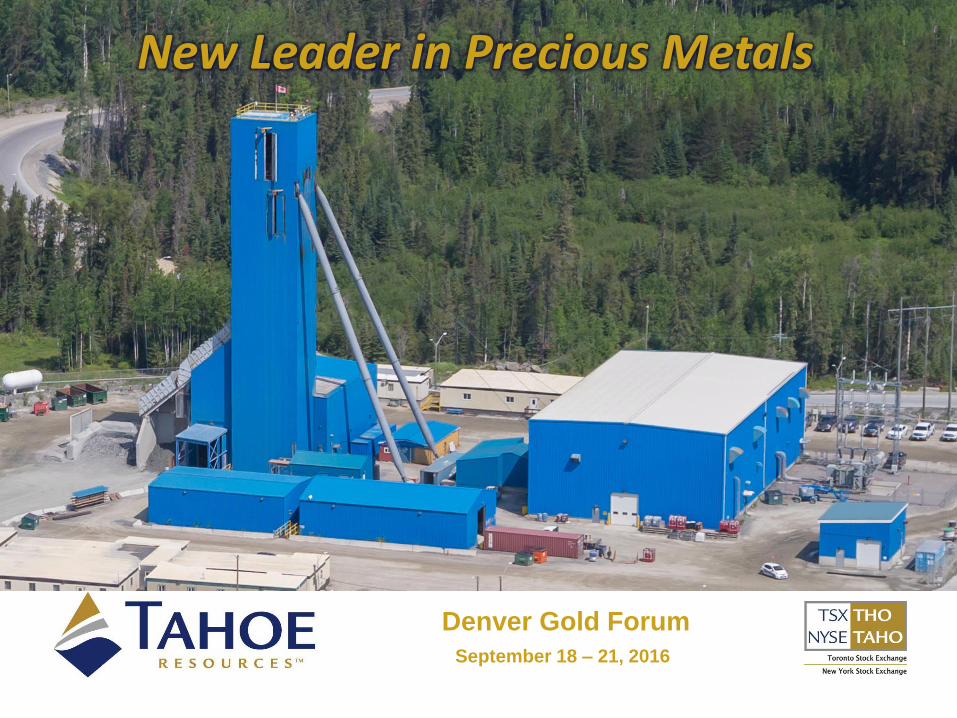
New Leader in Precious Metals
New Leader in Precious Metals
Denver Gold Forum
September 18 – 21, 2016
New Leader in Precious Metals
Safe Harbour Disclaimer
This presentation contains “forward-looking information” within the meaning of applicable Canadian securities legislation, and “forward-looking statements” within the meaning of
the United States Private Securities Litigation Reform Act of 1995 (collectively referred to as “forward-looking statements”). All statements, other than statements of historical fact,
are forward-looking statements. The words "believe", "expect", "anticipate", "contemplate", "target", "plan", "intend", "continue", "budget", "estimate", "may", "will", "schedule" and
similar expressions or statements identify forward-looking statements. Forward-looking statements in this presentation include, but are not limited to, statements and/or
information related to: (i) the Company’s 2016 outlook and production guidance, including estimates related to gold and silver mineral reserves and mineral resources,
production, total cash cost per ounce, all-in sustaining cost per ounce, capital expenditures, corporate general and administration expenses and exploration expenses, (ii)
estimated production over the life of the Escobal, La Arena, Timmins West and Bell Creek mines, (iii) estimates of royalties and taxes paid in Guatemala, Peru and Canada, (iv)
the timing of the anticipated commencement of commercial production at Shahuindo and the 144 Gap Deposit, (v) the advancement of exploration and development projects in
Guatemala, Peru and Canada, (vi) estimated mill and leach pad recoveries, smelter payables and doré and silver concentrate details over the first ten years of mine life, and (vii)
estimated production rates, grades, recoveries and costs at the Company’s operations in Guatemala, Peru and Canada. Forward-looking statements are based on
management’s reasonable assumptions, estimates, expectations, analyses and opinions, which are based on management’s experience and perception of trends, current
conditions and expected developments, and other factors that management believes are relevant and reasonable in the circumstances, but which may prove to be incorrect.
Assumptions have been made regarding, among other things: the Company’s performance and ability to implement operational improvements at the Escobal, La Arena, Timmins
West and Bell Creek mines; the Company’s ability to carry on exploration and development activities, including construction; the timely receipt of required approvals; the price of
silver, gold and other metals; prices for key mining supplies, including labor costs and consumables, remaining consistent with the Company’s current expectations; production
meeting expectations and being consistent with estimates; plant, equipment and processes operating as anticipated; there being no material variations in the current tax and
regulatory environment; the Company’s ability to operate in a safe, efficient and effective manner; the exchange rates among the Canadian dollar, Guatemalan quetzal, Peruvian
sol and the United States dollar remaining consistent with current levels; and the Company’s ability to obtain financing as and when required and on reasonable terms. Readers
are cautioned that the foregoing list is not exhaustive of all factors and assumptions which may have been used. The Company’s actual results, programs and financial position
could differ materially from those anticipated in such forward-looking statements as a result of numerous factors, risks and uncertainties, many of which are beyond the
Company’s control. These include, but are not necessarily limited to: the fluctuation of the price of silver, gold and other metals; changes in national and local government
legislation, taxation and controls or regulations; social unrest, and political or economic instability in Guatemala and/or Peru; the availability of additional funding as and when
required; the speculative nature of mineral exploration and development; the timing and ability to maintain and, where necessary, obtain necessary permits and licenses; the
uncertainty in the estimation of mineral resources and mineral reserves; the uncertainty in geologic, hydrological, metallurgical and geotechnical studies and opinions;
infrastructure risks, including access to water and power; the impact of inflation; changes in the administration of governmental regulation, policies and practices; environmental
risks and hazards; insurance and uninsured risks; land title risks; risks associated with illegal mining activities by unauthorized individuals on the Company’s mining or exploration
properties; risks associated with competition; risks associated with currency fluctuations; contractor, labor and employment risks; dependence on key management personnel
and executives; the timing and possible outcome of pending or threatened litigation; the risk of unanticipated litigation; risks associated with the repatriation of earnings; risks
associated with negative operating cash flow; risks associated with the Company’s hedging policies; risks associated with dilution; and risks associated with effecting service of
process and enforcing judgments. For a further discussion of risks relevant to the Company, see the Company’s Annual Informat ion Form available on SEDAR at
www.sedar.com under the heading “Description of Our Business – Risk Factors”. For a discussion of risks and uncertainties affecting the Company’s Canadian operations, see
Lake Shore Gold’s most recent Annual Information Form and other regulatory filings with the Canadian Securities Administrators, which are available on SEDAR under Lake
Shore Gold’s issuer profile. There is no assurance that forward-looking statements will prove to be accurate. Actual results, performance or achievement could differ materially
from those expressed in, or implied by, these forward-looking statements and, accordingly, no assurance can be given that any of the events anticipated by the forward-looking
statements will transpire or occur, or if any of them do so, what benefits may be derived there from. Accordingly, readers should not place undue reliance on this information.
Tahoe does not undertake to update publicly or revise any forward-looking statements, except as, and to the extent required by, applicable securities laws. For more information
about the risks and challenges of Tahoe’s business, investors should review Tahoe’s current Annual Information Form available at www.sedar.com. All prices in U.S. Dollars
unless otherwise stated.
2
New Leader in Precious Metals
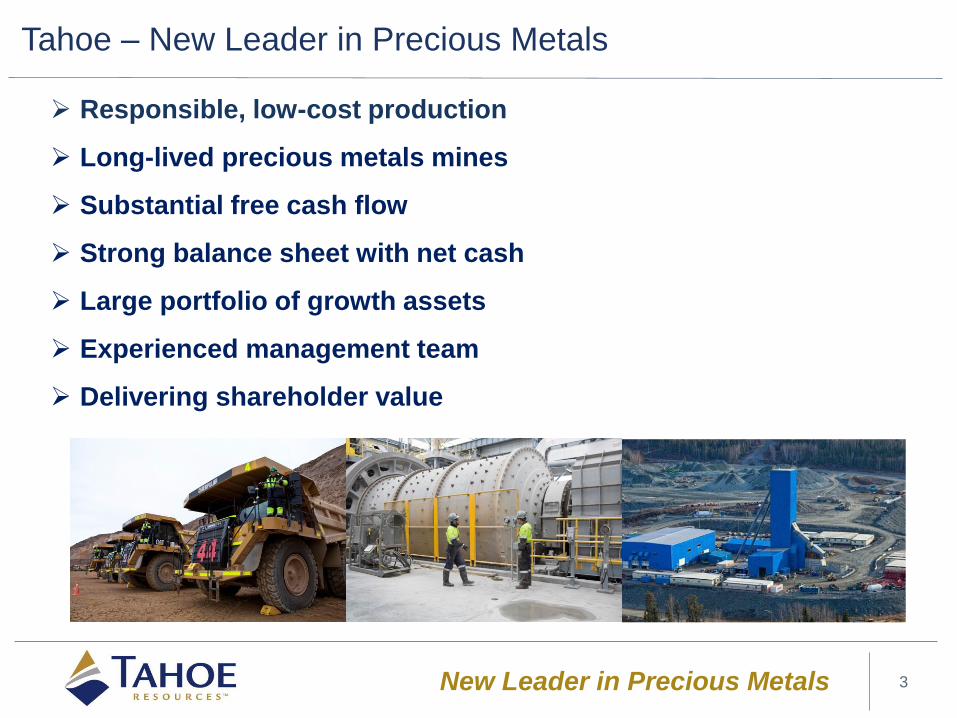
Tahoe – New Leader in Precious Metals
3
Responsible, low-cost production
Long-lived precious metals mines
Substantial free cash flow
Strong balance sheet with net cash
Large portfolio of growth assets
Experienced management team
Delivering shareholder value
New Leader in Precious Metals
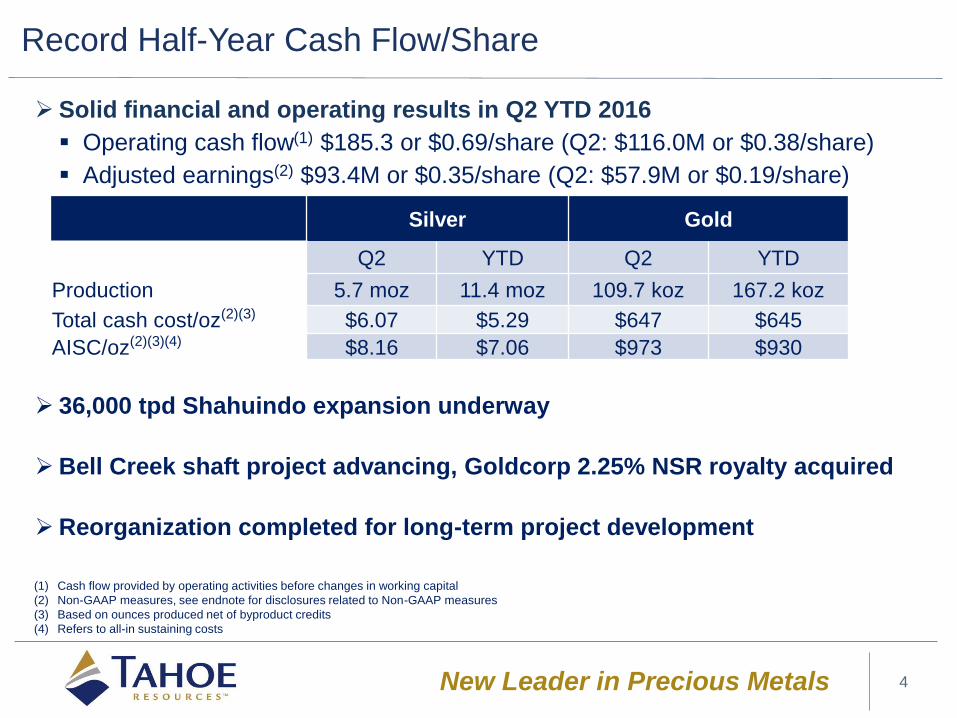
Record Half-Year Cash Flow/Share
4
Solid financial and operating results in Q2 YTD 2016
Operating cash flow(1) $185.3 or $0.69/share (Q2: $116.0M or $0.38/share)
Adjusted earnings(2) $93.4M or $0.35/share (Q2: $57.9M or $0.19/share)
Operating cash flow of $128.5M or $0.42 per share
36,000 tpd Shahuindo expansion underway
Bell Creek shaft project advancing, Goldcorp 2.25% NSR royalty acquired
Reorganization completed for long-term project development
Silver Gold
Q2 YTD Q2 YTD
Production 5.7 moz 11.4 moz 109.7 koz 167.2 koz
Total cash cost/oz(2)(3) $6.07 $5.29 $647 $645
AISC/oz(2)(3)(4) $8.16 $7.06 $973 $930
(1) Cash flow provided by operating activities before changes in working capital
(2) Non-GAAP measures, see endnote for disclosures related to Non-GAAP measures
(3) Based on ounces produced net of byproduct credits
(4) Refers to all-in sustaining costs

New Leader in Precious Metals
2016 Corporate Guidance – Silver Guidance Improved
5
2016 Production Silver Gold
New Previous
Production 18 – 21 moz 18 – 21 moz 370 – 430 kozs
Total cash cost/oz $5.50 – $6.50 $7.50 – $8.50 $675 – $725
AISC/oz produced $8.00 – $9.00 $10.00 – $11.00 $950 – $1,000
Corporate Guidance ($ Millions)
Sustaining Capital $115 - $135 million
Project Capital $80 - $105 million
Total Capital $195 - $240 million
Corporate G & A (includes non-cash compensation) $45 - $50 million
Exploration expenses $15 - $20 million
New Leader in Precious Metals
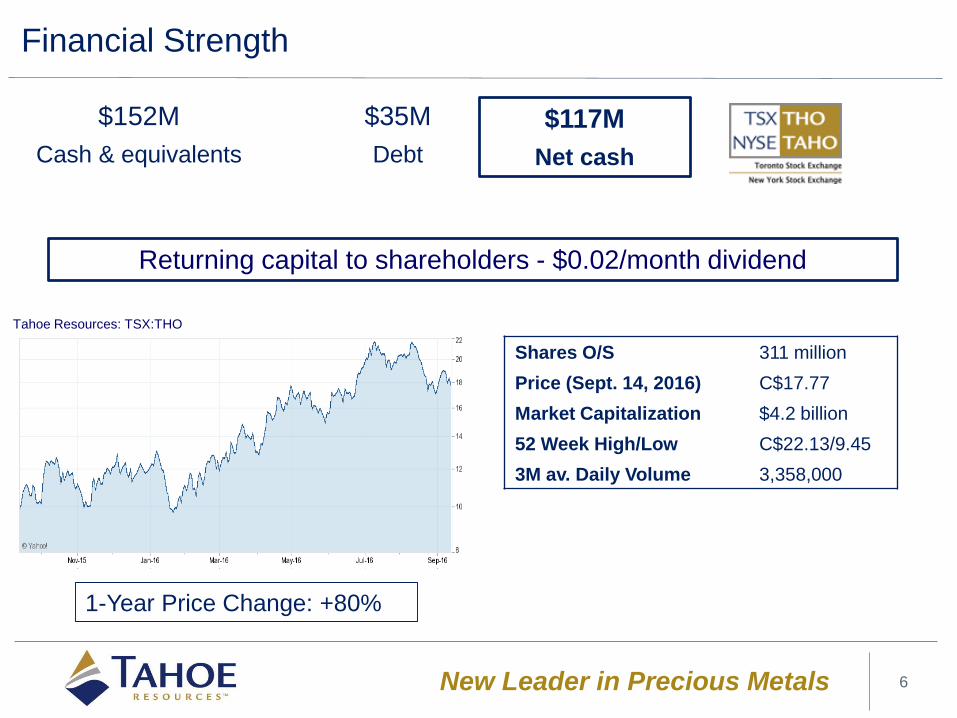
Financial Strength
6
$152M
Cash & equivalents
$35M
Debt
Returning capital to shareholders - $0.02/month dividend
Shares O/S 311 million
Price (Sept. 14, 2016) C$17.77
Market Capitalization $4.2 billion
52 Week High/Low C$22.13/9.45
3M av. Daily Volume 3,358,000
Tahoe Resources: TSX:THO
$117M
Net cash
1-Year Price Change: +80%

New Leader in Precious Metals
Accountability
• Conducts business to highest international CSR standards:
Good Governance
Transparency
• GRI-compliant sustainability reporting
Awards
• CSCS: Best Sustainability, Ethics and Governance Program
• BWI: TopGun Company, BOD and CEO
Social Responsibility
7
UN Guiding Principles on
Business & Human Rights
Voluntary Principles on
Security & Human Rights
IFC Performance
Standards
Equator Principles
CSR PolicyHuman Rights Policy

New Leader in Precious Metals
Grow low-cost gold production to >550 koz/year
Gold production in Peru to 300 koz/year by 2018
Gold production in Timmins to >250 koz/year by 2020
Silver production at Escobal mine steady at ~20.0 moz/year
Grow mine life at all operations
>20 years in both Guatemala and Peru
Reserve/Resource growth in Timmins 2.0 to 4.0 moz
Tahoe By 2020(1)
8
(1) Contains Forward-looking Information
(2) 2015 gold production pro forma to include full-year results from Rio Alto
(3) Q2 YTD 2016 results pro forma to include six-month results for Lake Shore Gold Division
230 204(Q2 YTD)
370 – 430
>550
2015 2016 2020
Projected Gold Production(2)(3)
(000's of Ounces)
Actual Target Range
New Leader in Precious Metals
Escobal: World’s Third Largest Silver Mine
9
Low-cost production
11.4 moz silver produced H1/16, 5.7 moz Q2/16
Total cash costs: $5.29/oz H1/16; $6.07/oz Q2/16
AISC: $7.06/oz H1/16; $8.16/oz Q2/16
Op. cost/tonne: $95.80 2014, $79.11 2015, $73.24 Q2 YTD 2016
Strong profitability and cash flow Mine operating earnings: $81.6M in H1/16, $49.9M in Q2/16
Long reserve life (~18 years currently)
P&P reserves: 29.1M tonnes @ 332 gpt for 310.4 moz
New Leader in Precious Metals
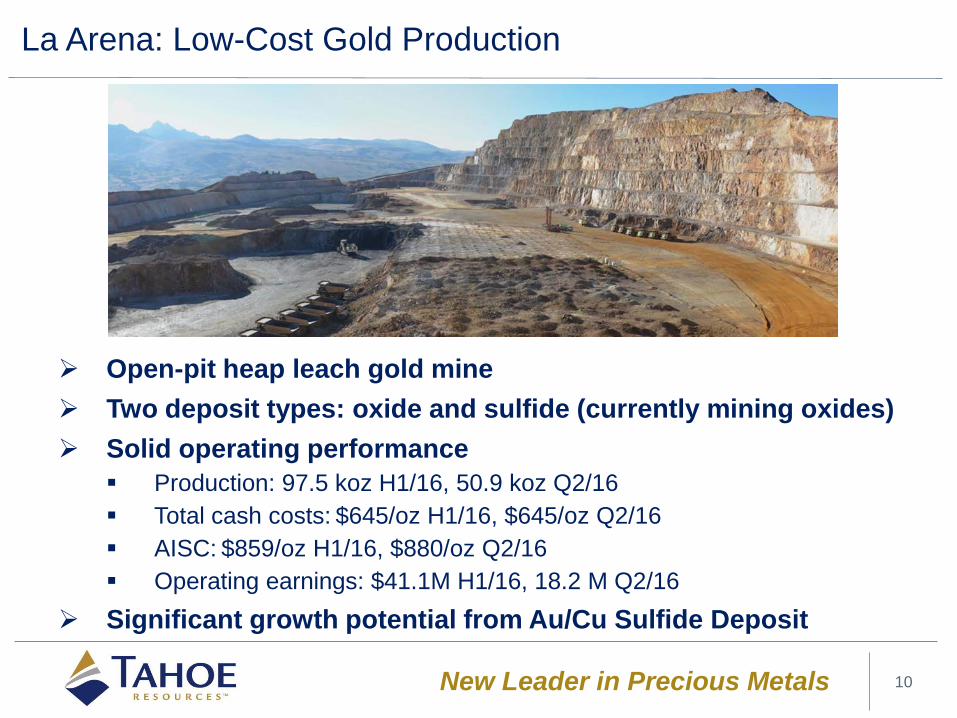
La Arena: Low-Cost Gold Production
10
Open-pit heap leach gold mine
Two deposit types: oxide and sulfide (currently mining oxides)
Solid operating performance
Production: 97.5 koz H1/16, 50.9 koz Q2/16
Total cash costs: $645/oz H1/16, $645/oz Q2/16
AISC: $859/oz H1/16, $880/oz Q2/16
Operating earnings: $41.1M H1/16, 18.2 M Q2/16
Significant growth potential from Au/Cu Sulfide Deposit
New Leader in Precious Metals
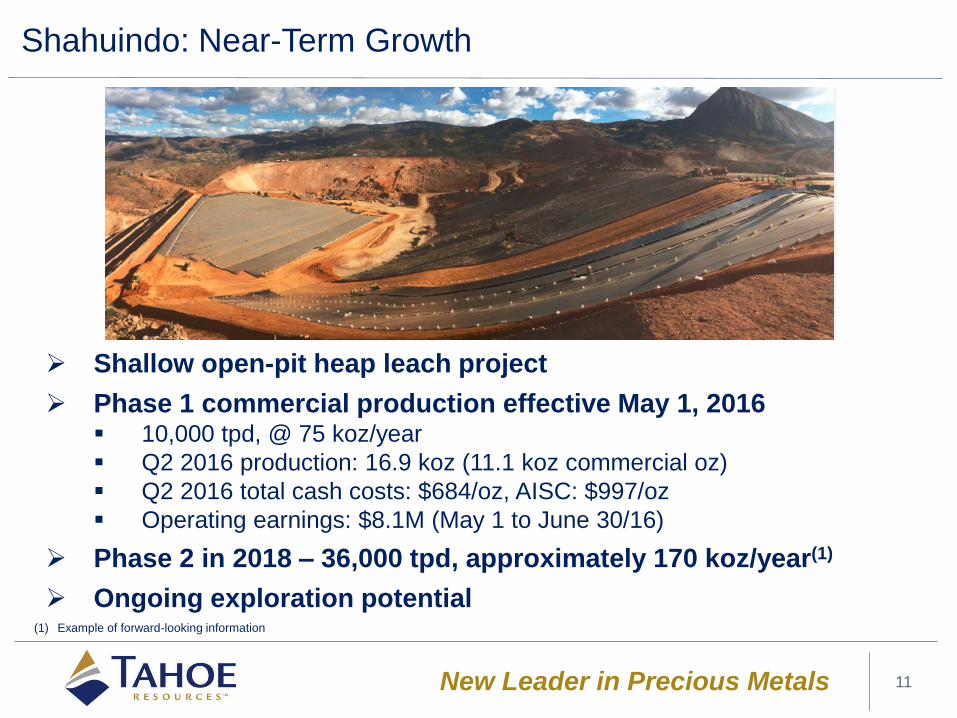
Shahuindo: Near-Term Growth
11
(1) Example of forward-looking information
Shallow open-pit heap leach project
Phase 1 commercial production effective May 1, 2016 10,000 tpd, @ 75 koz/year
Q2 2016 production: 16.9 koz (11.1 koz commercial oz)
Q2 2016 total cash costs: $684/oz, AISC: $997/oz
Operating earnings: $8.1M (May 1 to June 30/16)
Phase 2 in 2018 – 36,000 tpd, approximately 170 koz/year(1)
Ongoing exploration potential
New Leader in Precious Metals
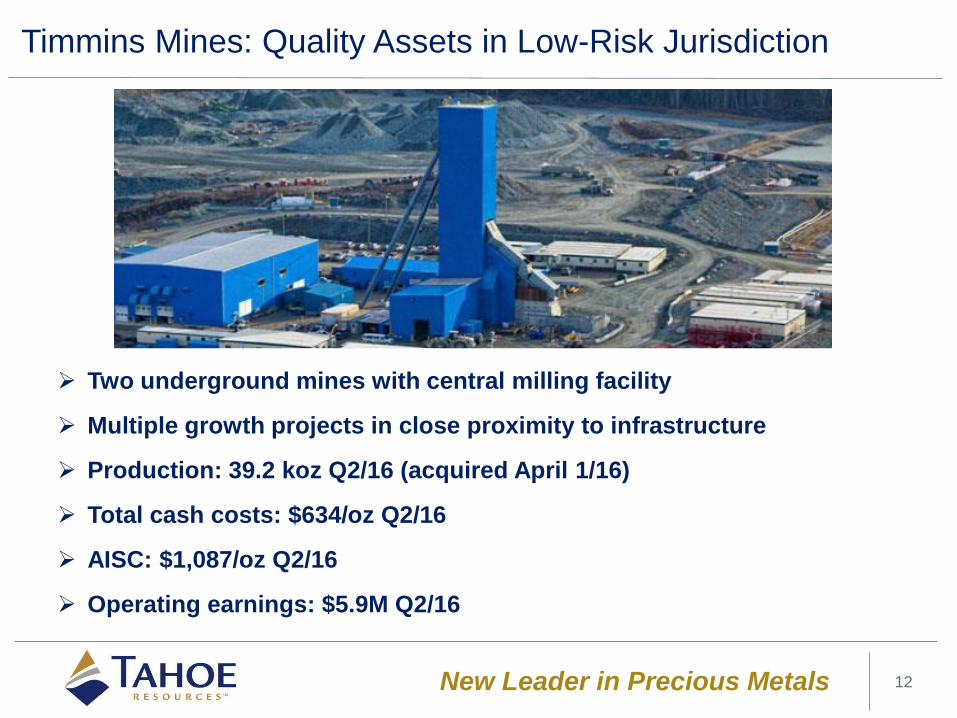
Timmins Mines: Quality Assets in Low-Risk Jurisdiction
12
Two underground mines with central milling facility
Multiple growth projects in close proximity to infrastructure
Production: 39.2 koz Q2/16 (acquired April 1/16)
Total cash costs: $634/oz Q2/16
AISC: $1,087/oz Q2/16
Operating earnings: $5.9M Q2/16
New Leader in Precious Metals
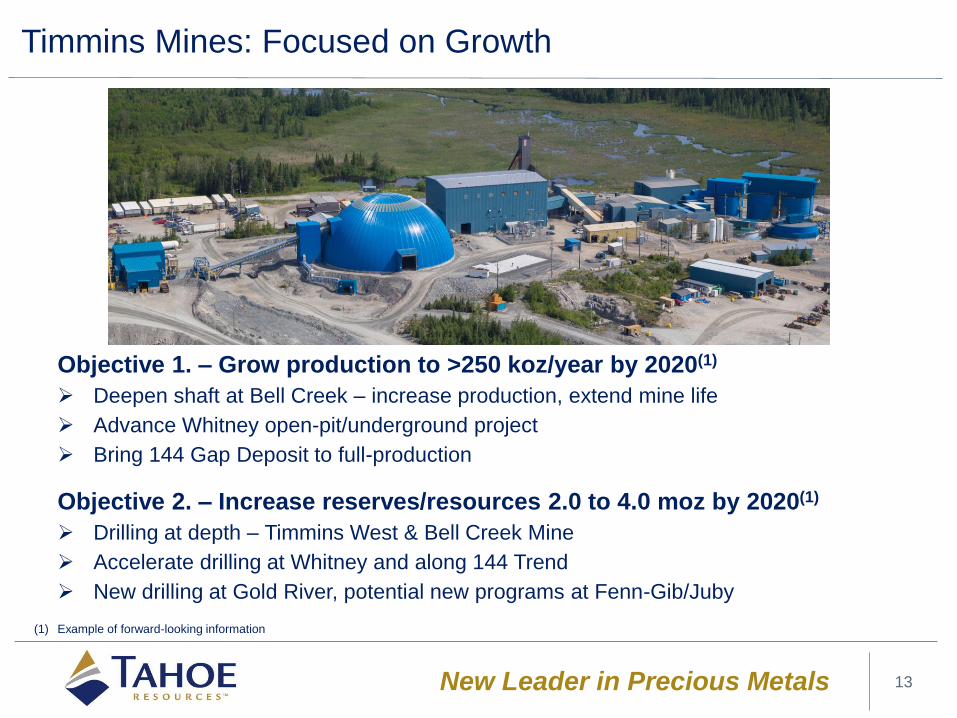
Timmins Mines: Focused on Growth
13
Objective 1. – Grow production to >250 koz/year by 2020(1)
Deepen shaft at Bell Creek – increase production, extend mine life
Advance Whitney open-pit/underground project
Bring 144 Gap Deposit to full-production
(1) Example of forward-looking information
Objective 2. – Increase reserves/resources 2.0 to 4.0 moz by 2020(1)
Drilling at depth – Timmins West & Bell Creek Mine
Accelerate drilling at Whitney and along 144 Trend
New drilling at Gold River, potential new programs at Fenn-Gib/Juby
New Leader in Precious Metals
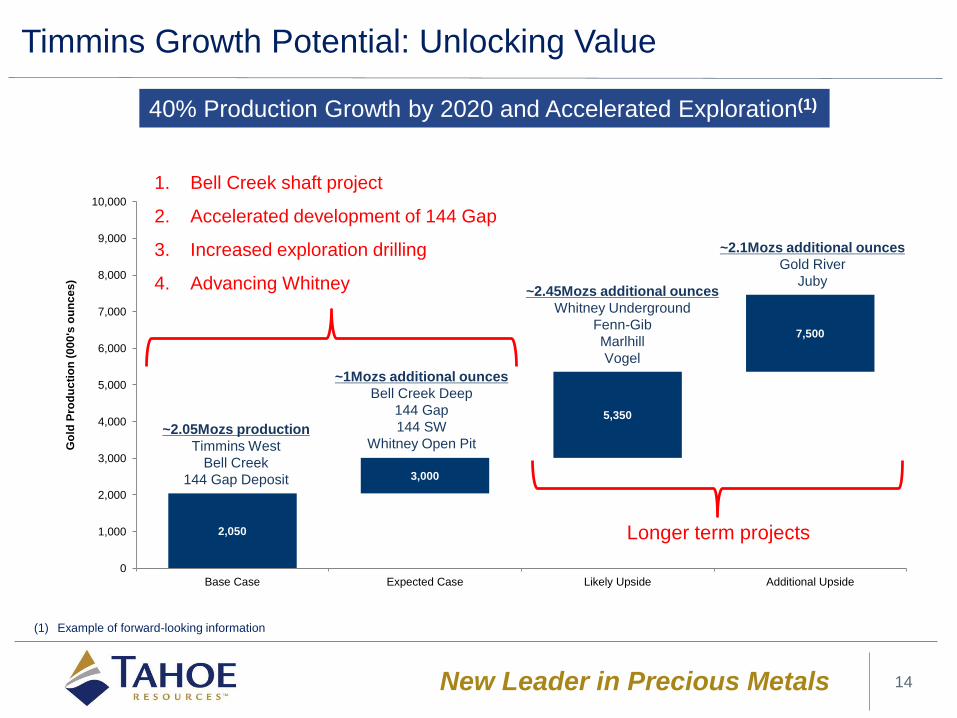
2,050
3,000
5,350
7,500
0
1,000
2,000
3,000
4,000
5,000
6,000
7,000
8,000
9,000
10,000
Base Case Expected Case Likely Upside Additional Upside
Go
ld P
rod
uc
tio
n (
00
0's
ou
nc
es
)
14
40% Production Growth by 2020 and Accelerated Exploration(1)
~2.05Mozs production
Timmins West
Bell Creek
144 Gap Deposit
~1Mozs additional ounces
Bell Creek Deep
144 Gap
144 SW
Whitney Open Pit
~2.45Mozs additional ounces
Whitney Underground
Fenn-Gib
Marlhill
Vogel
~2.1Mozs additional ounces
Gold River
Juby
1. Bell Creek shaft project
2. Accelerated development of 144 Gap
3. Increased exploration drilling
4. Advancing Whitney
(1) Example of forward-looking information
Longer term projects
Timmins Growth Potential: Unlocking Value

New Leader in Precious Metals
Timmins West Mine – Developing 144 Gap
910mL
Exploration
Drift
Exploration Drift
off TC Ramp
~TC850mL
Could test down-
plunge extension
approx. 425m
Could test down-
plunge extension
approx. 250m
South-West Zone
Timmins Deposit Thunder Creek 144 Gap
TC395mL
650mL
270mL
TC765mL
HWY 144 Drift
144 Gap DepositIndicated: 1,734,000 tonnes @ 5.41 gpt (301.7k oz)
Inferred: 1,914,000 tonnes @ 5.19 gpt (319.2k oz)
Exploration
Drift
off TM Ramp
~1230mL
15
New Leader in Precious Metals
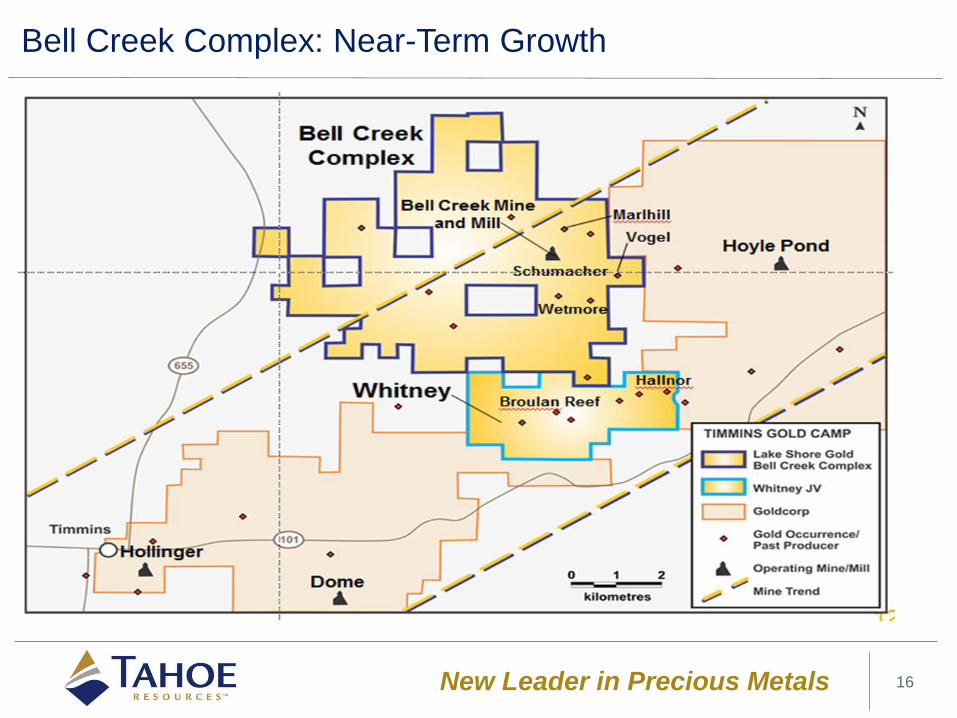
Bell Creek Complex: Near-Term Growth
16
New Leader in Precious Metals
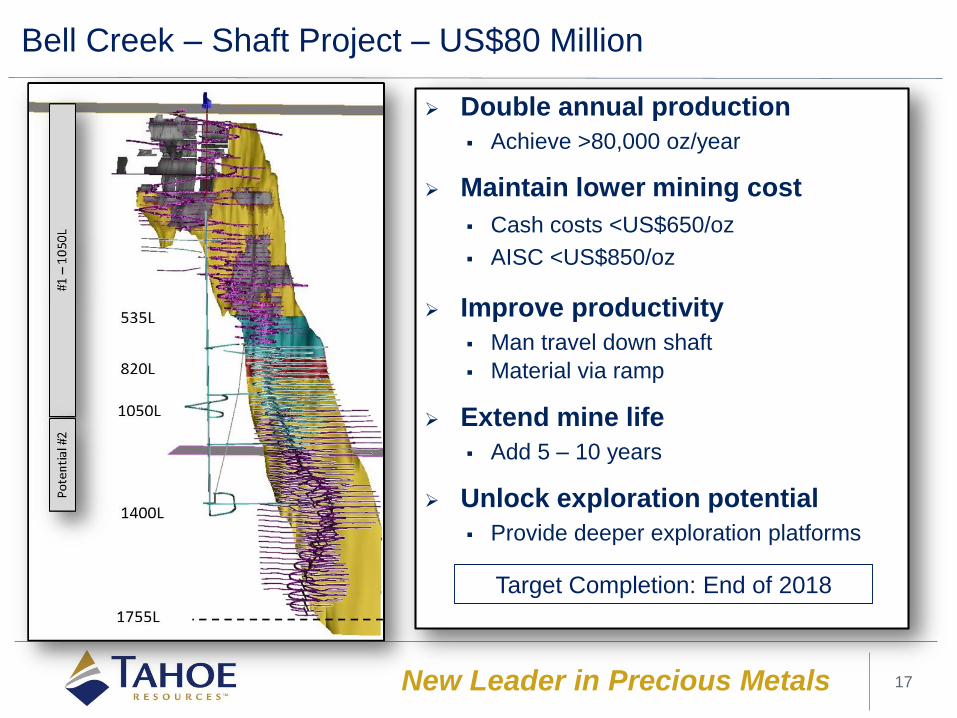
Bell Creek – Shaft Project – US$80 Million
Double annual production
Achieve >80,000 oz/year
Maintain lower mining cost
Cash costs <US$650/oz
AISC <US$850/oz
Improve productivity
Man travel down shaft
Material via ramp
Extend mine life
Add 5 – 10 years
Unlock exploration potential
Provide deeper exploration platforms
Target Completion: End of 2018
17
New Leader in Precious Metals
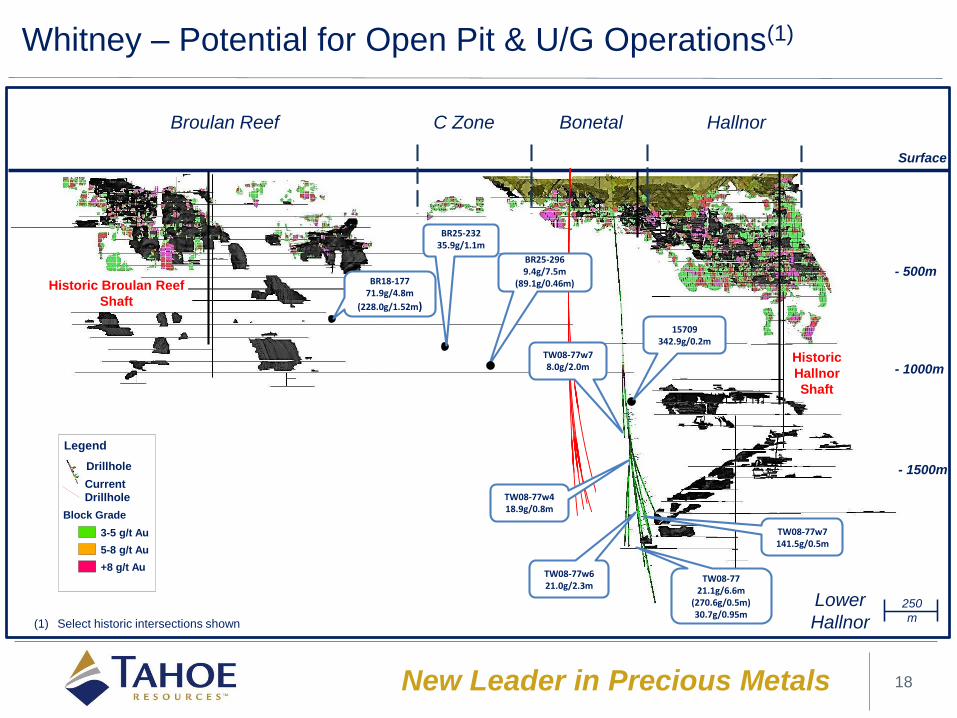
Whitney – Potential for Open Pit & U/G Operations(1)
18
- 500m
Surface
Broulan Reef C Zone Bonetal Hallnor
Lower
Hallnor250
m
Legend
Drillhole
CurrentDrillhole
Block Grade
3-5 g/t Au
5-8 g/t Au
+8 g/t Au
- 1000m
- 1500m
TW08-77w78.0g/2.0m
TW08-77w418.9g/0.8m
TW08-77w7141.5g/0.5m
TW08-77w621.0g/2.3m
TW08-7721.1g/6.6m
(270.6g/0.5m)30.7g/0.95m
BR18-17771.9g/4.8m
(228.0g/1.52m)
BR25-23235.9g/1.1m
BR25-2969.4g/7.5m
(89.1g/0.46m)
15709342.9g/0.2m
(1) Select historic intersections shown
Historic
Hallnor
Shaft
Historic Broulan Reef
Shaft
New Leader in Precious Metals 19
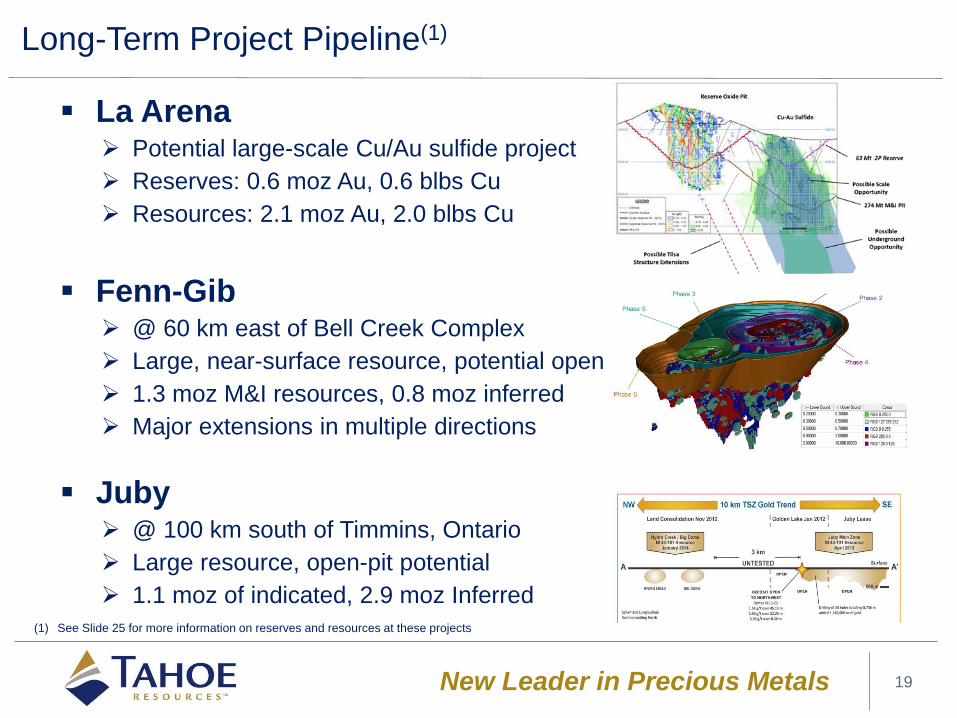
Fenn-Gib @ 60 km east of Bell Creek Complex
Large, near-surface resource, potential open-pit
1.3 moz M&I resources, 0.8 moz inferred
Major extensions in multiple directions
Juby @ 100 km south of Timmins, Ontario
Large resource, open-pit potential
1.1 moz of indicated, 2.9 moz Inferred
La Arena Potential large-scale Cu/Au sulfide project
Reserves: 0.6 moz Au, 0.6 blbs Cu
Resources: 2.1 moz Au, 2.0 blbs Cu
Long-Term Project Pipeline(1)
(1) See Slide 25 for more information on reserves and resources at these projects

New Leader in Precious Metals
Tahoe – New Leader in Precious Metals
20
Low-cost production – strong FCF 370 – 430 koz gold & 18 – 21 moz silver per year
Silver cash costs $5.50 to $6.50/oz, AISC $8.00 to $9.00/oz
Gold cash costs $675 to 725/oz, AISC $950 to $1,000/oz
$185.3M cash flow from operating activities in first half 2016
Strong net-cash balance sheet $152M cash and equivalents at June 30, 2016
$35M in debt
Untapped $150M credit facility
Large portfolio of growth assets Growing gold production in Peru and Canada
Attractive exploration targets in all regions
Responsible, experienced management team
Delivering shareholder value Peer-leading and sustainable monthly dividend
Share price up over 200% since 2010 IPO
New Leader in Precious Metals
Appendices
21

New Leader in Precious Metals
Guatemala Resources & Reserves – January 2016
22
ESCOBAL
Measured & Indicated Mineral Resources
Tonnes (M)
Silver (g/t)
Gold (g/t)
Lead (%)
Zinc (%)
Silver (koz)
Gold (koz)
Lead (ktonnes)
Zinc (ktonnes)
36.5 332 0.33 0.71 1.18 389,437 385.0 260.2 430.5
Inferred Mineral Resources
Tonnes (M)
Silver (g/t)
Gold (g/t)
Lead (%)
Zinc (%)
Silver (koz)
Gold (koz)
Lead (ktonnes)
Zinc (ktonnes)
1.4 205 1.11 0.24 0.45 9,320 50.4 3.4 6.3
Proven & Probable Mineral Reserves
Tonnes (M)
Silver (g/t)
Gold (g/t)
Lead (%)
Zinc (%)
Silver (koz)
Gold (koz)
Lead (ktonnes)
Zinc (ktonnes)
29.1 332 0.33 0.73 1.19 310,418 304.6 211.9 346.9
New Leader in Precious Metals
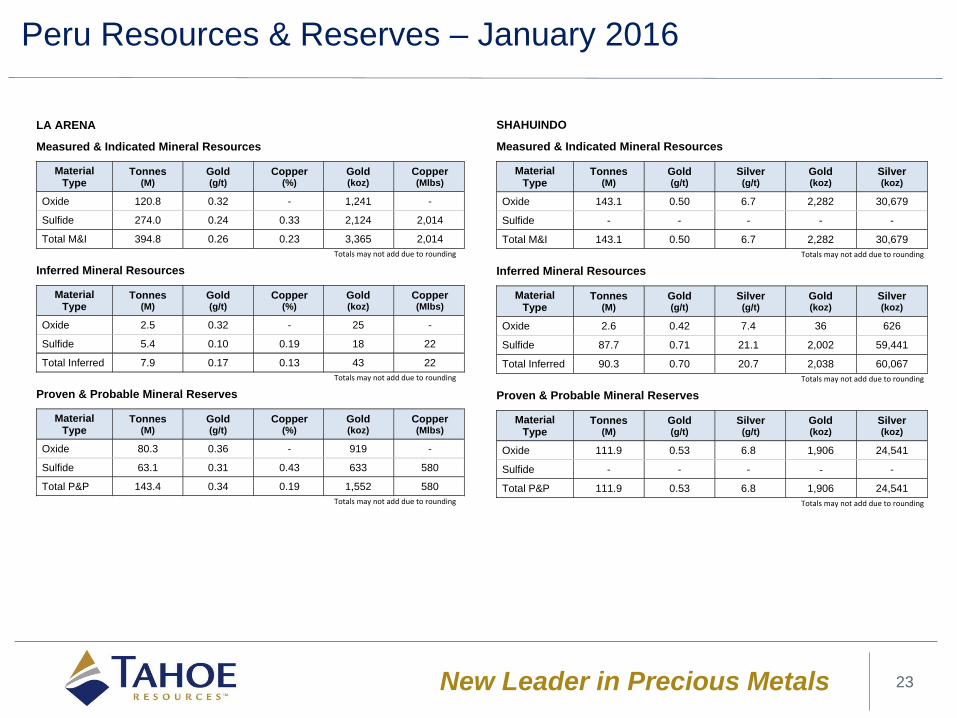
Peru Resources & Reserves – January 2016
23
LA ARENA
Measured & Indicated Mineral Resources
Material Type
Tonnes (M)
Gold (g/t)
Copper (%)
Gold (koz)
Copper (Mlbs)
Oxide 120.8 0.32 - 1,241 -
Sulfide 274.0 0.24 0.33 2,124 2,014
Total M&I 394.8 0.26 0.23 3,365 2,014
Totals may not add due to rounding
Inferred Mineral Resources
Material Type
Tonnes (M)
Gold (g/t)
Copper (%)
Gold (koz)
Copper (Mlbs)
Oxide 2.5 0.32 - 25 -
Sulfide 5.4 0.10 0.19 18 22
Total Inferred 7.9 0.17 0.13 43 22
Totals may not add due to rounding
Proven & Probable Mineral Reserves
Material Type
Tonnes (M)
Gold (g/t)
Copper (%)
Gold (koz)
Copper (Mlbs)
Oxide 80.3 0.36 - 919 -
Sulfide 63.1 0.31 0.43 633 580
Total P&P 143.4 0.34 0.19 1,552 580
Totals may not add due to rounding
SHAHUINDO
Measured & Indicated Mineral Resources
Material Type
Tonnes (M)
Gold (g/t)
Silver (g/t)
Gold (koz)
Silver (koz)
Oxide 143.1 0.50 6.7 2,282 30,679
Sulfide - - - - -
Total M&I 143.1 0.50 6.7 2,282 30,679
Totals may not add due to rounding
Inferred Mineral Resources
Material Type
Tonnes (M)
Gold (g/t)
Silver (g/t)
Gold (koz)
Silver (koz)
Oxide 2.6 0.42 7.4 36 626
Sulfide 87.7 0.71 21.1 2,002 59,441
Total Inferred 90.3 0.70 20.7 2,038 60,067
Totals may not add due to rounding
Proven & Probable Mineral Reserves
Material Type
Tonnes (M)
Gold (g/t)
Silver (g/t)
Gold (koz)
Silver (koz)
Oxide 111.9 0.53 6.8 1,906 24,541
Sulfide - - - - -
Total P&P 111.9 0.53 6.8 1,906 24,541
Totals may not add due to rounding
New Leader in Precious Metals 24
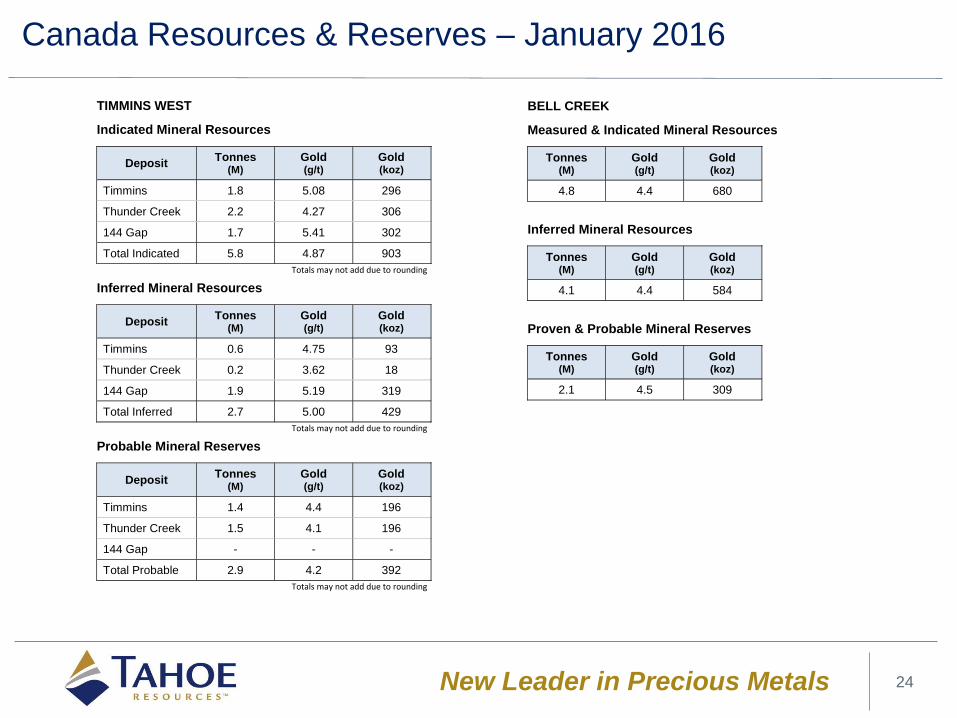
Canada Resources & Reserves – January 2016
TIMMINS WEST
Indicated Mineral Resources
Deposit Tonnes
(M) Gold (g/t)
Gold (koz)
Timmins 1.8 5.08 296
Thunder Creek 2.2 4.27 306
144 Gap 1.7 5.41 302
Total Indicated 5.8 4.87 903
Totals may not add due to rounding
Inferred Mineral Resources
Deposit Tonnes
(M) Gold (g/t)
Gold (koz)
Timmins 0.6 4.75 93
Thunder Creek 0.2 3.62 18
144 Gap 1.9 5.19 319
Total Inferred 2.7 5.00 429
Totals may not add due to rounding
Probable Mineral Reserves
Deposit Tonnes
(M) Gold (g/t)
Gold (koz)
Timmins 1.4 4.4 196
Thunder Creek 1.5 4.1 196
144 Gap - - -
Total Probable 2.9 4.2 392
Totals may not add due to rounding
BELL CREEK
Measured & Indicated Mineral Resources
Tonnes (M)
Gold (g/t)
Gold (koz)
4.8 4.4 680
Inferred Mineral Resources
Tonnes (M)
Gold (g/t)
Gold (koz)
4.1 4.4 584
Proven & Probable Mineral Reserves
Tonnes (M)
Gold (g/t)
Gold (koz)
2.1 4.5 309

New Leader in Precious Metals
Quality Mines & Growth Projects(1)(2)
25
(1) Includes examples of forward-looking information
(2) M&I resources reported inclusive of mineral reserves
La Arena Sulfides
Reserves Au 0.6 moz @ 0.31gpt
Reserves Cu 0.6 blbs @ 0.43%
M&I Res. Au 2.1 moz @ 0.24gpt
M&I Res. Cu 2.0 blbs @ 0.33%
Shahuindo Sulfides
Inf. Res. Au 2.0 moz @ 0.71gpt
Inf. Res. Ag 59 moz @ 21gpt
Timmins West Bell Creek
2016E Prod. 170-180 koz Au
Cash Costs <$650/oz
AISC <$950/oz
Reserves Au 0.4 moz @ 4.20gpt 0.3 moz @ 4.50gpt
M&I Res. Au 0.9 moz @ 4.87gpt 0.7 moz @ 4.39gpt
Inferred Res. Au 0.4 moz @ 5.00gpt 0.6moz @ 4.40gpt
Americas-Based Precious Metals Producer – Canada, Guatemala, Peru
Other Lake Shore Assets
Resources M&I (moz) Inferred (moz)
Whitney 0.7 @ 6.85g/t 0.2 @ 5.34g/t
Gold River 0.1 @ 5.29g/t 1.0 @ 6.06g/t
Juby 1.1 @ 1.28g/t 2.9 @ 0.94g/t
Fenn-Gib 1.3 @ 0.99g/t 0.8 @ 0.95g/t
Escobal
2016E Prod. 20-21 moz Ag
Cash Costs $5.50-$6.50/oz
AISC $8.00-$9.00/oz
Reserves Ag 310 moz @ 332g/t
M&I Res. Ag 389 moz @ 332g/t
La Arena Oxides Shahuindo Oxides
2016E Prod. 200-250 koz Au
Cash Costs $700-$750/oz
AISC $950-$1,050/oz
Reserves Au 0.9 moz @ 0.36g/t 1.9 mozs @ 0.53g/t
M&I Res. Au 1.2 moz @ 0.32g/t 2.3 mozs @ 0.50g/t

New Leader in Precious Metals
Shahuindo Mine Expansion Targets
26
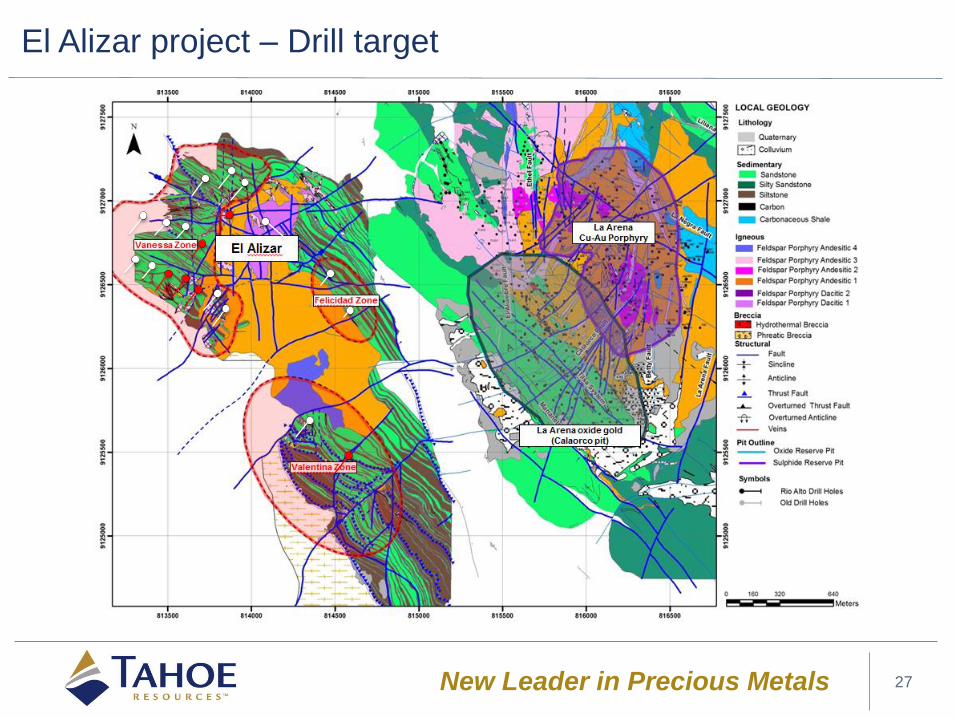
New Leader in Precious Metals 27
El Alizar project – Drill target
New Leader in Precious Metals
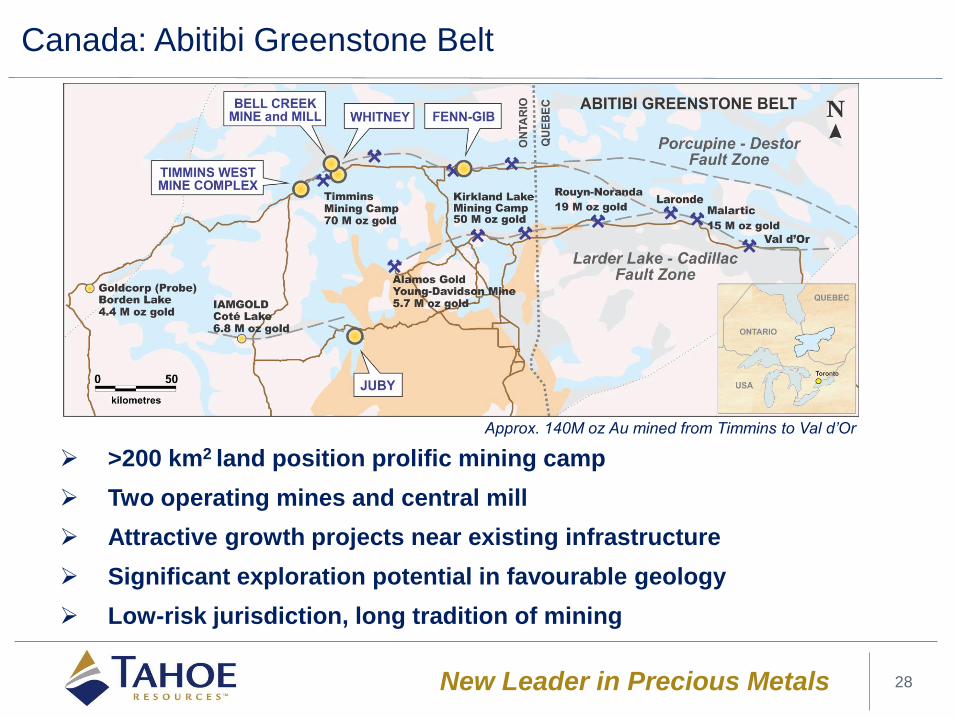
Canada: Abitibi Greenstone Belt
28
>200 km2 land position prolific mining camp
Two operating mines and central mill
Attractive growth projects near existing infrastructure
Significant exploration potential in favourable geology
Low-risk jurisdiction, long tradition of mining
Approx. 140M oz Au mined from Timmins to Val d’Or
New Leader in Precious Metals
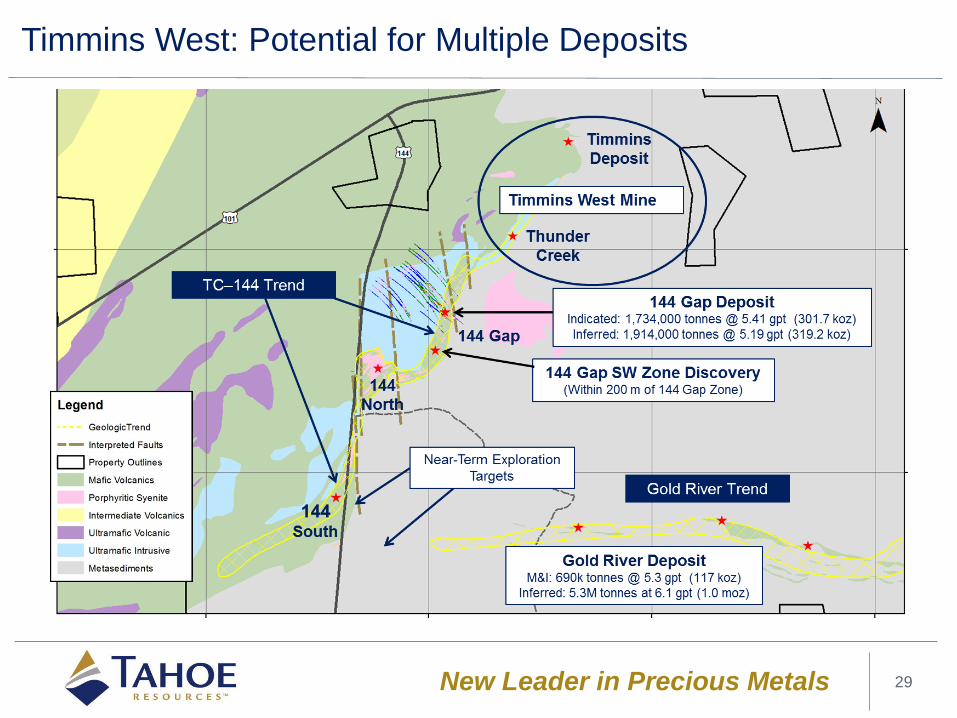
Timmins West: Potential for Multiple Deposits
29
New Leader in Precious Metals
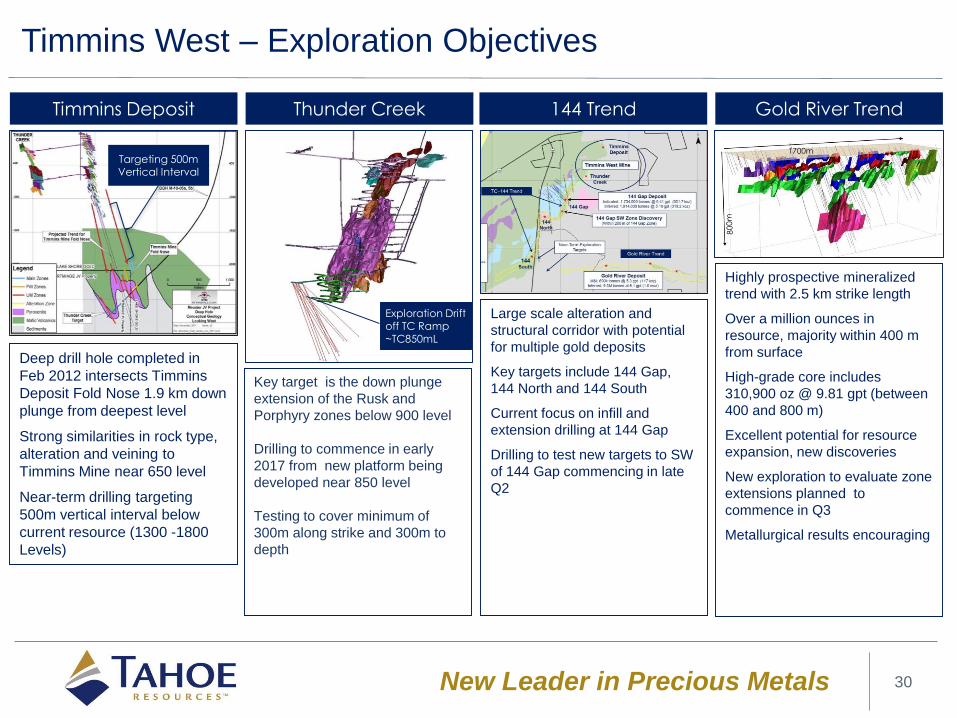
Timmins West – Exploration Objectives
30
Timmins Deposit Thunder Creek 144 Trend Gold River Trend
Deep drill hole completed in
Feb 2012 intersects Timmins
Deposit Fold Nose 1.9 km down
plunge from deepest level
Strong similarities in rock type,
alteration and veining to
Timmins Mine near 650 level
Near-term drilling targeting
500m vertical interval below
current resource (1300 -1800
Levels)
Targeting 500mVertical Interval
Exploration Drift off TC Ramp ~TC850mL
Key target is the down plunge
extension of the Rusk and
Porphyry zones below 900 level
Drilling to commence in early
2017 from new platform being
developed near 850 level
Testing to cover minimum of
300m along strike and 300m to
depth
Highly prospective mineralized
trend with 2.5 km strike length
Over a million ounces in
resource, majority within 400 m
from surface
High-grade core includes
310,900 oz @ 9.81 gpt (between
400 and 800 m)
Excellent potential for resource
expansion, new discoveries
New exploration to evaluate zone
extensions planned to
commence in Q3
Metallurgical results encouraging
1700m
Large scale alteration and
structural corridor with potential
for multiple gold deposits
Key targets include 144 Gap,
144 North and 144 South
Current focus on infill and
extension drilling at 144 Gap
Drilling to test new targets to SW
of 144 Gap commencing in late
Q2
New Leader in Precious Metals
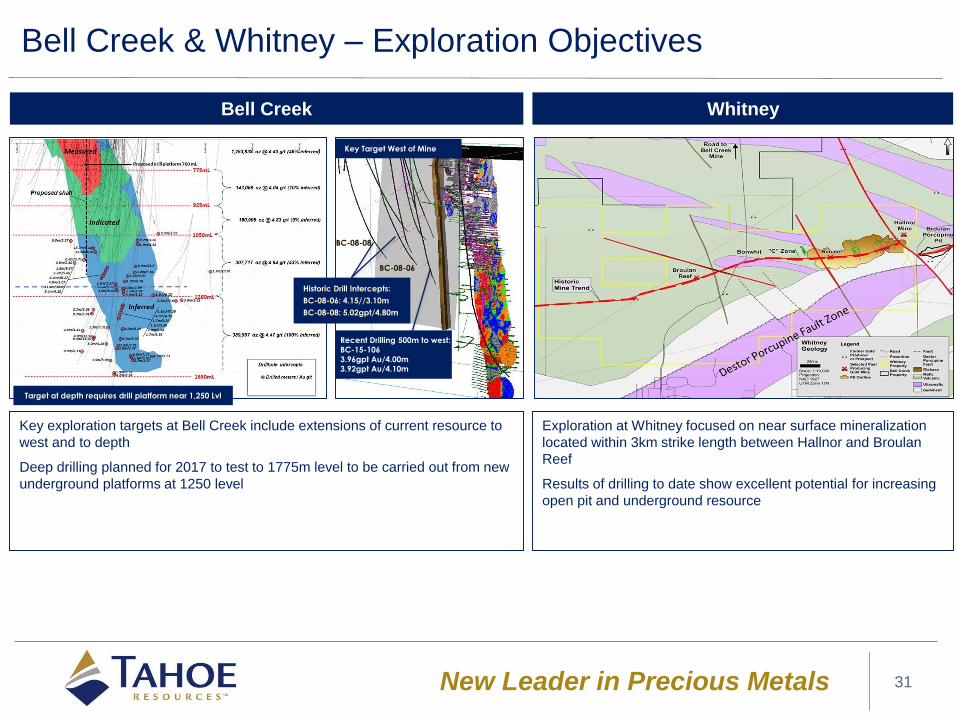
Bell Creek & Whitney – Exploration Objectives
31
Bell Creek Whitney
Key exploration targets at Bell Creek include extensions of current resource to
west and to depth
Deep drilling planned for 2017 to test to 1775m level to be carried out from new
underground platforms at 1250 level
Exploration at Whitney focused on near surface mineralization
located within 3km strike length between Hallnor and Broulan
Reef
Results of drilling to date show excellent potential for increasing
open pit and underground resource
Historic Drill Intercepts:
BC-08-06: 4.15//3.10m
BC-08-08: 5.02gpt/4.80m
BC-08-06
BC-08-08
Recent Drilling 500m to west:
BC-15-106
3.96gpt Au/4.00m
3.92gpt Au/4.10m
Key Target West of Mine
Target at depth requires drill platform near 1,250 Lvl
New Leader in Precious Metals
Non-GAAP Measures
32
The Company has included certain non-GAAP financial measures throughout this presentation which include total cash costs and all-in
sustaining costs per silver and per gold ounce (“all-in sustaining costs”). These measures are not defined under IFRS and may be calculated
differently by other companies depending on the underlying accounting principles and policies applied. As such, these Non-GAAP should not
be considered in isolation. These non-GAAP financial measures. The Company’s Escobal mine produces primarily silver in concentrates with
other metals (gold, lead and zinc), produced simultaneously in the mining process, the value of which represents a small percentage of the
Company’s revenue and is therefore considered “byproduct”. The Company’s La Arena, Timmins West and Bell Creek mines produces
primarily gold with other metals (primarily silver), produced simultaneously in the mining process, the value of which represents a small
percentage of the Company’s revenue and is therefore considered byproduct. The Company believes these measures will provide investors
and analysts with useful information about the Company’s underlying earnings, cash costs of operations, the impact of byproduct credits on
the Company’s cost structure and its ability to generate cash flow, as well as providing a meaningful comparison to other mining companies.
These measures are intended to provide additional information and should not be substituted for GAAP measures.
The Company reports total cash costs and total production costs on a silver ounce and a gold ounce produced basis. The Company follows
the recommendation of the cost standard as endorsed by the Silver Institute (“the Institute”) for the reporting of cash costs (silver) and the
generally accepted standard of reporting cash costs (gold) by precious metal mining companies. The Institute is a nonprofit international
association with membership from across the silver industry. The Institute serves as the industry’s voice in increasing public understanding of
the many uses and values of silver. This remains the generally accepted standard for reporting cash costs of production by precious metal
mining companies. Total cash costs and total production costs are divided by the number of silver ounces contained in concentrate or gold
ounces recovered from the leach pads to calculate per ounce figures. When deriving the production costs associated with an ounce of silver
or gold, the Company deducts byproduct credits from sales which are incidental to producing silver and gold.
The Company has adopted the reporting of all-in sustaining costs as a non-GAAP measure of a precious metals mining company’s operating
performance and the ability to generate cash flow from operations. This measure has no standardized meaning and the Company has utilized
an adapted version of the guidance released by the World Gold Council, the market development organization for the gold industry. The
World Gold Council is not a regulatory industry organization and does not have the authority to develop accounting standards or disclosure
requirements. All-in sustaining costs include total cash costs incurred at the Company’s mining operation, sustaining capital expenditures,
corporate administrative expense, exploration and evaluations costs, and reclamation and closure accretion. The Company believes that this
non-GAAP measure represents the total costs of producing silver and gold from its operation, and provides additional information of the
Company’s operational performance and ability to generate cash flows to support future capital investments and to sustain future production.
For additional information regarding these non-GAAP measures (including reconciliations to IFRS measures and by-product credit
calculations, as applicable), see Tahoe’s management’s discussion and analysis for the three and six months the quarter ended June 30,
2016 and its press release August 9, 2016, both available at www.tahoeresources.com and on SEDAR at www.sedar.com. For information on
how Lake Shore Gold has historically disclosed these non-GAAP measures (including reconciliations to IFRS measures, as applicable), see
Lake Shore Gold’s management’s discussion and analysis for the year ended December 31, 2015, also available on SEDAR.
New Leader in Precious Metals
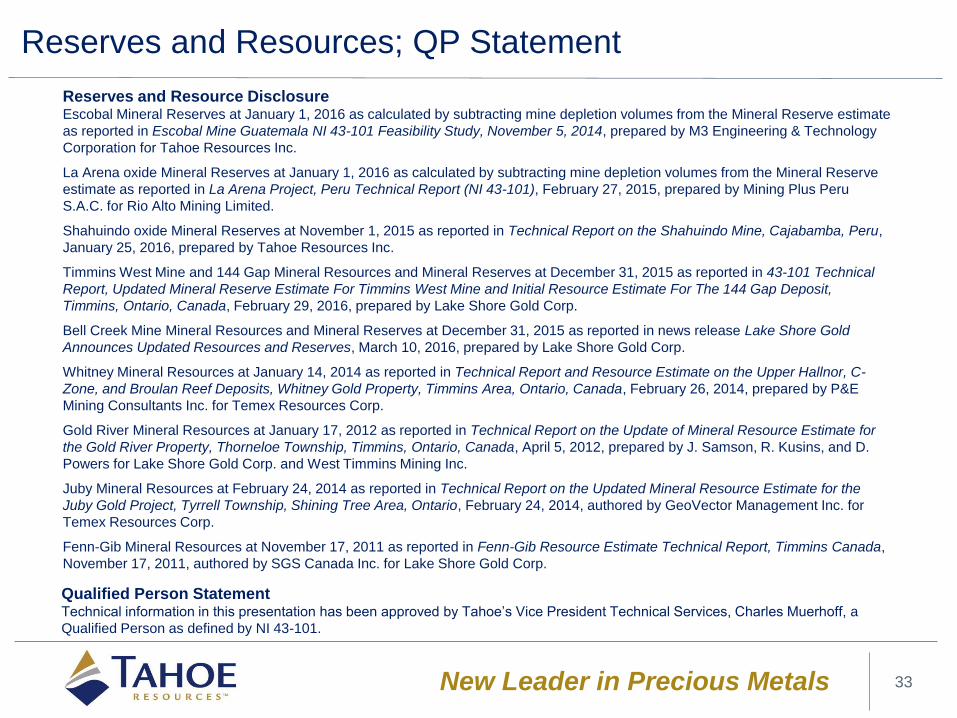
Reserves and Resources; QP Statement
33
Reserves and Resource DisclosureEscobal Mineral Reserves at January 1, 2016 as calculated by subtracting mine depletion volumes from the Mineral Reserve estimate
as reported in Escobal Mine Guatemala NI 43-101 Feasibility Study, November 5, 2014, prepared by M3 Engineering & Technology
Corporation for Tahoe Resources Inc.
La Arena oxide Mineral Reserves at January 1, 2016 as calculated by subtracting mine depletion volumes from the Mineral Reserve
estimate as reported in La Arena Project, Peru Technical Report (NI 43-101), February 27, 2015, prepared by Mining Plus Peru
S.A.C. for Rio Alto Mining Limited.
Shahuindo oxide Mineral Reserves at November 1, 2015 as reported in Technical Report on the Shahuindo Mine, Cajabamba, Peru,
January 25, 2016, prepared by Tahoe Resources Inc.
Timmins West Mine and 144 Gap Mineral Resources and Mineral Reserves at December 31, 2015 as reported in 43-101 Technical
Report, Updated Mineral Reserve Estimate For Timmins West Mine and Initial Resource Estimate For The 144 Gap Deposit,
Timmins, Ontario, Canada, February 29, 2016, prepared by Lake Shore Gold Corp.
Bell Creek Mine Mineral Resources and Mineral Reserves at December 31, 2015 as reported in news release Lake Shore Gold
Announces Updated Resources and Reserves, March 10, 2016, prepared by Lake Shore Gold Corp.
Whitney Mineral Resources at January 14, 2014 as reported in Technical Report and Resource Estimate on the Upper Hallnor, C-
Zone, and Broulan Reef Deposits, Whitney Gold Property, Timmins Area, Ontario, Canada, February 26, 2014, prepared by P&E
Mining Consultants Inc. for Temex Resources Corp.
Gold River Mineral Resources at January 17, 2012 as reported in Technical Report on the Update of Mineral Resource Estimate for
the Gold River Property, Thorneloe Township, Timmins, Ontario, Canada, April 5, 2012, prepared by J. Samson, R. Kusins, and D.
Powers for Lake Shore Gold Corp. and West Timmins Mining Inc.
Juby Mineral Resources at February 24, 2014 as reported in Technical Report on the Updated Mineral Resource Estimate for the
Juby Gold Project, Tyrrell Township, Shining Tree Area, Ontario, February 24, 2014, authored by GeoVector Management Inc. for
Temex Resources Corp.
Fenn-Gib Mineral Resources at November 17, 2011 as reported in Fenn-Gib Resource Estimate Technical Report, Timmins Canada,
November 17, 2011, authored by SGS Canada Inc. for Lake Shore Gold Corp.
Qualified Person StatementTechnical information in this presentation has been approved by Tahoe’s Vice President Technical Services, Charles Muerhoff, a
Qualified Person as defined by NI 43-101.


