Page 1
© Fraunhofer ISE
NEW MARKET AND FUTURE PROSPECT OF PV INDUSTRY: THE ROLE OF ACCURATE PERFORMANCE MEASURES
Wilhelm Warta
Fraunhofer Institute for Solar Energy Systems ISE
World Green Energy Forum 2014Gyeongju, 2014.10.22
Page 2
© Fraunhofer ISE
2
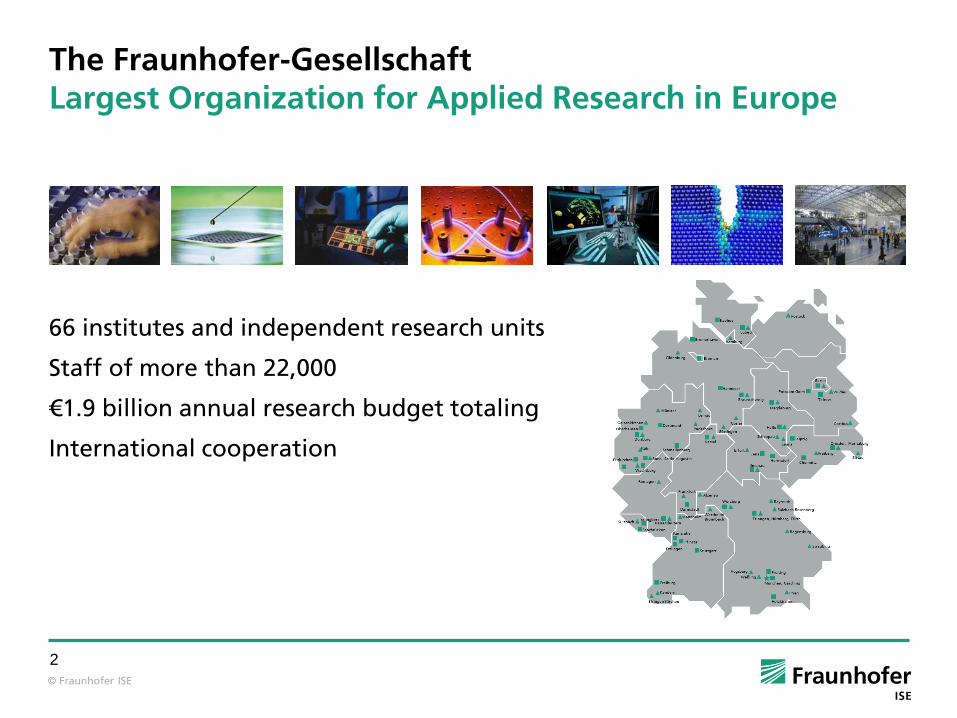
The Fraunhofer-GesellschaftLargest Organization for Applied Research in Europe
66 institutes and independent research units
Staff of more than 22,000
€1.9 billion annual research budget totaling
International cooperation
Page 3
© Fraunhofer ISE
3
Fraunhofer-Institute for Solar Energy Systems ISE
Largest European Solar Energy Research Institute
About 1300 members of staff (incl. students)
Areas of business:
• Photovoltaics (Si, CPV, OPV)
• Solar Thermal (ST, CST)
• Renewable Power Generation
• Energy-Efficient Buildings &
Technical Building Components
• Applied Optics and Functional
Surfaces
• Hydrogen Technology
16% basic financing
84% contract research
29% industry, 55% public
€ 87 M budget (2013)
Page 4
© Fraunhofer ISE
4
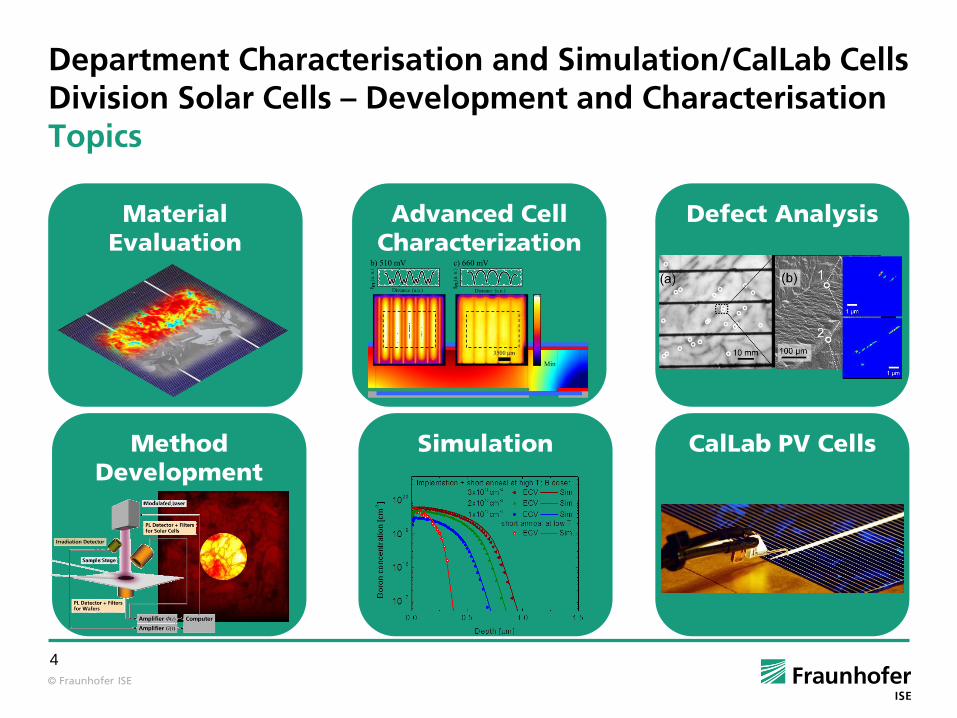
Department Characterisation and Simulation/CalLab Cells Division Solar Cells – Development and CharacterisationTopics
SimulationMethodDevelopment
Advanced CellCharacterization
Material Evaluation
Defect Analysis
CalLab PV Cells
Page 5
© Fraunhofer ISE
5
World EnergyRessources
2 – 6 per year
2010 World energy use: 16 TWy per year
COAL
Uranium
900Total reserve
90-300Total
Petroleum
240Total
Natural Gas
215Total
WIND
Waves0.2-2 per year
60-120per year
OTEC
Biomass
3 -11 per year
HYDRO
3 – 4 per year
TIDES
SOLAR23,000 per year
Geothermal0.3 – 2 per year
© R. Perez et al.
0.3 per year2050: 28 TW
finiterenewable
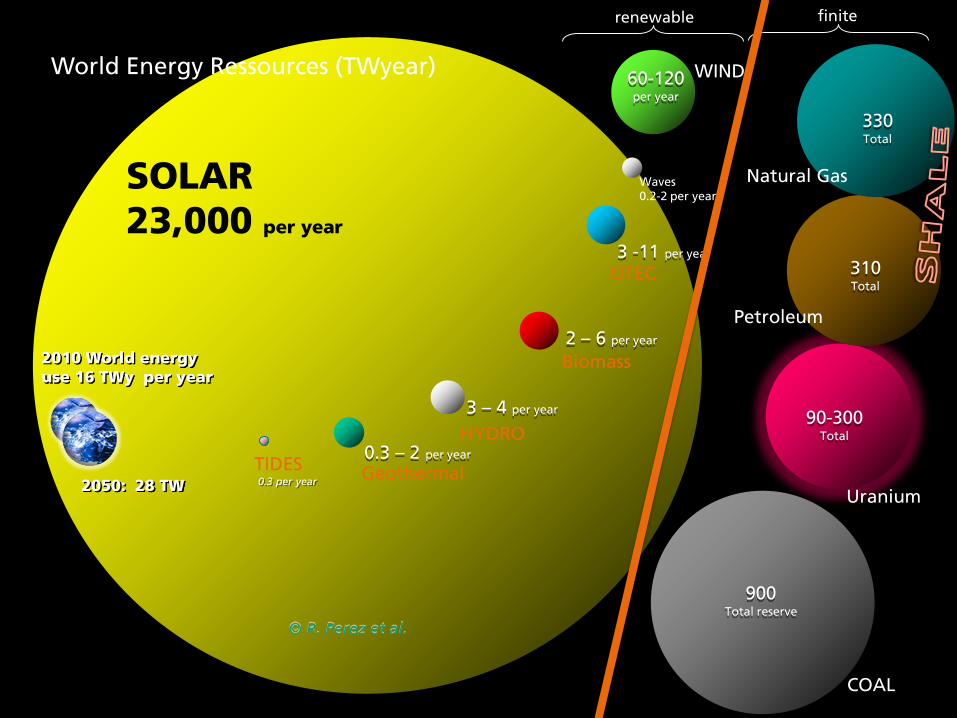
World Energy Ressources (TWyear)
Page 6
© Fraunhofer ISE
6
2 – 6 per year
2010 World energy use 16 TWy per year
COAL
Uranium
900Total reserve
90-300Total
Petroleum
310Total
Natural Gas
330Total
WIND60-120per year
OTEC
Biomass
3 -11 per year
HYDRO
3 – 4 per year
TIDES
SOLAR23,000 per year
Geothermal0.3 – 2 per year
© R. Perez et al.
0.3 per year2050: 28 TW
finiterenewable
Waves0.2-2 per year
World Energy Ressources (TWyear)
Page 7
© Fraunhofer ISE
7
Costs of Solar EnergyPrice Learning Curve (all c-Si PV Technologies)
Learning Rate:Each time the cumulative production doubled, the price went down by 20 %.
Source: Navigant Consulting; EUPD PV module prices (since 2006), Graph: PSE AG 2012
Price Learning Curve of PV Module Technologies since 1980.
Page 8
© Fraunhofer ISE
8
Average Price for Rooftop PV Installations in Germany (10 kWp - 100 kWp)
Levelized Cost of Electricityof 0,10-0,15 €/kWh
Source: BSW-Solar, Graph: PSE AG 2013
Page 9
© Fraunhofer ISE
9
Harvesting Solar Energy: Photovoltaics (PV) PV Production Development by Technology
Produktion 2012 (MWp/a)
Thin film 3.224
Ribbon-Si 100
Multi-Si 10.822
Mono-Si 9.751
Daten: Navigant Consulting. Graph: PSE AG 2013
Production 2012 (MWp/a)
Page 10
© Fraunhofer ISE
Outline
Accurate performance measures: Why are they needed and how can they be realized?
Highly efficient silicon solar cells with low complexity
Summary of future developments
Challenges for performance measurements: Bifaciality, contacting
Emerging technologies and their measurement challenges
Perovskite cells
Multi-junction cells
III-V concentrator cells
Organic cells
Thin film technologies (CdTe, CIGS, a-Si…) not discussed
Page 11
© Fraunhofer ISE
Outline
Accurate performance measures: Why are they needed and how can they be realized?
Highly efficient silicon solar cells with low complexity
Summary of future developments
Challenges for performance measurements: Bifaciality, contacting
Emerging technologies and their measurement challenges
Perovskite cells
Multi-junction cells
III-V concentrator cells
Organic cells
Thin film technologies (CdTe, CIGS, a-Si…) not discussed
Page 12
© Fraunhofer ISE
12
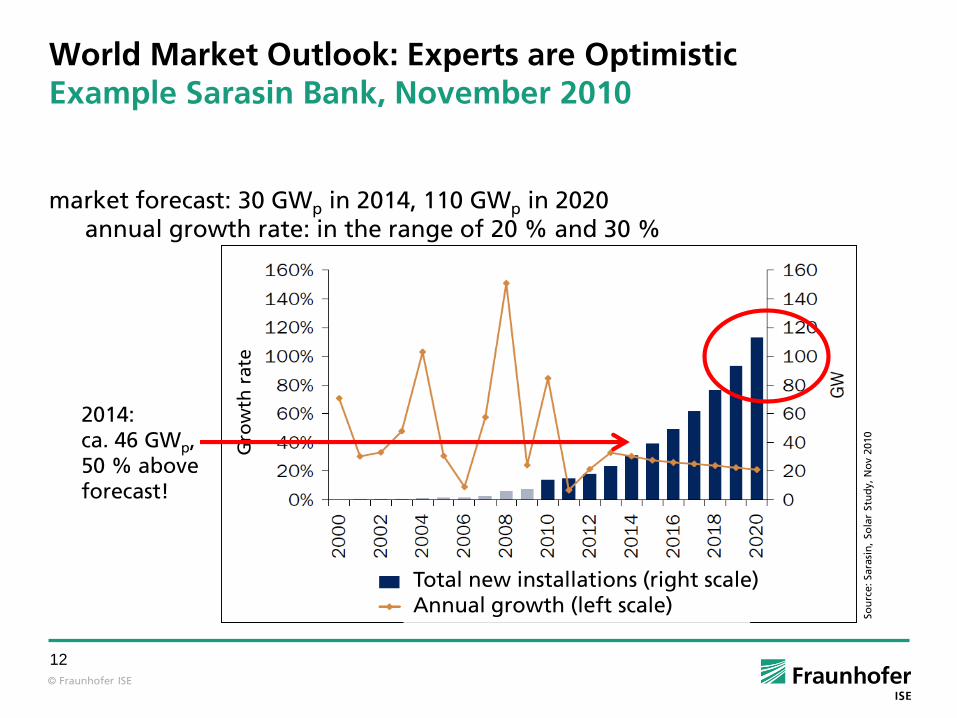
World Market Outlook: Experts are Optimistic Example Sarasin Bank, November 2010
market forecast: 30 GWp in 2014, 110 GWp in 2020 annual growth rate: in the range of 20 % and 30 %
Newly installed (right)
Annual growth rate (left)
So
urc
e:
Sara
sin
, So
lar
Stu
dy, N
ov 2
010
Gro
wth
rate
2014:ca. 46 GWp, 50 % aboveforecast!
Total new installations (right scale)Annual growth (left scale)
Page 13
© Fraunhofer ISE
13
Increasing Economic Impact of Measurement UncertaintyIEA Outlook on PV Production Worldwide
Rapidly declining cost of PV generated electricity opens up new market opportunities.
Current 45 GWp/a market will increase to a 100+ GWp/a market in 2020; for 2050 IEA expects more than 3000 GWp of globally installed PV capacity; for only 10 % of energy demand we need more than 10,000 GWp!
Huge economic impact of uncertainty:±1% of 45 GWp/a PV world production ± 450 Mill. €
Competitive world market needs precise power comparability
Page 14
© Fraunhofer ISE
14
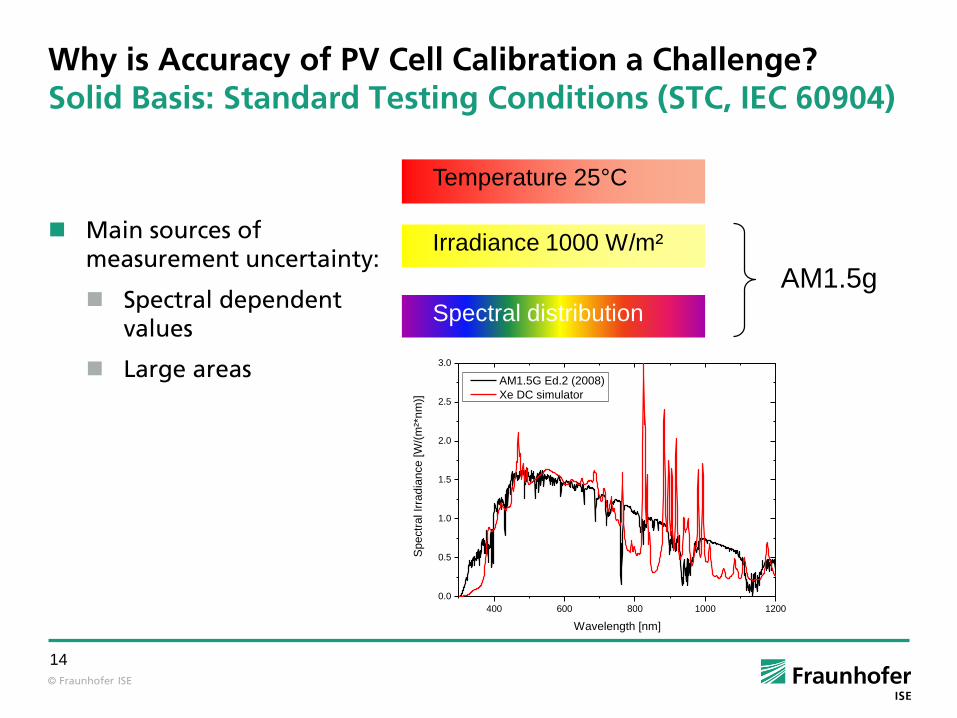
Why is Accuracy of PV Cell Calibration a Challenge?Solid Basis: Standard Testing Conditions (STC, IEC 60904)
Spectral distribution
AM1.5G
Temperature 25°C
Irradiance 1000 W/m²
AM1.5g
400 600 800 1000 1200
0.0
0.5
1.0
1.5
2.0
2.5
3.0
Sp
ectr
al Ir
rad
ian
ce
[W
/(m
²*n
m)]
Wavelength [nm]
AM1.5G Ed.2 (2008)
Xe DC simulator
Main sources of measurement uncertainty:
Spectral dependent values
Large areas
Page 15
© Fraunhofer ISE
15
Example: Uncertainty of Reference Calibration (ISC)Traceability Chain at ISE CalLab PV Cells
Planck spectrum, small diode
Synthetic irradiation, small cell
Simulator irradiation, large area
Economic view: Contributions > 0.1 % count!
Cryoradiometer < 0.01%
Photodiode < 0.1%
Encapsulated
2x2 cm²Solar Cell < 0.7%
Industrial
Solar Cell < 2.0%
Page 16
© Fraunhofer ISE
Outline
Accurate performance measures: Why are they needed and how can they be realized?
Highly efficient silicon solar cells with low complexity
Summary of future developments
Challenges for performance measurements: Bifaciality, contacting
Emerging technologies and their measurement challenges
Perovskite cells
Multi-junction cells
III-V concentrator cells
Organic cells
Thin film technologies (CdTe, CIGS, a-Si…) not discussed
Page 17
© Fraunhofer ISE
17
Company Technology Material Area [cm²]
Efficiency
UNSWJ.Zhao, APL 73 1998
PERL p-type FZ 4 25.0 %
Trend 1: Highly Efficient Solar Cells with Low Complexity
World Record for Mono c-Si Solar Cells
SunpowerD. Smith, IEEE 40th PVSC 2014
„passivated contact“ BJBC
n-type Cz 121 25.0 %
SharpJ.Nakamura, IEEE 40th PVSC 2014
a-Si:H HeterojunctionBJBC
n-type Cz 3,72 25.1 %
PanasonicK. Masuko, IEEE 40th PVSC 2014
a-Si:H HeterojunctionBJBC
n-type Cz 143,7 25.6 %
Page 18
© Fraunhofer ISE
18
Highly Efficient Solar Cells with Low ComplexityState-of-the-Art Silicon Solar Cell
Current reality in PV
91 % silicon
62 % multi crystalline p-type silicon
> 90 % Al-BSF cells
http://www.solarbuzz.com/news/recent-findings/multicrystalline-silicon-modules-dominate-solar-pv-industry-2014
Will there be a transition to the more complex n-type BJBC with passivated contacts?
Page 19
© Fraunhofer ISE
19
Share of Balance of System costs (BOS) increases from 31 % in 2006 to now about 50 %
Large fraction of system cost scale with the solar cell efficiency
Why Going to High Efficiencies?System costs
High efficient solar cells reduces your system cost
http://www.itrpv.net/
7,5%
8,5%
12%
22%
50%
BOS
Module
Cell
Wafer
Poly-Si
7,5%
8,5%
12%
22%
50%
BOS
Module
Cell
Wafer
Poly-Si
BOS
Module
Cell
Wafer
Poly-Si
Page 20
© Fraunhofer ISE
20
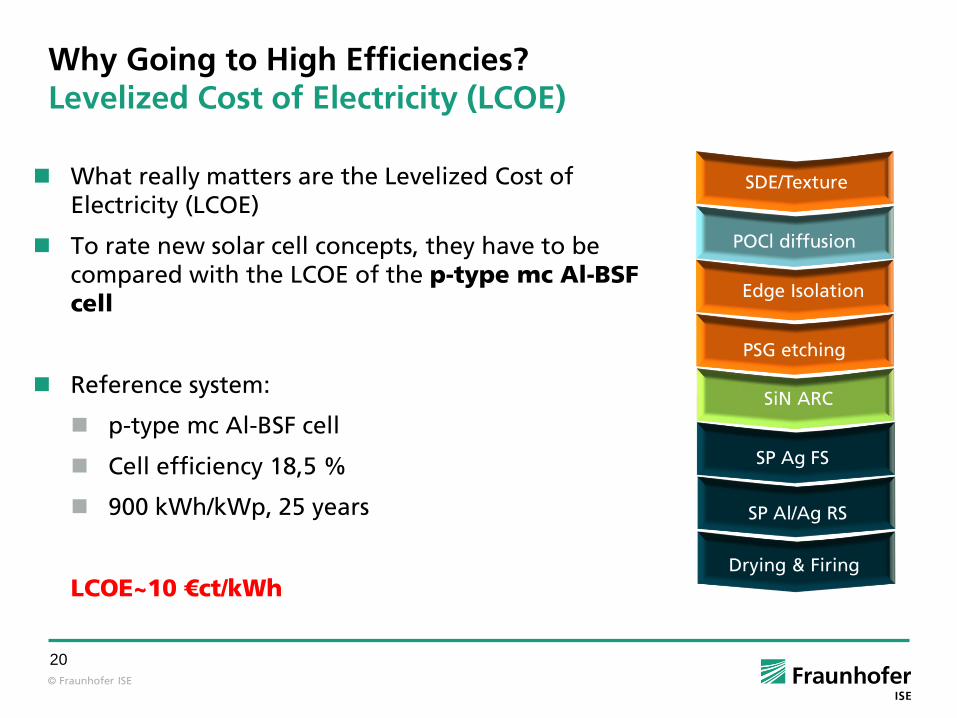
Why Going to High Efficiencies?Levelized Cost of Electricity (LCOE)
What really matters are the Levelized Cost of Electricity (LCOE)
To rate new solar cell concepts, they have to be compared with the LCOE of the p-type mc Al-BSF cell
Reference system:
p-type mc Al-BSF cell
Cell efficiency 18,5 %
900 kWh/kWp, 25 years
LCOE~10 €ct/kWh
SDE/Texture
POCl diffusion
Edge Isolation
PSG etching
SiN ARC
SP Ag FS
Drying & Firing
SP Al/Ag RS
Page 21
© Fraunhofer ISE
21
18 20 22 24 26
100
150
200
250
no
rma
lise
d c
ost o
f ce
ll p
rod
uctio
n [%
]
cell efficiency [%]
Why Going to High Efficiencies?Efficiency versus Cost
What are the allowed additional costs in cell production to get the same LCOE
Simplified assumption: All system costs (except inverter) scale with efficiency
+18 %
19.5 %
Higher LCOE
Lower LCOE
More detailed model: S.Nold et al. , EUPVSEC 2012
Page 22
© Fraunhofer ISE
22
18 20 22 24 26
100
150
200
250
no
rma
lise
d c
ost o
f ce
ll p
rod
uctio
n [%
]
cell efficiency [%]
Why Going to High Efficiencies?Efficiency versus Cost - Efficiency Gap
p-t
yp
e m
c A
l-B
SF
n-type CzWorld Record
????
Which solar cell concepts can fill the efficiency gap between p-Type mc Al-BSF and the world record cells?
Is there an economical maximum?
Page 23
© Fraunhofer ISE
23
Solar Cell Concept to Close the Gapp-Type PRC – The Evolutionary Path
SDE/Texture
POCl diffusion
Edge Isolation
PSG etching
SiN ARC
SP Ag FS
Drying & Firing
SP Al/Ag RS
Al2O3/ SiN RS
Laser Opening
Replacement of the full area Al-BSF with a partial rear contact (PRC)
Two additional process steps
Dielectric passivation
Local contact opening (LCO) or Laser fired contact (LFC)
Advantage: Can be used for mc und Cz silicon
Page 24
© Fraunhofer ISE
24
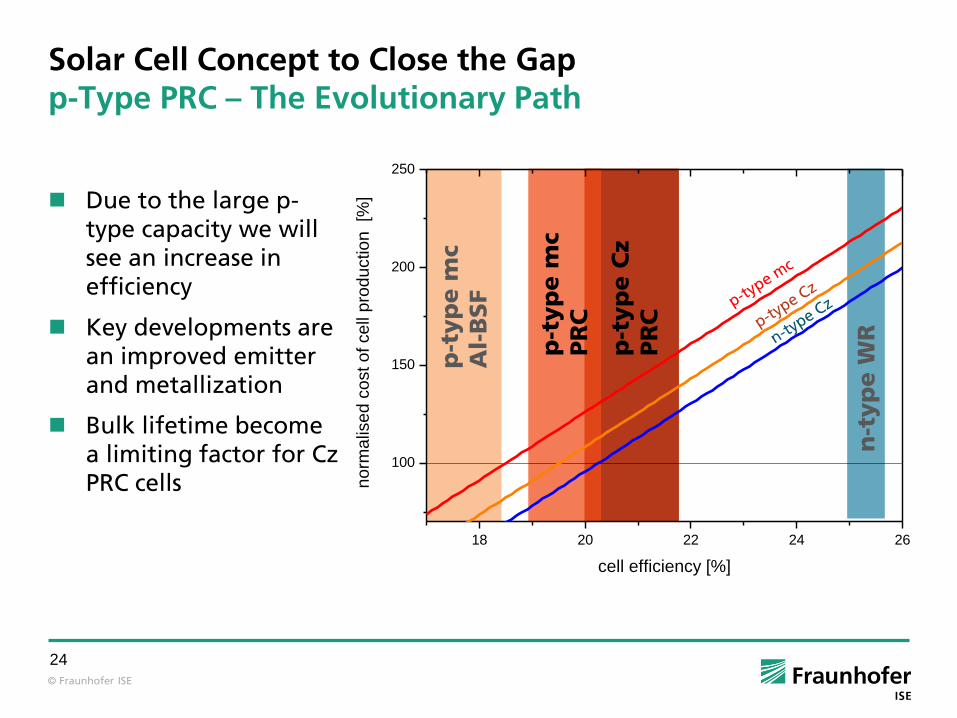
Solar Cell Concept to Close the Gapp-Type PRC – The Evolutionary Path
p-t
yp
e C
zPR
C
p-t
yp
e m
c PR
C
p-t
yp
em
c A
l-B
SF
n-t
yp
e W
R
18 20 22 24 26
100
150
200
250
no
rma
lise
d c
ost o
f ce
ll p
rod
uctio
n [%
]
cell efficiency [%]
Due to the large p-type capacity we will see an increase in efficiency
Key developments are an improved emitter and metallization
Bulk lifetime become a limiting factor for Cz PRC cells
Page 25
© Fraunhofer ISE
25
Solar Cell Concept to Close the Gapn-Type PERT – Bifacial or Monofacial
Two configurations:
Bi-facial with printed contacts on both side
Different concepts for the realization of diffused regions
Mono-facial with different contact technologies
Printed contacts
Boron emitter
Passivation + ARC
Phosphorus BSF
p-Typ Sin-Typ Si
Passivation layerPrinted contacts
p-Typ Sin-Typ Si
Boron emitter
Phosphorus BSF
Passivation layerPVD rear contact
Front sides contacts Passivation + ARC
Page 26
© Fraunhofer ISE
26
Solar Cell Concept to Close the Gapn-Type PERT – Bifacial or Monofacial
Bi-
faci
al
Mo
no
-faci
al
p-t
yp
em
c A
l-B
SF
n-t
yp
e W
R
Bifacial cells currently limited by the metallization
Bifacial cells allow higher energy yield lower LCOE
Rear emitter configuration offers high efficiency potential for Mono-facial design
18 20 22 24 26
100
150
200
250
no
rma
lise
d c
ost o
f ce
ll p
rod
uctio
n [%
]
cell efficiency [%]
Page 27
© Fraunhofer ISE
27
Solar Cell Concept to Close the Gapn-Type Heterojunction – A “simple” cell structure
from: D.Bätzner Silicon PV 2014
Texture
TCO front
Curing
SP Ag VS
i/p-a-Si
i/n-a-Si
TCO rear
PVD Al rear
Cleaning
Lean process flow
Highly efficient carrier selective contacts
High Voc and low Tk
High efficiencies for thin wafers
Page 28
© Fraunhofer ISE
28
Solar Cell Concept to Close the Gapn-Type Heterojunction – A “simple” cell structure
Hetero-junction
n-t
yp
e W
R
p-t
yp
em
c A
l-B
SF
18 20 22 24 26
100
150
200
250
no
rma
lised
cost o
f cell
pro
du
ctio
n [%
]
cell efficiency [%]
High efficiencies are proven
Rear emitter configuration looks promising
Metallization is still an issue
Cost efficient large scale production >1 GWp has to be shown
Page 29
© Fraunhofer ISE
29
Solar Cell Concept to Close the Gapn-Type BJBC– without “passivated contacts”
Large volume production by Sunpowersince more than 10 years
Developments of new technology equipment offers new process routes
In situ masked ion implantation
Laser doping
Page 30
© Fraunhofer ISE
30
Solar Cell Concept to Close the Gapn-Type BJBC– without “passivated contacts”
BJB
C
Ion Implantation offers new routes for BJBC cell production
New approach “Blocking of boron diffusion by implanted phosphorus” further reduces the process complexity n
-typ
e W
R
p-t
yp
em
c A
l-B
SF
18 20 22 24 26
100
150
200
250
no
rma
lise
d c
ost o
f ce
ll p
rod
uctio
n [%
]
cell efficiency [%]
Page 31
© Fraunhofer ISE
31
Tunnel oxide passivated contact (TOPCon)
Tunnel oxide using wet chemical or UV/O3 growth
PECVD single side deposition of amorphous Si layer
Furnace Anneal + H-passivation
n-base
20 nm Si(n)
~14 Å SiOx
J0,n-TOPCon 7 fA/cm²
Solar Cell Concept to Close the Gapn-Type Hybrid TOPCon Cell – TOPCon layer
F. Feldmann et al SOLMAT 120 2014
c-Si(n)SiOx
0 % 100 %Layer crystallinity
a-Si layer
(tuneable crystallinity)
Page 32
© Fraunhofer ISE
32
Solar Cell Concept to Close the Gapn-Type PRC and TOPCon
PassDop and TOPConapproach offer a concept for 22 % and above
Advanced metallization is necessary to fully exploit the potential
n-t
yp
e W
R
p-t
yp
em
c A
l-B
SF
18 20 22 24 26
100
150
200
250
no
rma
lise
d c
ost o
f ce
ll p
rod
uctio
n [%
]
cell efficiency [%]
PR
C P
ass
Do
p
TO
PC
on
Page 33
© Fraunhofer ISE
33
18 20 22 24 26
100
150
200
250
no
rma
lised
cost o
f cell
pro
du
ctio
n [%
]
cell efficiency [%]
p-t
yp
e m
c
Al-
BSF
p-t
yp
e m
c PR
C
n-t
yp
e W
R
Solar Cell Concept to Close the GapWhat will we get in the “near” Future?
??Central role of Bifacial cells Rear Contacted Cells
Page 34
© Fraunhofer ISE
Outline
Accurate performance measures: Why are they needed and how can they be realized?
Highly efficient silicon solar cells with low complexity
Summary of future developments
Challenges for performance measurements: Bifaciality, contacting
Emerging technologies and their measurement challenges
Perovskite cells
Multi-junction cells
III-V concentrator cells
Organic cells
Thin film technologies (CdTe, CIGS, a-Si…) not discussed
Page 35
© Fraunhofer ISE
35
Challenges for High Efficiency Cell Calibration
Bifacial Cells
Solar Cell
Chuck
200 400 600 800 1000 12000
10
20
30
40
50
60 black plastic foil
brown anodized
black anodized
grey anodized
Re
fle
ctio
n [
%]
Wavelength [nm]
Comparable measurements of bifacial cells require definition of background
Page 36
© Fraunhofer ISE
36
Challenges for High Efficiency Cell Calibration
Performance Gain of Bifacial Devices
Bifacial modules on a white roof: up to
30% more power output
How can investors calculate the LCOE
of a bifacial installation?
Proposals in literature for
measurement setups, e.g. [2]
definitions of figures of merit e.g. [3]
Internationally agreed standards
urgently needed!
[1] bSolar 2012 [2] M. Ezquer et al. 23rd EU-PVSEC Valencia 2008[3] J.P. Singh et al. solmat 127, 2014
[1]
[2]
Page 37
© Fraunhofer ISE
37
Challenges for PV Cell Calibration
Chuck Development for Back Contacted Solar Cells
Concept for concurrent realization
of thermal and electrical contact
No front glass for
tactile temperature
measurement
unaffected radiation
low lateral temperature variation
under 1000W/m² steady state
Universal chuck for a wide variety
of contacting schemes available
M. Glatthaar, J. Hohl-Ebinger, A. Krieg, M. Greif, L. Greco, F. Clement, S. Rein, W. Warta, and R. Preu, 25th EUPVSEC. 2010. Valencia, Spain
Page 38
© Fraunhofer ISE
38
Large area back contact solar cells
Calibrated I-V measurements
Back contact silicon solar cells
promise high efficiency potential
IBC conceptInterdigitated Back Contact
MWTMetal Wrap Through
Page 39
© Fraunhofer ISE
39
1 3 𝐼0 2 3 𝐼0
Large area back contact solar cells
Calibrated I-V measurements
Back contact silicon solar cells
promise high efficiency potential
Require designs with different
current per pad or busbar for the
same polarity
IBC conceptInterdigitated Back Contact
MWTMetal Wrap Through
Page 40
© Fraunhofer ISE
40
1 3 𝐼0 2 3 𝐼0
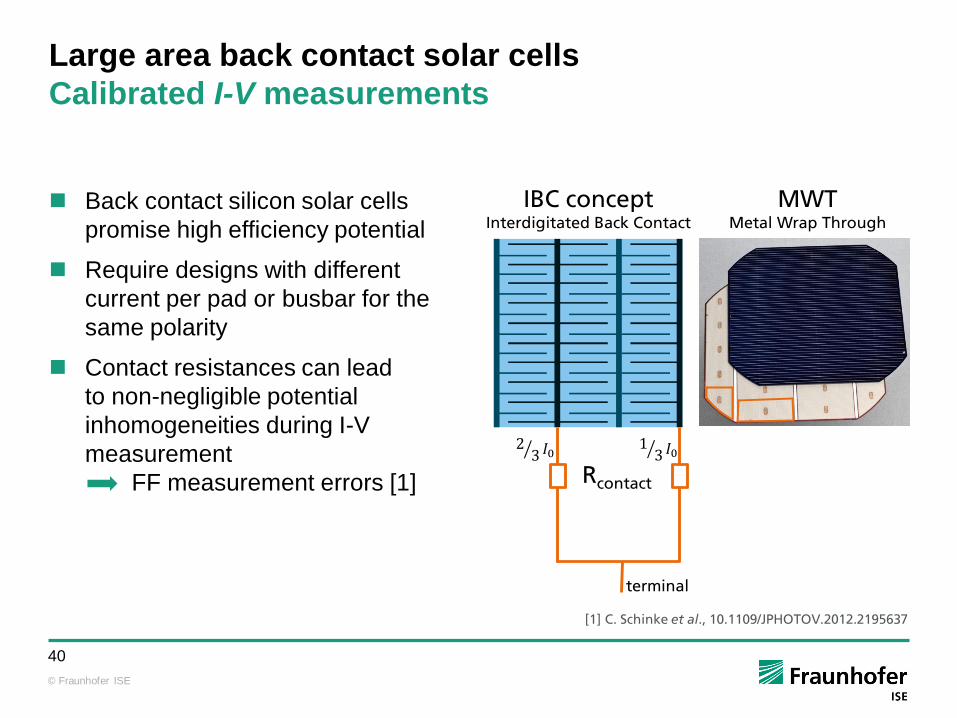
Large area back contact solar cells
Calibrated I-V measurements
Back contact silicon solar cells
promise high efficiency potential
Require designs with different
current per pad or busbar for the
same polarity
Contact resistances can lead
to non-negligible potential
inhomogeneities during I-V
measurement
FF measurement errors [1]
IBC conceptInterdigitated Back Contact
MWTMetal Wrap Through
Rcontact
[1] C. Schinke et al., 10.1109/JPHOTOV.2012.2195637
terminal
Page 41
© Fraunhofer ISE
41
1 3 𝐼0 2 3 𝐼0
Large area back contact solar cells
Calibrated I-V measurements
Balancing resistors [1]
Dominating contact and external
circuit resistance
Adjusted so that voltage drop from
terminal to pad/busbar is equal for
all contact points
BJBC conceptInterdigitated Back Contact
MWTMetal Wrap Through
Rcontact
Rbalancea b
terminal
[1] R. Sinton, bifi PV workshop, Konstanz, 2012
Page 42
© Fraunhofer ISE
42
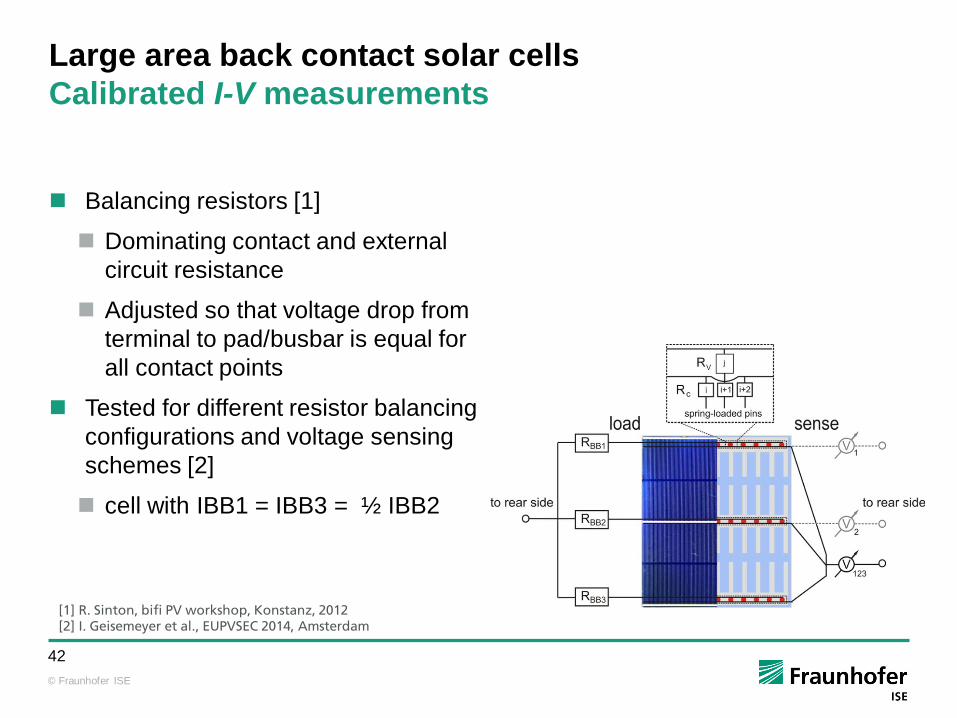
Large area back contact solar cells
Calibrated I-V measurements
Balancing resistors [1]
Dominating contact and external
circuit resistance
Adjusted so that voltage drop from
terminal to pad/busbar is equal for
all contact points
Tested for different resistor balancing
configurations and voltage sensing
schemes [2]
cell with IBB1 = IBB3 = ½ IBB2
[1] R. Sinton, bifi PV workshop, Konstanz, 2012 [2] I. Geisemeyer et al., EUPVSEC 2014, Amsterdam
Page 43
© Fraunhofer ISE
43
Large area back contact solar cells
Calibrated I-V measurements
I-V simulations and measurements
for different V sensing schemes[1]
Dominating but equal balancing
resistors of 0.1 Ω
FF underestimation of 12%abs
overestimation of 3.5%abs
Cell with 25.0 % efficiency
measured as 26.0%!
[1] I. Geisemeyer et al., EUPVSEC 2014, Amsterdam
Simulation Experiment
Page 44
© Fraunhofer ISE
44
Large area back contact solar cells
Calibrated I-V measurements
I-V simulations and measurements
for different V sensing schemes[1]
Dominating but equal balancing
resistors of 0.1 Ω
FF underestimation of 12%abs
overestimation of 3.5%abs
Cell with 25.0% efficiency
measured as 26.0%!
Only with adjusted balancing
resistors
applied voltage equal at all
contacting points
sense contacting scheme
does not influence FF
Simulation Experiment
[1] I. Geisemeyer et al., EUPVSEC 2014, Amsterdam
Page 45
© Fraunhofer ISE
Outline
Accurate performance measures: Why are they needed and how can they be realized?
Highly efficient silicon solar cells with low complexity
Summary of future developments
Challenges for performance measurements: Bifaciality, contacting
Emerging technologies and their measurement challenges
Perovskite cells
Multi-junction cells
III-V concentrator cells
Organic cells
Thin film technologies (CdTe, CIGS, a-Si…) not discussed
Page 46
© Fraunhofer ISE
46
Organic PV Devices (OPV): Physical propertiesFundamentally different from conv. inorganic PV devices
Page 47
© Fraunhofer ISE
47
Dye Sensitized Solar Cells – PrincipleExample: Conv. liquid electrolyte cell
S. Glunz, IMTEC, 2013
Page 48
© Fraunhofer ISE
48
Dye Sensitized to Perovskite Solar Cells – PrincipleMesoporous Conductor
S. Glunz, IMTEC, 2013
Strong efficiency gain with Perovskite as dye
Perovskite cell works also with non-conducting (Al2O3) mesoporousand planar layer
Key: Blocking layers to separate electron-hole pairs
Page 49
© Fraunhofer ISE
49
Time dependence effects in DSSC measurementsHysteresis of IV measurements on Perovskite cells
Previously: IV of DSSC correct if measured slowly
Conv. DSSC with perovskite absorber: behaves similar (Dualeh et al. 2013)
-50 0 50 100 150 200 250 300 350 400 450-0,1
0,0
0,1
0,2
0,3
0,4
0,5
0,6
0,7
0,8
dye sensitized solar cell
at 59ms flashlight
VO
C [
a.u
.]
time [ms]
Page 50
© Fraunhofer ISE
50
Time dependence effects in DSSC measurementsHysteresis of IV measurements on Perovskite cells
Previously: IV of DSSC correct if measured slow
Conv. DSSC with perovskite absorber: behaves similar (Dualeh et al. 2013)
Different types of hysteresis reported with strong dependence on architecture of perovskite cell (Snaith et al. 2014)
Planar structureSnaith et al. J. Phys. Chem. Lett. 2014
Page 51
© Fraunhofer ISE
51
Time dependence effects in DSSC measurementsHysteresis of IV measurements on Perovskite cells
Previously: IV of DSSC correct if measured slow
Conv. DSSC with perovskite absorber: behaves similar (Dualeh et al. 2013)
Different types of hysteresis reported with strong dependence on architecture of perovskite cell (Snaith et al. 2014)
MSSC (with mesoporous Al2O3)Snaith et al. J. Phys. Chem. Lett. 2014
Page 52
© Fraunhofer ISE
52
Organic PV devices (OPV): PrincipleExample: Polymer Cell
S. Glunz, IMTEC, 2013 Photon creates exciton –excitonic solar cell
Page 53
© Fraunhofer ISE
53
Organic PV Decvices (OPV) – PrincipleExample: Polymer Cell
S. Glunz, IMTEC, 2013Bulk heterojunction structure
Charge transfer
Page 54
© Fraunhofer ISE
54
Organic PV Devices (OPV): PrincipleVariants
Absorber polymer – solution processed, e.g. by printing
Room temperature process, high speed
Absorber small molecules – vacuum sublimation
High purity
Allows complex structures
M. Riede, DPG Dresden, 2011
Page 55
© Fraunhofer ISE
55
Organic solar cells: PrincipleDevelopment Directions
Absorber polymer – solution processed, e.g. by printing
Room temperature process, high speed
Absorber small molecules – vacuum sublimation
High purity
Allows complex structures
Multi-junction cells:
Path to competitive efficiencies
Page 56
© Fraunhofer ISE
Outline
Accurate performance measures: Why are they needed and how can they be realized?
Highly efficient silicon solar cells with low complexity
Summary of future developments
Challenges for performance measurements: Bifaciality, contacting
Emerging technologies and their measurement challenges
Perovskite cells
Multi-junction cells
III-V concentrator cells
Organic cells
Thin film technologies (CdTe, CIGS, a-Si…) not discussed
Page 57
© Fraunhofer ISE
57
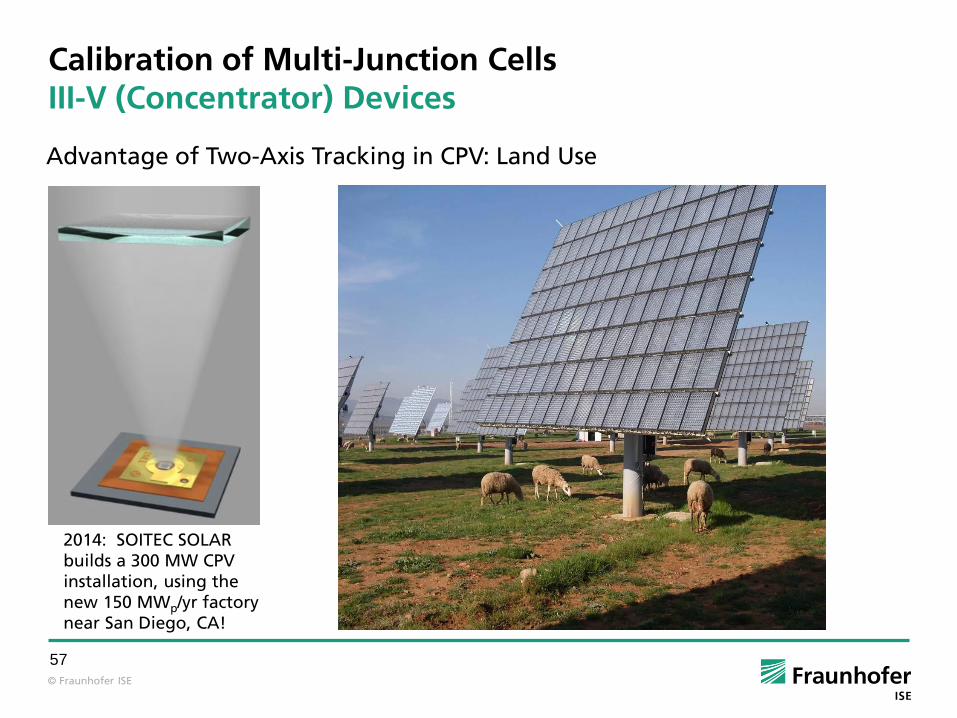
Calibration of Multi-Junction CellsIII-V (Concentrator) Devices
2014: SOITEC SOLAR builds a 300 MW CPV installation, using thenew 150 MWp/yr factorynear San Diego, CA!
Advantage of Two-Axis Tracking in CPV: Land Use
Page 58
© Fraunhofer ISE
58
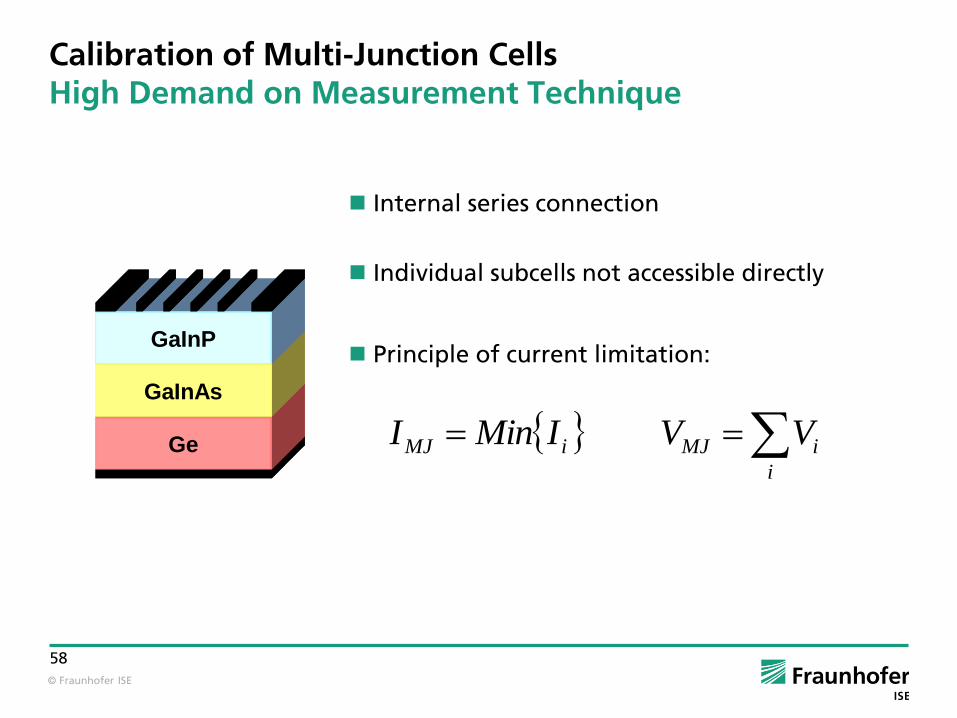
Calibration of Multi-Junction CellsHigh Demand on Measurement Technique
Internal series connection
Individual subcells not accessible directly
Principle of current limitation:
i
iMJiMJ VVIMinIGe
GaInAs
GaInP
Page 59
© Fraunhofer ISE
59
Calibration of Multi-Junction CellsSpectral Response Measurement
middle-cell
top-cell
filtered bias lamps
bottom-cell
chopped
monochromatic
light
I-V-converter
bias voltage
Page 60
© Fraunhofer ISE
60
400 600 800 1000 1200 1400 1600 1800 20000
10
20
30
40
50
60
70
80
90
100
j1 AlGaInP
j2 GaInP
j3 AlGaInAs
j4 GaInAs
j5 Ge
sum j1 - j4
EQ
E [
%]
wavelength [nm]
active GeGaInAsAlGaInAsGaInPAlGaInP
1117-quint
130 nm
450 nm
400 nm
1600 nm
150 µm
Bias irradiation:
Excess generation in all cells
apart from the one to be
measured limiting cell
400 600 800 1000 1200 1400 1600 18000
20
40
60
80
100
lot12-01-x17y04
Exte
rna
l Q
ua
ntu
m E
ffic
ien
cy [
%]
Wavelength [nm]
Calibration of Multi-Junction CellsSpectral Response Measurement
Page 61
© Fraunhofer ISE
61
Adjust so that each cell delivers STC-current
Settings calculated from spectral response of each junction
Calibration of Multi-junction devicesIV measurement at Multi-Source-Simulator (MuSim)
tungsten lamp field 2
tun
gste
n la
mp
field
1xen
on
lam
p
multi-junction solar cell
filt
er
3
500 750 1000 1250 1500 17500
500
1000
1500
2000
2500
0
500
1000
1500
2000
2500
AM1.5d, ASTM
G173-03, 1000 W/m²
MuSim
Wavelength [nm]
Xenon lamp
Tungsten
lamp field 1
Tungsten
lamp field 2
Sp
ectr
al ir
rad
ian
ce
[W
/(m
²µm
]
Page 62
© Fraunhofer ISE
62
400 600 800 1000 1200 1400 16000
400
800
1200
1600
2000
2400
2800
3200
3600 xenon flash
Sp
ectr
al Ir
rad
ian
ce
[W
/(m
²µm
)]
Wavelength [nm]
0
20
40
60
80
100
120
140
160
180
200
filter LC1
filter LC2
filter LC3
filter LC4
filter LC5
filter LC6
Tra
nsm
issio
n [%
]
Six Source Sun Simulator X-SimSpectrum of the Light Channels
Xenon flash tube
Filter transmission witha sharp separation of thespectral ranges
Spectral ranges based on the SR of a ISE 6-junctionsolar cell
AlG
aIn
P
Ga
InP
AlG
aA
s
Ga
InA
s
Ga
InN
As
Ge
Page 63
© Fraunhofer ISE
63
400 600 800 1000 1200 1400 16000
400
800
1200
1600
2000
2400
2800
3200
3600 xenon flash
LC 1
LC 2
LC 3
LC 4
LC 5
LC 6
Sp
ectr
al Ir
rad
ian
ce
[W
/(m
²µm
)]
Wavelength [nm]
Six Source Sun Simulator X-SimSpectrum of the Light Channels
Xenon flash tube
Filter transmission witha sharp separation of thespectral ranges
Spectral ranges based on the SR of a ISE 6-junctionsolar cell
Intensity of each LC independently adjustable
AlG
aIn
P
Ga
InP
AlG
aA
s
Ga
InA
s
Ga
InN
As
Ge
Page 64
© Fraunhofer ISE
64
dEsrdesrAdesrA refsimsim )()()()()( 2
6,
2
61,
2
1
dEsrdesrAdesrA refsimsim )()()()()( 6
6,
6
61,
6
1
dEsrdesrAdesrA refsimsim )()()()()( 1
6,
1
61,
1
1
… …
Six Source Sun Simulator X-SimSpectral Correction
AlGaInP 2.2 eV
GaInP 1.9 eV
AlGaAs 1.6 eV
GaInAs 1.4 eV
GaInNAs 1.1 eV
Ge 0.7 eV
iTC
ref
iTC
sim jj ,,
Page 65
© Fraunhofer ISE
65
Six Source Sun Simulator X-SimSimulator Spectrum
Reference spectrum AM0
Sum of spectraof all LCs in the measurement plane
400 600 800 1000 1200 1400 16000
500
1000
1500
2000
2500
3000 AM0
LC1
LC2
LC3
LC4
LC5
LC6
Sum LCs S
pectr
al Ir
radia
nce [W
/(m
²µm
)]
Wavelength [nm]
Page 66
© Fraunhofer ISE
66
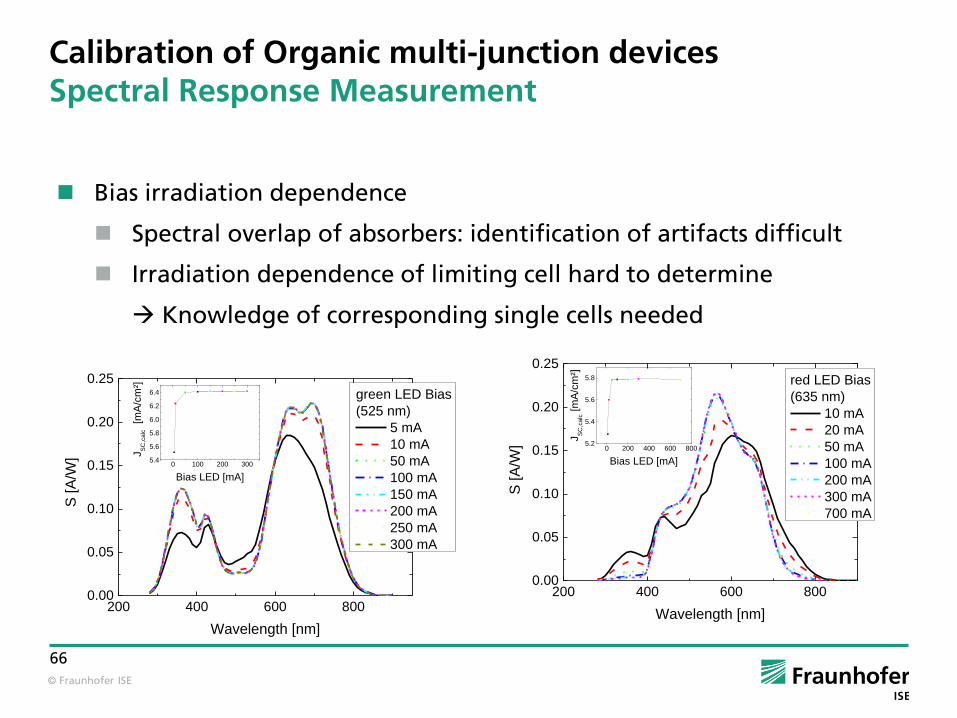
Calibration of Organic multi-junction devicesSpectral Response Measurement
Bias irradiation dependence
Spectral overlap of absorbers: identification of artifacts difficult
Irradiation dependence of limiting cell hard to determine
Knowledge of corresponding single cells needed
200 400 600 8000.00
0.05
0.10
0.15
0.20
0.25
S [A
/W]
Wavelength [nm]
green LED Bias
(525 nm)
5 mA
10 mA
50 mA
100 mA
150 mA
200 mA
250 mA
300 mA
0 100 200 3005.4
5.6
5.8
6.0
6.2
6.4
JS
C,c
alc [m
A/c
m²]
Bias LED [mA]
200 400 600 8000.00
0.05
0.10
0.15
0.20
0.25
S [A
/W]
Wavelength [nm]
red LED Bias
(635 nm)
10 mA
20 mA
50 mA
100 mA
200 mA
300 mA
700 mA
0 200 400 600 8005.2
5.4
5.6
5.8
JS
C,c
alc [m
A/c
m²]
Bias LED [mA]
Page 67
© Fraunhofer ISE
67
Calibration of Organic Multi-Junction DevicesSpectral Response Measurement
Bias voltage dependencies
Bias voltage dependence due to field assisted charge separation
Bias voltage variation at actual bias light conditions for uncertainty estimation
300 400 500 600 700 800 900-0.05
0.00
0.05
0.10
0.15
0.20
0.25
S [A
/W]
Wavelength [nm]
Bias voltage [mV]
0
300
600
900
1200
1300
0 300 600 900 1200
5.0
5.5
6.0
6.5
JS
C,c
alc [m
A/c
m²]
Bias voltage [mV]
-0.02
0.00
0.02
0.04
0.06
0.08
0.10
UkSR
Uk
SR [%
/mV
]
200 300 400 500 600 700 800 900-0.05
0.00
0.05
0.10
0.15
0.20
0.25
S [A
/W]
Wavelength [nm]
Bias voltage [mV]
0
300
600
900
12000 300 600 900 1200
5.0
5.5
6.0
JS
C,c
alc [m
A/c
m²]
Bias voltage [mV]
-0.02
0.00
0.02
0.04
0.06
0.08
0.10
UkSR
Uk
SR [%
/mV
]
Page 68
© Fraunhofer ISE
68
How to Assure International Comparability?Calibration Labs Accredited to ISO 17025
Comparable IV-curve parameters important competition measure
Key: Traceability to SI-units
Assured by calibration labs accredited according to ISO 17025
extensive, audited uncertainty calculation
regular proficiency test: inter-comparisonwith other calibration labs (NREL, AIST, JRC, KIER?)
Test labs can also have accreditation to ISO 17025, but
do not need to implement uncertainty calculations
do not necessarily assure traceability of measured results to SI-unitsand international comparability
Page 69
© Fraunhofer ISE
69
Summary
Future prospect of silicon solar cells: High efficiency cells with low complexity
Rear contacted and bifacial cells will play an increasing role
Agreed way how to valuate the gain of bifaciality urgently needed
Faulty contacting of rear contacted cells can lead to marked errors
Perovskite cells: Metastability has enormous influence on IV-results
Multi-junction cells: Strong expertise available, but challenges high especially for organic devices
Page 70
© Fraunhofer ISE
70
Acknowledgment
Parts on high efficiency silicon solar cells and III-V-multi-junction cells courtesy of Martin Hermle and Gerald Siefer, respectively
Contributions from Holger Seifert, Jochen Hohl-Ebinger
Page 71
© Fraunhofer ISE
71
Thank You for Your Attention!
Wilhelm Warta
[email protected]
Fraunhofer Institute for Solar Energy Systems ISE