Available online at www.pelagiaresearchlibrary.com Pelagia Research Library Advances in Applied Science Research, 2014, 5(3):370-388 ISSN: 0976-8610 CODEN (USA): AASRFC 370 Pelagia Research Library New multiferroic nanoparticles LaFe 1-y y O 3 M. A. Ahmed a* , S. I. El-Dek a , E. Dhahri b and M.M. Arman a a Materials science Lab (1), Physics Department, Faculty of Science, Cairo University, Giza, Egypt b Laboratoire de Physique Appliquée, Faculté des Sciences, Université de Sfax, Sfax, Tunisia _____________________________________________________________________________________________ ABSTRACT Nanometric multiferroic LaFe 1-y y O 3 , (0.0 ≤ y ≤ 0.03, step 0.01) samples were successfully synthesized using citrate autocombustion method. The X-ray diffraction (XRD) data reveal that all the samples have single phase orthorhmbic structure. The high resolution transmission electron microscope (HRTEM), energy dispersive spectroscopy (EDS) and selected area electron diffraction (SAED) were carried out for the samples. Results of the temperature dependence of molar magnetic susceptibilities (χ M ) illustrate the antiferromagnetic behavior of the samples. χ M of the sample LaFe 0.99 0.01 O 3 was improved by 2.5 times than that of the parent one. The exchange bias (EB) effect was observed for 1 st time at room temperature and originated from antiferromagnetic –ferromagnetic (AFM–FM) interface effect. Two conduction mechanisms were found: the small polaron (SP) tunneling and the correlated barrier hopping (CBH). The saturation polarization (Ps) increased by 7.4 times by doping with vacancy content y=0.03. Ferroelectric hysteresis loop assure the presence of the ferroelectric ordering for the samples. The investigated samples could be classified as type I multiferroic materials. Key words: Multiferroic materials, Magnetic and ferroelectric property, Exchange bias effect and vacancy. _____________________________________________________________________________________________ INTRODUCTION Multiferroics are materials in which two or more ferroic order exist such as ferromagnetic (antiferromagnetic) and ferroelectric (antiferroelectric). In these materials the magnetic properties can be controlled by the electric field (1) and vice versa (2). Therefore they have huge applications specially in the fields of transducers, sensors and magnetic memories.(3) The multiferroics materials are divided in to single phase and composite multiferroics. Firstly, the single phase multiferroics are materials show both ferroelectric and ferromagnetic order.(4) Khomskii (5) classified single phase multiferroics according to the physical mechanism behind ferroelectricity, in to two big groups and other subgroups. The first group is Type I multiferroic in which the ferroelectricity and ferromagnetism have different sources. These materials are separated in to subgroups: i) ferroelectricity due to lone pair (6). ii) ferroelectricity due to charge ordering (7). iii) Geometric ferroelectricity (8). While, the second group is type II single phase multiferroics. Type II multiferroic is distinguished by a strong coupling between the magnetism and ferroelectricity where the magnetism causes ferroelectricity. Type II multiferroic are classified also in to subgroups: i) spiral magnets (2). ii) collinear magnets (9). The composite multiferroic are formed by the combination of two materials that are ferroelectric and ferromagnetic, separately (10). In these materials the magnetoelectric coupling occurs by different interface mechanisms: i) strain mediated coupling (11). ii) charge mediated coupling (12). iii) exchange bias mediated coupling (13). The exchange coupling that occurs at the interface between ferromagnetic (FM) and antiferromagnetic (AF) layers. H. Ahmadvand (14) et al studied the exchange bias effect in LaFeO 3 . The exchange bias originated from a core/shell model; the FM-like component comes from the surface of the particles and the field linear AFM contribution comes from the core spins. There are factors affecting on the magnetization of LaFeO 3 nanoparticles. (i) The canted spin
Transcript
Available online at www.pelagiaresearchlibrary.com
Pelagia Research Library
Advances in Applied Science Research, 2014, 5(3):370-388
ISSN: 0976-8610 CODEN (USA): AASRFC
370 Pelagia Research Library
New multiferroic nanoparticles LaFe1-y yO3
M. A. Ahmeda*, S. I. El-Deka, E. Dhahrib and M.M. Arman a
bLaboratoire de Physique Appliquée, Faculté des Sciences, Université de Sfax, Sfax, Tunisia _____________________________________________________________________________________________ ABSTRACT Nanometric multiferroic LaFe1-y yO3, (0.0 ≤ y ≤ 0.03, step 0.01) samples were successfully synthesized using citrate autocombustion method. The X-ray diffraction (XRD) data reveal that all the samples have single phase orthorhmbic structure. The high resolution transmission electron microscope (HRTEM), energy dispersive spectroscopy (EDS) and selected area electron diffraction (SAED) were carried out for the samples. Results of the temperature dependence of molar magnetic susceptibilities (χM) illustrate the antiferromagnetic behavior of the samples. χM of the sample LaFe0.99 0.01O3 was improved by 2.5 times than that of the parent one. The exchange bias (EB) effect was observed for 1st time at room temperature and originated from antiferromagnetic –ferromagnetic (AFM–FM) interface effect. Two conduction mechanisms were found: the small polaron (SP) tunneling and the correlated barrier hopping (CBH). The saturation polarization (Ps) increased by 7.4 times by doping with vacancy content y=0.03. Ferroelectric hysteresis loop assure the presence of the ferroelectric ordering for the samples. The investigated samples could be classified as type I multiferroic materials. Key words: Multiferroic materials, Magnetic and ferroelectric property, Exchange bias effect and vacancy. _____________________________________________________________________________________________
INTRODUCTION Multiferroics are materials in which two or more ferroic order exist such as ferromagnetic (antiferromagnetic) and ferroelectric (antiferroelectric). In these materials the magnetic properties can be controlled by the electric field (1) and vice versa (2). Therefore they have huge applications specially in the fields of transducers, sensors and magnetic memories.(3) The multiferroics materials are divided in to single phase and composite multiferroics. Firstly, the single phase multiferroics are materials show both ferroelectric and ferromagnetic order.(4) Khomskii (5) classified single phase multiferroics according to the physical mechanism behind ferroelectricity, in to two big groups and other subgroups. The first group is Type I multiferroic in which the ferroelectricity and ferromagnetism have different sources. These materials are separated in to subgroups: i) ferroelectricity due to lone pair (6). ii) ferroelectricity due to charge ordering (7). iii) Geometric ferroelectricity (8). While, the second group is type II single phase multiferroics. Type II multiferroic is distinguished by a strong coupling between the magnetism and ferroelectricity where the magnetism causes ferroelectricity. Type II multiferroic are classified also in to subgroups: i) spiral magnets (2). ii) collinear magnets (9). The composite multiferroic are formed by the combination of two materials that are ferroelectric and ferromagnetic, separately (10). In these materials the magnetoelectric coupling occurs by different interface mechanisms: i) strain mediated coupling (11). ii) charge mediated coupling (12). iii) exchange bias mediated coupling (13). The exchange coupling that occurs at the interface between ferromagnetic (FM) and antiferromagnetic (AF) layers. H. Ahmadvand (14) et al studied the exchange bias effect in LaFeO3. The exchange bias originated from a core/shell model; the FM-like component comes from the surface of the particles and the field linear AFM contribution comes from the core spins. There are factors affecting on the magnetization of LaFeO3 nanoparticles. (i) The canted spin
M. A. Ahmed et al Adv. Appl. Sci. Res., 2014, 5(3):370-388 _____________________________________________________________________________
371 Pelagia Research Library
structure of LaFeO3 causes a weak ferromagnetism. (ii) Oxygen nonstoichiometry can change the valence state of Fe3+ (iii) Structural defects, broken exchange bonds. Lanthanum orthoferrite (LaFeO3) is a canted G-type (14) antiferromagnetic (AFM) with an orthorhombic distorted perovskite structure. In the perovskite structure, the Fe3+ ion is surrounded by six O2- ions and forms <FeO6> octahedron. The electrical conductivity mechanisms of the perovskite ABO3 depends mainly on hopping process with super/double exchange interaction and charge transfer mechanism. Also, the small polarons which are thermally activated are used to explain the electronic conductivity of perovskites (15). The hopping of the electron from site to another through the oxygen ion (B-O-B) increased by the overlab (strongly depends on the B O distance and B–O–B superexchange angle) (16). The crystallographic changes affect on the conductivity. In the present work we aimed to study the effect of vacancy substitution on the B site cation on the magnetic and dielectric properties of LaFeO3. Another goal is the examination the multiferroic behavior of the prepared samples. EXPERIMENTAL TECHNIQUES The perovskite samples with the chemical formula LaFe1-y yO3,(0.0 ≤ y ≤ 0.03) were prepared by citrate nitrate autocombustion method. Stoichiometric amounts of analar (BDH) metal nitrates were mixed with an equivalent molar ratio of citric acid in aqueous media. The ammonia solution was droped to adjust PH value to 7. The sample was allowed to dry on a hot plate to obtain final product which gives a single phase orthorhombic structure without any subsequent heat treatment. The X-ray powder diffraction (XRD) was carried out using a Proker D8 advance X-ray diffractometer with CuKα radiation (λ = 1.5418 Å); for the as synthesized samples in the range of 20–80. The crystalline phases were identified using the International Centre for Diffraction Data (ICDD) card number 74-2203. Scanning electron microscopy (SEM) and Energy dispersive spectroscopy (EDS) were carried out for the samples using OXFORD INCA PentaFETX3- England. The shape and morphology of the particles were analyzed using High Resolution transmission electron microscope (HRTEM) model (JEOl-2100). The hysteresis and magnetization measurements were performed using vibrating sample magnetometer (VSM; 9600-1 LDJ, USA) with a maximum applied field of 25 kOe at room temperature. The dc magnetic susceptibility (χM) of the investigated samples was measured using Faraday’s method (17) as a function of absolute temperature at different magnetic field intensities.
The powdered samples were pressed using a uniaxial press of value 8 x 10⁵ N/m2. The two surfaces of each pellet were coated with silver paste and checked for good conduction. The LCR meter (Hioki model 3532 Japan) was used to measure the electrical properties. The dielectric constant (ε/), dielectric loss tangent (tanδ) and ac resistivity of the samples were measured as a function of temperature at different frequencies ranging from 100 kHz to 5 MHz. The ferroelectric hysteresis loop (P-E loop) was performed for the samples by using home made Sawyer Tower circuit.
RESULTS AND DISCUSSION
The XRD patterns of the samples LaFe1-y yO3, (0.0 ≤ y ≤ 0.03, step 0.01) are shown in Fig.(1). By increasing the vacancy concentration, the samples reveal more intense peak. Therefore, the crystallinity increased. The XRD patterns prove that the samples are prepared in single phase orthorhombic perovskite structure with space group Pbnm as compared and indexed with ICDD card number 74-2203. The lattice parameters, cell volumes, theoretical density were calculated on the basic of orthorhombic unit cell and were listed in table (1). The lattice parameter a increases with vacancy substitution while (b) decreases. The unit cell volume and the theoretical density decrease with increasing y content due to some of the Fe3+ ions convert to Fe4+ ions with smaller ionic radius. The tolerance factor was calculated from the relation (18) (1) t = (RA+RO)/√2(RB+RO) (1) where RA, RB and RO are the ionic radii of the A, B and oxygen ions, respectively. The tolerance factor (t) is less than 1 which indicates that tilting of the <BO6> octahedra occurs for all the samples. The values of the tolerance
M. A. Ahmed et al Adv. Appl. Sci. Res., 2014, 5(3):370-388 _____________________________________________________________________________
372 Pelagia Research Library
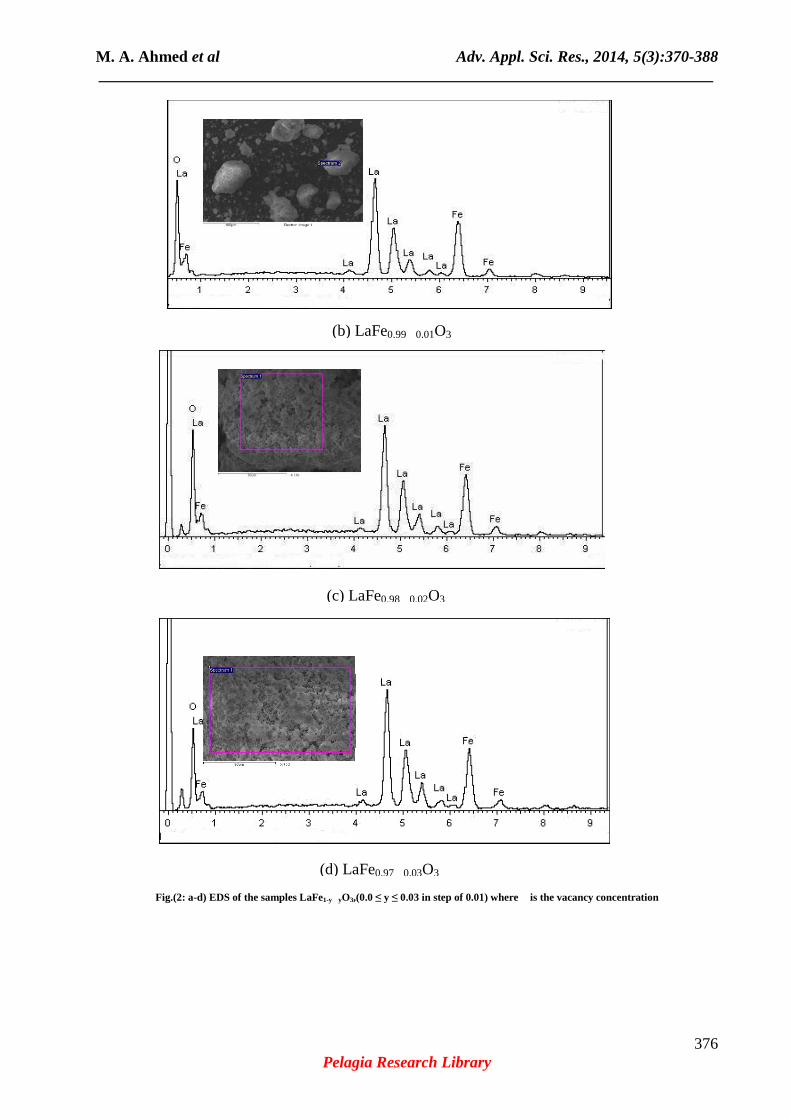
factor increase with increasing the vacancy content (y) on the expense of Fe3+ ions, which means the decrease in the distortion and the samples are going to be more stable structure. In other words, the Fe-O-Fe angle was increases with increasing the vacancy content (y) while tilting angle decreases. Figure (2) shows the energy dispersive spectroscopy (EDS) of the investigated samples which confirms that the chemical composition is very close to the nominal one. Figure (3) shows the HRTEM of the samples LaFe1-y yO3, (0.0 ≤ y ≤ 0.03, step 0.01). The nanocrystalline samples with orthorhombic structure powders are detected. The particle size is reported in Table (1) and agrees well with that calculated from X- ray data. The d-spacing of the investigated samples were illustrated in Fig.(3: b,e,h,k) with values 0.26 ,0.40 , 0.33 and 0.47 nm of the samples LaFe1-y yO3, (0.0 ≤ y ≤ 0.03, step 0.01) respectively. The selected area electron diffraction (SAED) pattern of the samples LaFe1-y yO3, (0.0 ≤ y ≤ 0.03, step 0.01) are illustrated in Fig. (3: c,f,i,l). The figures show the good crystallinity of the samples under investigations. SAED of the sample LaFe0.98 0.02O3 shows a preferred orientation which affects on the physical properties of this sample. Figure (4) illustrates the dependence of the molar magnetic susceptibility (χM) on the absolute temperature as a function of the magnetic field intensities for the samples LaFe1-y yO3, (0.0 ≤ y ≤ 0.03, step 0.01). The values of χM decrease rapidly with temperature until the Néel temperature then decreased slowly. The shape of χM versus T assures that the samples have antiferromagnetic behavior with weak ferromagnetic components. Figure (5) shows a clear enhancement in χM values for the doped samples as compared with the parent one. One could interpret this improvement due to some of the Fe3+ ions converts to Fe4+ ions. χM of the sample LaFe0.99 0.01O3 was improved by 2.5 times than that of the parent sample LaFeO3. The enhancement of all magnetic parameters at different levels at room temperature can be ascribed to several reasons as follows: (i) The existence of Fe4+ ions in high spin state (HS) Fe4+ (t2g
3 eg1) in addition to the rest of Fe3+
(HS) (t2g3 eg
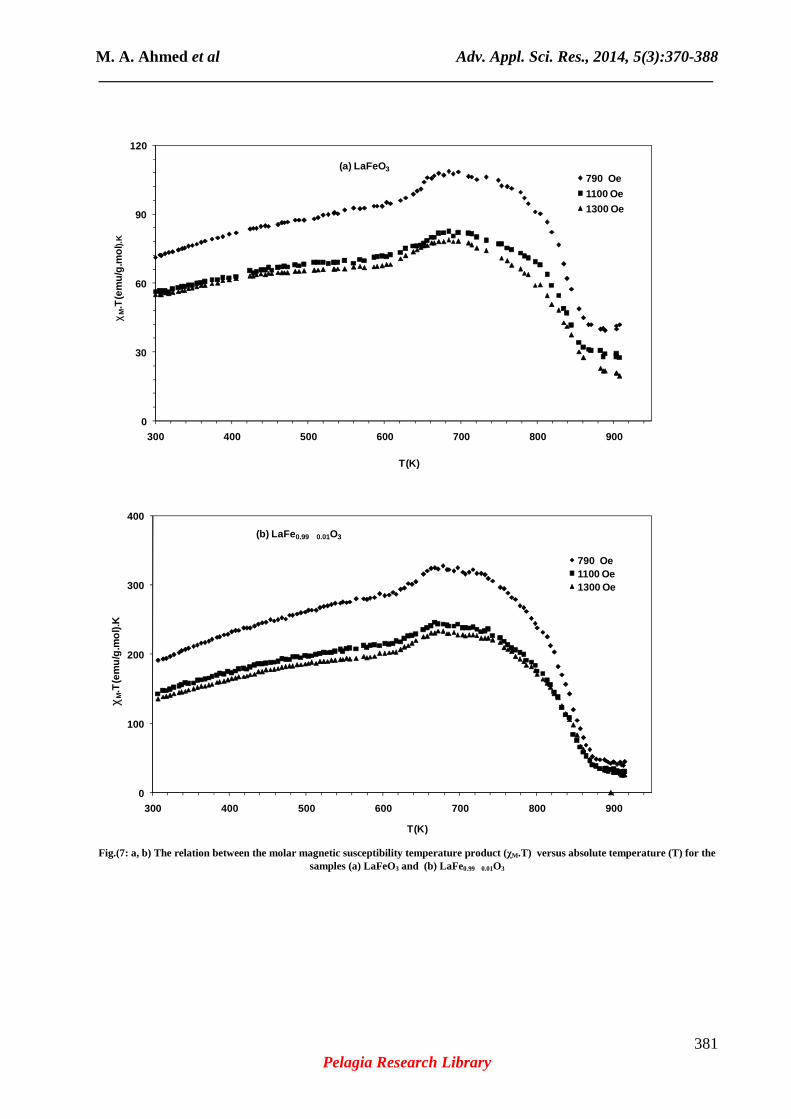
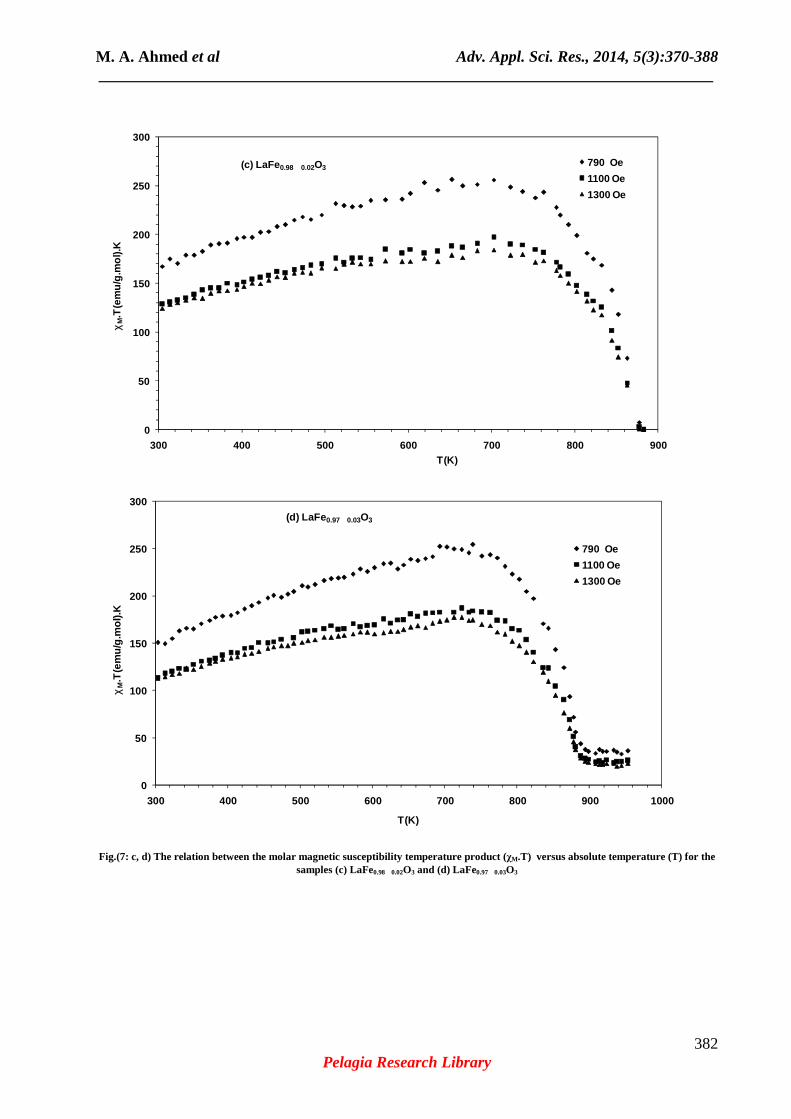
2). (ii) The tilting of <FeO6> induces a variation in the Fe-O-Fe bond angle and distance; though affecting the magnitude of the exchange interaction itself. The Curie–Weiss law is χM = C/ (T+θ), where χM is the molar magnetic susceptibility, C is the Curie constant, T is the absolute temperature and θ is the Curie–Weiss constant (19). The values of θ and the effective magnetic moment were calculated from µeff = 2.83 √C where C is the inverse of the slope of the straight line in the paramagnetic region. Figure (6) shows linear trend of the paramagnetic region which assures that the Curie–Weiss law is obeyed. The values of µeff, C and were calculated and reported in table (3). The positive values of θ indicates the presence of a weak ferromagnetic components in the samples. The values of θ increase with increasing the vacancy content. Therefore, the strength of the ferromagnetic component for these samples increased. Fig.(7: a-d) shows the behavior of the magnetic susceptibility temperature product (χM. T) versus the temperature (T). The trend assures the antiferromagnetic behavior with a clear ferromagnetic component in the samples. The increasing trend in the data refers to the antiferromagnetic component in the samples while, the decreasing one refers to the ferromagnetic. Goodenough (20) was the 1st to attempt a comprehensive explanation of the properties of the mixed-valence perovskite. He discussed the phase diagram of (La1-xCax)MnO3. Some of the Mn3+ converts to Mn4+ and these ions can form bonds of different nature with the surrounding oxygens through which magnetic coupling is mediated. These bonds are covalent, semicovalent and ionic bonds in addition to double exchange interaction. These interactions can account for the observations regarding Mn - Mn coupling: antiferromagnetic between two Mn4+ (covalent), ferromagnetic between a Mn3+ and a Mn4+ (double exchange) and antiferromagnetic (covalent) or ferromagnetic (semicovalent) between Mn3+.(21) DeGennes (22) found a stable canted configuration between the ferromagnetic and antiferromagnetic coupling. This is because the double exchange energy varies as cos (θo / 2) while the superexchange depends on cosθo. Minimizing the total energy, that is the sum of double exchange and superexchange contributions, deGennes found that the canting angle at zero temperature (θo) could be expressed as function of vacancy doped (x): Cos(θo /2) = (bx)/(4JS2) (2) where J is the inter-layer coupling (antiferromagnetic superexchange) and b the out of plane overlap integral (double-exchange interaction). Therefore, if x < (4JS2)/ b, canting will exist. Figure (8: a) illustrates the hysteresis plots of the samples LaFe1-y yO3, (0.0 ≤ y ≤ 0.03, step 0.01) at room temperature. The shape of the hysteresis loops is s-shape which indicates the antiferromagnetic behavior with a
M. A. Ahmed et al Adv. Appl. Sci. Res., 2014, 5(3):370-388 _____________________________________________________________________________
373 Pelagia Research Library
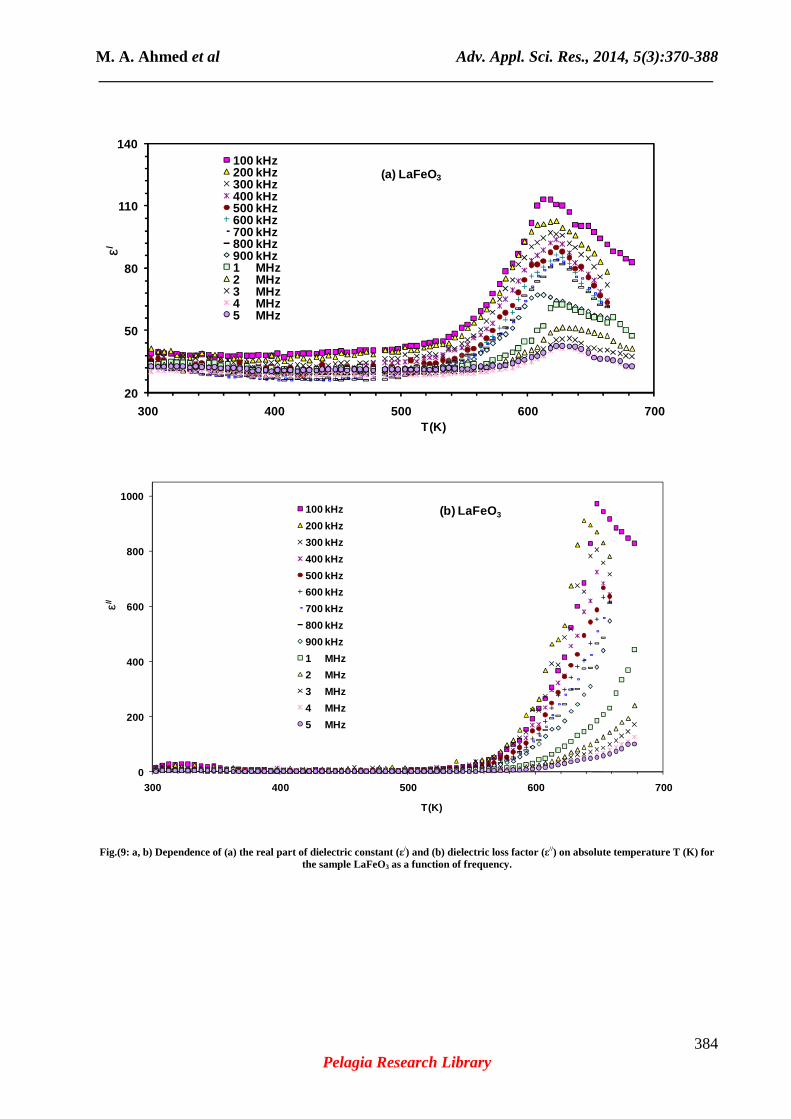
weak ferromagnetic component. This behavior can be explained in terms of a core/shell model; the FM-like component comes from the surface of the particles and the AFM contribution comes from the core spins (14). The saturation (Ms) and remnant magnetization (Mr) of vacancy doped samples were enhanced obviously. The value of Ms increased from 1.52 emu/g of the parent sample LaFeO3 to 2.63 emu/g for LaFe0.98 0.02O3 as shown in table (4). The hysteresis loops is shifted due to the exchange bias as shown in Fig.(8: b). The dependence of the dielectric constant on the absolute temperature of the sample LaFeO3 is shown in the Fig.(9: a). Figure (9: b) shows the dependence of ε
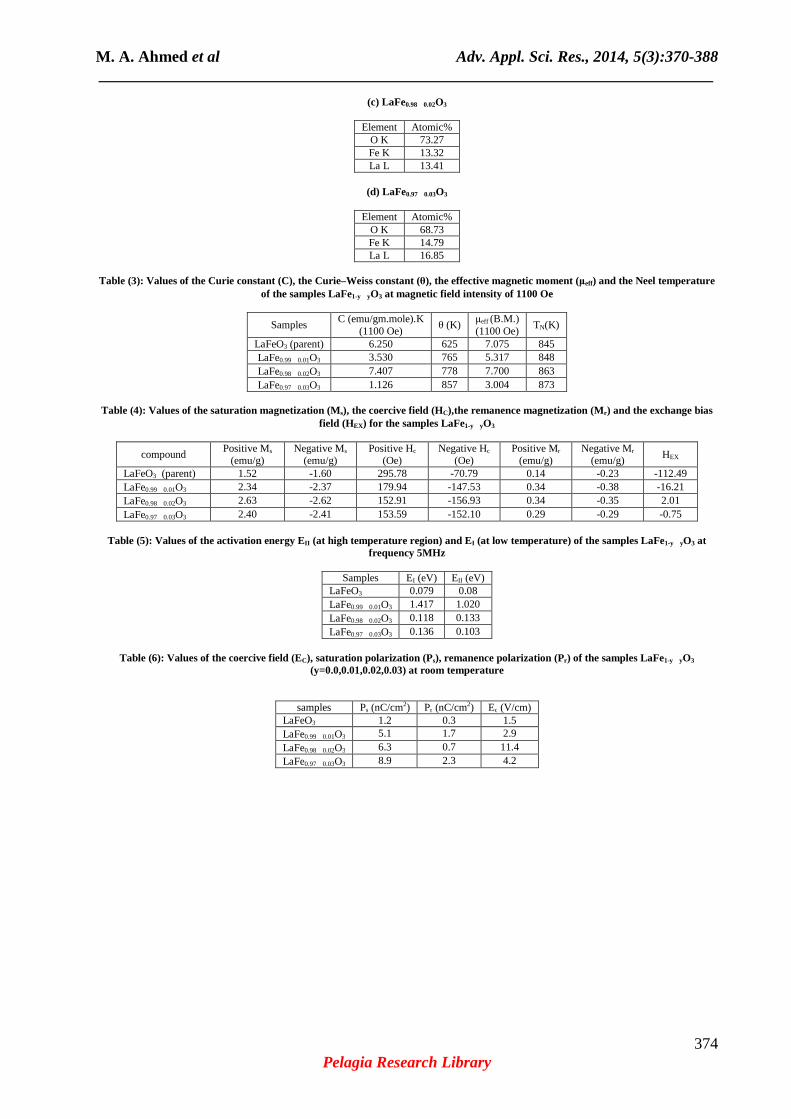
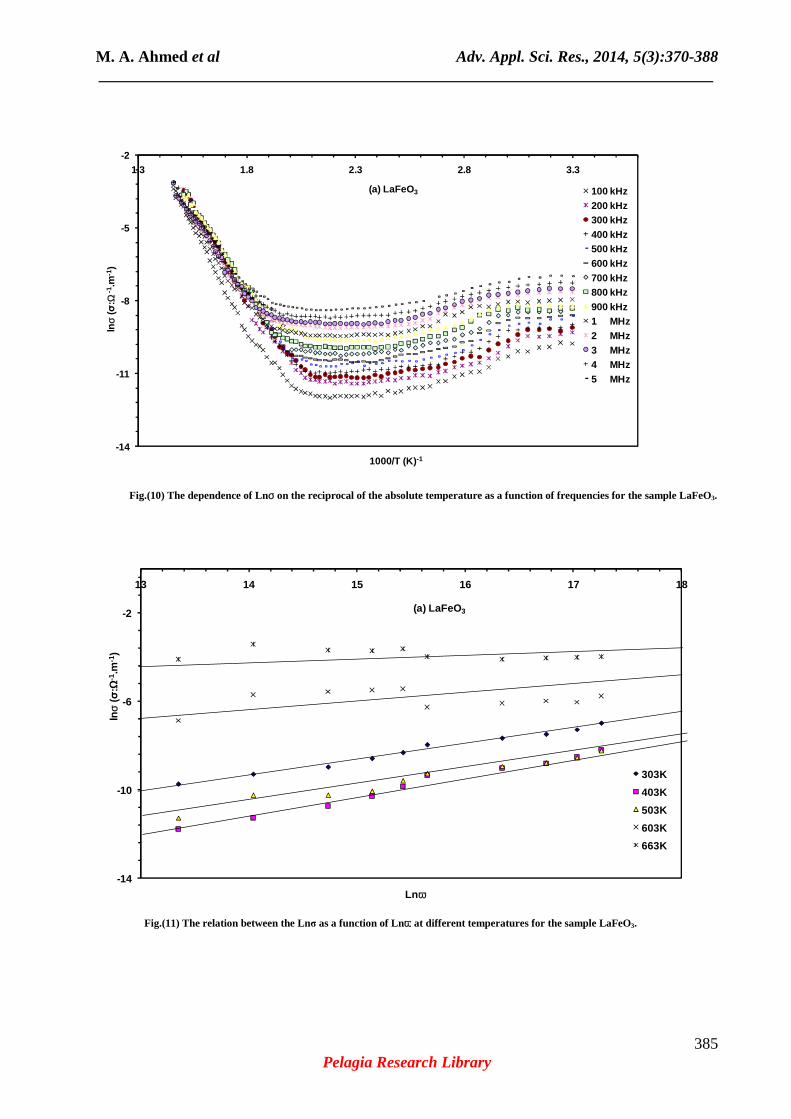
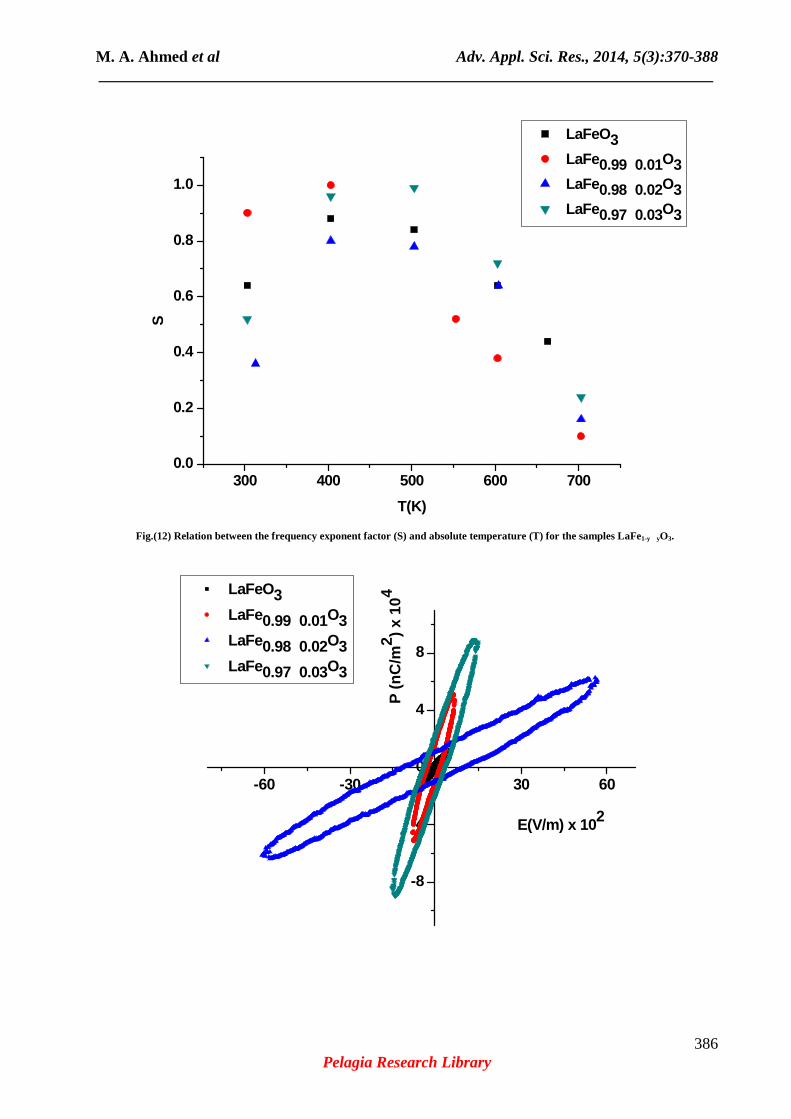
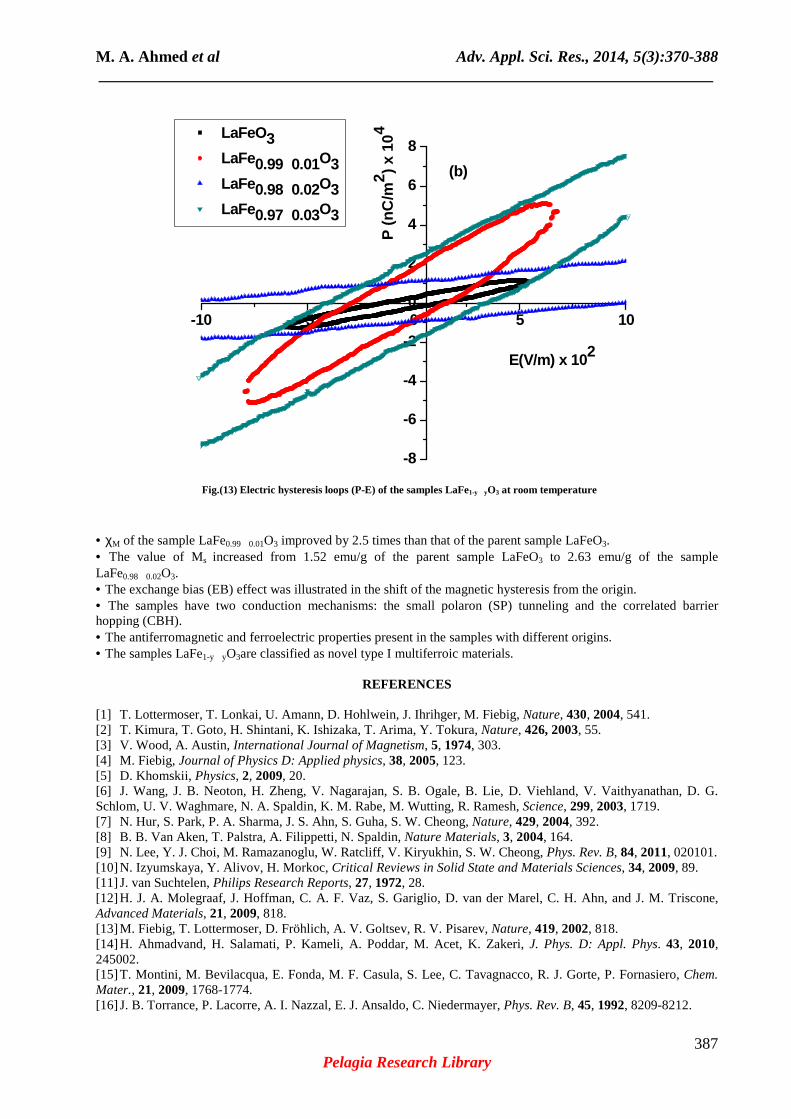
// on the absolute temperature at different frequencies for the sample LaFeO3. Generally ε // has the same trend of ε/. More than one region is obtained in ε// versus T data. The first one extends from room temperature up to about 600K. The second one in which ε// is drastically increased with increasing temperature due to large thermal energy which decreases the internal viscosity of the sample, which result in increasing the friction between the electric dipoles. The ac conductivity (lnσ) is plotted versus the reciprocal of the absolute temperature for the sample LaFeO3 at different frequencies in Fig.(10). The data in the figure obeys the well known Arrhenius equation (23) σ= σo e(-E/kT). Different straight lines were obtained intersecting at a point indicating the existence of different conduction mechanisms depending on the temperature range. The activation energies were calculated using Arrhenius equation and reported in table (5) at 5MHz. The values of the activation energies assure the semiconductor trend of the samples. Figure (11) shows the dependence of lnσ versus lnω at different temperatures from which the slopes are calculated (S). The relation between lnσ and lnω obey the universal power law. The relation between S and T was illustrated in Fig.(12) for the investigated samples. The trend of S versus T shows that there are two main conduction mechanisms, in the 1st temperature region up to 400 K is the small polaron (SP) tunneling and In the 2nd temperature region (T > 400 K) is the correlated barrier hopping (CBH). The samples have a ferroelectric behavior which is assured from the electric hysteresis loops as shown in Fig.(13). This ferroelectric behavior is due to the displacement of the ions from their positions to forming covalent bonds and also by the tilting of <FeO6> octahedron. The values of saturation polarization (Ps), remnant polarization (Pr) and the electric coercivity (Ec) are reported in table (6). The ferroelectric properties of the samples were improved by the vacancy substitution where the saturation polarization increased with increasing the vacancies in the samples. We can conclude that the investigated samples LaFe1-y yO3, (0.0 ≤ y ≤ 0.03 in step of 0.01) could be classified as type I multiferroic nanomaterials owing to the presence of the antiferromagnetic and ferroelectric behavior in simultaneously and independent on each other. Table (1): Values of the lattice parameters a, b, c, the unit cell volume, the theoretical density (Dx), the particle size (L) and the tolerance
factor (t) for the samples LaFe1-y yO3 (y=0.0,0.01,0.02,0.03)
M. A. Ahmed et al Adv. Appl. Sci. Res., 2014, 5(3):370-388 _____________________________________________________________________________
378 Pelagia Research Library
Fig.(4: a, b) Dependence of the molar magnetic susceptibility on the absolute temperature for the samples (a) LaFeO3 and (b)
LaFe0.99 0.01O3, where is the vacancy concentration
0
0.05
0.1
0.15
0.2
0.25
300 400 500 600 700 800 900
χ M(e
mu
/g.m
ol)
T(K)
(a) LaFeO3
790 Oe
1100 Oe
1300 Oe
0
0.2
0.4
0.6
0.8
300 400 500 600 700 800 900
χ M(e
mu
/g m
ole
)
T(K)
(b) LaFe0.990.01O3 790 Oe
1100 Oe
1300 Oe
M. A. Ahmed et al Adv. Appl. Sci. Res., 2014, 5(3):370-388 _____________________________________________________________________________
379 Pelagia Research Library
Fig.(4: c, d) Dependence of the molar magnetic susceptibility on the absolute temperature for the samples (c) LaFe0.98 0.02O3 and (d) LaFe0.97 0.03O3, where is the vacancy concentration
0
0.2
0.4
0.6
300 400 500 600 700 800
χ M(e
mu
/g.m
ol)
T(K)
(c) LaFe0.980.02O3790 Oe
1100 Oe
1300 Oe
0
0.2
0.4
0.6
300 400 500 600 700 800 900 1000
χ M(e
mu
/gm
.mo
le)
T(K)
(d) LaFe0.970.03O3
790 Oe1100 Oe1300 Oe
M. A. Ahmed et al Adv. Appl. Sci. Res., 2014, 5(3):370-388 _____________________________________________________________________________
380 Pelagia Research Library
Fig.(5) Illustration of dependence of the molar magnetic susceptibility on the absolute temperature for the samples LaFe1-y yO3 (y=0.0, 0.01, 0.02 and 0.03) where is the vacancy concentration
Fig.(6) Dependence of the reciprocal molar magnetic susceptibility on the absolute temperature in paramagnetic region for the sample LaFeO3 at different magnetic field intensities
M. A. Ahmed et al Adv. Appl. Sci. Res., 2014, 5(3):370-388 _____________________________________________________________________________
381 Pelagia Research Library
Fig.(7: a, b) The relation between the molar magnetic susceptibility temperature product (χM.T) versus absolute temperature (T) for the samples (a) LaFeO3 and (b) LaFe0.99 0.01O3
0
30
60
90
120
300 400 500 600 700 800 900
χ M.T
(em
u/g
.mo
l).K
T(K)
(a) LaFeO3
790 Oe
1100 Oe
1300 Oe
0
100
200
300
400
300 400 500 600 700 800 900
χ M.T
(em
u/g
.mo
l).K
T(K)
(b) LaFe0.990.01O3
790 Oe1100 Oe1300 Oe
M. A. Ahmed et al Adv. Appl. Sci. Res., 2014, 5(3):370-388 _____________________________________________________________________________
382 Pelagia Research Library
Fig.(7: c, d) The relation between the molar magnetic susceptibility temperature product (χM.T) versus absolute temperature (T) for the
samples (c) LaFe0.98 0.02O3 and (d) LaFe0.97 0.03O3
0
50
100
150
200
250
300
300 400 500 600 700 800 900
χ M.T
(em
u/g
.mo
l).K
T(K)
(c) LaFe0.980.02O3 790 Oe
1100 Oe
1300 Oe
0
50
100
150
200
250
300
300 400 500 600 700 800 900 1000
χ M.T
(em
u/g
.mo
l).K
T(K)
(d) LaFe0.97 0.03O3
790 Oe
1100 Oe
1300 Oe
M. A. Ahmed et al Adv. Appl. Sci. Res., 2014, 5(3):370-388 _____________________________________________________________________________
383 Pelagia Research Library
Fig.(8) (M-H) Hysteresis loops of the samples LaFe1-y yO3 (y= 0.0, 0.01, 0.02 and 0.03) where is the vacancy concentration.
M. A. Ahmed et al Adv. Appl. Sci. Res., 2014, 5(3):370-388 _____________________________________________________________________________
387 Pelagia Research Library
• χM of the sample LaFe0.99 0.01O3 improved by 2.5 times than that of the parent sample LaFeO3. • The value of Ms increased from 1.52 emu/g of the parent sample LaFeO3 to 2.63 emu/g of the sample LaFe0.98 0.02O3. • The exchange bias (EB) effect was illustrated in the shift of the magnetic hysteresis from the origin. • The samples have two conduction mechanisms: the small polaron (SP) tunneling and the correlated barrier hopping (CBH). • The antiferromagnetic and ferroelectric properties present in the samples with different origins. • The samples LaFe1-y yO3are classified as novel type I multiferroic materials.
REFERENCES [1] T. Lottermoser, T. Lonkai, U. Amann, D. Hohlwein, J. Ihrihger, M. Fiebig, Nature, 430, 2004, 541. [2] T. Kimura, T. Goto, H. Shintani, K. Ishizaka, T. Arima, Y. Tokura, Nature, 426, 2003, 55. [3] V. Wood, A. Austin, International Journal of Magnetism, 5, 1974, 303. [4] M. Fiebig, Journal of Physics D: Applied physics, 38, 2005, 123. [5] D. Khomskii, Physics, 2, 2009, 20. [6] J. Wang, J. B. Neoton, H. Zheng, V. Nagarajan, S. B. Ogale, B. Lie, D. Viehland, V. Vaithyanathan, D. G. Schlom, U. V. Waghmare, N. A. Spaldin, K. M. Rabe, M. Wutting, R. Ramesh, Science, 299, 2003, 1719. [7] N. Hur, S. Park, P. A. Sharma, J. S. Ahn, S. Guha, S. W. Cheong, Nature, 429, 2004, 392. [8] B. B. Van Aken, T. Palstra, A. Filippetti, N. Spaldin, Nature Materials, 3, 2004, 164. [9] N. Lee, Y. J. Choi, M. Ramazanoglu, W. Ratcliff, V. Kiryukhin, S. W. Cheong, Phys. Rev. B, 84, 2011, 020101. [10] N. Izyumskaya, Y. Alivov, H. Morkoc, Critical Reviews in Solid State and Materials Sciences, 34, 2009, 89. [11] J. van Suchtelen, Philips Research Reports, 27, 1972, 28. [12] H. J. A. Molegraaf, J. Hoffman, C. A. F. Vaz, S. Gariglio, D. van der Marel, C. H. Ahn, and J. M. Triscone, Advanced Materials, 21, 2009, 818. [13] M. Fiebig, T. Lottermoser, D. Fröhlich, A. V. Goltsev, R. V. Pisarev, Nature, 419, 2002, 818. [14] H. Ahmadvand, H. Salamati, P. Kameli, A. Poddar, M. Acet, K. Zakeri, J. Phys. D: Appl. Phys. 43, 2010, 245002. [15] T. Montini, M. Bevilacqua, E. Fonda, M. F. Casula, S. Lee, C. Tavagnacco, R. J. Gorte, P. Fornasiero, Chem. Mater., 21, 2009, 1768-1774. [16] J. B. Torrance, P. Lacorre, A. I. Nazzal, E. J. Ansaldo, C. Niedermayer, Phys. Rev. B, 45, 1992, 8209-8212.
Fig.(13) Electric hysteresis loops (P-E) of the samples LaFe1-y yO3 at room temperature
M. A. Ahmed et al Adv. Appl. Sci. Res., 2014, 5(3):370-388 _____________________________________________________________________________
388 Pelagia Research Library
[17] A. Rais, Measurement, 35, 2004, 289–292. [18] M. A. Ahmed, N. Okasha, B. Hussein, Journal of Alloys and Compounds 553, 2013, 308–315. [19] M. A. Ahmed, M. Solyman Selim, M. M. Arman, Materials Chemistry and Physics 129, 2011, 705– 712. [20] J. B. Goodenough, Phys. Rev., 100, 1955, 564. [21] J. M. D. Coey, M. Viret, Advances in Physics, 48, 1999, 167 – 293. [22] P. G. deGennes, Phys. Rev., 118, 1960, 141. [23] L. J. Berchmans, R. Sindhu, S. Angappan, C. O. Augustin, Journal of materials processing technology, 207, 2008, 301–306.