16
New Orleans Population Surpasses 300,000 Major events shed positive spotlight on city’s recovery
| Date post: | 14-Dec-2015 |
| Category: |
Documents |
| Upload: | joan-tinkler |
| View: | 216 times |
| Download: | 0 times |
New Orleans Population Surpasses 300,000Major events shed positive spotlight on city’s recovery
Population of New Orleans
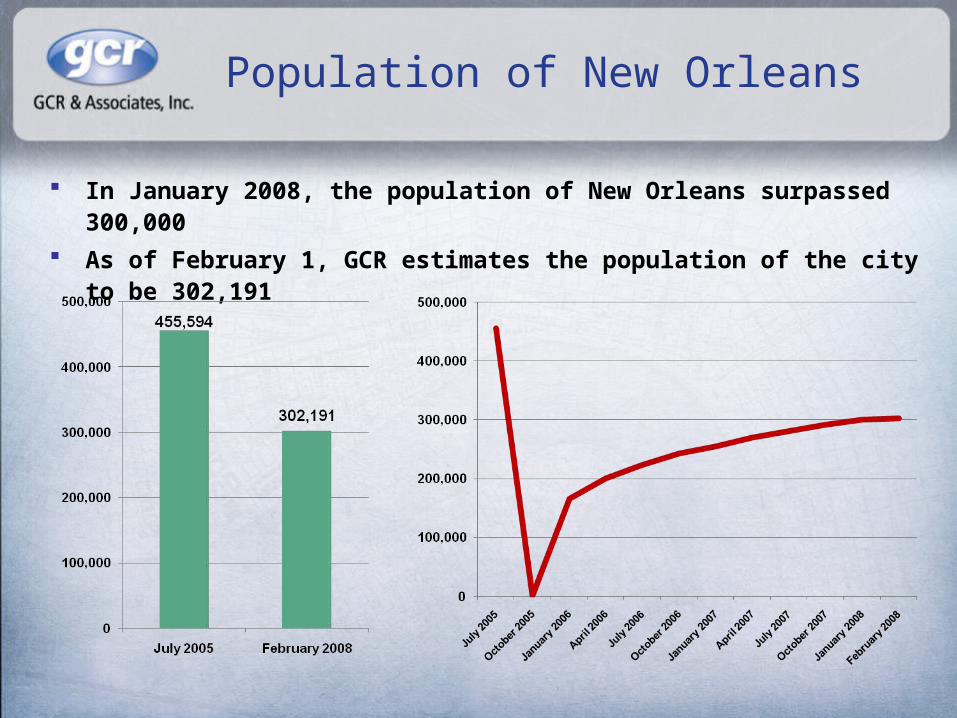
In January 2008, the population of New Orleans surpassed 300,000
As of February 1, GCR estimates the population of the city to be 302,191
Crossing the 300,000 Threshold
Exceeding the 300,000 threshold is a milestone and restores New Orleans to a cohort of major cities like Pittsburgh, Tampa, Anaheim and St. Louis
In the first two months of 2008, New Orleans successfully demonstrated that it had the capacity to host major sporting and cultural events, proving that the tourism industry is returning to its pre-storm strength
As more recovery dollars begin to flow in 2008, the city will become more attractive to individuals and businesses trying to capitalize on the economic opportunities at hand
New Orleans: Once Again a Destination City
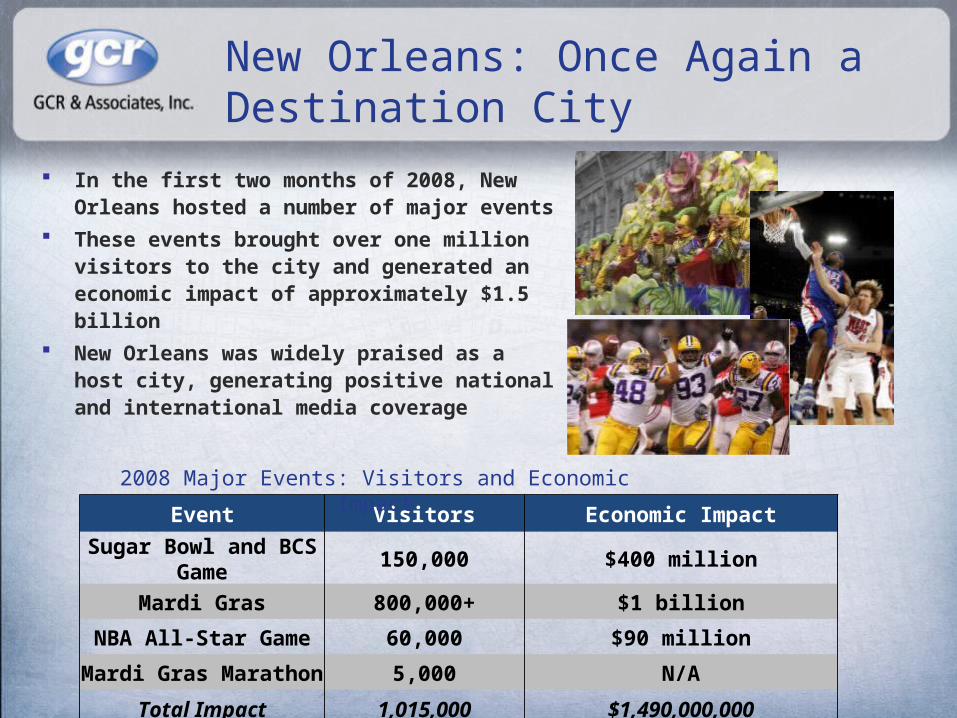
In the first two months of 2008, New Orleans hosted a number of major events
These events brought over one million visitors to the city and generated an economic impact of approximately $1.5 billion
New Orleans was widely praised as a host city, generating positive national and international media coverage
Event Visitors Economic Impact
Sugar Bowl and BCS Game 150,000 $400 million
Mardi Gras 800,000+ $1 billion
NBA All-Star Game 60,000 $90 million
Mardi Gras Marathon 5,000 N/A
Total Impact 1,015,000 $1,490,000,000
2008 Major Events: Visitors and Economic Impact
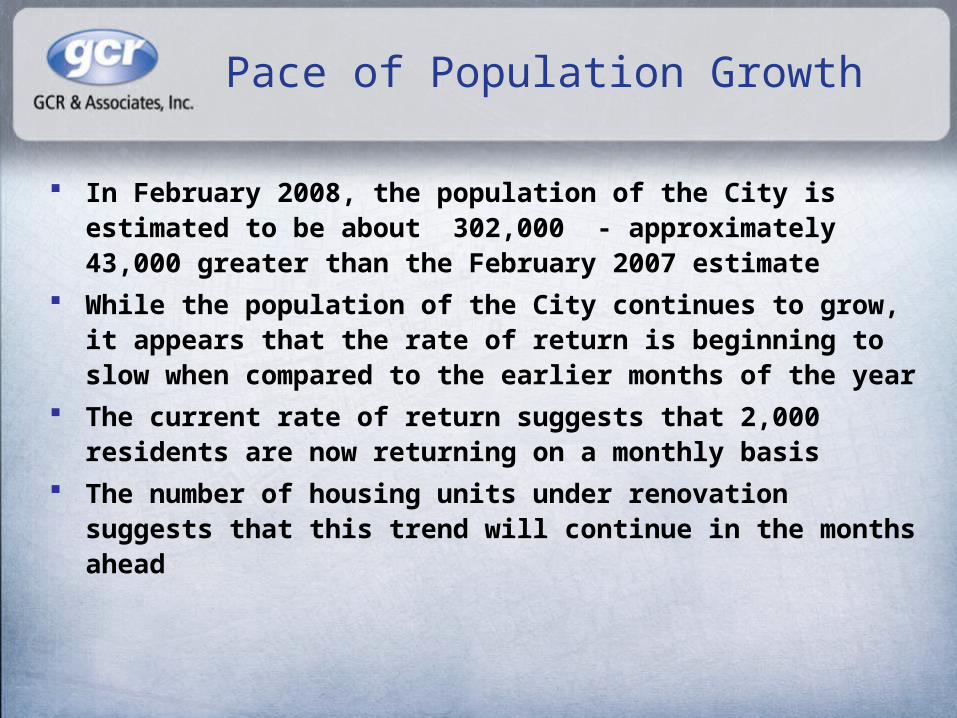
Pace of Population Growth
In February 2008, the population of the City is estimated to be about 302,000 - approximately 43,000 greater than the February 2007 estimate
While the population of the City continues to grow, it appears that the rate of return is beginning to slow when compared to the earlier months of the year
The current rate of return suggests that 2,000 residents are now returning on a monthly basis
The number of housing units under renovation suggests that this trend will continue in the months ahead
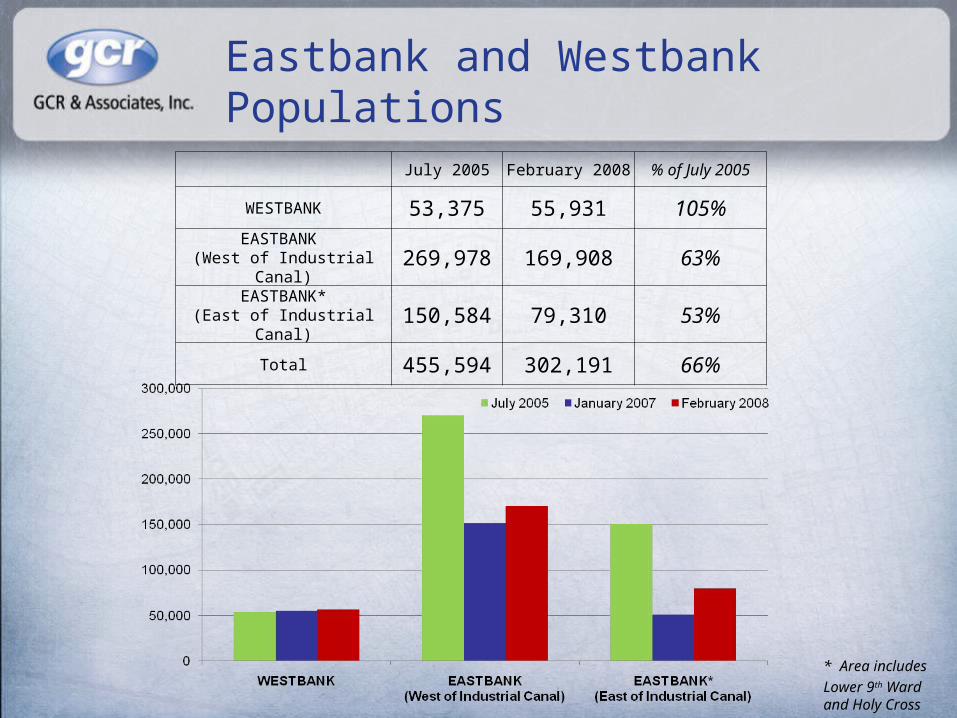
Eastbank and Westbank Populations
July 2005 February 2008 % of July 2005
WESTBANK 53,375 55,931 105%
EASTBANK (West of Industrial Canal) 269,978 169,908 63%
EASTBANK*(East of Industrial Canal) 150,584 79,310 53%
Total 455,594 302,191 66%
* Area includes
Lower 9th Ward and Holy Cross
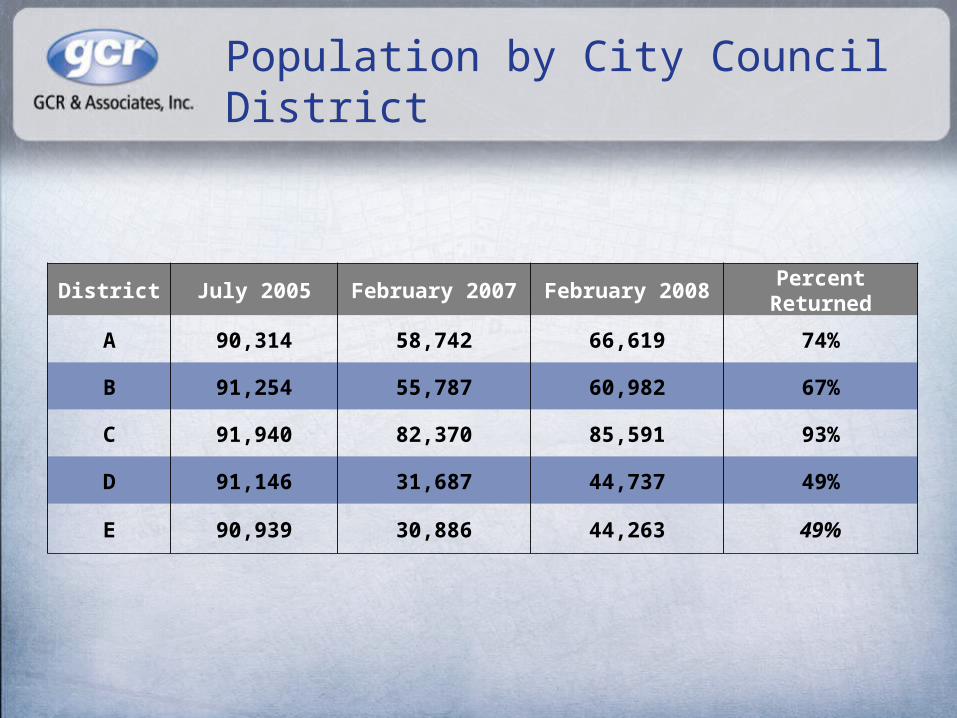
Population by City Council District
District July 2005 February 2007 February 2008 Percent Returned
A 90,314 58,742 66,619 74%
B 91,254 55,787 60,982 67%
C 91,940 82,370 85,591 93%
D 91,146 31,687 44,737 49%
E 90,939 30,886 44,263 49%
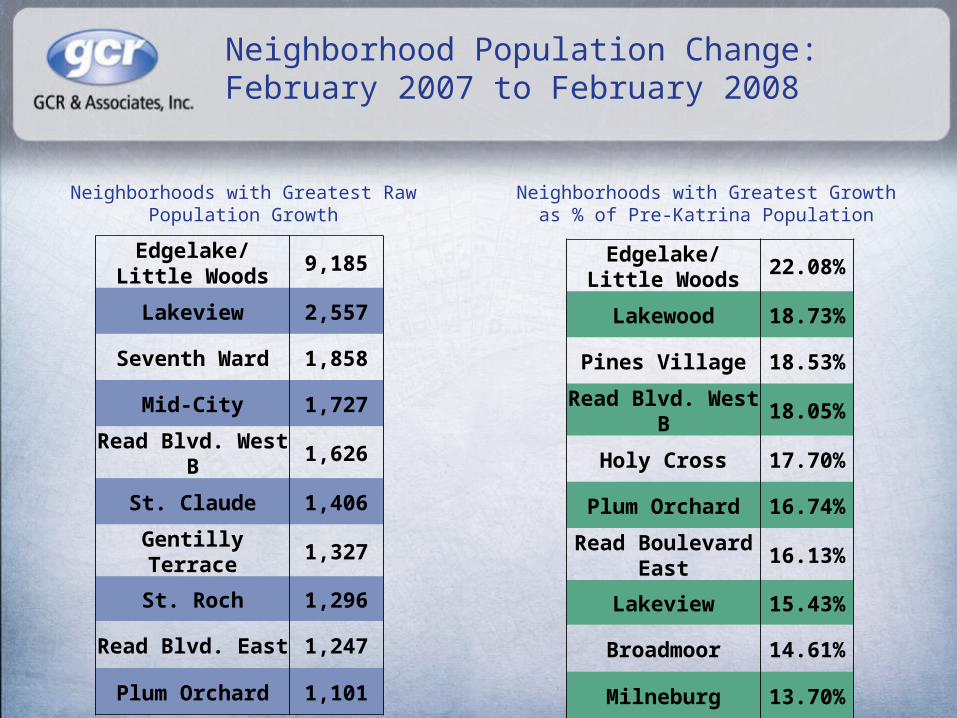
Neighborhood Population Change: February 2007 to February 2008
Neighborhoods with Greatest Raw Population Growth
Neighborhoods with Greatest Growth as % of Pre-Katrina Population
Edgelake/ Little Woods 9,185
Lakeview 2,557
Seventh Ward 1,858
Mid-City 1,727
Read Blvd. West B 1,626
St. Claude 1,406
Gentilly Terrace 1,327
St. Roch 1,296
Read Blvd. East 1,247
Plum Orchard 1,101
Edgelake/ Little Woods 22.08%
Lakewood 18.73%
Pines Village 18.53%
Read Blvd. West B 18.05%
Holy Cross 17.70%
Plum Orchard 16.74%
Read Boulevard East 16.13%
Lakeview 15.43%
Broadmoor 14.61%
Milneburg 13.70%
Snapshots of Recovery
The following slides illustrate resettlement patterns in the city over time: July 2006 through February 2008. These maps demonstrate how repopulation has radiated outward from areas which recovered quickly after the storm.
In each of these maps, red represents areas in which activity is less than 20% of its pre-Katrina level. Green represents areas in which activity is greater than 80% of its pre-Katrina level. Yellow and orange display areas in between.
Boundaries of New Orleans City Council Districts are also displayed.

Resettlement Pattern: July 2006
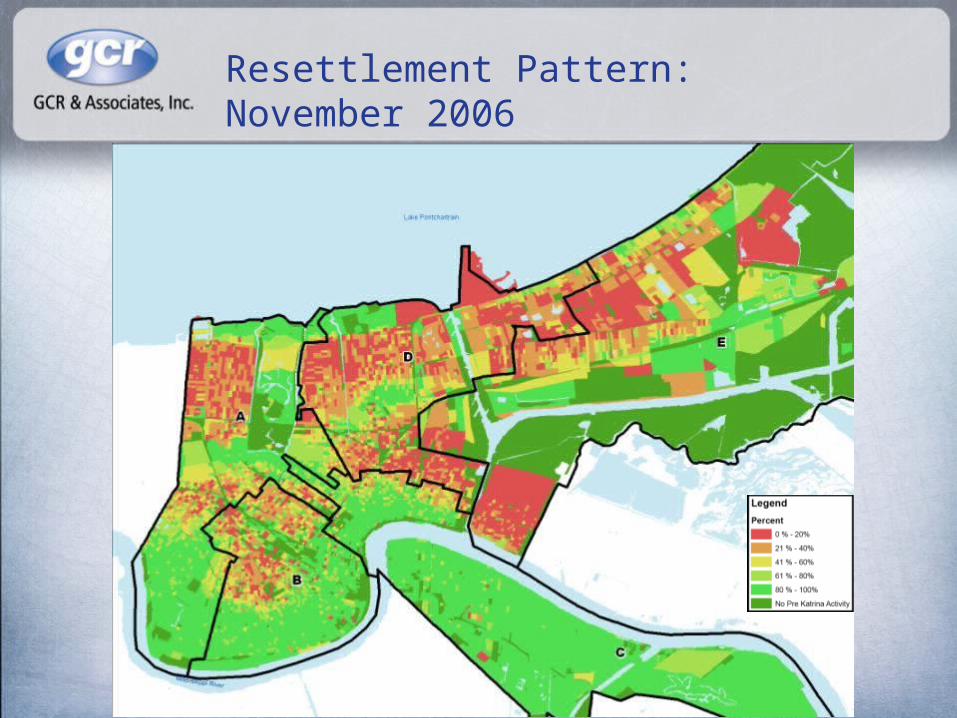
Resettlement Pattern: November 2006
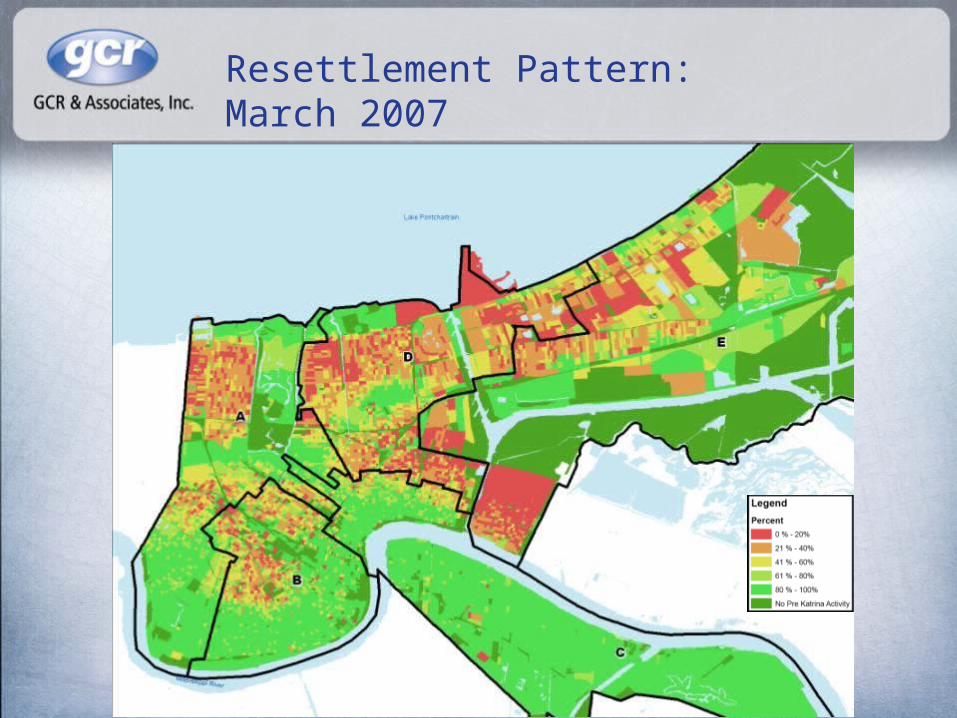
Resettlement Pattern: March 2007
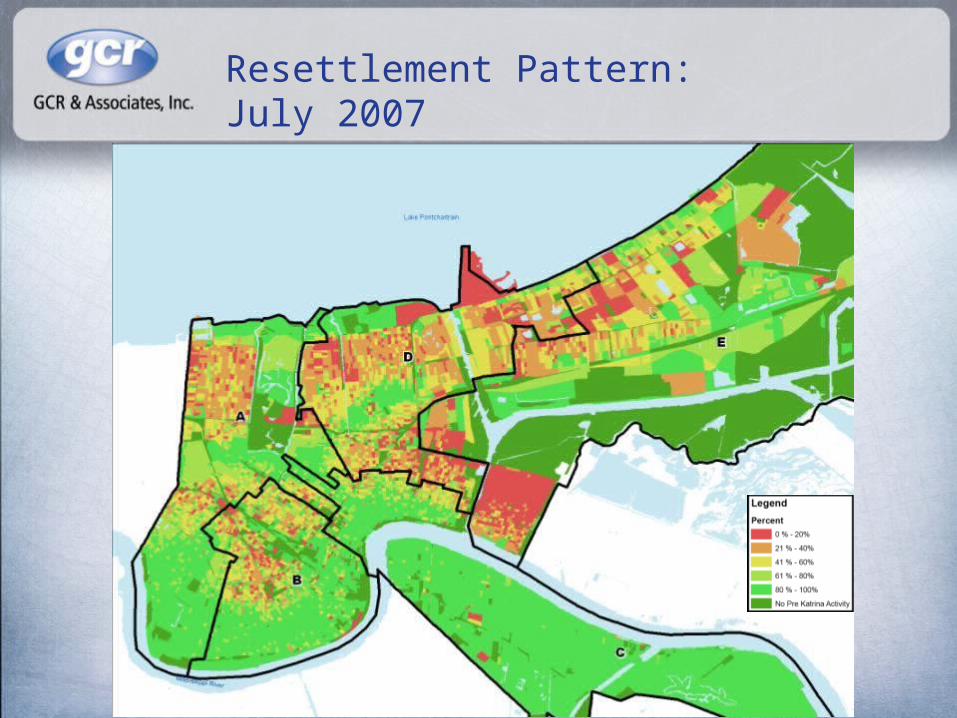
Resettlement Pattern: July 2007
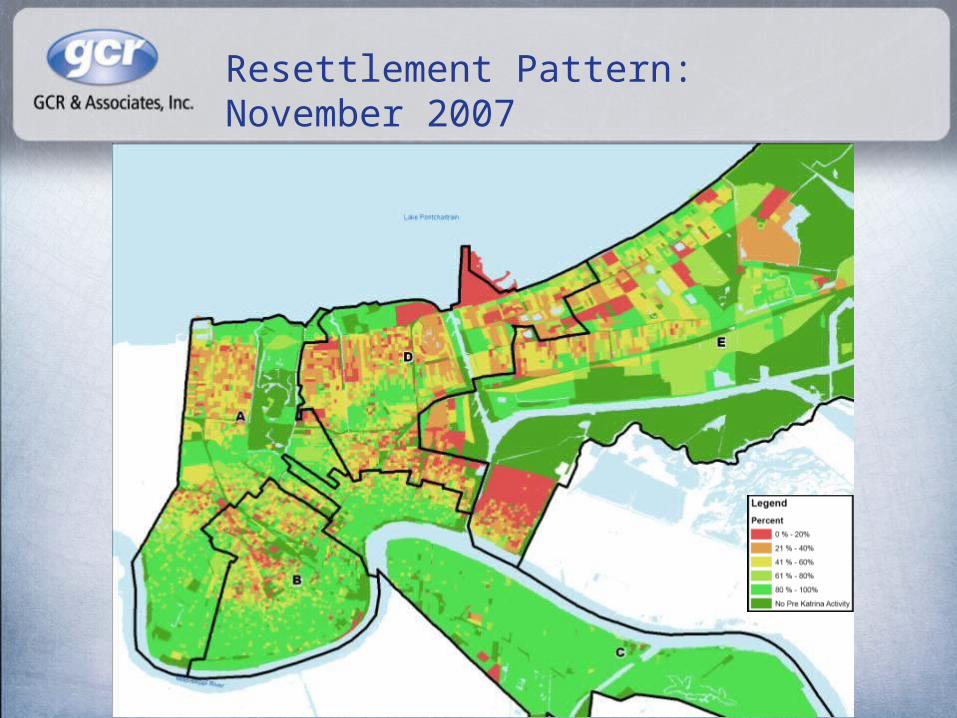
Resettlement Pattern: November 2007
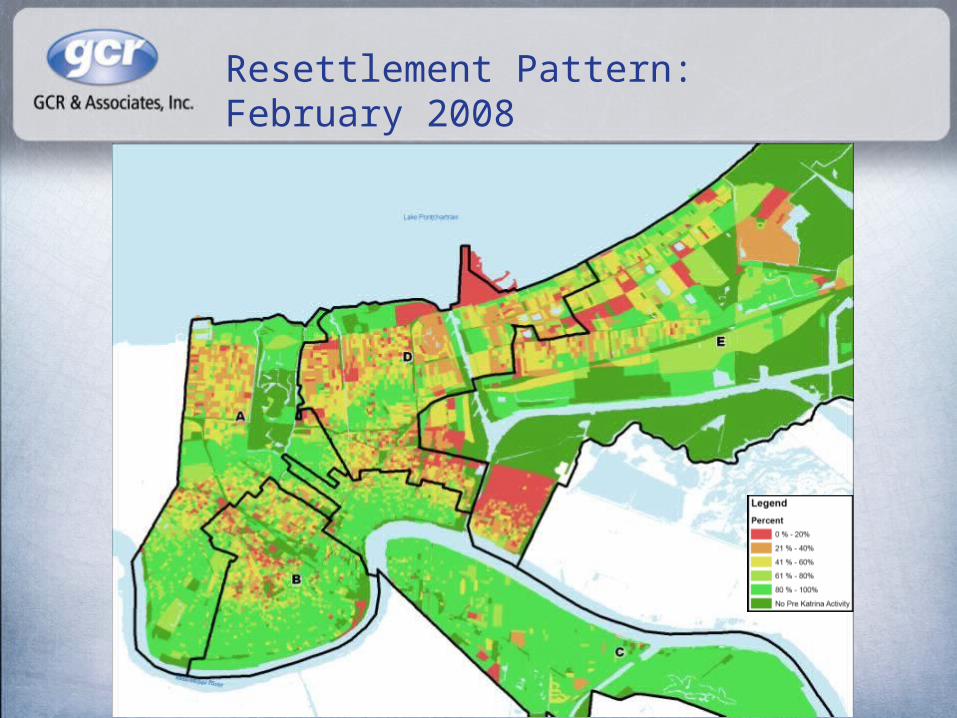
Resettlement Pattern: February 2008