49
Submitted By Marwa M. AL-A’qarbeh O OH OH 18 F N N NO 2 38 1
| Date post: | 06-Aug-2015 |
| Category: |
Science |
| Upload: | phd-studant |
| View: | 35 times |
| Download: | 1 times |

Submitted By Marwa M. AL-A’qarbeh
O
OH
OH
18F
NN
NO2
38
1

2

3

4

Hypoxia Cell/Hypoxia
Tissue
Hypoxia Cell/Hypoxia
Tissue
5

HypoxiaHypoxia:: the reduction or lack of oxygen in
organs, tissues, or cells.
This decrease of oxygen tension can be due to a reduced supply in oxygen, As a result of anemia
6

HypoxiaHypoxia
Hypoxia can be physiologic or pathologic such as in solid cancers , rheumatoid arthritis, atherosclerosis.
7

HypoxicAnemicHypemicHistotoxicStagnant
8

Hypoxic - occurs when the entire body doesn't
receive an appropriate amount of oxygen supply, and as a result, there is a low partial pressure of oxygen in the arterial blood
- Potential causes of Hypoxic hypoxia entail high altitude ascension, sleep apnea, inappropriate ventilation, or a heart mechanism failure
9

10

11

is the situation where tumor cells have been deprived of oxygen. As a tumor grows, it rapidly outgrows its blood supply, leaving portions of the tumor with regions where the oxygen concentration is significantly lower than in healthy tissues. Hypoxic microenvironements in solid tumors are in result of available oxygen being consumed within 70 to 150 μm of tumour vasculature by rapidly proliferating tumor cells thus limiting the amount of oxygen available to diffuse further into the tumor tissue
12

1. HIF-1 induced changes in gene expression2. GLUT1 transporter expression3. Hexokinase 2 expression4. Phosphoglucose isomerase expression5. 6-Phosphofructo-2-kinase/fructose 2,6-
bisphosphatases expression6. Fructose-1,6-bisphosphate aldolase expression7. Glyceraldehyde-3-phosphate dehydrogenase
expression8. Phosphoglycerate kinase 1 expression9. Phosphoglycerate mutase expression10. Enolase 1 expression11. Pyruvate kinase expression12. Pyruvate dehydrogenase kinase expression13. Lactate dehydrogenase expression
13

14

Ionizing radiation + H2O [H2O+] + e- *OH + H+ + e-
*OH + DNA DNA* or DNAOH*
In the presence of oxygen
DNA* + O2 DNAOO*
In the absence of O2
DNA* + RSH DNA + RS*
15

16
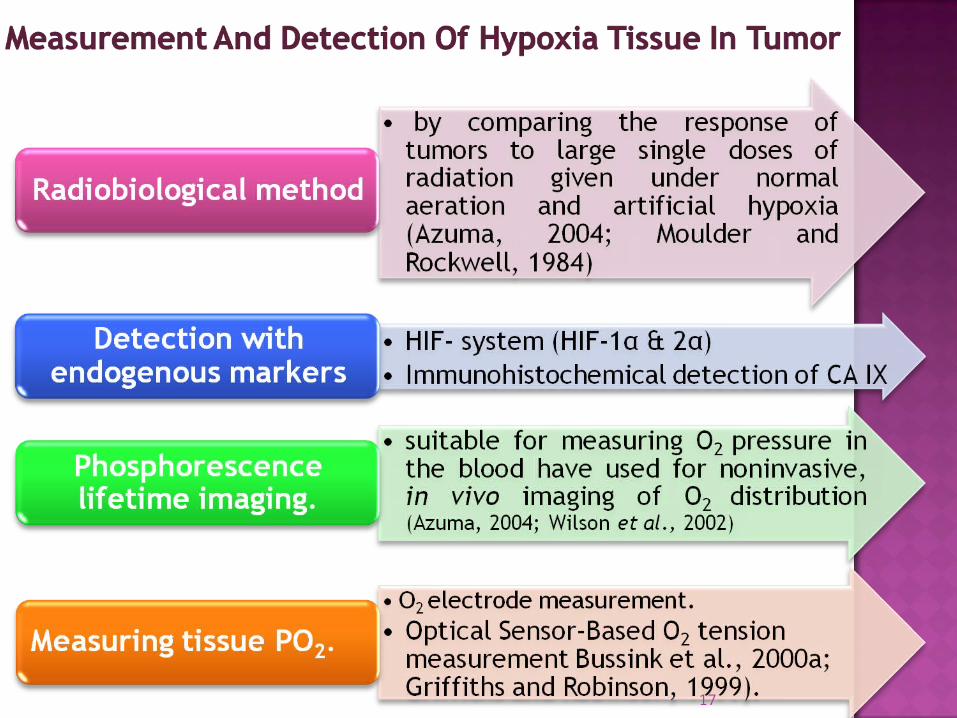
17

PET-Scan Techniques
18

An acronym of Positron Emission
Tomography, PET is an analytical nuclear
medicine imaging technology, it uses positron
labeled molecules in very low mass amounts to
image and measure the function of biological
processes with minimal disturbance, using
radiolabeled molecules to image molecular
interactions of biological processes in vivo
(Phelps, 2000). 19

analytical nuclear medicine imaging technology,
a positron-labeled molecule is used in very low
mass amount to image and measure the function of
biological processes with minimal disturbance
(Phelps, 2000; Phelps et al., 1975).
Measuring without disturbing, the biological
process a fundamental and biologically important
aspect of PET tracer technique.20

first an input function taken from the plasma to represent
the delivery of the labeled probe.
Second the PET measure of the tissue concentration of the
labeled probe and its labeled reaction products in organs.
third a compartmental model often the assay models are
used to produce sufficient knowledge to allow a simpler,
qualitative approach to meet the needs of a clinical service
21

22

(Phelps, 2000)
23

3 – Dimensional (3D) PET.
PET/ CT scanner .
Time-of- Flight (TOF) PET.
Very –High- Resolution Preclinical PET.
Micro PET.
Whole - Body PET 24

Whole body PET (3D) from (Cherry, 2006)
25

micro PET from (Phelps, 2000)
26

Studying of some biological process, (e.g. glucose metabolism)
drug metabolism and banding in human body, Blood flow,
metabolic of cardiac tissue, and process in brain (Laverman et al.,
2008; Phelps, 2000)
Dementia and Alzheimer's diseases
Cancer, by accurate diagnosis of primary and recurrent tumor,
accurate determination of tumor extent after diagnosis, and
Prediction and assessment of treatment response (Phelps, 2000).
Detection of asymptomatic disease (Phelps, 2000)
Imaging gene expression in vivo (Schlyer, 2004; Phelps, 2000)
Imaging of hypoxia tissue
27

28

Nuclide Half-life Decay mode (%) E β+, max (keV)
11C 20.4 min β+ (99.8), EC (0.2) 960
13N 9.96 min β+ (100) 1190
15O 2.03 min β+ (99.9), EC (0.1) 172030P 2.5 min β+ (99.8), EC (0.2) 325018F 109.6 min β+ (97), EC (3) 635
75Br 98 min β+ (75.5), EC (24.5) 174076Br 16.1 h β+ (57), EC (43) 3900
120I 1.35 h β+ (64), EC (36) 410038K 7.6 min β+ (100) 2680
62Cu 9.7 min β+ (98), EC (2) 2930
64Cu 12.7 h β+ (18), β- (37), EC (45) 65568Ga 68.3 min β+ (90), EC (10) 190094Tc 52 min β+ (72), EC (28) 247082Rb 1.3 min β+ (96), EC (4) 335072As 26 h β+ (88), EC (12) 2515
38K 7.6 min β+ (100) 268086Y 14.7 h β+ (34), EC (66) 130029

30

[18F]FDG2-[18F]fluoro-2-deoxy-D-
glucose
Glucose
metabolism
(Iodo et al.,
1979)
O
OH
HO OH
HOF
27
31

32

33
NN
HN
CF3O
FF
NO2
25
[18F]EF52-(2-nitro-1[H]-imidazol-1-yl)-N-
(2,2,3,3,3-pentafluoropropyl)-aceamide
Tissue hypoxia

[18F]FAZA2-Fluoromethyl-5-(2-nitro-
imidazol-1-yl)-tetrahydro-furan-
3,4-diol
Hypoxia tissue
marker
(Kumar et al.,
1999)
O
OH
OH
18F
NN
NO2
38
[18F]FETNIM4-[18F]fluoro-2,3-dihydroxy-1-(2-
nitroimidazol-1-yl)-butanol
Tissue hypoxia
OH
NN
N+
O
-O
OH
OH
18F29
34

Ro-07-
0741
(FMISO)
1-Fluoro-3-(2-nitro-imidazol-
1-yl)-propan-2-ol)
Hypoxia
tissue marker
Called golden
hypoxia pet
marker
(Hodgkiss et
al.1998)
NN
NO2
18F
OH
39
35

Purpose of
Reserch
36

NN
NO2
18F
OH
39
(FMISO)
Hodgkiss et al.1998)
37

38

Expermantal work
Expermantal work
39

Cold Synthesis
40

Hot synthesis pathway “done by Dirk Loffler, at Tubingen university
41

42

400 MHz 1H-NMR (CDCl3)
60 MHz 13C – NMR (CDCl3)
FT -HRMS
43
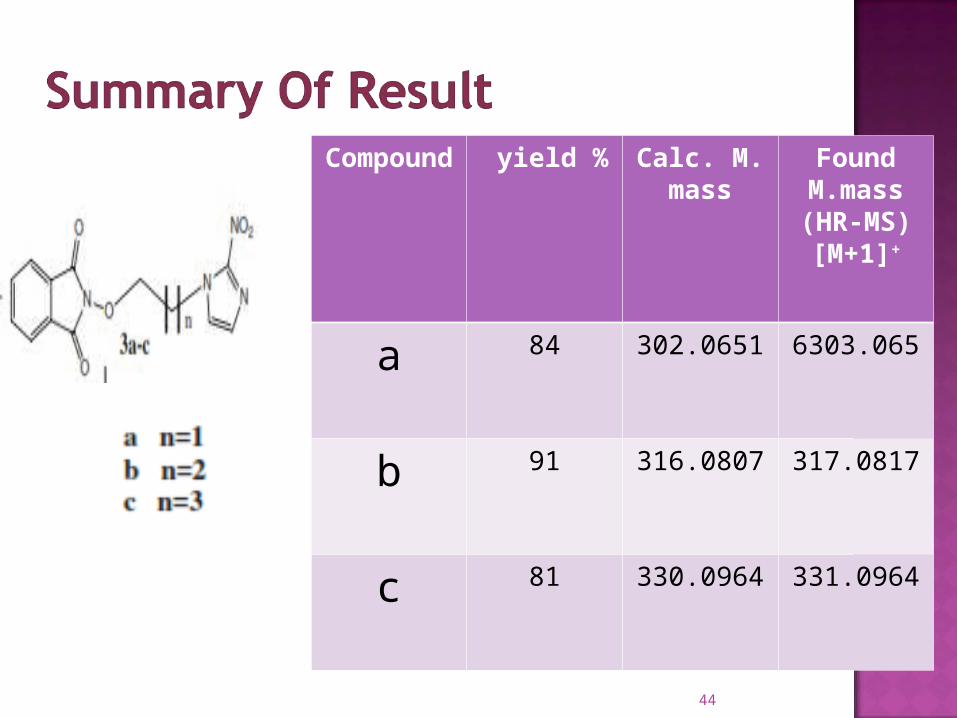
Compound
%yield Calc. M. mass
Found M.mass (HR-MS)[M+1]+
a 84 302.0651 6303.065
b 91 316.0807 317.0817
c 81 330.0964 331.0964
44

Compound
%yield Calc. M. mass
Found M.mass (HR-MS)[M+1]+
a 77 172.0596 173.0591
b 72 186.08257 187.08266
c 83 200.09094 201.09082
45

Compound
%yield Calc. M. mass
Found M.mass (HR-MS)[M+1]+
a 89 278.08152 279.08147
b 92 292.10444 293.10426
c 83 306.12064 307.12012
46

47

48

Thank you
49


