Subway Operations and Operations Planning Collaborations for Subway Service Improvements at NYC Transit Peter G. Cafiero Chief Division of Operations Planning John G. Gaul Vice President & Chief Officer, Service Delivery Department of Subways New York City Transit
Transcript
Subway Operations and Operations Planning
Collaborations for Subway Service Improvements at NYC Transit
Peter G. CafieroChief
Division of Operations Planning
John G. GaulVice President & Chief Officer, Service Delivery
• First major analysis and changes to schedules since 1996
• Numbered line schedule changes completed based on full data from
automated data systems
– Changes in running time vary by time of day due to differing ridership, congestion
and maintenance activity
– Changes evened out service which had become uneven due to prior changes to
individual lines (flat junctions caused unintended impacts on other lines)
– Initial results are positive, showing improved throughput, on time performance,
and wait assessment
• Lettered line changes in progress, based on data entered by dispatchers, as
well as data from programmable logic controllers (PLCs) and a modest
number of traditional manual observations
6
The number/letter line breakdown is a general rule, with a few exceptions (e.g., L trains have centralized data).
Special Operating
Plans
7
New York City TransitBarclays Center special event plans
8
• Prior to the center opening, Operations Planning and Operations
jointly developed plans for additional service after large events, and
revised plans based on experience
New York City Transit
Hurricane planning has evolved and
improved
9
• Operations Planning and
Operations jointly develops
plans for:
– Evacuation
– Closure & protection of system
– Restoration and reopening
• Operations Planning input used
to prioritize during the storm
– Operations Planning reports
and data available to
Operations staff
– Operations Planning
representative providing live
support at the Incident
Command Center
NYC
Hurricane Sandy Service Timeline
-6
-8
-20
-18
-18
-42
-30
-42
+6
0
Hurricane Landfall
NYCT Coastal Storm Service Plan begins
NYCT Subway Service begins to curtail
All NYCT service suspended
Operating personnel in safe locations
NYCT Bus Service begins to curtail
Mayoral evacuation order issued
Evacuation Centers prepare for opening
Timepoints not to scale
Evacuation!
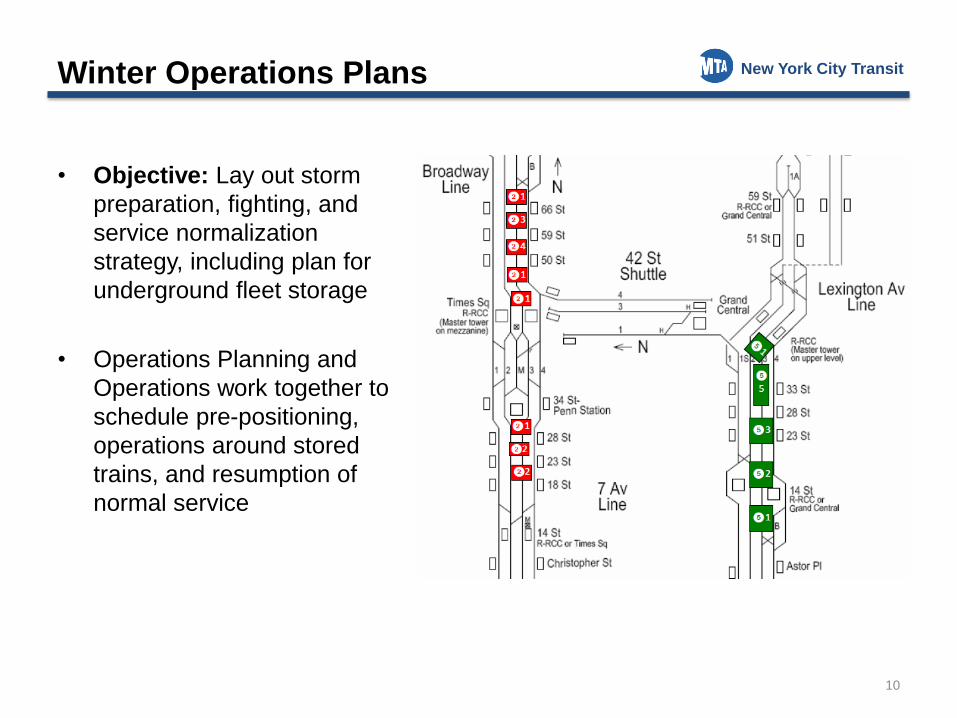
New York City TransitWinter Operations Plans
10
• Objective: Lay out storm
preparation, fighting, and
service normalization
strategy, including plan for
underground fleet storage
• Operations Planning and
Operations work together to
schedule pre-positioning,
operations around stored
trains, and resumption of
normal service
System Rebuilding
11
New York City TransitFASTRACK
• Objective: Maximize
effectiveness for maintenance
activities by removing service
from all tracks
Improved safety
Lower cost
Simpler closure definitions
(e.g., 10PM – 5AM each day,
all tracks)
Minimized substitute bus
service
Maximized use of alternative
subway options
12
Example map from FASTRACK poster
Service Regulation &
Delay Management
13
New York City TransitBack to basics
Precise dispatching
Continuous headway regulation
Effective delay management
Dwell time control
14
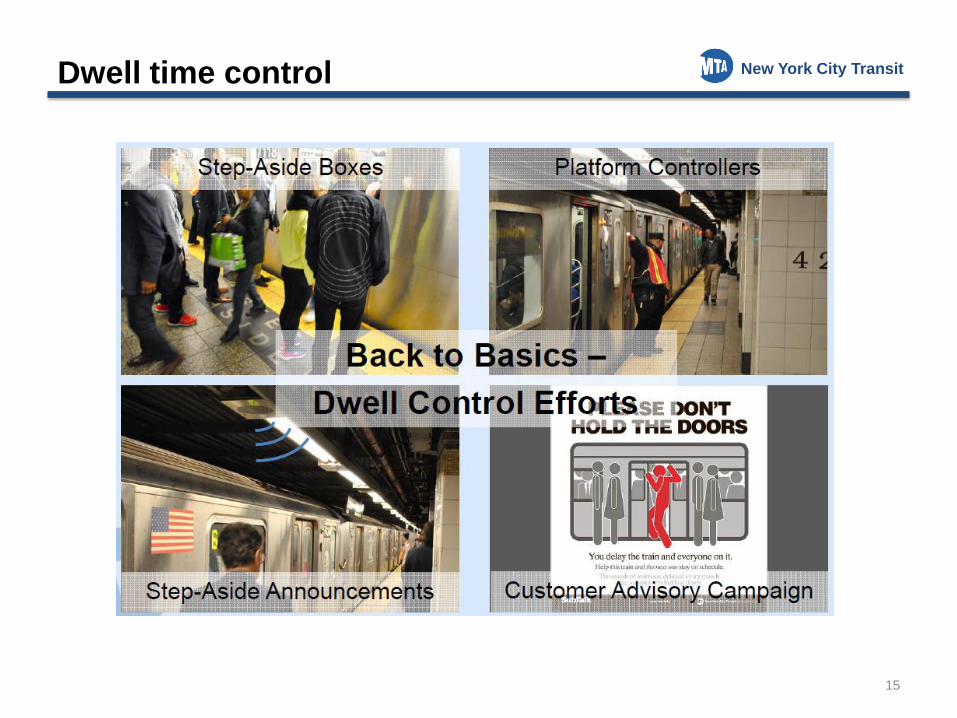
New York City TransitDwell time control
15
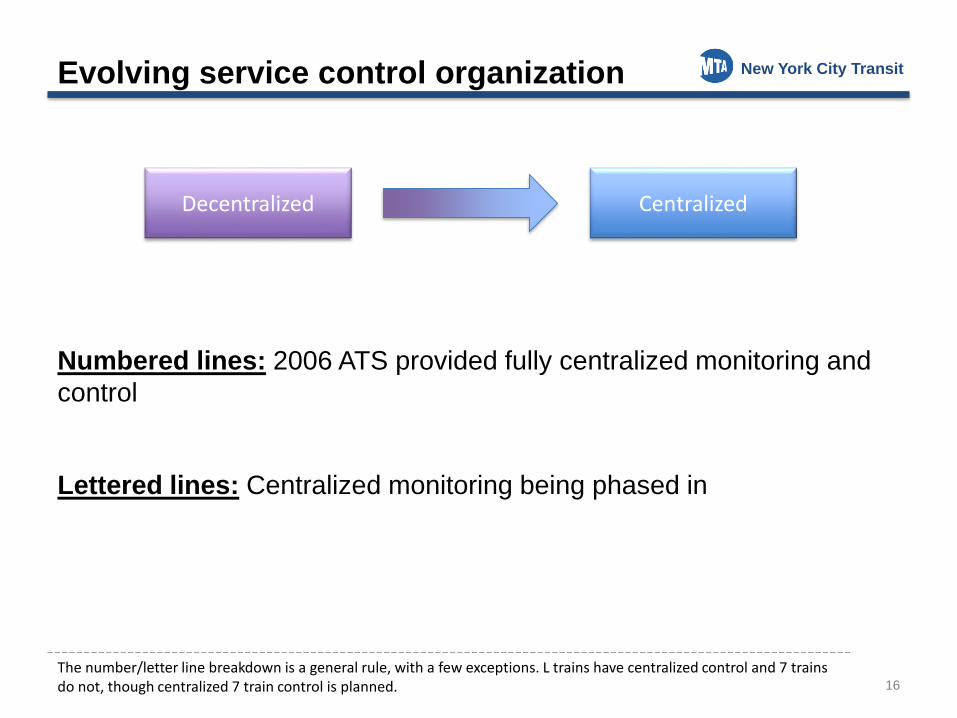
New York City TransitEvolving service control organization
Numbered lines: 2006 ATS provided fully centralized monitoring and
control
Lettered lines: Centralized monitoring being phased in
16
The number/letter line breakdown is a general rule, with a few exceptions. L trains have centralized control and 7 trains do not, though centralized 7 train control is planned.
Decentralized Centralized
New York City TransitEvolving service control organization
Operations Planning/Operations collaborative efforts on:
Organizational change management
Streamlining processes and procedures
Optimizing use of electronic performance data
17
Operations Analysis /
Capacity Utilization
18
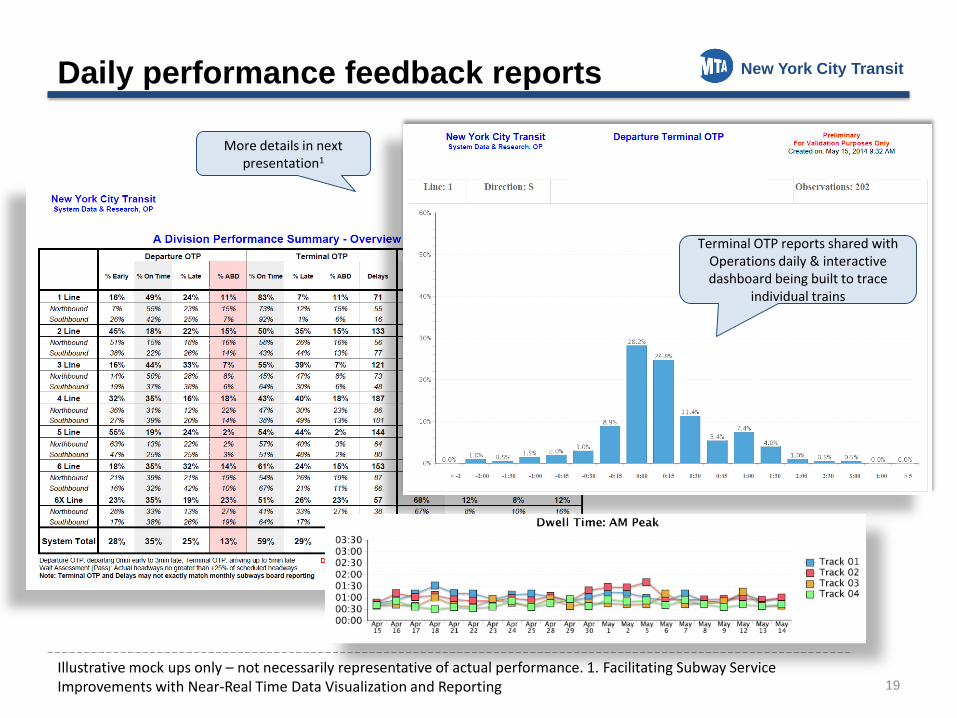
New York City TransitDaily performance feedback reports
19
Illustrative mock ups only – not necessarily representative of actual performance. 1. Facilitating Subway Service Improvements with Near-Real Time Data Visualization and Reporting
Terminal OTP reports shared with Operations daily & interactive dashboard being built to trace
individual trains
More details in next presentation1
New York City Transit
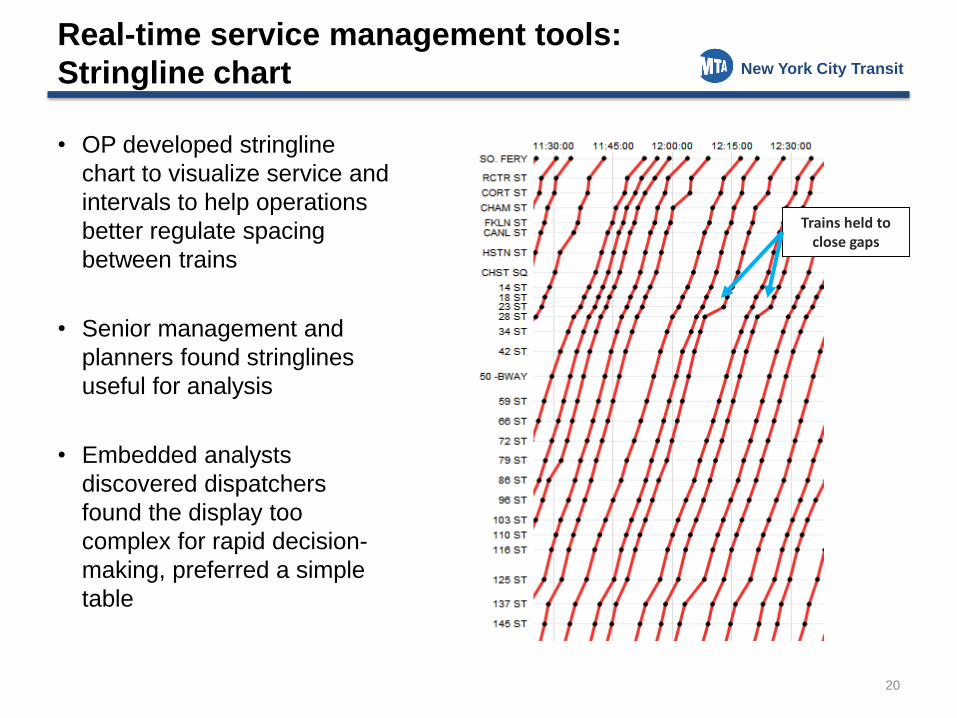
Real-time service management tools:
Stringline chart
• OP developed stringline
chart to visualize service and
intervals to help operations
better regulate spacing
between trains
• Senior management and
planners found stringlines
useful for analysis
• Embedded analysts
discovered dispatchers
found the display too
complex for rapid decision-
making, preferred a simple
table
20
Trains held to close gaps
New York City Transit
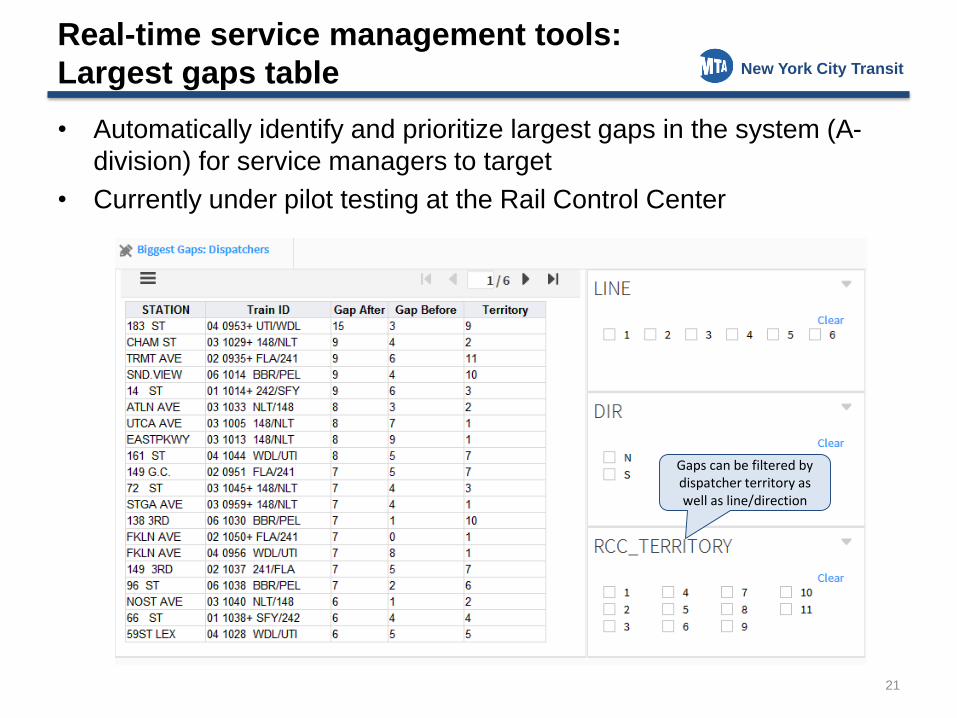
Real-time service management tools:
Largest gaps table
• Automatically identify and prioritize largest gaps in the system (A-
division) for service managers to target
• Currently under pilot testing at the Rail Control Center
21
Gaps can be filtered by dispatcher territory as well as line/direction
New York City Transit
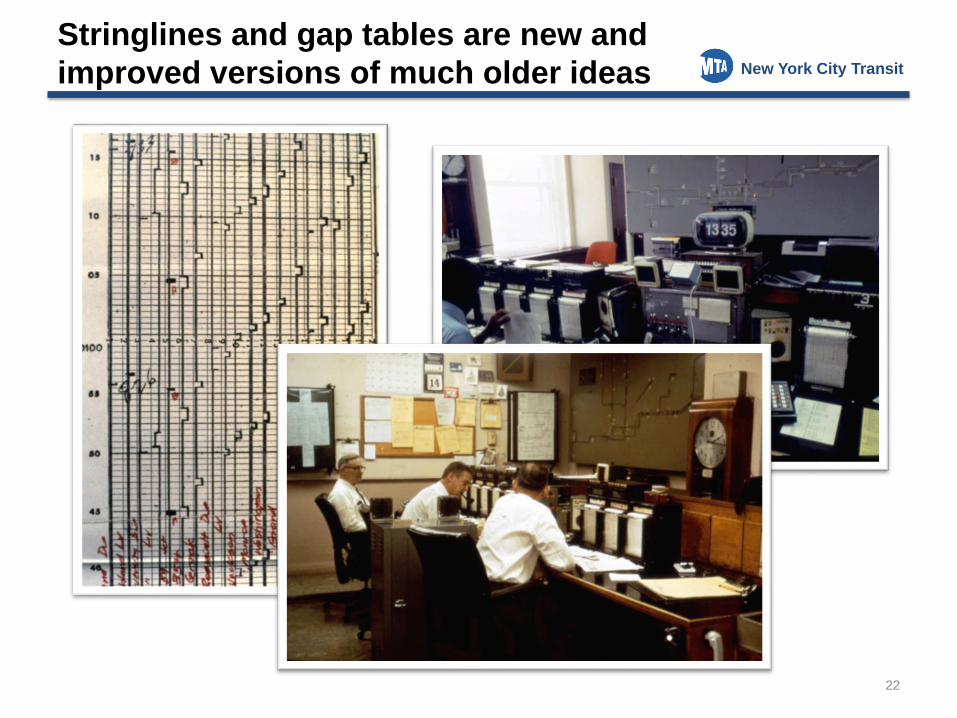
Stringlines and gap tables are new and
improved versions of much older ideas
22
New York City TransitConclusions
Subway service is facing new challenges and NYCT is trying several
new initiatives to combat declining performance
Operations Planning & Operations are working collaboratively to
maximize resources and eliminate barriers
Collaborative projects
Regular OP/Service Delivery meetings & calls
Extensive coordination and collaboration between groups within
NYCT undertaken in a short time frame
Significant steps taken to take advantage of the data by using it to