Page 1
New York State Senate
Economic and Revenue Forecast SFY 2010-11 Senate Finance Committee Senator Carl Kruger, Chair Senator Liz Krueger, Vice-Chair Joseph F. Pennisi, Secretary to the Finance Committee Prepared by Senate Finance Committee, Office of Fiscal Studies Michael J. Laccetti, Director of Fiscal Studies
Mary C. Arzoumanian, Deputy Director of Fiscal Studies
Gopa Barua, Forecaster
James Hugger, Forecaster
Lei Liao, Forecaster
Page 2
2
TABLE OF CONTENTS
Executive Summary ........................................................................... 3
Page
Economic Outlook ................................................................................... 10
Housing Market ………………………………………………………………17
Financial Markets .................................................................................... 22
Labor Market and Income ....................................................................... 26
Consumption and Investment.................................................................. 33
Government Policies and Spending ........................................................ 43
The Global Economy ............................................................................... 48
Risks to the Forecast ............................................................................... 53
Revenue Outlook ...................................................................................... 55
Personal Income Tax .............................................................................. 55
User Taxes and Fees .............................................................................. 60
Business Taxes ....................................................................................... 72
Other Taxes ............................................................................................. 78
Appendix .................................................................................................... 81
Page 3
3
EXECUTIVE SUMMARY
The Senate Finance Committee reviewed and analyzed the economic and revenue
projections contained within the Executive Budget for SFY 2010-11. Based upon Global
Insight’s February economic forecast, the Senate Finance Committee projects $403 million in
General Fund revenues (inclusive of miscellaneous receipts, lottery receipts, and transfers) below
the Executive Budget forecast for SFY 2010-11. This decrease is in addition to the estimate for
the remainder of SFY 2009-10, which is $340 million less than the Executive estimate.
Therefore, the two year General Fund receipts forecast is $743 million below the Executive’s
projections.
New York has a variety of tax revenues that are deposited in the General Fund as well in
special revenue funds, capital projects funds, and debt service funds which are to be utilized for
specific spending purposes. In addition, certain tax revenues (e.g. petroleum business taxes and
real estate transfer taxes) are exclusively deposited in these other funds. By aggregating all the
revenues collected by the State in each fund, the Senate Finance Committee projects All Funds
tax revenues to be $294 million below the Executive for SFY 2010-11. Similar to the
projections for General Fund revenues, the projections for lower revenues in SFY 2010-11 is
enhanced by the estimate of tax revenues for the remainder of the 2009-10 fiscal year, $208
million below the Executive estimate. This results in a two year All Funds tax revenue forecast
that is $502 million below the Executive.
The economy at the national level is measured by the Gross Domestic Product (GDP),
which is essentially a combination of goods and services produced and the consumption of these
goods and services. The economy is then divided into three sectors – government, business, and
the consumer – which are affected by many different variables whose impacts change from year
to year. In order for the economy to grow, these three sectors must be working and growing
together. As the recession lingered into 2009, the national economy continued to contract. Real
GDP declined by 2.4 percent in 2009. While the National Bureau of Economic Research
Page 4
4
(NBER) has not yet declared the turning point for the economy, most economists believe the
downturn reached a trough in June 2009. With the effects of the Federal stimulus packages
making their way through the economy, economic growth returned in the second half of the year.
Real GDP increased by 2.2 percent and 5.7 percent in the third and fourth quarters, respectively.
With the recovery slowly taking hold in 2010, real GDP is projected to continue to grow at a rate
of 3.0 percent.
In New York, the economy is measured by the Gross State Product (GSP). This
economy, unlike the national one, has two major sectors – consumer and business – with
government taking a more supporting role. New York’s economy also declined in 2009 but, at a
slower rate than the national economy. The state of the New York economy, as shown by the
change in real GSP, declined by 1.7 percent in 2009. The New York economy is projected to
recover similar to the national economy. Real GSP is projected to grow by 2.7 percent in 2010.
The housing market decline and the resulting financial market crisis had a significant
impact on employment and income in 2009. Employment at the national and state level declined
by 4.3 percent and 2.1 percent, respectively. The decline in employment, in turn, constrained
wages. Wages at the national and state level declined by 3.3 percent and 5.1 percent,
respectively. The larger decline in wage income at the state level represents the decline in Wall
Street bonus income as a result of more bonuses being paid in stock options rather than cash.
With the slow recovery, employment is still projected to decline. Both national and state
employment is projected to decline by 0.7 percent in 2010. However, wage growth is projected
to return, increasing by 3.1 percent and 4.2 percent at the national and state level, respectively.
As outlined in the following tables, total All Funds tax collections are estimated at $58.57
billion in SFY 2009-10. This estimate is $208 million below the Executive Budget forecast. For
SFY 2010-11, All Funds tax revenues are expected to increase by $4.9 billion to $63.5 billion or
$294 million below the Executive’s estimates.
Page 5
5
Estimates for the remainder of the current fiscal year show the continued weakness in the
economy over the course of 2009 and the impact of the political pressure on Wall Street bonuses,
which has resulted in less cash payouts than in previous years. Global Insight’s forecast of the
overall national economy in 2010 is slightly weaker than the economic forecast presented by the
Executive. Although the forecast for the State’s personal income is stronger than that of the
Executive, the employment forecast is weaker. This results in a revenue projection that is lower
than the Executive.
Page 6
6
SFY 2009-10 General Fund Collections (Millions of Dollars)
Senate
Finance Executive
Budget
Variance
Personal Income Tax 22,307 22,364 (57) Withholding 28,694 28,748 (54) Estimated Payments 9,020 9,117 (97) Final Returns 1,851 1,836 15 Other Payments 1,252 1,266 (14) Gross Collections 40,817 40,967 (150) Refunds (6,515) (6,587) 72 STAR (3,420) (3,420) 0 RBTF (8,575) (8,596) 21
User Taxes and Fees 8,088 8,229 (141) Sales and Use 7,360 7,504 (144) Motor Vehicle 13 13 0 Cigarette/Tobacco 441 437 4 Alcoholic Beverage 222 223 (1) Alcoholic Beverage License 52 52 0
Business Taxes 5,669 5,688 (19) Corporate Franchise 2,488 2,500 (12) Corporate Utilities 735 739 (4) Insurance 1,273 1,279 (6) Bank 1,173 1,170 3
Other Taxes 912 953 (41) Estate and Gift 891 932 (41) Pari-mutuel 20 20 0 Other 1 1 0
Total General Fund Taxes 36,976 37,234 (258)
Miscellaneous Receipts 3,496 3,508 (12) Federal Grants 68 68 0 Lottery 2,831 2,831 0 Transfers 11,832 11,902 (70)
Total General Fund Receipts 55,203 55,543 (340)
Page 7
7
SFY 2009-10 All Funds Collections (Millions of Dollars)
Senate
Finance Executive
Budget
Variance
Personal Income Tax 34,302 34,380 (78) Withholding 28,694 28,748 (54) Estimated Payments 9,020 9,117 (97) Final Returns 1,851 1,836 15 Other Payments 1,252 1,266 (14) Gross Collections 40,817 40,967 (150) Refunds (6,515) (6,587) 72
User Taxes and Fees 13,834 13,994 (160) Sales and Use Auto Rental
10,480 84
10,668 79
(188) 5
Motor Vehicle 973 982 (9) Cigarette/Tobacco Motor Fuel
1,360 508
1335 501
25 7
Alcoholic Beverage Tax/Fees 274 275 (1) Highway Use Taxicab Surcharge
141 14
140 14
1 0
Business Taxes 7,833 7,823 10 Corporate Franchise 2,947 2,961 (14) Corporate Utilities 964 968 (4) Insurance 1,426 1,412 14 Bank Petroleum Business
1,367 1,129
1,363 1,119
4 10
Other Taxes 1,384 1,408 (24) Estate and Gift Real Estate Transfer
891 472
932 455
(41) 17
Pari-mutuel 20 20 0 Other MTA Payroll
1
1,217
1
1,173
0
44
Total All Funds Receipts 58,570 58,778 (208)
Page 8
8
SFY 2010-11 General Fund Collections (Millions of Dollars)
Senate
Finance Executive
Budget
Variance
Personal Income Tax 24,644 24,874 (230) Withholding 30,486 30,715 (229) Estimated Payments 11,383 11,294 89 Final Returns 1,956 2,193 (237) Other Payments 1,282 1,316 (34) Gross Collections 45,107 45,518 (411) Refunds (7,971) (8,075) 104 STAR (3,208) (3,208) 0 RBTF (9,284) (9,361) 77
User Taxes and Fees 8,506 8,547 (41) Sales and Use 7,760 7,784 (24) Motor Vehicle 43 43 0 Cigarette/Tobacco 438 438 0 Alcoholic Beverage 217 230 (13) Alcoholic Beverage License 48 52 (4)
Business Taxes 5,750 5,710 40 Corporate Franchise 2,861 2,836 25 Corporate Utilities 714 705 9 Insurance 1,274 1,268 6 Bank 901 901 0
Other Taxes 890 933 (43) Estate and Gift 867 910 (43) Pari-mutuel 20 20 0 Other 3 3 0
Total General Fund Taxes 39,790 40,064 (274)
Miscellaneous Receipts 2,905 2,915 (10) Federal Grants 60 60 0 Lottery 2,790 2,838 (48) Transfers 11,691 11,762 (71)
Total General Fund Receipts 57,236 57,639 (403)
Page 9
9
SFY 2010-11 All Funds Collections (Millions of Dollars)
Senate
Finance Executive
Budget
Variance
Personal Income Tax 37,136 37,443 (307) Withholding 30,486 30,715 (229) Estimated Payments 11,383 11,294 89 Final Returns 1,956 2,193 (237) Other Payments 1,282 1,316 (34) Gross Collections 45,107 45,518 (411) Refunds (7,971) (8,075) 104
User Taxes and Fees 15,577 15,563 14 Sales and Use Auto Rental
11,050 105
11,064 95
(14) 10
Motor Vehicle 1,169 1,175 (6) Cigarette/Tobacco Motor Fuel
1,527 516
1,526 502
1 14
Alcoholic Beverage Tax/Fees Syrup
515 450
532 450
(17) 0
Highway Use Taxicab Surcharge
160 85
134 85
26 0
Business Taxes 7,796 7,760 36 Corporate Franchise 3,304 3,277 27 Corporate Utilities 934 922 12 Insurance 1,407 1,400 7 Bank Petroleum Business
1,055 1,096
1,076 1,085
(21) 11
Other Taxes 1,421 1,425 (4) Estate and Gift Real Estate Transfer
867 531
910 492
(43) 39
Pari-mutuel 20 20 0 Other MTA Payroll
3
1,544
3
1,577
0
(33)
Total All Funds Receipts 63,474 63,768 (294)
Page 10
10
ECONOMIC OUTLOOK
The national economy as a whole is measured by the Gross Domestic Product (GDP); on
the state level, it is measured by Gross State Product (GSP). GDP and GSP are essentially a
combination of all the goods and services produced and consumed by the three sectors of the
economy: the consumer, business, and government. These three sectors then utilize various
inputs from the economy, such as interest rates and inflation, to conform to their needs. How
these sectors interact with each other and react to the ever changing inputs of the economy form
the basis by which the economy either expands or contracts. For example, the amount of income
affects how much the consumer will spend. Increases in consumer spending translate into
corporate profits for the business sector who then utilize such profits to make capital investments
and hire new workers. Increases in both these sectors translate into increased tax revenues for
the government sector; allowing for budgetary spending growth and/or tax relief.
As shown in Figure 1, the consumer is the major contributor to the economy, accounting
for over two thirds of GDP. Due to the recession, business’ share of GDP has declined from 15
percent in 2007 to 11 percent in 2009. Although business accounts for a small share of GDP, it
is still an important contributor to the economy as it drives employment and wages which, in
turn, spur consumer spending. Government, through its own spending habits, also plays a
significant part in the economy. While the contribution to GDP by business has declined during
the current recession, the Federal government’s share of GDP has increased from 6 percent in
2007 to 8 percent in 2009. This is primarily due to the federal stimulus programs enacted to spur
economic growth. Surprisingly, even though state and local government spending has been
constrained due to declining state tax revenues, it still contributes more to GDP than Federal
spending.
Page 11
11
Figure 1
In 2008, the collapse of a global housing market bubble caused the value of those
securities tied to the housing market to fall significantly. As a result, the global financial markets
were on the verge of collapse. Credit markets seized up, restraining financings at all levels.
Without access to credit, domestic spending contracted and the housing market declined even
more. By the end of 2008, the Troubled Asset Relief Program (TARP) had been implemented in
order to strengthen the financial markets.
At the beginning of 2009, the national economy was still deep in the recession. Job
losses were mounting as businesses continued to cut costs as a result of decreased consumer
demand. In order to jump start the economy, the American Recovery and Reinvestment Act
(ARRA) was enacted.
The national economy, as measured by real GDP, continued to contract in the first half of
2009. Real GDP declined at the annualized rate of 6.4 percent and 0.7 percent in the first and
second quarters, respectively. As the federal stimulus measures worked their way through the
economy, economic growth returned; real GDP growing by 2.2 percent and 5.7 percent in the
Consumer69%
Business11%
Federal8%
State & Local12%
Composition of Gross Domestic Product
Page 12
12
third and fourth quarters, respectively. However, for all of 2009, real GDP declined by 2.4
percent.
In 2010, the economic recovery that began in the second half of 2009 is projected to
continue, albeit at a much slower pace than the fourth quarter of 2009. With the bottoming out
of the housing market and job losses in the first half of 2010, real GDP is projected to increase
by 3.0 percent in 2010.
Figure 2
Source: IHS Global Insight and NYS Senate Finance Committee
As mentioned above, the New York economy is measured by the Gross State Product
(GSP), which is composed of two sectors: business and consumer. The economy in New York
had also been adversely affected by the extreme depth of the current recession. Similar to the
national economy, the New York economy declined in 2009; real GSP decreasing by 1.7 percent.
However, this decline was not as severe as the economic decline at the national level.
As shown in Figure 2, the New York economy fared better than the national economy as
opposed to the previous recession of 2001. Similar to the previous economic recovery, the New
York economy is projected to recover at a slower pace than the national economy. Whereas the
Page 13
13
end of the national recession is believed to be June of 2009. The end of the recession in New
York is not projected to occur until the first quarter of 2010. Due to this lag in economic growth,
real GSP is projected to grow by 2.7 percent in 2010, lower than the projected growth of 3.0
percent at the national level.
Page 14
14
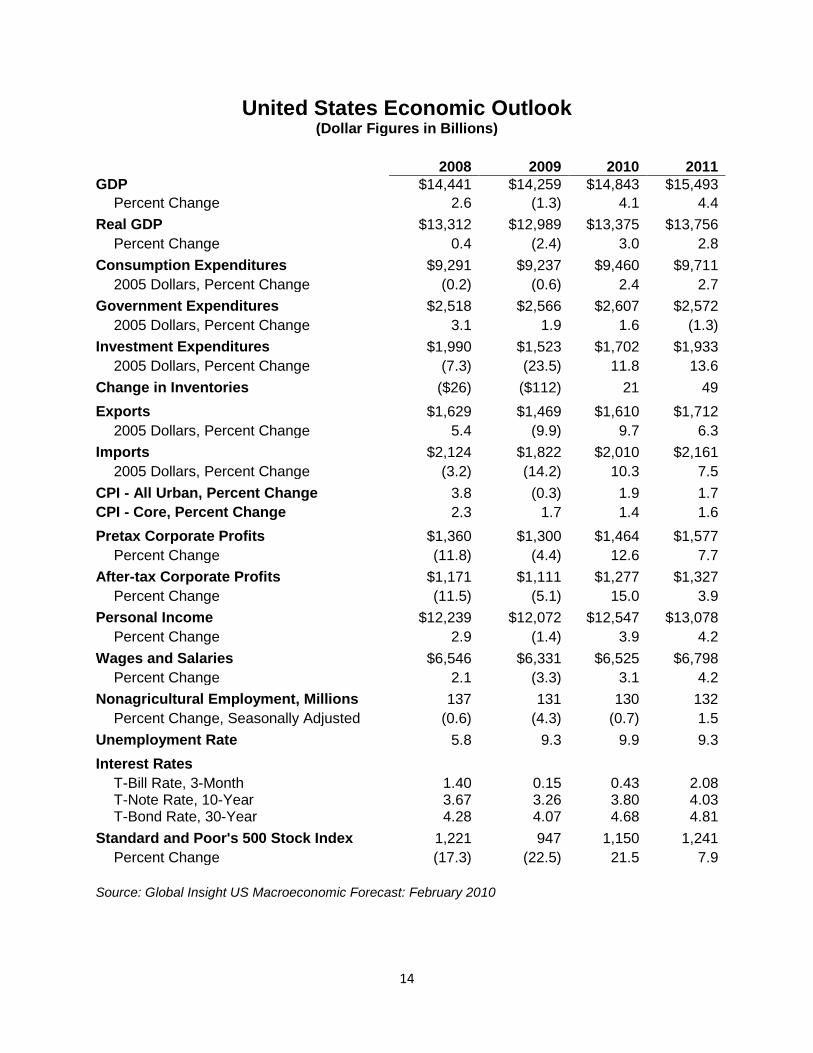
United States Economic Outlook (Dollar Figures in Billions)
2008 2009 2010 2011 GDP $14,441 $14,259 $14,843 $15,493
Percent Change 2.6 (1.3) 4.1 4.4
Real GDP $13,312 $12,989 $13,375 $13,756 Percent Change 0.4 (2.4) 3.0 2.8
Consumption Expenditures $9,291 $9,237 $9,460 $9,711 2005 Dollars, Percent Change (0.2) (0.6) 2.4 2.7
Government Expenditures $2,518 $2,566 $2,607 $2,572 2005 Dollars, Percent Change 3.1 1.9 1.6 (1.3)
Investment Expenditures $1,990 $1,523 $1,702 $1,933 2005 Dollars, Percent Change (7.3) (23.5) 11.8 13.6
Change in Inventories ($26) ($112) 21 49
Exports $1,629 $1,469 $1,610 $1,712 2005 Dollars, Percent Change 5.4 (9.9) 9.7 6.3
Imports $2,124 $1,822 $2,010 $2,161 2005 Dollars, Percent Change (3.2) (14.2) 10.3 7.5
CPI - All Urban, Percent Change 3.8 (0.3) 1.9 1.7 CPI - Core, Percent Change 2.3 1.7 1.4 1.6
Pretax Corporate Profits $1,360 $1,300 $1,464 $1,577 Percent Change (11.8) (4.4) 12.6 7.7
After-tax Corporate Profits $1,171 $1,111 $1,277 $1,327 Percent Change (11.5) (5.1) 15.0 3.9
Personal Income $12,239 $12,072 $12,547 $13,078 Percent Change 2.9 (1.4) 3.9 4.2
Wages and Salaries $6,546 $6,331 $6,525 $6,798 Percent Change 2.1 (3.3) 3.1 4.2
Nonagricultural Employment, Millions 137 131 130 132 Percent Change, Seasonally Adjusted (0.6) (4.3) (0.7) 1.5
Unemployment Rate 5.8 9.3 9.9 9.3
Interest Rates T-Bill Rate, 3-Month 1.40 0.15 0.43 2.08 T-Note Rate, 10-Year 3.67 3.26 3.80 4.03 T-Bond Rate, 30-Year 4.28 4.07 4.68 4.81
Standard and Poor's 500 Stock Index 1,221 947 1,150 1,241 Percent Change (17.3) (22.5) 21.5 7.9
Source: Global Insight US Macroeconomic Forecast: February 2010
Page 15
15
New York State Economic Outlook Calendar Year
(Dollar Figures in Billions)
2008 2009 2010 2011
Gross State Product $1,144 $1,136 $1,181 $1,230
Percent Change 3.5 (0.6) 4.0 4.1 Real Gross State Product $965 $948 $974 $999
Percent Change 1.6 (1.8) 2.7 2.6 Nonagricultural Employment, Thousands 8,799 8,612 8,553 8,679
Percent Change 0.7 (2.1) (0.7) 1.5 Unemployment Rate 5.4 8.3 8.9 8.6 Personal Income $950 $923 $964 $1,011
Percent Change 2.7 (2.8) 4.4 4.9 Wages and Salaries $535 $507 $529 $553
Percent Change 2.1 (5.2) 4.3 4.5 Retail Sales $240 $225 $239 $256
Percent Change (1.2) (6.3) 6.2 8.4 Housing Starts, Thousands 49 13 20 28
Percent Change 10.5 (73.5) 53.8 40.0
Source: Global Insight New York State Economic Forecast, February 2010
Page 16
16
New York State Economic Outlook State Fiscal Year
(Dollar Figures in Billions) 2008-09 2009-10 2010-11 2011-12
Gross State Product $1,143 $1,146 $1,192 $1,245
Percent Change 2.0 0.2 4.1 4.4 Real Gross State Product $959 $953 $980 $1,015
Percent Change 0.2 (0.6) 2.8 3.6 Nonagricultural Employment, Thousands
8,766 8,579 8,566 8,728
Percent Change 0.8 (2.1) (0.2) 1.9 Unemployment Rate 5.4 6.1 8.7 8.4 Personal Income $937 $935 $976 $1,023
Percent Change 0.3 (0.2) 4.4 4.8 Wages and Salaries $522 $516 $535 $560
Percent Change (0.8) (1.2) 3.8 4.7 Retail Sales $233 $229 $243 $260
Percent Change (4.7) (1.9) 6.2 7.0 Housing Starts, Thousands 42 14 23 29
Percent Change (5.2) (66.3) 65.0 26.1 Source: Global Insight New York State Economic Forecast, February 2010
Page 17
17
HOUSING MARKET
As the housing market was one of the primary drivers of the economic expansion, it was
the primary driver of the economic downturn as well. As shown in Figure 3, sales of existing
homes starting declining sharply in the first quarter of 2007 as the housing market bubble burst,
reaching its trough in the first quarter of 2009.
Existing home sales in the second and third quarters of 2009 were buoyed by the
enactment of the first time homebuyers tax credit enacted at the federal level. This tax credit
allowed taxpayers a personal income tax credit for the costs of purchasing their first homes.
This credit was capped at $8,000. However, this tax credit expired in December 2009. As a
result, existing homes sales declined in the fourth quarter of 2009. Existing homes sales are
projected to rebound in the first quarter of 2010, artificially inflated by the extension of the tax
credit until April 30, 2010. Real growth in existing home sales is not projected until the second
half of 2010.
Source: IHS Global Insight
Figure 3 Homes Sales
Page 18
18
The bursting of the housing market bubble also negatively impacted the sales of new
homes. Similar to existing home sales, the sales of new homes bottomed out in 2009. However,
the impact of the first time homebuyer’s tax credit was not as significant. As a result, new home
sales are projected to have a U-shaped recovery rather than the erratic recovery of existing home
sales.
With the projected recovery in new home sales, the production levels and backlog of
unsold new homes are declining quickly. As a result, housing starts are projected to recover in
2010. As shown in Figure 4, the regions of the country that benefitted greatly from the housing
market bubble were also the ones most negatively impacted when the bubble burst.
Figure 4
Source: IHS Global Insight
The housing market in New York was not exempt from the bursting of the real estate
bubble. As shown in Figure 5, sales of existing, single family homes started to decline in 2006,
with the most severe decline in 2008. Housing starts fell sharply in 2009 as the housing crisis
deepened nationwide. Similar to projections of a slow recovery in the housing market nationwide
Page 19
19
in 2010, the housing market in New York will be slow to recover as well. Growth in existing
home sales is not projected to occur until early 2011. However, housing starts in New York have
currently reached its trough; growth is projected to occur throughout 2010.
Source: IHS Global Insight
As the demand for housing fell nationally, illustrated by the decline in existing home
sales and housing starts, so did home prices. The tight credit market as a result of the collapse of
the subprime mortgage market and the recession served to dampen the number of potential
homebuyers in the market. Figure 6 shows the impact of the recession on both new and existing
home prices nationwide. As the economy recovers and the housing market recovers, home
prices are projected to increase. However, as with the housing market overall, this recovery is
projected to be slow.
-80.0%
-60.0%
-40.0%
-20.0%
0.0%
20.0%
40.0%
60.0%
-20.0%
-15.0%
-10.0%
-5.0%
0.0%
5.0%
10.0%
15.0%
2000 2001 2002 2003 2004 2005 2006 2007 2008 2009 2010 2011
Gro
wth
in H
ousi
ng S
tart
s
Gro
wth
in H
ome
Sale
s
Figure 5New York Housing Market
Home Sales, Existing Housing Starts
Page 20
20
Source: IHS Global Insight
Of significance to the recovery in the housing market is the number of homes being
foreclosed and the number of mortgage delinquencies. One of the major factors leading to the
decline of the housing market was the large number of subprime mortgages being issued.
Homeowners were being issued mortgages for amounts and structures that were beyond their
means. When the prospectus of continued appreciation in the value of homes disappeared with
the housing market bubble, the ability to repay these mortgages became increasingly difficult.
As a result, the number of foreclosures and mortgage delinquencies significantly increased. As
shown in Figure 7, the mortgage delinquency rate at the end of 2009 was over nine percent of
total mortgages serviced; over double the delinquency rate in 2005, when delinquencies were at
their lowest point. In turn, the percentage of mortgages in foreclosure has increased by four
times those in foreclosure in 2005, the highest rate since 1978.
As the economy is projected to recover, the delinquency and foreclosure rates are
projected to begin to decline. According to, RealtyTrac Inc., more than 315,000 households
received a foreclosure-related notice in January 2010. This number is down approximately ten
-15.0%
-10.0%
-5.0%
0.0%
5.0%
10.0%
15.0%
2001 2002 2003 2004 2005 2006 2007 2008 2009 2010 2011
Perc
enta
ge C
hang
e
Figure 6U.S. Home Prices
New Homes Existing Homes
Page 21
21
percent from December. Banks repossessed more than 87,000 homes in January, down five
percent from December.
Source: U.S. Census Bureau and IHS Global Insight
Unlike prices at the national level, new home prices in New York were still exhibiting
growth well into 2008. New home prices did not show significant declines until the third quarter
of 2008, as shown in Figure 8. Buoyed by the first time homebuyer’s tax credit enacted as part
of the ARRA, new home prices in New York grew by over seven percent. However, this growth
was short lived, with new home prices remaining flat in the second half of 2009. This trend is
projected to continue into 2010; little growth in new home prices in 2010.
Although new home prices fared well over the course of the recession, existing home
prices did not. As shown, existing home prices started to decline in the first quarter of 2008.
Similar to new home prices, the federal tax credit helped to increase prices in the second half of
2009 with little growth in 2010.
0.0
2.0
4.0
6.0
8.0
10.0
2002 2003 2004 2005 20062007
20082009
Perc
enta
ge o
f Mor
tgag
es
Figure 7US Mortgage Delinquencies
Loans in Foreclosure Delinquency Rate
Page 22
22
Source: IHS Global Insight
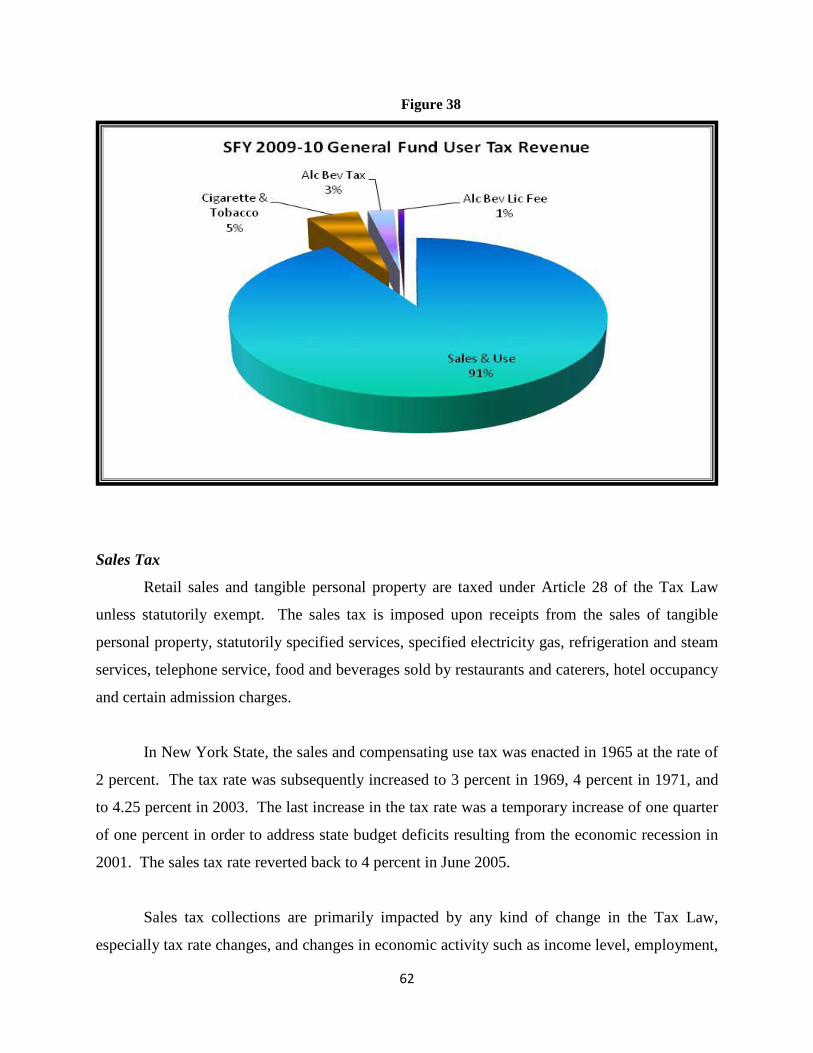
FINANCIAL MARKETS
By the end of 2008, Wall Street was completely transformed. Of the five large investment
banking institutions that existed at the start of 2008, two declared bankruptcy, one was bought by
a major bank, and the remaining two reorganized as commercial banks. As a result of the
collapse of the subprime mortgage market and the Lehman Brothers bankruptcy, the stock
market tumbled in the third and fourth quarters of 2008. In 2009, the national economy was still
in a recession, but Wall Street recovered much faster than anyone envisioned. As shown in
Figure 9, the stock market, as measured by the S&P 500, had double digit growth in the second
and third quarters of 2009. Although quarterly growth in the stock market was significant in
2009, the S&P 500 Index was still 405 points lower than its peak in the second quarter of 2007
and approximately 200 points down from its level at the end of 2008. As a result, the stock
market declined by 22.5 percent on an annualized basis in 2009.
-3.0%
-2.0%
-1.0%
0.0%
1.0%
2.0%
3.0%
4.0%
2005 Q1 2006 Q1 2007 Q1 2008 Q1 2009 Q1 2010 Q1 2011 Q1
-15.0%
-10.0%
-5.0%
0.0%
5.0%
10.0%
Exis
ting
Hom
es
New
Hom
es
Figure 8Change in New York Home Prices
New Homes Existing Homes
Page 23
23
The stock market is projected to continue to exhibit growth in 2010, not the quarterly
significant quarterly growth experienced in 2009. Similar to the annual change in 2009, the
value of the stock market for 2010 is projected to be 100 points higher than its value at the end of
2009. This translates into annual stock market growth of 21.5 percent in 2010.
With the growth in the stock market, Wall Street profitability was estimated to exceed
2006 levels. According to a report by the New York State Comptroller, Wall Street net revenue
totaled $91.4 billion in the first half of 2009, compared to $35 billion in the first half of 2008.
The four largest investment firms headquartered in New York City earned a record $22.6 billion
in the first nine months of 2009, compared to a loss of $40.3 billion in 2008. Figure 10 shows
the Wall Street profits since 1995.
-30.0%
-25.0%
-20.0%
-15.0%
-10.0%
-5.0%
0.0%
5.0%
10.0%
15.0%
2005 Q1 2006 Q1 2007 Q1 2008 Q1 2009 Q1 2010 Q1 2011 Q1
Qua
rter
ly C
hang
eFigure 9
S&P 500 Index
Page 24
24
Source: Office of Deputy State Comptroller for New York City
Buoyed by the profitability of Wall Street firms and the rebound in the stock market
performance, corporate profits for all of the nation’s business declined by 4.4 percent through the
end of 2009. This is a significant improvement over the projected declines of over 7.0 percent
from one year ago. The extreme cost cutting measures along with government stimulus
contributed to a strong rebound in corporate profits in the second half of 2009. In the third
quarter, corporate profits grew at an annualized rate of 50 percent, the largest quarterly growth
since the first quarter of 2004. The outlook for 2010 has improved as well, as corporate profits
are projected to increase by 12.6 percent, surpassing 2005 levels as companies expand output
production to keep pace with a growing economy.
-60
-40
-20
0
20
40
60
1995
1996
1997
1998
1999
2000
2001
2002
2003
2004
2005
2006
2007
2008
2009
2010
2011
2012
2013
Billo
ns o
f dol
lars
Figure 10Wall Street Profits
$
Page 25
25
The financial crisis resulted in a record decline in finance and insurance sector bonuses in
the 2008-09 bonus season. As shown in Figure 12, Wall Street securities firms paid $18.4 billion
in year-end 2008 bonuses in December and January, down 44 percent from 2007. The payment
of bonuses by these firms has come under political fire due to the fact that the U.S. Treasury had
directed tens of billions of dollars to augment Wall Street capital.
Although Wall Street firms are reporting record bonuses in the 2009 bonus season, the
proportion of these bonuses being paid in cash is significantly less than in previous years. A
larger portion of these bonuses are being paid in stock options or restricted stock or being
incorporated in new compensation structures. These “new” structures of bonus payments are
primarily a result of the political backlash.
0.00
200.00
400.00
600.00
800.00
1,000.00
1,200.00
1,400.00
1,600.00
1,800.00
2001 2002 2003 2004 2005 2006 2007 2008 2009 2010
Billi
ons
of d
olla
rsFigure 11
U.S. Corporate Profits*
*Profits with Inventory Valuation and Capital Consumption Adjustments
(Forecast)(Est.)
Page 26
26
Source: Office of Deputy State Comptroller for New York City
LABOR MARKET AND INCOME
The labor market appears to be improving after a loss of approximately 8.4 million jobs
over the past two years. The impact of federal stimulus programs, global growth, and the end of
the largest inventory correction since the 1930s will enable growth to continue. A comparison of
the total number of jobs lost during the second half of 2009 to the number lost during the first
half shows the pace of job losses decelerated dramatically, falling 76 percent from the prior
period. In Figure 13, initial unemployment claims have shown a steady decline since April 2009.
Moreover, the decline in unemployment claims was broad based; all industries showing
improvements. Management, administrative support, and waste services jobs was the category
with the best showing due to the inclusion of the temporary job sector in this category. In
addition, the latest evidence suggests that employers are getting ready to start hiring again as
payroll declines over the last three months have averaged just 35,000.
0
5
10
15
20
25
30
35
40
1985
1986
1987
1988
1989
1990
1991
1992
1993
1994
1995
1996
1997
1998
1999
2000
2001
2002
2003
2004
2005
2006
2007
2008
Billi
ons
of D
olla
rsFigure 12
Wall Street Bonuses
Page 27
27
Figure 13
Source: IHS Global Insight
As shown in Figure 14, employment peaked in 2007, right before the onset of the current
recession. By the end of 2009, employment declined by approximately 6.7 million jobs, a
decline of almost 5 percent. As a result, the unemployment rate increased by over three
percentage points in 2009, increasing to 9.3 percent. Although the rate of job losses and the
number of initial claims for unemployment benefits have slowed in recent months, job growth is
projected to be slow. Similar to the economic recovery following the 2001 recession, businesses
will be wary about hiring new workers; instead getting the maximum productivity out of their
current workforce.
As a result, employment is projected to continue to decline in the first quarter of 2010.
Job growth is projected in the second quarter but, this growth is artificially inflated by federal
government hiring for the national census in May. In the second half of 2010, employment is
only projected to grow by 0.7 percent. For all of 2010, employment is projected to decline by an
additional 1 million persons, or 0.7 percent. This additional decline in employment will, in turn,
Initial Unemployment Claims
Page 28
28
cause the unemployment rate to increase to 9.9 percent in 2010. Consistent job growth is not
projected to return until 2011.
Source: IHS Global Insight
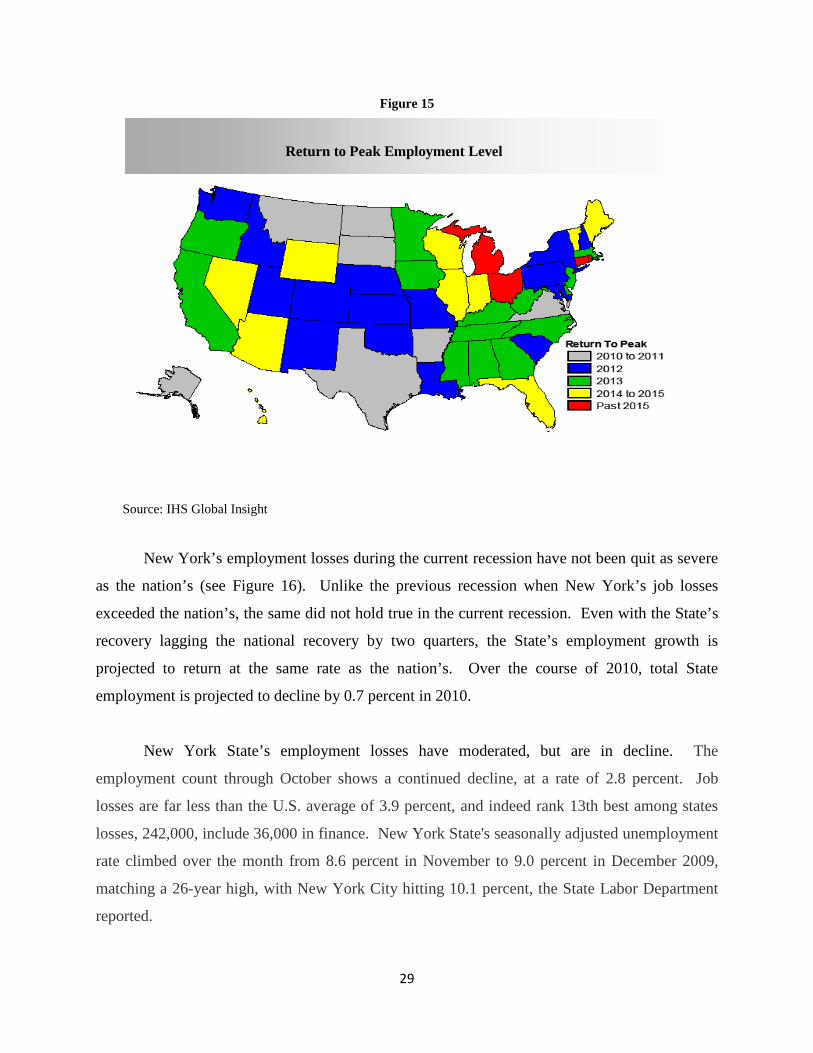
The decline in employment has impacted every state in the nation. However, the severity
of the impact of the recession on each state’s economy impacts the amount of time it will take to
return to peak employment. Figure 15 shows when each state is projected to return to peak
employment. As shown, states, such a Michigan and Ohio, that were negatively impacted by the
decline of the US auto industry, are not projected to return to their peak employment levels until
after 2015. Anemic growth in employment is also seen in states such as Florida and Arizona
whose economies relied heavily on the housing market bubble. In contrast, those states who
have weathered the current recession well are the ones who will have a quicker return of
employment growth.
0.0
2.0
4.0
6.0
8.0
10.0
12.0
126.000
128.000
130.000
132.000
134.000
136.000
138.000
140.000
2001 2002 2003 2004 2005 2006 2007 2008 2009 2010 2011
Perc
enta
ge
Mill
ions
of P
erso
ns
Figure 14U.S. Labor Market
Employment Unemployment Rate
Page 29
29
Figure 15
Source: IHS Global Insight
New York’s employment losses during the current recession have not been quit as severe
as the nation’s (see Figure 16). Unlike the previous recession when New York’s job losses
exceeded the nation’s, the same did not hold true in the current recession. Even with the State’s
recovery lagging the national recovery by two quarters, the State’s employment growth is
projected to return at the same rate as the nation’s. Over the course of 2010, total State
employment is projected to decline by 0.7 percent in 2010.
New York State’s employment losses have moderated, but are in decline. The
employment count through October shows a continued decline, at a rate of 2.8 percent. Job
losses are far less than the U.S. average of 3.9 percent, and indeed rank 13th best among states
losses, 242,000, include 36,000 in finance. New York State's seasonally adjusted unemployment
rate climbed over the month from 8.6 percent in November to 9.0 percent in December 2009,
matching a 26-year high, with New York City hitting 10.1 percent, the State Labor Department
reported.
Return to Peak Employment Level
Page 30
30
Source: IHS Global Insight
Continued weakness is projected in the real estate sector in 2010, particularly the
commercial sector, due to tight credit market conditions and declining real estate values.
Construction sector jobs are projected to continue to fall as well as with the manufacturing
sector. While these two sectors account for the bulk of the job losses projected for 2010, they
represent a substantial improvement over 2009. Strong growth in U.S. corporate profits suggests
growing demand for State professional, scientific, and technical services industries. Of all the
sectors, only private education and health and social assistance sectors have exhibited consistent
strength and remain the biggest spots in the employment forecast. Figure 17 shows the percent
change in 2009 employment by sector from a year earlier.
-6.00%
-4.00%
-2.00%
0.00%
2.00%
2001 2002 2003 2004 2005 2006 2007 2008 2009 2010 2011
Figure 16Employment Growth
U.S. Employment NY Employment
Page 31
31
Figure 17
Source: IHS Global Insight
As to the labor market outlook for the financial sector in 2010, uncertainty remains. Last
year, layoff announcements from the large banks numbered in the tens of thousands, but net
employment has contracted by just 42,000 since the credit crunch began. The surviving firms
are reporting returns to strong profitability and compensation. Financial activities job losses,
which include both finance and insurance jobs and real estate jobs, totaled approximately 34,500
in 2009, approximately the same number of jobs lost in the previous recession. Job losses in the
financial activities sector at the national level were approximately 542,000. In comparison, the
financial activities sector in New York fared slightly better than at the national level; declining
by 5.8 percent in New York as opposed to 6.5 percent nationally.
NY Employment by Sector (Percent change from a year earlier, December 2009)
Page 32
32
Source: IHS Global Insight
With the mounting job losses and the demand for labor being weak in 2009, wages were
extremely constrained. After only 2.1 percent growth in 2008, wages at the national level
declined by 3.3 percent in 2010. Although unemployment is projected to continue to rise in
2010, the economic recovery is projected to positively impact wages, growing by 3.1 percent in
2010.
Similar to what was happening at the national level, wages were constrained at the state
level as well. However, the impact of the financial crisis on Wall Street as well as the negative
atmosphere surrounding the payment of bonuses served to augment the impact the recession was
having on wages in New York. As a result, wages declined by 5.2 percent in 2009. However,
wage growth is projected to rebound in New York in 2010, outpacing wage growth at the
national level. Wages are projected to increase by 4.3 percent in 2010.
Growth in personal income is highly dependent upon growth in wages. Due to the
decline in wages at both the national and state levels in 2009, personal income also declined.
However, the decline in personal income was not as great as the decline in wages due to growth
exhibited by the stock market. The decline in personal income in 2009 was 1.4 percent and 2.8
percent at the national and state levels, respectively. Similar to the trends in wages for 2010,
650.00
660.00
670.00
680.00
690.00
700.00
710.00
720.00
730.00
740.00
2001 2002 2003 2004 2005 2006 2007 2008 2009 2010 2011
7.200
7.400
7.600
7.800
8.000
8.200
8.400
NY
Empl
oym
ent
in T
hous
ands
U.S
. Em
ploy
men
t in
Mill
ions
Figure 18Financial Activities Employment
New York U.S.
Page 33
33
personal income is projected to increase by 3.9 percent and 4.4 percent at the national and state
levels, respectively.
CONSUMPTION AND INVESTMENT
CONSUMPTION Figure 19 shows the pre- and post-recession national and state economies with
corresponding movements in the consumption levels. As shown, the current recession period has
had a more negative impact on consumption than the recessions of 1990 and 2001.
Figure 19
Source: IHS Global Insight
National consumption has decreased along with the corresponding recession periods.
The U.S. economy appears to have exited 2009, recovering to the consumption growth of the
pre-recession period. However, as opposed to the recovery from the 2001 recession where the
consumer was the driving force behind the recovery, the consumer is now the weak link in the
Page 34
34
current recovery. Consumer spending is gradually increasing, but its future strength is still in
doubt. Contributing to this doubt is, that the level of debt burdens, the depletion of household
wealth, and the continued tightness in the credit markets. A projected improvement in the jobs
market in 2010 will give consumers some extra help. The recovery in consumer markets is
advancing with the real spending projected to surpass its late-2007 peak in the spring of 2010.
The weakness in the housing market undermined consumer confidence. This, along with
the drop in wealth associated with falling home prices and a slowdown in job growth, caused
consumers to retrench sharply. As shown in Figure 20, the change in consumer sentiment has a
significant impact on the growth in consumption. In those periods of declining consumer
sentiment, consumption has declined. Job losses, declining asset values, and tight credit
conditions were prompting broad cutbacks in consumer spending with a drop of 0.6 percent in
2009 following a drop of 0.2 percent in 2008.
Figure 20
Source: IHS Global Insight
Households are spending cautiously in an effort to reduce debt burdens and rebuild
retirement savings. They are still trying to reduce the use of credit for spending. As a result, the
savings rate has grown much higher, increasing 4.5 percent following a savings rate of 1 percent
Page 35
35
in 2008. Income tax increases in 2011 could create substantial headwinds for consumer markets
if households try to maintain their saving rates. Higher energy prices would reduce consumer
purchasing power.
Figure 21
Source: IHS Global Insight
Even though the credit market is not tightening further, it still is more difficult to get
credit than in the past. With the unemployment rate holding near 10 percent throughout 2010,
households will continue to rebuild their savings and avoid taking on new debt. Consequently,
the savings rate is projected to remain higher, depreciating to approximately 3 percent towards
the end of next fiscal year. This higher savings rate is a result of households cushioning their
standard of living as a result of the projected employment growth. However, as the economy
improves, this reaction is projected to be temporary.
The 2009 holiday shopping season has ended on a high note as sales picked up in late
December. Excluding new vehicles, consumer spending rose 2.7 percent in the fourth quarter of
the calendar year, better than the 1.6 percent pace in the third. A similar growth rate of 2.5
percent is projected in the first quarter of 2010. An improvement in the jobs market will give
consumers some extra help. Increased employment and wages will allow them to increase
spending while maintaining a higher saving rate. Consumption fell 0.6 percent in the calendar
Page 36
36
year 2009, but a 2.4 percent increase is projected in 2010. Vehicle sales are also gradually
improving despite the shock waves from Toyota’s recall problems.
Figure 22
Source: IHS Global Insight
Consumer spending is showing gradual improvement across all categories. An
expanding economy and a rising stock market are sparking renewed growth in consumer
spending. With an upturn in employment on the horizon, real consumption is expected to
increase by 2.4 percent throughout 2010, reaching a new peak this spring. The wealth effect,
which has been a significant drag on discretionary spending in the current recession , is projected
to improve. After falling by an unprecedented $17.5 trillion from the second quarter of 2007 to
the first quarter of 2009, household net worth recovered by $6.3 trillion in the final three quarters
of 2009, mostly due to gains in financial asset values. As household finances improve, pent-up
demand for vehicles, consumer electronics, fashion apparel, and travel is being released. The
pickup in home sales is also giving a temporary boost to the sales of home furnishings. After
declines of 4.5 percent and 4 percent in 2008 and 2009, respectively, real spending on durable
goods is projected to increase by 5.1 percent in 2010.
Page 37
37
Consumer prices advanced 0.4 percent in November, reflecting rising costs for energy,
medical care, and transportation. The 6.4 percent increase in gasoline prices helped lift the
energy category to a 4.1 percent gain, which accounted for roughly half of the monthly increase
in inflation. The 0.1 percent gain in food prices was negated by a similar decrease in the cost of
rent. Excluding food and energy, core consumer prices were unchanged. This is a direct
consequence of the decline in consumer demand brought on by high unemployment, shrinking
household wealth, and the reduced use of credit. Core inflation (core consumer price index
which excludes food & energy) is tracking 1.5 percent below the Federal Reserve’s target rate of
inflation.
Figure 23
Source: IHS Global Insight
Even though the current economic growth is initially driven by the inventory cycle and
government stimulus, there is some underlying sales growth which will persist beyond these
factors. Exports are expected to improve and become one of the key drivers to economic growth.
On the other hand, employment growth which is projected to increase from current fiscal quarter
is expected to be another key driver in this regard. This kind of employment growth may
Page 38
38
underpin the growth rate of consumer spending. As shown in Figure 23, inflation is not an issue
for next few years.
Figure 24 shows that the current recession has had a similar impact on consumption in
New York as it has had on national consumption. Since New York’s economy entered the
recession later than the national economy and the housing market was not as severely impacted,
consumption growth in New York outpaced national consumption growth in the first half of
2009. Taxable consumption in New York is projected to grow by approximately 4.4 percent in
2010, following a decline of 6.6 percent in 2009.
Figure 24
Source: IHS Global Insight and NYS Senate Finance Committee
Page 39
39
Figure 25
Source: IHS Global Insight and NYS Senate Finance Committee
Real disposable income is projected to grow slower in 2010 compared to 2009.
However, consumption growth is projected to grow at a faster rate than income growth. Some
major reasons behind such subdued disposable income growth is the sluggish employment
growth and downward wage pressure. Another reason is the expected increase in the federal
income tax rate starting in 2011 as a result of the expiration of the Bush-tax-cuts to mitigate the
huge fiscal deficit.
BUSINESS INVESTMENT
The economy exhibited strong growth at the end of 2009, real GDP increasing by 5.7
percent. As part of this growth, an estimated 3.4 percent came from a rapid slowdown in
inventory decumulation, the rate at which firms decrease their inventory levels. In relation to
this decumulation, history has shown that inventory investments are procyclical; as the business
cycle turns downwards, inventories decrease and vice versa. While inventory corrections may
not necessarily cause recessions, the scale of cutbacks in inventories often affects the magnitude
or depth of an economic downturn. In the first half of 2009, businesses were looking to liquidate
Page 40
40
their stock of inventory as consumer demand was incredibly low. As a result of reducing
inventory, manufacturers were hoping to cut their costs (e.g. costs of storage and depreciation).
Figure 26 Inventories’ Contribution to GDP Growth (percentage points)
Source: IHS Global Insight
The recent positive contribution to the economic recovery given by the slowdown in
inventory decumulation is not projected to continue into 2010. Figure 26 depicts the effect of the
turn in the inventory cycle on quarterly GDP growth. The liquidation of inventories at the start
of 2009 actually caused GDP to contract. These negative effects were offset in the second half
of 2009 as inventory levels began to decline less drastically. The strong contribution to GDP
growth in the fourth quarter of 2009 marked the end of the nation’s largest inventory correction
since the Great Depression.
The decline in consumption left many warehouses with vast quantities of unsold goods.
In response, firms had little choice but to scale back production, in some instances shutting down
entire factories. Industrial production levels declined 5.1 percent and 2.7 percent in the first and
second quarters of 2009, respectively. In the second half of 2009, the rate at which firms were
slashing inventory levels slowed dramatically and production began to increase. Industrial
production grew at an annualized rate of 6.1 percent in the third quarter, the first quarterly
increase since the first quarter of 2008.
P
erce
ntag
e G
row
th
Page 41
41
With little inventory left to cut, firms must soon increase production, although the
outlook for consumption growth is still projected to be slow. Industrial production is projected
to grow at a rate of 4.3 percent through 2010, with the production of durable goods increasing by
7.2 percent.
Figure 27
Source: IHS Global Insight
Although production was increasing, inventories experienced a slight setback in
December, decreasing 0.2 percent amid a robust sales period. This was a sign that manufacturers
remained cautious about the strength of consumer demand in the short term. Despite this
decline, economists believe further slashes to inventory levels are unlikely occur.
As job cuts mounted through 2009 and wages dropped, businesses began extracting more
output from a diminished and less costly labor pool. Non-farm productivity, the measure of the
share of output per combined labor hours, increased by 3.1 percent in 2009, the largest annual
growth since 2001. In turn, unit labor costs declined 2.8 percent in the past year. With the
projected increase in production as a result of the shortage of inventory, companies have little
room for more cuts and must soon add to payroll to keep up with improving sales. However,
Page 42
42
productivity is anticipated to grow another 3.3 percent in 2010 as unemployment lingers. Any
future declines in productivity are likely to be the result of increased labor hours, not a decline in
output. According to the U.S. Department of Labor, labor hours increased in the fourth quarter
for the first time since the second quarter of 2007.
The productivity gains realized from diminished labor costs have increased corporate
cash flow. This improvement in corporate profits has allowed business investments to stabilize.
Figure 28 below compares non-residential investment on equipment and software versus
investment in non-farm structures . Slashes in inventory levels and employment, caused by
diminished production, have left companies operating at less than full capacity. Firms are
unlikely to expand capacity utilization in the near future as struggles in the commercial real
estate market persist, a market that is still experiencing the effects of the credit/housing market
bubble. The excess cash flow, therefore, is most likely to be directed towards spending on
equipment and technology. Non-residential investment in equipment and software grew by 3
percent in the fourth quarter, mitigating the annual decline to 17 percent. Growth is projected
through 2010 as investment in equipment and software increases by 8 percent, contributing an
estimated 0.5 percent to GDP growth.
100.00120.00140.00160.00180.00200.00220.00240.00260.00280.00300.00
400
500
600
700
800
900
1000
1100
1200
2007
Q1
2007
Q2
2007
Q3
2007
Q4
2008
Q1
2008
Q2
2008
Q3
2008
Q4
2009
Q1
2009
Q2
2009
Q3
2009
Q4
2010
Q1
2010
Q2
2010
Q3
2010
Q4
2011
Q1
2011
Q2
2011
Q3
2011
Q4
Non-Farm
StructuresEq
uipm
ent &
Sof
twar
e
Figure 28U.S. Non-Residential Investment
(Billions of $)
equipment & software non-farm structures
Page 43
43
Lack of access to the capital markets continues to be an issue especially in commercial
real estate and construction sectors. High risks of default continue to discourage banks from
lending to small businesses. Due to these tight credit conditions, private non-residential
investment in non-farm structures declined through 2009 at an estimated rate of 15 percent. As
seen in the graph above, this investment is not expected to reach bottom soon, as investment in
non-farm structures declines further through 2010 by 24 percent. Clearly, this will prove to be a
significant deterrent to the pace of economic recovery going forward. Despite the strong outlook
for equipment and software spending, total private non-residential investment is projected to
decline 0.8 percent in 2010.
GOVERNMENT POLICIES AND SPENDING
In conjunction with the Federal Open Market Committee’s aggressive stance on interest
rates, the U.S. has implemented a number of more direct fiscal policies in an effort to restore
growth to the nation’s economy. The Troubled Assets Relief Program (TARP), initially enacted
in the Fall of 2008, has helped to stabilize the financial markets, which at the start of 2009 were
on the verge of a collapse. To date, the Treasury has recovered approximately two-thirds of the
TARP capital investments provided to nineteen of the world’s largest financial institutions, with
Citigroup, Inc. repaying its remaining $20 billion in trust preferred securities in December.
While the Treasury has begun to implement an exit strategy for the assistance given to the larger
institutions, limited access to credit continues to persist for both consumers and businesses. A
large number of small banks are still exposed to commercial loan failures. As a result, the TARP
program has been extended through October 2010 as the Treasury plans to refocus funding to
mitigate foreclosures, increase small business lending, and aid securitization markets for
consumers, small businesses, and commercial mortgage loans. As of a February 10th, the U.S.
Department of Treasury projects that the “impact of financial stabilization efforts on the
deficit…will be less than $120 billion.”1
1 < http://www.financialstability.gov/latest/pr_02102010.html>
Page 44
44
Along with the TARP, the Federal government enacted the American Recovery and
Reinvestment Act (ARRA). ARRA has provided a number of spending measures and tax cuts
that have spurred consumer spending and promoted economic growth. The original stimulus
package, valued at $787 billion over 10 years, is estimated to have added approximately 0.8
percentage points to 2009 GDP growth. The Congressional Budget Office estimates that $754.8
billion of the program’s total value will be realized through the end of 20122
. The “cash for
clunkers” program proved immensely successful as consumer spending on new automobiles
increased quarter over quarter at a rate of 42 percent in the third quarter of 2009. A similar $300
million program subsidizing the purchase of home appliances is currently underway in early
2010.
The first-time home buyers’ credit program contributed to fourth quarter annualized
growth of 14 percent in existing home sales. The sudden drop in sales in the month of January is
attributed to the credit program’s initial expiration in December. A similar upwards spike is
expected in the second quarter of 2010 as the program has been extended through April. The
ARRA stimulus is expected to add 1.4 percentage points to GDP growth in the 2010, creating or
saving nearly 2.5 million jobs since its inception. Figure 29 compares baseline annualized
growth in quarterly GDP to growth with no stimulus. While the economy may have rebounded
on its own, the impact of stimulus spending helped to accelerate the path of recovery. Going
forward, additional spending will detract from GDP growth, a result of mounting deficit
pressures.
2 <http://www.cbo.gov/ftpdocs/99xx/doc9989/hr1conference.pdf>
Page 45
45
Figure 29
Source: IHS Global Insight
As firms’ resource utilization remains low and inflation in the short term is a non-issue,
the Federal Reserve Board is projected to maintain its low Federal Funds target rate of 0 to .25
percent. The Federal Funds rate is the rate which determines interbank lending, which, in turn,
affects the rate banks will charge for loans to consumers and busineses. In the face of high
inflation, the Federal Reserve will often be set the Federal Funds rate high in an attempt to
discourage spending. With the current low inflation environment, the Fed will be allowed to
focus on easing credit conditions in the hopes that businesses will soon be able to expand
capacity, thus creating the need for increased hiring. The Federal Funds rate is not projected to
be increased until the third quarter of 2010, increasing by only 5 basis points. By the end of
2010, the Federal Funds rate is projected to increase by 43 basis points, increasing to 0.55
percent.
In turn, bond yields are showing improvement, with 10-year Treasury notes currently
yielding approximately 3.6 percent. These levels are not projected to change significantly in the
next year. Figure 30 shows the net interest spread between the Federal Funds rate and the 10
year Treasury note yield.
Page 46
46
Figure 30
Source: IHS Global Insight
Total federal expenditures increased 5.2 percent in 2009 as the government expanded its
fiscal policy measures in the face of a worsening recession and the refocused attention on the war
in Afghanistan. The sharp increases in nondefense spending beginning in 2008 largely reflect
the Federal government’s attempt to restore stability to a struggling economy, primarily through
the Troubled Asset Relief Program (TARP). However, the growth in defense spending outpaced
the growth in nondefense spending in 2009 by approximately 70 basis points as the situation in
Afghanistan worsened and the withdrawal of troops from Iraq slowed. In 2010, growth in non-
defense spending is expected to outpace growth in defense spending. Much of the projected 5.1
percent increase in non-defense spending is attributed to ARRA stimulus funds.
Page 47
47
Figure 30
Source: IHS Global Insight
At the close of the federal fiscal year 2009 in September, the U.S. posted a record deficit
of $1.42 trillion, more than three times the previous year’s record of $455 billion. The deficit for
2010 is projected to decline 3 percent to $1.37 trillion, although still considerably higher than
previous levels. This decline is consistent with an anticipated rebound in current tax receipts as a
result of the recovering economy and the sunset of the tax cuts enacted in 2001.
In 2001, the Bush administration enacted the Economic Growth and Tax Relief
Reconciliation Act (EGTRRA) in an effort to stimulate the economy in the midst of a recession.
EGTRRA provided income tax rate cuts along with a number of tax deductions and credits all
designed to increase consumer spending. The tax cuts are scheduled to sunset in 2011 which
would provide a much needed boost to federal tax revenues. Despite this, record high deficit
levels are projected to persist. This will leave the Federal government with no other options but
to raise taxes. These factors can severely limit the recovery in consumer demand.
State and local government spending has been severely constrained by the recession.
Expenditures at this level primarily rely on revenues generated by sales and income taxes. As
Page 48
48
the recession worsened, unemployment mounted and consumer spending declined resulting in
significant revenue shortfalls at the state and local levels. Real state and local government
purchases contracted at a rate of 0.1 percent in 2009. As governments face severe budget crises
going forward, real purchases are expected to show minimal growth in 2010, increasing 0.2
percent.
THE GLOBAL ECONOMY
The world economy has emerged from recession and the recovery has begun. Foreign
trade flows are bouncing back sharply. A turnaround in the Asian economies (spurred by China)
and tentative signs of improvement in Europe are helping the outlook for exports, while an
improving U.S. economy is pulling in more imports. Both exports and imports jumped at strong
double digit annualized rates during the third quarter of 2009. Exports outpaced imports, so that
trade was a positive contributor to GDP growth. Currently, 20 percent growth in real national
exports is outpacing the 10 percent growth rate in real imports. That pattern is projected to
reverse with the U.S. inventory cycle turning so quickly; imports increasing more than exports
through 2010. However, exports are still projected to be a key driver to economic growth in next
few years.
As shown in Figure 31, the value of the dollar has a significant impact upon the growth in
exports and imports. When the dollar’s value is high, goods produced in the US become more
expensive for its trading partners. As a result, an appreciating dollar causes exports to decline.
In turn, an appreciating dollar causes the price of imported goods to be lower; thus, increasing
the number of imports into the US.
Page 49
49
Figure 31
Source: IHS Global Insight and NYS Senate Finance Committee
The value of the dollar weakened for most of 2009, but finished the year on a stronger
note, as the U.S. recovery appeared more robust than the recoveries in Europe and Japan. In the
long-term, the dollar trend is still projected to depreciate, but more so against emerging-market
currencies than against the euro or the yen, as shown in Figure 32. The reason behind the
downward trend is due to the current international debt of the United States. The current-account
deficit fell by more than one-third in 2009, from $706 billion to $432 billion, primarily because
of a $203-billion plunge in the bill for imported oil. The deficit is projected to widen again in the
calendar year 2010, increasing to $552 billion.
0.80
0.85
0.90
0.95
1.00
1.05
1.10
1.15
-40%
-30%
-20%
-10%
0%
10%
20%
30%20
06
2007
2008
2009
2010
2011
2012
Exch
ange
Rat
e
% C
hang
e (a
nnua
lized
rat
e, v
olum
es)
International Trade Growth And Exchange Rate
Exchange Rate real US import growth real US export growth
Page 50
50
Figure 32
Source: IHS Global Insight and NYS Senate Finance Committee
Recent trends in foreign trade flows have had a significant impact on the nation’s
economic recovery. Surprisingly strong growth in exports has acted as a principle component to
the business cycle’s latest upswing. Emerging markets such as China and other Asian economies
have recovered from the global recession much faster than the more developed nations and are
currently leading the global expansion. As shown in Figure 33, as global GDP was contracting
in 2009, China’s economy and other Asian markets excluding Japan were increasing at rates of
8.6 and 4.7 percent respectively. As a result, their demand for imported goods has been
increasing, translating into the expansion of U.S. exports.
Page 51
51
Figure 33
Source: IHS Global Insight
Net exports measure the difference between the amounts of exports less the amount of
imports. When imports outpace exports, the nation is running a trade deficit; a trade surplus
occurs when exports outpace imports. Over the last ten years, the U.S. has run an average trade
deficit of $571 billion. The increased demand from emerging markets has translated into exports
growth of 4.2 percent in both the third and fourth quarters of 2009, a rapid turnaround from 8.5
percent and 1.0 percent declines in the first half of the year. Despite a similar rebound in imports
during this time, the U.S. actually posted a positive trade balance in the fourth quarter as exports
outpaced imports. In an effort to maintain this positive contribution, the Obama administration
has targeted a 100 percent increase in exports within the next five years. They estimate that in
the process this will create approximately two million jobs in the U.S. While exports are
expected to increase 9.6 percent in 2010, current projections do not foresee exports doubling
their current levels until 2017, two years later than the President’s planned projection.
Page 52
52
On the other hand, imports are expected to increase by 10 percent in 2010, following a 14
percent decrease in the prior year. Much of this increase is the anticipated result of a swing in
the inventory cycle and a stronger U.S. dollar. With the inventory decumulation coming to a
halt, companies are preparing to expand their resources. At the same time, a disjointed Euro
response to the debt crisis in Greece has fueled uncertainty in the financial markets, appreciating
the dollar against the Euro. Investors cite a lack of detailed proposals from the European Union
on alleviating Greece’s debt as a deterrent to future investment growth. Potential collateral
damage from less severe situations in Spain, Portugal, and Ireland has also contributed to a
stronger dollar. As a result, the price on domestic goods in the U.S. will increase, making them
more expensive in comparison to imported goods. Net exports are estimated to decrease 13
percent in 2010, further widening the trade deficit. The deficit had narrowed in 2009, with net
exports increasing nearly 29 percent in 2009.
-1,000.00
-500.00
0.00
500.00
1,000.00
1,500.00
2,000.00
2,500.00
2001 2002 2003 2004 2005 2006 2007 2008 2009 2010
Figure 34U.S. Trade Flows
(billions of dollars)
Imports Exports Net Exports
Page 53
53
RISKS TO THE FORECAST
As with any forecast, there are unforeseen risks associated with forecasting the economy.
Any “shock” to the various sectors of the economy, whether positive or negative, can have a
significant impacts on the shape and pace of the economic recovery. For instance, while GDP
posted higher than forecast growth in the fourth quarter, it is unlikely that this pace will continue.
Many experts believe that while a double-dip recession is less likely than it had been a few
months ago, a strong V-shaped recovery is equally unlikely. Growth is expected to slow down
considerably as the turn in the inventory cycle is completed and many government stimulus
programs sunset.
In the next few months, the U.S. Department of Treasury will allow many programs from
their Financial Stability Plan to expire. The expiration of these programs is mainly tied to the
belief that the largest financial institutions are once again self-sustainable. However, how the
financial markets will react once TARP has ended is still unclear. As mentioned, the commercial
real estate sector will continue to be a drag on the economy. Recent reports have revealed that a
little less than 3000 small banks could significantly curtail lending due to commercial loan
failures in 2010. These banks hold nearly 45 percent of the total $3.4 trillion commercial real
estate debt in the U.S., representing a threat to the nation’s recovery. Not only will this hurt
businesses, it could further tighten credit standards for consumers, ultimately limiting future
consumption.
For the current forecasts, inflation in the short-term is treated as a non-factor. If the
Eurozone debt crisis worsens, the U.S. dollar can appreciate considerably. This can significantly
deter growth in exports, a variable that serves as a key component to further GDP growth.
Tensions with Iran could worsen in the future, not only creating a greater need for defense
spending but inflating the price of oil.
In light of the possibility of inflation, the Fed must be cautious in how it sets future
monetary policy. If interest rates are raised too soon, consumers will revert to saving more and
Page 54
54
spending less. If rates are raised too late, inflation could increase at detrimentally higher rates,
boosting GDP in the short run but restricting economic growth over the long-run.
Page 55
55
REVENUE OUTLOOK
The Senate Finance Committee estimates gross General Fund tax collections in SFY
2009-10, excluding the STAR and debt service funds, to decrease by 5.7 percent to $49.0 billion.
On an All Funds basis, gross collections are estimated to decrease by 2.9 percent to $58.6 billion
in SFY 2009-10. These increases are primarily the result of the continued impact of the
recession that is occurred at both the State and national levels.
In SFY 2010-11, the Senate Finance Committee projects that General Fund tax
collections, excluding special revenue transactions, will increase by 6.8 percent to $52.3 billion.
All Funds collections will increase by 8.4 percent to $63.5 billion. This increase reflects the
recovery in the economy bolstered by proposed increases in tax revenues from the increase in the
cigarette tax, tax on beverage syrup, and the authorization for the sales of wines in grocery
stores.
PERSONAL INCOME TAX
New York State imposes a tax on income earned within the State by individuals, estates,
and trusts. Personal Income Tax (PIT) receipts contribute over one half of all tax collections
deposited into the General Fund. New York’s definition of income closely follows federal rules,
which include wages, salaries, capital gains, unemployment compensation, and interest and
dividend income. Those components sum to federal adjusted gross income (FAGI). New York
State adjusted gross income (NYSAGI) is calculated starting with this base, from which certain
income items are then added or subtracted. The New York standard deduction or itemized
deductions are subtracted from NYSAGI to arrive at New York State taxable income. Certain
credits are then subtracted from the calculated tax to determine total personal income tax
liability.
Page 56
56
The personal income tax, which accounts for more than 60 percent of New York State tax
revenue, is paid in a variety of ways: the withholding of wages and other income payments, the
payment of estimated taxes, the payment of unpaid taxes through final returns, and the payment
of overdue taxes known as delinquencies through assessments. Any overpayment of the personal
income tax is refunded to the taxpayer. The manner of payment determines the income year to
which the tax applies. For example, withholding is paid when the income is earned. Therefore,
2009 wages would be reflected in 2009 withholding. However, personal income tax payments
made with final returns are associated with the preceding year’s income. As a result, final
payments made in 2009 are a reflection of income earned in 2008. The same pattern holds true
for refunds.
0
5,000
10,000
15,000
20,000
25,000
30,000
35,000
40,000
1998 1999 2000 2001 2002 2003 2004 2005 2006 2007 2008 2009 2010
20,576
23,194
26,442 25,574
22,648
24,647
28,100
30,813
34,580
36,564 36,840
34,302
37,136
$
Est. For.Source: New York State Department of Taxation and Finance
Figure 35 Personal Income Tax
(Millions of Dollars)
Page 57
57
All Funds net personal income tax receipts for SFY 2009-10 are estimated at $34,302
million, a drop of $2,538 million, or 6.9 percent, from SFY 2008-09. Gross receipts are
estimated to decline by $3,194 million, or 8.4 percent from SFY 2008-09. This drop is largely
attributable to a 28.9 percent decline in estimated payments, particularly a decline in extension
payments related to tax year 2008.
All Funds net personal income tax receipts for SFY 2010-11 are projected to increase by
2,834 million, or 8.3 percent, to $37,136 million. Gross receipts are projected to increase by
$4,290 million, or 10.5 percent, reflecting an increase in wage growth as well as the continued
impact of the PIT surcharge enacted in SFY 2009-10.
General Fund receipts for SFY 2009-10 are estimated to be $22,307 million, $889 million
lower than SFY 2008-09. General Fund receipts for SFY 2010-11 are projected at $24,644
million, an increase of $2,337 million from SFY 2009-10. This increase is a result of an increase
in withholding taxes and estimated payments as a result of better economic conditions and the
PIT surcharge.
Historically, Wall Street has accounted for large portion of New York State tax
collections. In 2006 and 2007, Wall Street had contributed approximately 20 percent of New
York State tax collections. However, the Federal government, which spent trillions of dollars to
support the financial sector, has taken steps that restrict cash bonuses and defer compensation to
future years in an effort to reduce excessive risk-taking and reward long term performance.
Additionally, all of these measures will serve to constrain New York State personal income tax
collections for the 2009-10 fiscal year.
Withholding
Employers are required to withhold an amount from their employees’ paychecks, which
is used as an offset at the end of the year toward the taxpayer’s total liability. Withholding has a
slight lag from the period in which it is withheld to the time the State receives the payment from
the employer. However, withholding is closely correlated to the wages and salaries received
during any given quarter of the year. As of part of the SFY 2009-10 Enacted Budget, the
Page 58
58
personal income tax rate was increased on New York’s high income taxpayers. However,
increased revenues from the higher tax rates have been offset by decreased revenues as a result
of the continued increase in the unemployment and the lethargic recovery of the economy. For
SFY 2009-10, withholding taxes are estimated to be $28,694 million, an increase of $1,008
million from SFY 2008-09. For SFY 2010-11, withholding is projected at $30,486 million, an
increase of $1,792 million.
Estimated Payments
Individuals make estimated payments if the tax they will owe for the year is significantly
more than the amount of tax being withheld from their wages. Individuals who have large
amounts of non-wage income (self-employment income, interest, dividends, or capital gains)
generally make these quarterly payments. Estimated tax payments are due on the 15th of April,
June, September, and January.
Estimated payments are also made when a taxpayer files for an extension to file his
annual return. When a taxpayer files for an extension, he is required to estimate his tax liability
and, if payment is due, submit it with the extension. Estimated payments for SFY 2009-10 are
estimated to be $9,020 million, a decrease of $3,670 million from SFY 2008-09. This decrease
is consistent with the current economic conditions. Non-wage income, especially income earned
by proprietors is projected to decline, resulting in the drop in estimated payments in SFY 2009-
10. For SFY 2010-11, estimated payments are projected at $11,383 million. This increase is a
result of the projected increase in personal income as a result of the recovering economy.
Final Returns
Final returns are due by April 15th of every year. The final return is essentially a
reconciliation between a taxpayer’s withholding and/or estimated payments and tax liability
calculated on the total personal income received throughout the tax year. A payment is due
when the combination of withholding and estimated payments results in an underpayment of the
total tax liability.
Page 59
59
For SFY 2009-10, personal income tax collections from final returns are estimated at
$1,851 million, $835 million lower than collections in SFY 2008-09. This decrease is attributed
to the decline in personal income growth from 2008. For SFY 2010-11, collections from final
returns are projected to be $1,956 million, an increase of $105 million from SFY 2009-10.
Other Payments
These collections are comprised of delinquencies and filing fees required to be paid by
the State’s limited liability companies and limited liability partnerships. Delinquencies are the
sum of payments due on overdue tax liability and any penalties and interest imposed on such past
due liabilities. These are essentially collections received from Tax Department audits.
For SFY 2009-10, other payments are estimated at 1,252 million, an increase of $303
million from SFY 2008-09. This increase is attributable to the Penalty and Interest Discount
(PAID) program currently being offered by the Tax Department to taxpayers with outstanding
tax liabilities and the restructuring of the LLC filling fees that was enacted in SFY 2008-09. For
SFY 2010-11, collections from other payments are projected at $1,282 million, an increase of
$30 million over collections from SFY 2009-10.
Refunds
A refund occurs when a taxpayer overpays his personal income tax, either through over-
withholding or remitting excess estimated payments. Similar to payments made with final
returns, refunds are made as a result of filing an annual return.
For SFY 2009-10, refunds are estimated at $6,515 million, a decrease of $656 million
from SFY 2008-09. This decrease is primarily due to the amount of refunds paid in the fourth
quarter of the fiscal year. A specific amount of refunds is authorized to be issued to those
taxpayers who file their returns early. Prior to SFY 2008-09, these refunds were set at $1.5
billion. In SFY 2008-09, the amount was increased to $1.75 billion. This resulted in a portion of
refunds that historically had been paid in April of the next fiscal year to be paid in March. In
addition, the amount of refunds to be paid in January through March of 2010 has been reduced to
$1.25 billion, further reducing the amount of refunds being paid in the current fiscal year.
Page 60
60
For SFY 2010-11, refunds are projected to be $7,971 million, an increase of $1,456
million from SFY 2009-10. This increase reflects the shift of refunds from SFY 2009-10 into
SFY 2010-11, as mentioned above, as well as reflecting the decline in personal income for 2009.
USER TAXES Figure 36
Collections of user taxes and fees follows a quarterly pattern, with larger collections realized in
months at the conclusion of calendar quarters, this pattern of collections reflects the impact of
quarterly taxpayers, especially in relation to the sales tax.
There are seven taxes that comprise this category:
• Sales & Use Tax,
• Cigarette & Tobacco Tax,
• Motor Fuel Tax,
• Motor Vehicle Fees,
Page 61
61
• Alcoholic Beverage Tax & License Fees,
• Highway Use Tax,
• Auto Rental Tax, and
• Beverage Syrup & Soft Drink Tax
Figure 37
As shown in Figure 37, the sales and use tax dominates user tax collections. All funds
user tax revenue shares are expected to remain the same in the next fiscal year with only two
exceptions: a small decline in the share of sales tax revenue and an increase in the share of
alcoholic beverage fees, due to the allowance of wine sales in grocery stores.
In comparison, general fund revenue from user taxes and fees are comprised of four of
the above taxes. Similar to all funds, sales and use tax is the primary source of collections in this
category.
Page 62
62
Figure 38
Sales Tax
Retail sales and tangible personal property are taxed under Article 28 of the Tax Law
unless statutorily exempt. The sales tax is imposed upon receipts from the sales of tangible
personal property, statutorily specified services, specified electricity gas, refrigeration and steam
services, telephone service, food and beverages sold by restaurants and caterers, hotel occupancy
and certain admission charges.
In New York State, the sales and compensating use tax was enacted in 1965 at the rate of
2 percent. The tax rate was subsequently increased to 3 percent in 1969, 4 percent in 1971, and
to 4.25 percent in 2003. The last increase in the tax rate was a temporary increase of one quarter
of one percent in order to address state budget deficits resulting from the economic recession in
2001. The sales tax rate reverted back to 4 percent in June 2005.
Sales tax collections are primarily impacted by any kind of change in the Tax Law,
especially tax rate changes, and changes in economic activity such as income level, employment,
Page 63
63
stock prices. Consumer spending on durable goods holds the major share of New York State’s
overall consumer spending.
Figure 39
Source: IHS Global Insight and NYS Senate Finance Committee
The sales and use tax is the second largest revenue source for the State. As shown in
Figure 39, changes in total User Tax revenues are primarily determined by the pattern of Sale
Tax collections.
Page 64
64
Figure 40
On an All Funds basis, sales and use tax collections are estimated to be $10.48 billion, a
4.6 percent decline from SFY 2008-09. General Fund collections are estimated to decline by 4.5
percent from $7.7 billion to $7.36 billion in SFY 2009-10. For SFY 2010-11, All Funds sales
tax collections are projected to be $11.05 billion, an increase of 5.5 percent. On a General Fund
basis, sales and use tax collections are projected to be $7.76 billion, a 5.4 percent increase from
SFY 2009-10.
Cigarette & Tobacco Taxes
New York State imposes an excise tax on the sale or use of cigarettes within the State.
Effective March 1, 2000, New York raised its tax by 55 cents to $1.11 per pack and effective
April 3, 2002, by 39 cents to $1.50 per pack. On June 3, 2008, the State’s tax was increased by
$1.25 to $2.75 per pack. New York City levies a separate cigarette excise tax of $1.50 per pack.
The State also imposes an excise tax on other tobacco products, such as chewing tobacco,
snuff, cigars, pipe tobacco and roll-your-own cigarette tobacco. These products are taxed at a
Page 65
65
rate of 37 percent of their wholesale price except for snuff products, which are taxed at a rate of
96 cents per ounce. In the current fiscal year, tobacco tax rate has increased from 37 percent to
46 percent.
For SFY 2009-10, All Funds collections from cigarette and tobacco taxes are estimated to
increase from $1.34 billion to $1.36 billion, an increase of 1.5 percent. On a General Fund basis,
collections from these taxes are estimated to decline from $446 million in SFY 2008-09 to $441
million in SFY 2009-10, a decrease of 1.1 percent.
In SFY 2010-11, All Funds cigarette and tobacco tax collections are projected to increase
to $1.53 billion, an increase of 12.3 percent. General Fund collections are projected to decrease
to $438 million, a decrease of 0.7 percent. This increase in All Funds collections is due to the
proposed one dollar per pack increase in the tax. The decline in General Fund collection is due
to the proposed change in the Tax Law which would increase the share of cigarette tax
collections being deposited into the Health Care Reform Act (HCRA) funds.
Figure 41
Page 66
66
Taxable cigarette consumption is a function of retail cigarette prices and a long-term
downward trend in consumption. As shown in Figure 42, although tax collections from
cigarettes has been increasing, consumption has been declining, The increase in collections is
primarily a result of the amount of the tax. The decline in consumption reflects the impact of
increased public awareness of the adverse health effects of smoking, smoking restrictions
imposed by governments, anti-smoking education programs, and changes in consumer
preferences toward other types of tobacco. Declines in taxable consumption have also been
exacerbated by evasion.
Figure 42
Motor Fuel Tax
Motor fuel and diesel motor fuel taxes are imposed by Article 12-A of the Tax Law upon
the sale, generally for highway use, of motor fuel and diesel motor fuel, respectively. The motor
fuel tax is levied primarily on fuel used in motor vehicles operating on the public highways of
the State or on fuel used in recreational motorboats operating on the State’s waterways.
Page 67
67
A motor fuel tax of two cents per gallon was imposed on gasoline motor fuel in 1929.
The tax on gasoline was increased to three cents in 1932, to four cents in 1937, to six cents in
1956, to seven cents in 1959 and to eight cents in 1972.
A motor fuel tax of two cents was imposed on diesel motor fuel in 1936. The tax on
diesel fuel was increased to four cents in 1947, to six cents in 1956, to nine cents in 1959 and to
ten cents in 1972. The tax on diesel fuel was reduced to eight cents in 1996.
Motor fuel tax collections are a function of the number of gallons of fuel imported into
the State by distributors and any change in the relevant tax law. Gallonage is determined in large
part by fuel prices, the amount of fuel held in inventories, the fuel efficiency of motor vehicles
and overall state economic performance. Hence, fuel tax collections are an indirect function of
fuel prices. The collections from the motor fuel tax do not fluctuate significantly from year to
year since the number of gallons of fuel imported into the State does not fluctuate significantly,
as shown in the Figure 43 below.
Figure 43
Source: New York State Department of Taxation & Finance
Page 68
68
Taxable gasoline gallons declined slightly in SFY 2000-01 due in part to price increases,
and increased in SFY 2001-02 due to price declines. In SFY2002-03 and SFY 2003-04, taxable
gasoline gallons increased more slowly since the effect of the economic recovery was offset by
high gasoline prices. In SFY 2004-05 and SFY 2005-06, taxable gasoline gallons declined 2.2
and 1.1 percent, respectively, due to a sharp increase in gasoline prices
For SFY 2009-10, collections from the motor fuel tax are estimated to be $508 million, a
0.8 percent increase from SFY 2008-09 collections. For SFY 2010-11, collections are projected
to increase slightly to $516 million in SFY 2010-11, an increase of 1.5 percent. Currently, all
motor fuel receipts are deposited into the Dedicated Highway and Bridge Trust Fund and the
Dedicated Mass Transportation Trust Fund.
Motor Vehicle Fees
Motor vehicle fees are imposed under the Vehicle and Traffic Law. These fees include
registrations for motor vehicles operated in the State, fees for drivers’ licenses, and other fees
such as: fees for inspection and emission stickers, repair shop certificates, and insurance civil
penalties. Certain vehicles registered in New York are exempt from registration fees. The
exemptions include: vehicles owned by the State or municipalities; passenger vehicles owned by
consular offices, provided reciprocity is granted; and vehicles owned and used for the
transportation of animals by societies for the prevention of cruelty to animals.
Most vehicle registration fees in New York are based on weight except for buses, which
are charged according to seating capacity, and semi-trailers, which are charged a flat fee. Vehicle
registration and driver licensing fees are a function of the fee schedules, the number of licensed
drivers and registered vehicles, and the number of years between license and vehicle registration
renewals. Historically, the collections from motor vehicle fees are not significantly impacted by
economic conditions. Collections from these fees are impacted more by changes in the fee or
renewal schedules.
Page 69
69
For SFY 2009-10, All Funds collections from motor vehicle fees are estimated to be $973
million, a 34.6 percent increase in collections from SFY 2008-09. This large increase is due to
the increase in license and registration fees included in the SFY 2009-10 Enacted Budget as well
as the imposition of license and registration fees within the MTA district.
For SFY 2010-11, All Funds collections from motor vehicle fees are projected to increase
to $1.2 billion, a 20.1 percent increase. This increase is due to the full year impact of the license
and fee increases enacted in SFY 2009-10.
Figure 43
Alcoholic Beverage Tax
New York State imposes excise taxes at various rates on liquor, beer, wine and specialty
beverages. Overall, per capita consumption of taxed beverages and receipts has remained fairly
constant in recent years with declines in one beverage class being offset with increases in others,
Page 70
70
due to shifts in consumer preferences. Currently, all receipts from the alcoholic beverage tax are
deposited in the General Fund.
For SFY 2009-10, alcoholic beverage tax collections are estimated to be $222 million, a
7.8 percent increase from collections in SFY 2008-09. This increase is primarily due to the
increase in the excise tax on wine and beer that was enacted as part of the SFY 2009-10 budget.
For SFY 2010-11, collections are projected to decrease to $217 million, a 2.3 percent decline.
Alcoholic beverage tax revenue is a function of any kind tax law change, the general
trend of sales and consumer price index of alcoholic beverages. In the current fiscal year, the tax
rate on beer increased from 11 cents to 14 cents per gallon and the rate on wine increased from
18.9 cents to 30 cents per gallon.
Alcoholic Beverage License Fees:
New York State distillers, brewers, wholesalers, retailers, and others who sell alcoholic
beverages are required by law to be licensed by the State Liquor Authority. On an All Funds
basis, alcoholic beverage license fee collections are estimated to be $52 million in SFY 2009-10,
an 18.2 percent increase in collections from SFY 2008-09. For SFY 2010-11, All Funds
collections are projected to increase to $298 million, a 473 percent increase from SFY 2009-10.
This increase is due to the proposed legislation that would allow sale of wine in grocery stores
with the payment of one-time franchise fee. The additional collections of $250 million would be
deposited into the HCRA funds.
Auto Rental Tax:
The auto rental tax is imposed on vehicles rented by a resident or a nonresident,
regardless of where the vehicle is registered. The tax does not apply to a car lease covering a
Page 71
71
period of one year or more. Receipts from the auto rental tax are influenced by the overall health
of the economy, particularly general trend of consumer and business spending on travel.
Since June 1, 1990, the State has imposed a five percent tax on charges for the rental or
use a passenger car with a gross vehicle. In June 2009, the rate was increased to six percent and
a five percent tax was imposed on the rental of vehicles within the Metropolitan Commuter
Transportation District.
Auto rental tax collections are estimated to increase from $61 million in SFY 2008-09 to
$84 million in SFY 2009-10, an increase of 37.7 percent increase. This increase is a result of the
increase in the rate from five percent to six percent as well as the imposition of an auto rental tax
within the MTA district. Collections are projected to continue to increase to $105 million in
SFY 2010-11, a 25 percent increase over SFY 2009-10 collections. This increase reflects the full
year impact of the tax rate increases as well the economic recovery.
Highway Use Tax:
Articles 21 and 21-A of the Tax Law impose a highway use tax on commercial vehicles
using the public highways of the State. Highway use tax revenues are derived from three
sources:
• the truck mileage tax,
• the fuel use tax, and
• registration fees.
Currently, all highway use tax receipts are deposited to the Dedicated Highway and Bridge Trust
Fund.
The truck mileage tax (TMT) is levied on commercial vehicles having a loaded gross
weight of more than 18,000 pounds, or an unloaded weight in excess of 8,000 pounds for trucks
and 4,000 pounds for tractors. The tax is imposed at rates graduated according to the gross
vehicle weight. In addition, a supplemental tax equal to the base truck mileage tax was imposed
Page 72
72
in 1990. Effective January 1, 1999, the supplemental tax was reduced by 50 percent, and
effective April 1, 2001, the supplemental tax was reduced by an additional 20 percent of the
remaining tax.
For SFY 2009-10, all funds collections from the highway use tax are estimated to be $141
million, the same as SFY 2008-09. In SFY 2010-11, highway use tax collections are projected to
increase to $160 million, reflecting a 12.5 percent increase.
BUSINESS TAXES
Figure 44
Business taxes in New York are imposed on various aspects of a business’ income. The
corporate franchise tax and the bank tax are imposed on a business’ entire net income; the
corporate utility tax is imposed on the gross receipts of the business; and the insurance tax is
imposed on premiums. The petroleum business tax is imposed on the gross receipts from the
Page 73
73
sale of various petroleum products by the business. However, any increase/decrease in liability
for the petroleum business tax is pegged to an inflation index.
In addition, all businesses which are located within the Metropolitan Commuter
Transportation District, except for those subject to the petroleum business tax, are subject to the
Metropolitan Transportation Authority (MTA) surcharge. This surcharge is imposed at a rate of
17 percent of the filer’s tax liability and is used to support mass transit systems in the New York
City metropolitan area.
In March, calendar year filers are required to make a first installment payment based on
the taxpayer’s prior year liability. Filers then make estimated payments in June, September, and
December based on projected liability for the current tax year. A final settlement is made in
March, along with the next mandatory prepayment. As of January 1, 2010, the mandatory March
prepayment has been increased from 30 percent to 40 percent of the taxpayer’s prior year
liability. Fluctuations in the estimated payments and final settlement account for most of the
variation in tax collections from year to year. These payments are affected by changes in
taxpayers’ liability, which are driven by economic performance.
All funds business tax receipts are estimated to total $7.83 billion for SFY 2009-10. This
represents a 3 percent increase over the $7.60 billion collected in SFY 2008-09. General Fund
collections are expected to total to $5.67 billion for the current fiscal year, an increase of 2
percent from SFY 2008-09. Much of this growth is generated by the increase in the March
prepayment from 30 percent to 40 percent of prior year liability and delays in refund payments
under the bank and corporate franchise taxes.
For SFY 2010-11, All Funds business tax receipts are projected to decrease by 0.5
percent, totaling $7.79 billion. General Fund receipts are projected to increase to $5.75 billion,
an increase of 1.4 percent. The decrease in collections is attributed to adjustments made from the
March prepayment spin up and lower audit collections. Tax collections, excluding audits, are
projected to increase as the financial markets continue to rebound with the help from Federal
stimulus and the national economy begins to recover.
Page 74
74
Corporate Franchise Tax
Levied by Articles 9-A and 13 of the New York Tax Law, the corporate franchise tax
collects receipts from domestic and foreign corporations for the privilege of exercising their
corporate franchise or doing business, employing capital, owning or leasing property, or
maintaining an office in New York. Article 13 imposes a 9 percent tax on unrelated business
income from not-for-profit organizations. The corporation franchise tax accounts for the most
revenue of all business taxes, approximately 42 percent of business tax receipts.
Article 9-A consists of business entities that are classified as either C Corporations or S
Corporations. According to the New York State Corporate Tax Statistical Report, C
Corporations made up only 42 percent of the total number of Article 9-A filers, yet accounted for
97 percent of the tax liability. For C Corporations, the Tax Law mandates that the tax liability be
calculated by using four different bases: entire net income (ENI), alternative minimum, allocated
business and investment capital, and the fixed dollar minimum. Taxes are collected on
whichever base yields the highest liability.
Unlike C Corporations, which have their tax liability determined at an entity level, S
corporations have their tax liability determined at a member level. That is, the income of the S
corporation is distributed to the members of the corporation who then pay the tax on such income
under the personal income tax. However, S corporations are subject to the fixed dollar minimum
tax under Article 9-A at rates stipulated in the Tax Law. These rates are based on the amount of
the taxpayer’s payroll which includes the salaries of the general executive officers.
For SFY 2009-10, All Funds receipts are estimated to total $2.95 billion, a decline of 8.5
percent from SFY 2008-09. General Fund receipts are estimated to total $2.49 billion, a decrease
of 9.7 percent. The decrease is a result of a downturn in corporate profits and the loss of liability
from for-profit health maintenance organizations, which are now required to file under the
Insurance Tax.
Page 75
75
For SFY 2010-11, All Funds receipts are projected to increase to $3.3 billion. The 12.1
percent increase over SFY 2009-10 reflects a rebound in corporate profits, which are forecast to
increase in calendar year 2010 by nearly 13 percent. On a General Fund basis, receipts are
projected to increase to $2.86 billion, increasing by 15 percent over the prior year.
Corporation and Utilities Tax
Specialized industries including public utilities, newly organized or reorganized
corporations, out-of-State corporations doing business in New York State, transportation and
transmission companies, and agricultural cooperatives are required to pay taxes and fees under
Article 9 of the Tax Law. Historically, a majority of Article 9 revenues have been derived from
public utilities and the transportation and telecommunications industries. However, due to
regulatory and statutory changes over the last six years, the telecommunications industry has
become the primary source of corporation and utilities tax revenues.
For SFY 2009-10, All Funds collections are estimated to total $964 million, an increase
of 11.7 percent over SFY 2008-09. The year over year growth in collections is a result of
increasing consumption of telecommunications services. General Fund receipts are estimated to
total $735 million, an increase of 12.4 percent from prior fiscal year.
All Funds receipts are projected to decrease to $934 million in SFY 2010-11, a decline of
3.1 percent. General Fund receipts are projected to drop 2.9 percent to $714 million. Much of
the difference is a result of an adjustment for the one-time cash flow in SFY 2009-10 from the
increase in the March prepayment.
Insurance Tax
Article 33 of the Tax Law imposes taxes on insurance companies, insurance brokers, and
certain insurers for the privilege of conducting business in the State. A premiums-based tax is
levied on non-life insurers and independently procured insurance. Accident and health
premiums received by non-life insurers are taxed at the rate of 1.75 percent and all other
Page 76
76
premiums received by non-life insurers are taxed at the rate of 2 percent. A $250 minimum tax
applies to all non-life insurers.
The insurance tax on life insurance companies is imposed on two components. The first
component is the highest of four alternative bases, similar to the corporate franchise tax. An
additional eight-tenths of a cent rate applies to each dollar of subsidiary capital allocated to New
York. The second component is an additional franchise tax on gross premiums, less returned
premiums. The tax rate on premiums is 0.7 percent and applies to premiums written on risks
located or resident in New York.
All funds insurance tax receipts are estimated to total $1.43 billion in SFY 2009-10, an
increase of 20.7 percent over SFY 2008-09 receipts. This increase is attributable to the changing
of the prepayment due in March from 30 to 40 percent of the previous year’s tax liability and the
inclusion of for-profit health maintenance organizations. Collections from these institutions
were previously made under the Corporate Franchise Tax. General Fund receipts for SFY 2009-
10 are estimated at $1.27 billion, an increase of 17.2 percent over the prior year.
All Funds collections are projected to total $1.41 billion in SFY 2010-11, a decrease of 1.3
percent from SFY 2009-10 collections. General Fund receipts are forecast to decrease to $1.27
billion, a 0.1 percent drop from the prior year.
Bank Tax
Bank tax revenues are collected under Article 32 of the Tax Law. The tax is imposed on
banking corporations conducting business in New York State, broken down into three groups:
clearinghouse, savings institutions, and other commercial banks. Similar to Article 9-A
requirements, bank tax liability is computed under four alternative bases: alternative minimum,
entire net income (ENI), asset base, and a fixed dollar minimum. Liability is collected on the
highest of these bases.
For SFY 2009-10, All Funds receipts are estimated to total $1.37 billion, an increase of
10.9 percent over SFY 2008-09. General Fund receipts are estimated to amount $1.17 billion, an
Page 77
77
increase of 10.6 percent. While audits collections for this year are $216 million less than prior
year, base collections have increased significantly. Base collections are estimated to be up
nearly 45 percent from the previous fiscal year.
In SFY 2010-11, All Funds and General Fund receipts are projected to decline to $1.05
billion and $901 million, respectively. This represents a decline of approximately 23 percent for
each. Much of this is a result of anticipated declines in audit collections, an adjustment for the
increase in the March prepayment, and payment on delayed refunds from SFY 2009-10.
In recent years, changes in audit revenues have been relatively volatile. As shown in the
Figure 45, All Funds bank tax collections over the past five years have varied significantly as a
result of audits.
Figure 45
Page 78
78
Petroleum Business Tax
Petroleum Business Taxes (PBT) are levied under Article 13-A of the Tax Law on
petroleum related businesses based upon the quantity of various petroleum products imported for
sale or use in the State. PBT rates are annually indexed on January 1st of each year to reflect the
twelve month change in the Petroleum Producers Price Index ending the previous August 13th.
Rates are limited to a maximum 5 percent increase or decrease per year.
Base PBT collections are deposited into both the Mass Transportation Operating
Assistance Fund and the Dedicated Funds Pool. All receipts collected from the supplemental tax
and carrier tax are also deposited into the Dedicated Funds Pool, whose collections are then
divided between the Highway and Bridge Trust Fund and the Dedicated Mass Transportation
Trust Fund.
Petroleum Business Tax receipts are estimated to total $1.13 billion in SFY 2009-10, an
increase of 2.1 percent over the prior fiscal year. The increase is attributed to a 5 percent
increase in the PBT index on January 1, 2009. Receipts are projected to total $1.09 billion in
SFY 2010-11, a 2.9 percent decrease from SFY 2009-10.
OTHER TAXES
Other taxes are comprised of the estate tax, real estate transfer taxes, pari-mutuel taxes
and the boxing and wrestling exhibitions tax. As shown in Figure 46, the majority of the
collections in this category are received from the estate tax and the real estate transfer tax.
Page 79
79
Estate Tax
New York’s estate taxes are not required to be remitted until nine months following a
person’s death. As a result, the amount of estate taxes paid in any particular month is not a
reflection of the current economy, but the economy at the time of death. The estate tax revenue
is a function of household’s real net worth, indirectly to the stock index and any kind of tax law
change, specifically related to credit exemption on the value of inherited estates. These
collections are also a function of the size of the estates on which the taxes are paid.
Estate taxes are estimated to decline in SFY 2009-10 by 23.4 percent, to $891 million
from SFY 2008-09. This reduction in collections is due to the decline in the stock market as well
as the decline in home prices; primary factors impacting the value of one’s estate. Estate taxes
are projected to decrease by 2.7 percent in SFY 2010-11 to $867 million. This is a result of a
projected increase in the stock market offset by the projected continued decline in average home
prices over the first half of 2010.
-
500.0
1,000.0
1,500.0
2,000.0
2,500.0
Mill
ions
of $
Figure 46All Funds Other Tax Collections
Estate Real Estate Transfer Other
Page 80
80
Real estate transfer tax
Real estate transfer tax collections for SFY 2009-10 are estimated to be $472 million,
down by $278 million. This reduction in collections is due to the decline in home prices and
home sales. Real estate transfer tax collections for SFY 2010-11 are projected to be $531
million, increasing by 12.5 percent. This increase reflects the projected improvement in the
housing market in the second half of the fiscal year.
Page 81
81
APPENDIX Methodology
The model and forecasting procedures have the following characteristics and considerations:
the model is based on economic theory and tax revenue accounting relationships;
tax variables are first seasonally adjusted to obtain consistency with other seasonally
adjusted national and New York State data in modeling and forecasting processes, and
are transformed back into non-seasonally adjusted variables to reflect the seasonality of
tax collections;
the New York State economy part of the model belongs to the system of Global Insight’s
Quarterly State Econometric Model. This system is composed of 51 state and D.C.
models, which is further linked to Global Insight’s national social and economic
forecasting system;
the Senate Finance Committee has access to the latest historical data and Global Insight’s
forecast of the U. S. economy each month.
Personal Income Tax
The forecast of withholding is based on independent variables, including wages and dummy
variables reflecting law changes. More specifically, withholding is a function of intercept, total
New York State wages, lagged withholding payment, a dummy variable capturing the 2009 tax
rate hike effect, and an autoregressive lag. The model is estimated in log form, providing the
ability to interpret the coefficients on the wage variables as elasticity.
The forecast of estimated payments is a function of intercept, lagged estimated payment, and the
total liability. The forecast of total liability is derived from the NYSAGI components and a
microsimulation model. The model is estimated in log form, reflecting the elasticity on the
coefficients of the variables.
Page 82
82
The forecast of extension payments is a function of the intercept, 2 lagged extension payments,
and the total liability. This model is estimated in log form, reflecting the elasticity on the
coefficients of the variables.
The forecast of final returns is a function of lagged final return and the total liability. This model
is in log form, reflecting the elasticity on the coefficients of the variables.
The forecast of total refunds is a function of the withholding payment, the difference between
total liability and the withholding payment, and a trend variable. This model is in log form,
reflecting the elasticity on the coefficients of the variables.
User Taxes
The estimation and forecast methodology followed in this section is based on the historical trend
analysis and the econometric models relevant to each category of User Taxes and Fees. The
historical data on tax revenue collections are provided by the New York State Department of
Taxation and Finance while the historical data on macroeconomic variables at national and state
level are obtained from Global Insight. Some other historical data series have been used from
Bureau of Labor Statistics.
Sales and Use tax, is highly dependent on consumer spending on goods and services which, in
turn, are functions of disposable income, employment level, sales and price of light vehicles,
consumer price index, S&P 500 Index and especially the Consumer Sentiment Index. Here, the
national level consumer spending for durable goods, non-durable goods and services have been
shared down to the state level to be use in the estimation model. In the estimation and projection
process for this sub-category of tax revenue, seasonal dummy variables have been used to adjust
for the seasonal variations in the consumer spending. Some other adjustments are made with
respect to the tax law changes such as exclusion of cable television, clothing and footwear
exemption, suspension of such tax exemption.
Page 83
83
Taxable cigarette consumption is a function of retail cigarette prices and a long-term downward
trend in consumption. Some adjustments have been made to incorporate the tax law changes in
this category such as increase in the cigarette tax rate; the increase in the tax rate on tobacco
products from 37 percent to 46 percent in this fiscal year; and also the imposition of 96 cents tax
per ounce of stuff products. Another special adjustment has been made to the next fiscal year’s
projection due to the proposed legislation of increase in the cigarette tax rate by $1 per pack.
Motor fuel consumption is function of consumer price index of motor fuels and gasoline.
Although, motor fuel gallonage follows historical trend and doesn’t vary so much and hence, tax
revenue from this category. It has some seasonal variations due to variations in vacation travels
which is comparatively higher in summer and fall seasons. Hence adjustments have been made
to take care of this small seasonality effect.
Motor Vehicle Fee does not follow any trend in its collections. Only variable whose trend pattern
could explain very little of the variations in this revenue is the population between the age of 18
years and 65 years. This collection also depends on some revenue fund adjustments and the tax
law changes such as increases in some fees in October 2005 and September in current fiscal year.
These effects have been incorporated by using dummy variables.
Alcoholic beverage tax revenue follows a historical trend pattern and the consumer price index
of alcoholic beverage products. Here also, some adjustments have been made to capture the
effect due to changes in tax law like increase in the tax rate on beer in 1996, decrease in the tax
rate on beer in 1996 and again increase in the tax rates on beer and wine in current fiscal year.
The alcoholic beverage control license fee has been estimated following its historical trend and
with the adjustments made for the tax law changes such as increase in the license fees by 28
percent in 2002. The major change is due to the proposed legislation of allowing sale of wine in
the grocery stores which is expected to increase the revenue from new registrations.
Auto-rental tax revenue collection estimation has been based on the historical trend and seasonal
variation due to the pattern of payment of this tax. This tax is mostly paid in the first fiscal
Page 84
84
quarter every year and a minimum amount is paid in the fourth quarter. Another two
adjustments are made with respect to change in rental price in 2008 and increase in the taxes in
the current fiscal year.
The estimation process of revenue from the highway use tax is function of real imports and real
gross domestic product of United States. Here the incorporated tax law adjustments are due to
the imposition of truck-mileage tax to thruway miles from July 1990, reduction in this tax by 50
percent in 1999 and increase in the replacement fee to $15 in current fiscal year.
Business Taxes
Forecasts for business taxes are made through a combination of econometric tools and trending
techniques. Out-year estimates are constructed through the use of econometric models. The
purpose of these models is to capture dynamic historical patterns in the tax liability series. These
patterns characterize how the data has fluctuated through time up until the present and are
commonly influenced by time trends, seasonal effects, and autocorrelation. Autocorrelation
refers to the momentum or persistence of a series over time. It measures the effects of lagged
values on the current observation. Changes within the economy also have a significant impact
on the trends in tax collections over time. The use of econometric models intends to capture the
correlation between tax receipts and variations in a number of economic variables.
Corporation Franchise tax receipts are driven by changes in corporate profits. Corporation and
Utility tax receipts are driven by growth in the demand for electricity and telecommunications
services. Insurance tax receipts are affected by variations in housing starts. The net interest
spread is used to explain changes in bank tax liability. The net interest spread measures the
difference between the yield on 10-Year Treasury Notes and the Effective Federal Funds Rate.
Petroleum Business tax receipts are affected by consumption of gasoline and the Producer Price
Index for Refined Petroleum Products.
Page 85
85
The baseline estimates constructed from the econometric models are then adjusted for changes in
the Tax Law. For instance, revenue forecasts for SFY 2009-2010 were adjusted to account for
the increase in prepayments made in March from 30 to 40 percent of the taxpayer’s prior year
liability. Other baseline adjustments include anticipated refunds and audit and compliance
receipts.
As the fiscal year progresses, revisions are made to the initial forecasts using a number of
trending techniques. Historical ratios of year to date collections to total fiscal year collections
are applied to current fiscal year receipts. Trends in the growth rates of tax liability are also
taken into account. Current year estimates are mainly driven by changes in the growth rates and
ratios of the estimated payments on tax year liability and prior year adjustments made by
calendar year filers.