PRIVATE AND CONFIDENTIAL: 1 New Oriental Education & Technology Group Inc. (New York Stock Exchange: EDU) The Leading Provider of Private Educational Services in China Investor Presentation November 2013
Transcript
PRIVATE AND CONFIDENTIAL: 1
New Oriental Education & Technology Group Inc.(New York Stock Exchange: EDU)The Leading Provider of Private Educational Services in China
Investor PresentationNovember 2013
Forward-Looking Statements
This presentation contains forward-looking statements. These statements are made underthe “safe harbor” provisions of the U.S. Private Securities Litigation Reform Act of 1995.These forward-looking statements can be identified by terminology such as “will,” “expects,”“anticipates,” “future,” “intends,” “plans,” “believes,” “estimates” and similar statements. NewOriental may also make written or oral forward-looking statements in its periodic reports tothe U.S. Securities and Exchange Commission, in its annual report to shareholders, inpress releases and other written materials and in oral statements made by its officers,directors or employees to third parties. Statements that are not historical facts, includingstatements about New Oriental’s beliefs and expectations, are forward-looking statements.Forward-looking statements involve inherent risks and uncertainties. Further informationregarding these risks and uncertainties is included in our registration statement on Form F-1and other documents filed with the Securities and Exchange Commission. New Orientaldoes not undertake any obligation to update any forward-looking statement, except asrequired under applicable law.
2
3
Our Platform
Established in 1993 in Beijing by Michael Minhong Yu IPO on September 7, 2006 on NYSE (EDU) China’s leading private education service provider with the best brand(1)
with approximately 2,560,800 total student enrollments and US$1,013 million revenues in last 12 months Dominant leader in Overseas Test Prep and Consulting business market in enrollments
with approximately 331,700 and revenues with US$383 million in last 12 months Market leader in K-12 after school tutoring market in enrollments with approximately
1,497,000 and revenues with US$441 million in last 12 months Market leader in English language training market in enrollments with approximately
566,900 and revenues with US$112 million in last 12 months(2)
Fast growing business of VIP and online VIP (one-teacher-to-maximum-five-students) program in enrollments with approximately
125,400 and cash revenues with US$299 million in last 12 months Market leader in online K - College with over 8.6 million cumulative registered users and
159,100 paid users in last 12 months
GeographicFootprint /
Scale
Nationwide network – 713 learning centers including 57 schools in 50 cities across China; 32 bookstores and over 5,000 third-party bookstores; extensive online platform
“One-Stop” shop for K – College Most extensive program and service offerings for students age 5-25 Over 16,200 highly qualified teachers located across China
(1) Based on number of program offerings, total student enrollments and geographic presence (2) Excluding K-12 afterschool English language enrollments
Our Business /Our Brand
Large classes Small classes 1-to-1 classes Online classes
The Trusted, Lifelong “One-Stop” Education Ecosystem for Chinese Families
Age 4-12
Age 18+
Overseas Tests : GRE, GMAT, TOEFL, IELTS, BEC,TOEIC Domestic Tests : Kaoyan (post-graduate entrance exam), CET-4, CET-6, PETS Adult English : New Concept English, Listening and Oral English Other Language : Japanese, Spanish, French, German, Italian Vocational Training :Corporate Training, Marketing, Accounting, HR, IT, PRC Bar etc.
POP Kids English MaxEn English POP Chinese POP Math POP Music POP Art Yangzhou Bilingual Private Boarding School
After School Tutoring: English, Chinese, Math, Physics, Chemistry, Biology, Politics, Geography, History Entrance Exam Prep: SAT, ACT, AP, SSAT, Gaokao (college entrance exam), Zhongkao (high school entrance exam) Private international middle & high school
Inspiring Chinese students of all ages to improve their lives and expand their horizons through a lifelong commitment to education and learning…
• Extensive Nationwide Network • Best Teachers • Best Proprietary Content • Proprietary Computerized Assessment Testing • Best Customer Service and Study Consulting
Best Brand in Chinese Private EducationHighest Brand Awareness and Preference
Brand Preference by Tier City in K-12 After School Tutoring Market
Brand Preference in K-12 After School Tutoring Market (Single Choice)
Source: Deutsche Bank, Decision Fuel, Horizon Research (2013)
New Oriental
66%54% 51%
63% 64%
10%
14%5%
6% 9%
7%
5%
13% 5%
10%
9%
9%
7%
28% 30%19% 14%
3%2%
0%
10%
20%
30%
40%
50%
60%
70%
80%
90%
100%
Beijing Shanghai Chengdu Guangzhou Others
New Oriental 1Smart(Jingrui) TAL(Xueersi)Juren Others
Source: Deutsche Bank, Decision Fuel (2013)
6
42%
41%
28%
43%
55%
48%
4%
70%
Wall Street English
Only Education(Angli)
EF(English First)
EIC(Qide)
Global IELTS
New Channel(Xin Hang Dao)
Not aware of any
Best Brand in Chinese Private EducationHighest Brand Awareness and Preference
Which of the training schools (for overseas test prep & study) are you aware of? (Multiple Answers)
Source: Deutsche Bank, Decision Fuel (2013)
New Oriental
7
Best Brand in Chinese Private EducationHighest Brand Awareness and Preference (Continued)
1st “Influential Brand” awarded to Education Company in China by the Government1st “Influential Brand” awarded to Education Company in China by the Government
2009 Top 10 Most Influential Chinese Education Company by Some Top Media in China2009 Top 10 Most Influential Chinese Education Company by Some Top Media in China
2008 Top 10 Education Brand During China 30 Years of Reform and Opening-up by Chinese Education Media2008 Top 10 Education Brand During China 30 Years of Reform and Opening-up by Chinese Education Media
2009 Outstanding Contribution of China Education by Some Top Internet Media in China2009 Outstanding Contribution of China Education by Some Top Internet Media in China
8
China’s Leading Private Education ProviderTop Academic Performance
New Oriental students achieved the No.1 Gaokao Test Score in 6 provinces in 2011, 2012 and 2013
Gaokao High
Score
Province CityNo.1 No.2 No.3 No.1 No.2 No.3
2011TianjinShaanxiGuangxiGuangdong
Shaanxi Gansu Shenzhen Harbin
2012GansuShaanxiGuangdongHeilongjiang
Shaanxi JilinHarbinLuoyang
Wuhan
2013Shaanxi Hunan (2) Shenzhen
LuoyangTangshan (2)Zhenjiang
9
Large and Rapidly Growing Market Opportunity
Source: China Education Year Book, Deutsche Bank Research
English Language Training Market in China
2009 – 2014E CAGR: 25%(US$ in billions)
4.5
5.6
7.0
8.7
10.9
13.6
2009E 2010E 2011E 2012E 2013E 2014E
No. of Chinese Students Studying Abroad
134 144
200229
285
340
400
2006 2007 2008 2009 2010 2011 2012
2006 – 2012 CAGR: 20%(in thousand)
Overseas Test Prep and English Language Training Market in China
Large and Rapidly Growing Market Opportunity
After School Tutoring Market in China
Total Spending on After School Tutoring
No. of Students Enrolled in After School Tutoring
Source: IDC Report
2009 – 2014E CAGR: 3%(in millions)
2009 – 2014E CAGR: 13%(US$ in billions)
115.5
117.9
121.5
124.4
127.9
131.8
2009 2010 2011E 2012E 2013E 2014E
19.4
21.5
23.9
26.3
29.2
32.5
2009 2010 2011E 2012E 2013E 2014E
10
11
Xuzhou *(7)
Dalian *(10)
Shijiazhuang * (10)
Market Leader with Unparalleled National ScaleLargest Private Education Network in China
As of August 31, 2013, we had 57 schools and 713 learning centers (including the 57 schools) in 50 cities
Harbin* (15)
Changchun* (36)
Shenyang* (27)
Beijing* (67)
Tianjin* (34)
Taiyuan* (23)Zhengzhou* (30)
Xiangyang (8)
Xi’an* (20)
Chengdu* (17)
Chongqing* (12)
Changsha* (19)
Zhuzhou (3)Guangzhou* (30)
Shenzhen (16)
Jinan * (20)
Zhenjiang (2)
Nanjing* (16)Shanghai* (51)Suzhou* (12)
Hangzhou* (25)
Wuhan* (46)
* Bookstore Available(#) Number of Learning Centers
Foshan (4)
Anshan (3)
Kunming * (26)
Wuxi (7)
Hefei* (12)
Fuzhou * (11)
Nanchang *(18)
Yichang(1)
Jingzhou(3) Ningbo* (5)
Lanzhou* (9)
Huangshi (3)
Qingdao *(7)
Xiamen * (11)Nanning (6)
Yangzhou (1)
Xiangtan(1)
Luoyang *(4)
Nantong (1)
Jilin (3)
Guiyang (4)
Hohhot* (5)
Tangshan (4)
Urumchi* (5)
Shiyan (3)
12
New Oriental’s primary geographic expansion include about 140 Chinese cities with total population of >200 million people
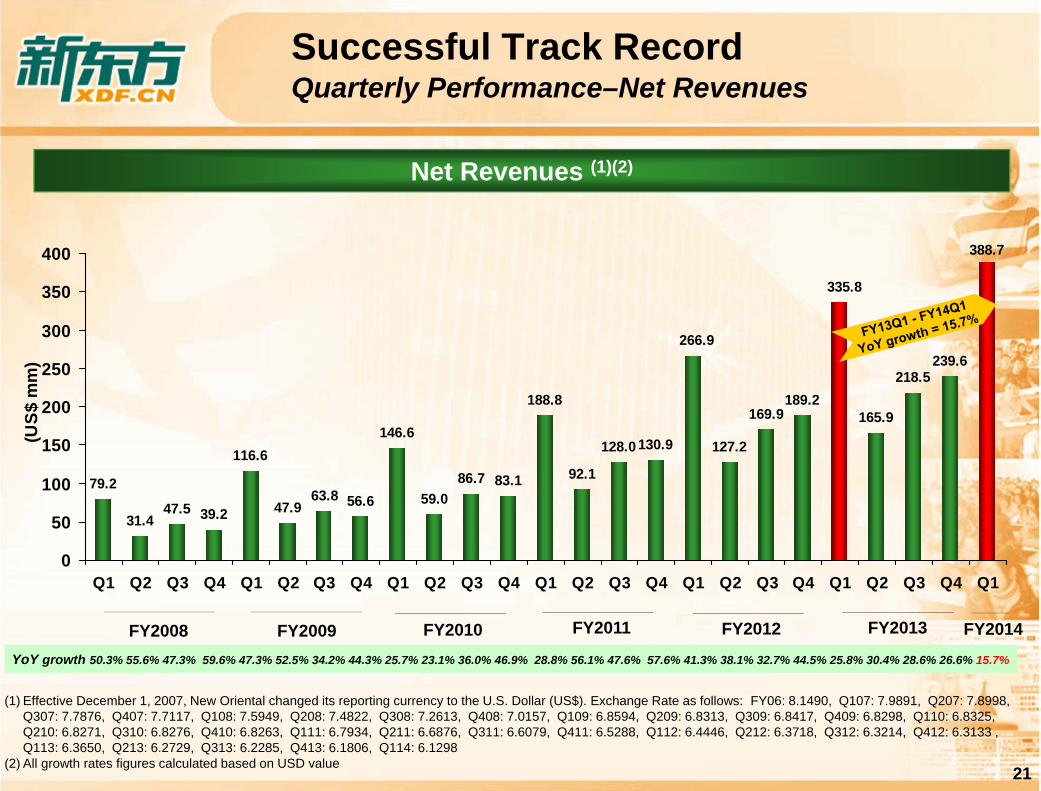
(1) Effective December 1, 2007, New Oriental changed its reporting currency to the U.S. Dollar (US$). Exchange Rate as follows: FY06: 8.1490, Q107: 7.9891, Q207: 7.8998, Q307: 7.7876, Q407: 7.7117, Q108: 7.5949, Q208: 7.4822, Q308: 7.2613, Q408: 7.0157, Q109: 6.8594, Q209: 6.8313, Q309: 6.8417, Q409: 6.8298, Q110: 6.8325, Q210: 6.8271, Q310: 6.8276, Q410: 6.8263, Q111: 6.7934, Q211: 6.6876, Q311: 6.6079, Q411: 6.5288, Q112: 6.4446, Q212: 6.3718, Q312: 6.3214, Q412: 6.3133, Q113: 6.3650, Q213: 6.2729, Q313: 6.2285, Q413: 6.1806, Q114: 6.1298
(2) All growth rates figures calculated based on USD value(3) Non-GAAP Net income=Net Income + SBC + Disposal loss – Income from Discont’d Op. (4) GAAP EBITDA =Operating Income + D&A (5) Non-GAAP EBITDA =Operating Income + D&A + SBC + Disposal loss
(US$ in millions)
(US$ in millions)
Successful Track RecordRapid Top and Bottom Line Growth
(2) All growth rates figures calculated based on USD value(3) Operating Income + D&A + SBC – Cash Capital Expenditures (4) Includes both cash and non-cash capital expenditure(5) Capital expenditures in FY11 include US$11.1 million for purchasing
two buildings in Kunming and Wuhan.
Successful Track RecordCapital Efficient and Scalable Business Model
*1 Increase of cash balance by FY07 was due to the net proceeds from our initial public offering in September of 2006*2 Approximately US$63 million cash was used for share buy back program in CY08 *3 Approximately US$30 million cash was used for share buy back program in FY10*4 Approximately US$46.9 million cash was used for special cash dividend in FY13Q2*5 Approximately US$50 million cash was used for share buy back program in FY13Q4(US$28.5 million) and FY14Q1(US$21.5 million)
Free Cash Flow (1)(2)(3)
367487
511.9
289.4 377.3 *3
*2*2
*2
*1
*3*2
706.6
664 (6)
*3*2
893.1
(6) This figure does not include the 1 school and 20 learning centers we acquired from Newave Education in September 2010, because we submitted an arbitration petition alleging breach of contract by the seller of Newave Education, to the China International Economic and Trade Arbitration Commission seeking full refund of the acquisition consideration we had paid. The case was closed in December 2011, and we got the full refund by end of FY2012.
(1) Effective December 1, 2007, New Oriental changed its reporting currency to the U.S. Dollar (US$). Exchange Rate as follows: FY06: 8.1490, Q107 : 7.9891, Q207: 7.8998, Q307: 7.7876, Q407: 7.7117, Q108: 7.5949, Q208: 7.4822, Q308: 7.2613, Q408: 7.0157, Q109: 6.8594, Q209: 6.8313, Q309: 6.8417, Q409: 6.8298, Q110: 6.8325, Q210: 6.8271, Q310: 6.8276, Q410: 6.8263, Q111: 6.7934, Q211: 6.6876, Q311: 6.6079, Q411: 6.5288, Q112: 6.4446, Q212: 6.3718, Q312: 6.3214, Q412: 6.3133, Q113: 6.3650, Q213: 6.2729, Q313: 6.2285, Q413: 6.1806, Q114: 6.1298(2) All growth rates figures calculated based on USD value(3) Increase in selling and marking expenses in 07 was due to a refinement of the accounting process which New Oriental implemented in 2006 to allocate some of the personnel and other expenses which were included in the general and administrative expenses to selling and marketing expenses.
(1) Effective December 1, 2007, New Oriental changed its reporting currency to the U.S. Dollar (US$). Exchange Rate as follows: FY06: 8.1490, Q107: 7.9891, Q207: 7.8998, Q307: 7.7876, Q407: 7.7117, Q108: 7.5949, Q208: 7.4822, Q308: 7.2613, Q408: 7.0157, Q109: 6.8594, Q209: 6.8313, Q309: 6.8417, Q409: 6.8298, Q110: 6.8325, Q210: 6.8271, Q310: 6.8276, Q410: 6.8263, Q111: 6.7934, Q211: 6.6876, Q311: 6.6079, Q411: 6.5288, Q112: 6.4446, Q212: 6.3718, Q312: 6.3214, Q412: 6.3133, Q113: 6.3650, Q213: 6.2729, Q313: 6.2285, Q413: 6.1806, Q114: 6.1298
(2) All growth rates figures calculated based on USD value(3) Non-GAAP Net Income=Net Income + SBC + Disposal loss – Income from Discontinued Operations
GAAP Net Income (1)(2)
FY2008
Successful Track RecordQuarterly Performance—Net Income