26
www.oecd.org/eco/surveys/ economic-survey-new-zealand.htm OECD OECD Economics 2015 OECD ECONOMIC SURVEY OF NEW ZEALAND Sustainable and inclusive growth 10 June 2015
| Date post: | 29-Jul-2015 |
| Category: |
Economy & Finance |
| Upload: | wendy-stokle |
| View: | 3,914 times |
| Download: | 0 times |

www.oecd.org/eco/surveys/economic-survey-new-zealand.htm
OECD
OECD Economics
2015 OECD ECONOMIC SURVEY OF NEW ZEALAND
Sustainable and inclusive growth
10 June 2015
2
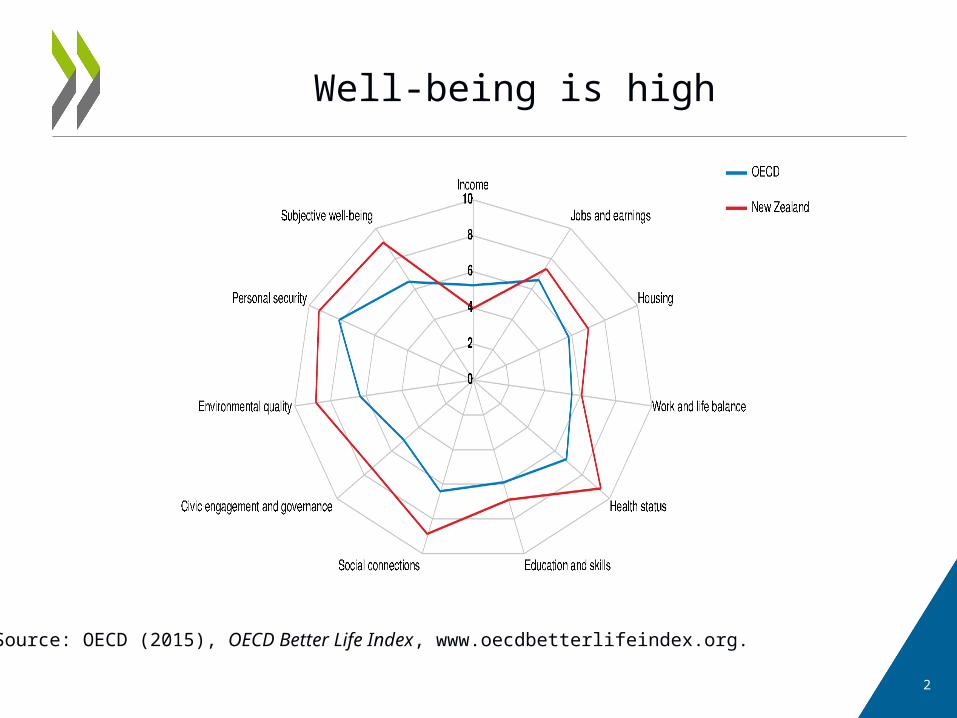
Well-being is high
Source: OECD (2015), OECD Better Life Index, www.oecdbetterlifeindex.org.

3
Per capita income growth is good
Source: OECD, National Accounts and Economic Outlook database.
4
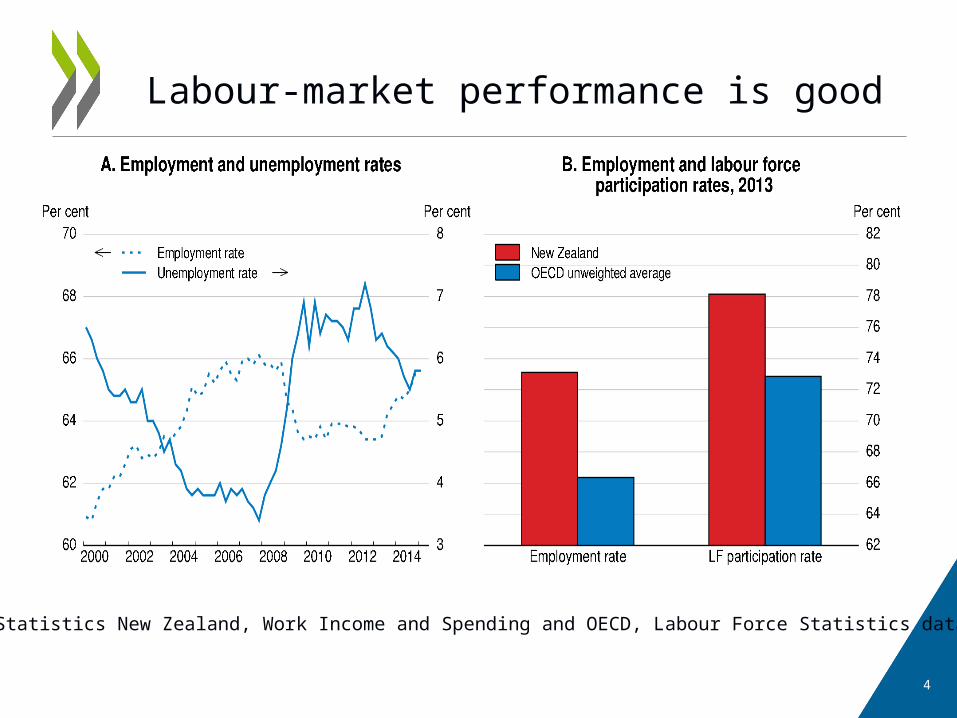
Labour-market performance is good
Source: Statistics New Zealand, Work Income and Spending and OECD, Labour Force Statistics database.

5
House prices are high
Source: OECD, Housing Prices database.
6
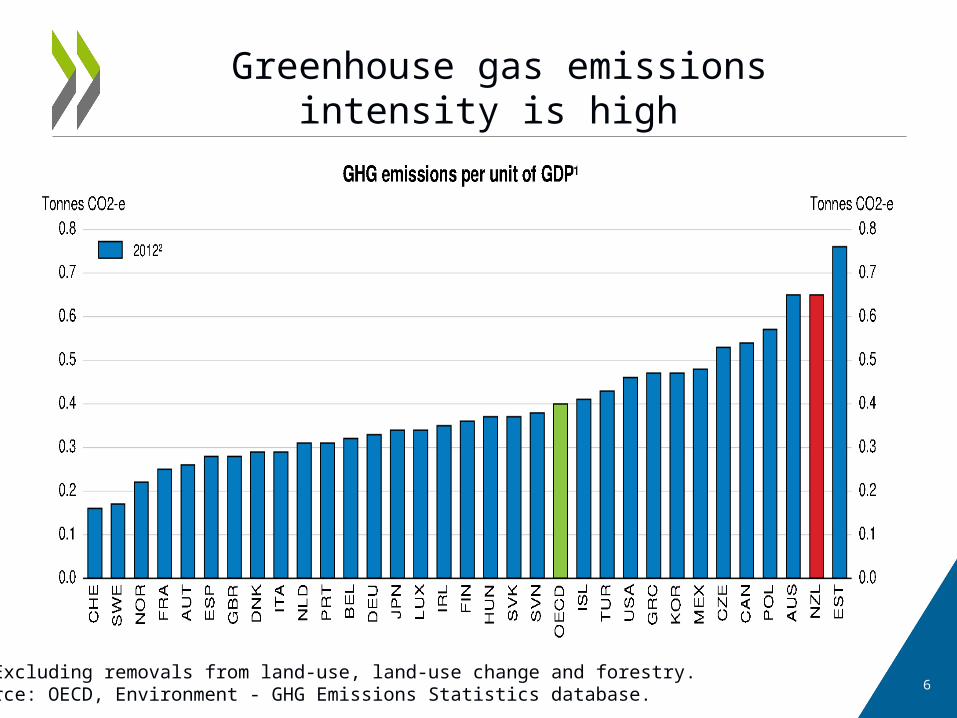
Greenhouse gas emissions intensity is high
1. Excluding removals from land-use, land-use change and forestry.Source: OECD, Environment - GHG Emissions Statistics database.

7
Income inequality has increased to above the OECD average
Source: Calculations from the OECD Income Distribution database, www.oecd.org/social/income-distribution-database.htm .

8
Main Findings
o The economy has performed well in recent years, and well-being is high.
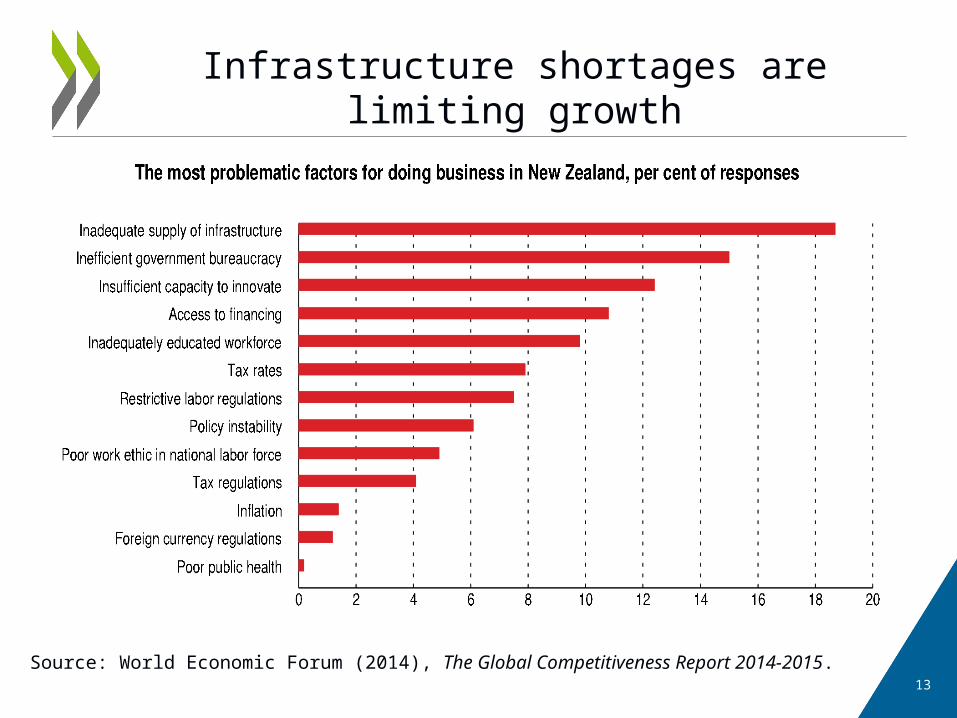
o Bottlenecks could limit the economic expansion, especially housing and infrastructure shortages in Auckland.
o Growth in greenhouse gas (GHG) emissions continues almost unabated, and expansion in the dairy industry is harming water quality.
o Māori, Pasifika and low-income households tend to be worse off than others in terms of income, housing, health and education outcomes.

9
Key Recommendations
To increase housing supply, reduce the cost of environmental and planning regulations and the scope for vested interests to thwart rezoning.
To reduce infrastructure bottlenecks, implement infrastructure demand management and diversify revenue sources for local governments.
Strengthen the Emissions Trading Scheme, and develop a strategy to cut agricultural GHG emissions.
Complement the welfare reform by following up people going off benefit and focusing social spending more on improving long-term outcomes.
Get more effective teachers into struggling schools. Increase early childhood education.

Sustaining the economic expansion

11
House price growth has been uneven
House prices have increased the most in Auckland
About two-thirds of population growth is centred here
High house prices pose financial stability risks
Source: Real Estate Institute of New Zealand.

12
Housing affordability is eroding in Auckland
To increase housing supply, reduce the cost of environmental and planning regulations and the scope for vested interests to thwart rezoning.
Source: Reserve Bank of New Zealand, Financial Stability Report, May 2015.
13
Infrastructure shortages are limiting growth
Source: World Economic Forum (2014), The Global Competitiveness Report 2014-2015.
14
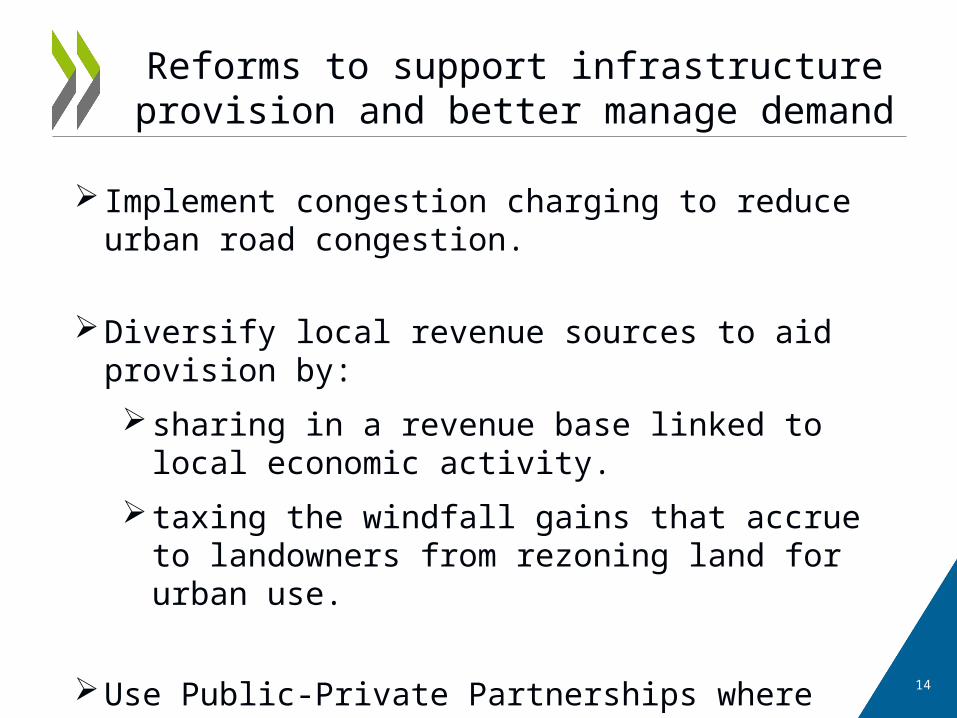
Reforms to support infrastructure provision and better manage demand
Implement congestion charging to reduce urban road congestion.
Diversify local revenue sources to aid provision by:
sharing in a revenue base linked to local economic activity.
taxing the windfall gains that accrue to landowners from rezoning land for urban use.
Use Public-Private Partnerships where efficiency gains outweigh higher private-sector borrowing costs.
15
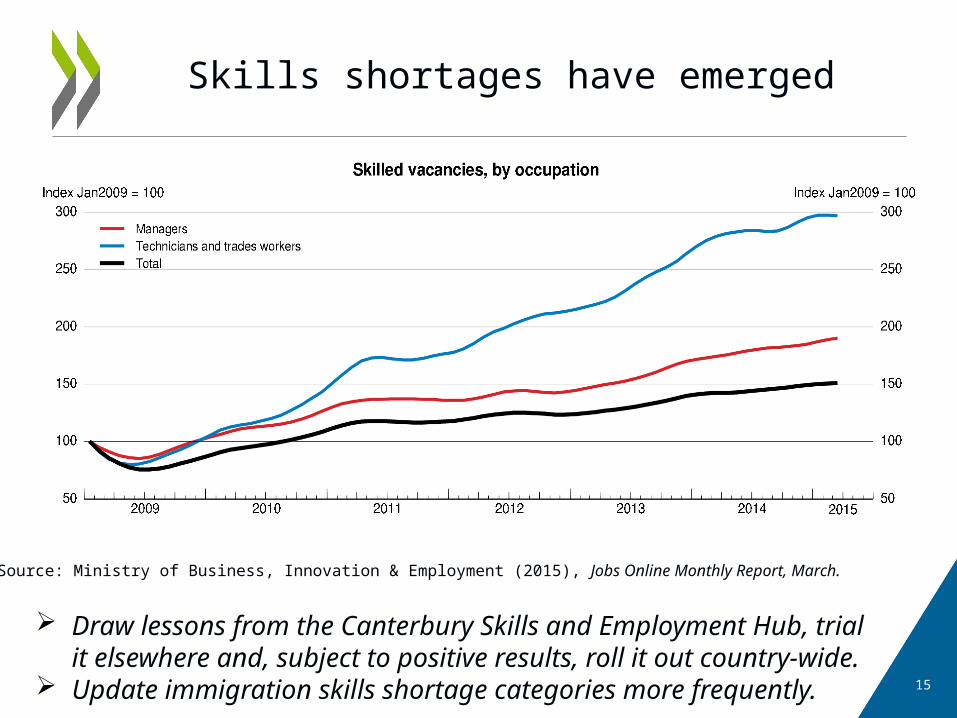
Skills shortages have emerged
Draw lessons from the Canterbury Skills and Employment Hub, trial it elsewhere and, subject to positive results, roll it out country-wide.
Update immigration skills shortage categories more frequently.
Source: Ministry of Business, Innovation & Employment (2015), Jobs Online Monthly Report, March.

Policies to enhance environmental sustainability
17
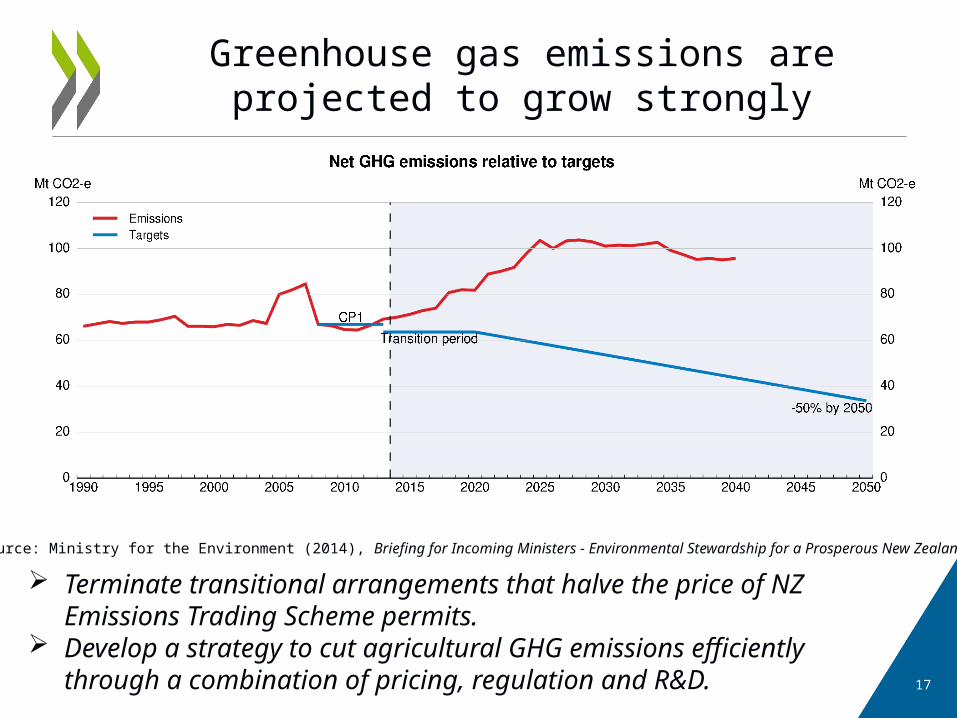
Greenhouse gas emissions are projected to grow strongly
Terminate transitional arrangements that halve the price of NZ Emissions Trading Scheme permits.
Develop a strategy to cut agricultural GHG emissions efficiently through a combination of pricing, regulation and R&D.
Source: Ministry for the Environment (2014), Briefing for Incoming Ministers - Environmental Stewardship for a Prosperous New Zealand.

18
The dairy expansion has reduced water quality
Monitor and provide clearer technical guidance for regional councils implementing environmental regulations to meet water quality goals.
Improve the comparability and reliability of environmental data.
Source: OECD/Eurostat Agri-Environmental Indicators Database; OECD Aglink database; Statistics New Zealand.
Making growth more inclusive
20
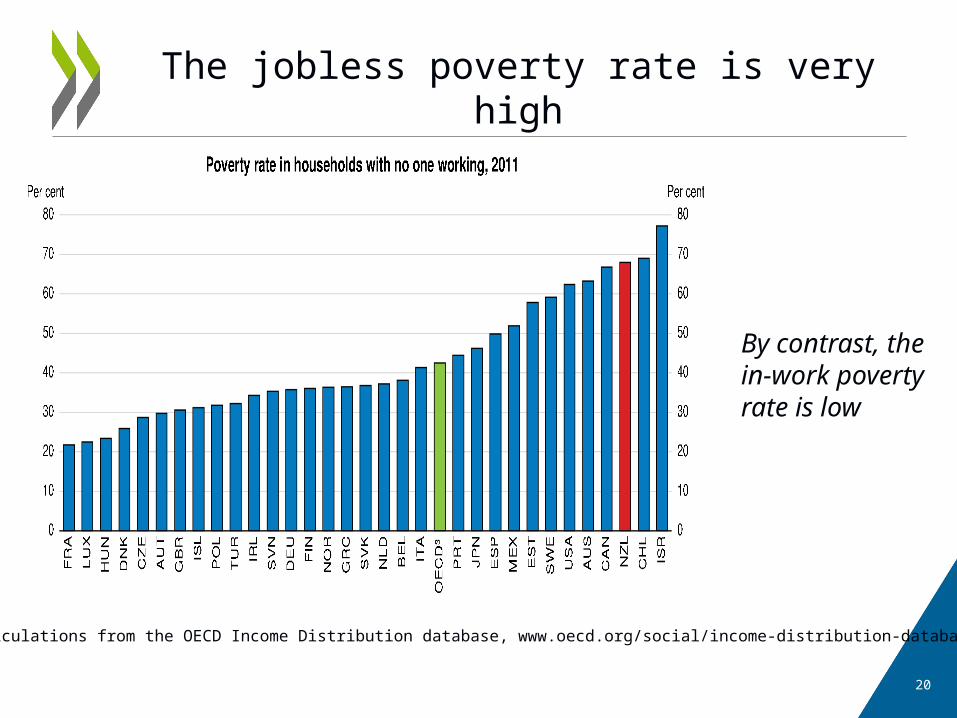
The jobless poverty rate is very high
By contrast, the in-work poverty rate is low
Source: Calculations from the OECD Income Distribution database, www.oecd.org/social/income-distribution-database.htm.
21
Welfare reform to reduce poverty
Complement the recent welfare reform by following up people going off benefit.
Increase welfare benefits and step up job-search and activation investments.
Review benefit abatement rates and childcare costs to strengthen incentives for those on low incomes to work more than 20 hours per week.
22
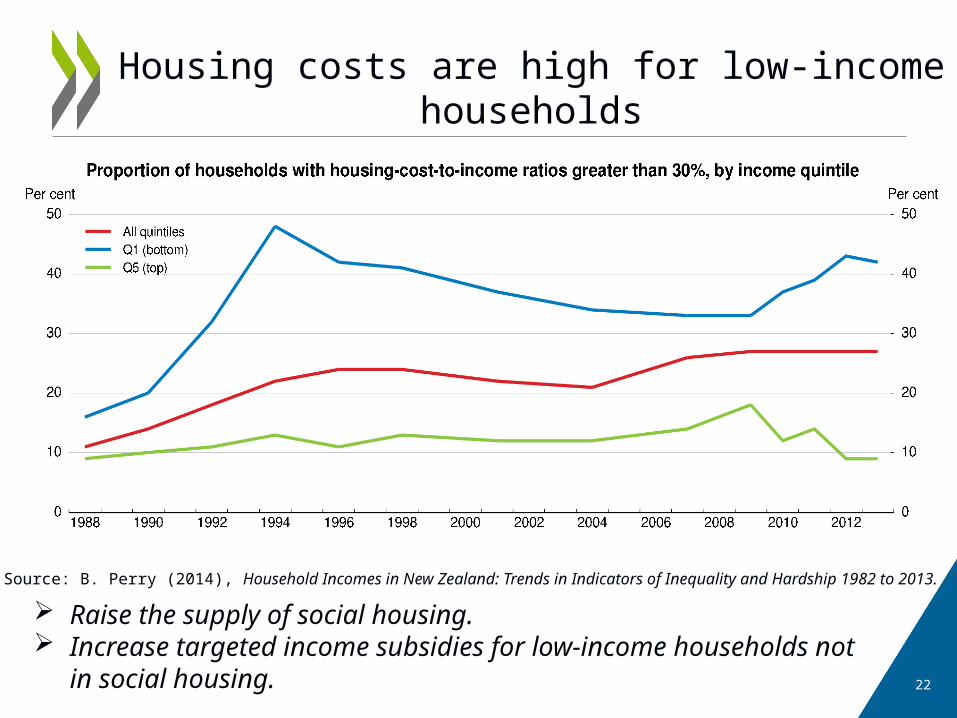
Housing costs are high for low-income households
Raise the supply of social housing. Increase targeted income subsidies for low-income households not
in social housing.
Source: B. Perry (2014), Household Incomes in New Zealand: Trends in Indicators of Inequality and Hardship 1982 to 2013.
23
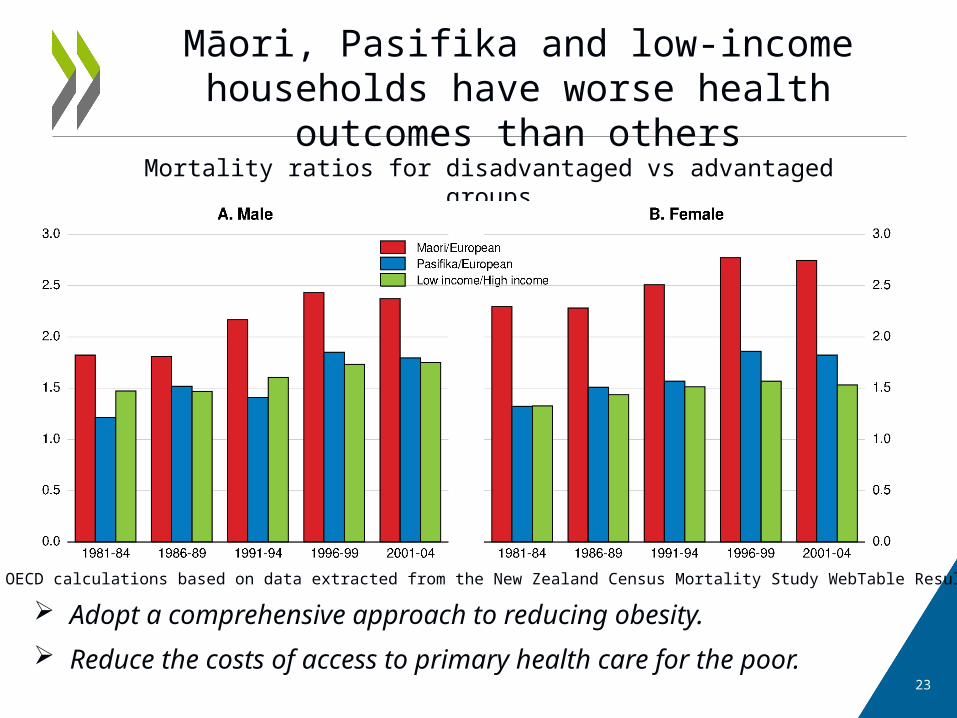
Māori, Pasifika and low-income households have worse health outcomes than others
Adopt a comprehensive approach to reducing obesity.
Reduce the costs of access to primary health care for the poor.
Mortality ratios for disadvantaged vs advantaged groups
Source: OECD calculations based on data extracted from the New Zealand Census Mortality Study WebTable Results .

24
Socio-economic background has a large effect on education outcomes
Source: OECD (2014), PISA 2012 Results: Excellence through Equity: Giving Every Student the Chance to Succeed, Vol. II.

25
Education reforms to improve outcomes for individuals in disadvantaged groups
Meet the 98% participation target for early childhood education; and ensure high quality.
Provide more financial support to recruit and retain effective teachers in schools with achievement challenges.
Strengthen measures to help school boards and staff use data to improve outcomes.

More Information…
www.oecd.org/eco/surveys/economic-survey-new-zealand.htm
OECD
OECD Economics
Disclaimers: The statistical data for Israel are supplied by and under the responsibility of the relevant Israeli authorities. The use of such data by the OECD is without prejudice to the status of the Golan Heights, East Jerusalem and Israeli settlements in the West Bank under the terms of international law.This document and any map included herein are without prejudice to the status of or sovereignty over any territory, to the delimitation of international frontiers and boundaries and to the name of any territory, city or area.
26


