23
Infrastructure Policy Priorities for New Zealand

Infrastructure Policy Priorities for
New Zealand
• The problem
• Transport investment – international comparisons
• Funding gap
• Solutions:
– Debt financing: Infrastructure Bonds, PPPs
– Tax Increment Financing – TIF
– Asset sales
– Network access charge proposal

• Congestion key issue
– Auckland’s congestion worse than
much larger Australian cities
• Underdeveloped public transport
networks
• Freight load expected to double over
the next two decades
• High inbound & outbound shipping
costs
• Poor safety margins across state
highway network
– Yet tourism No 1 export earner
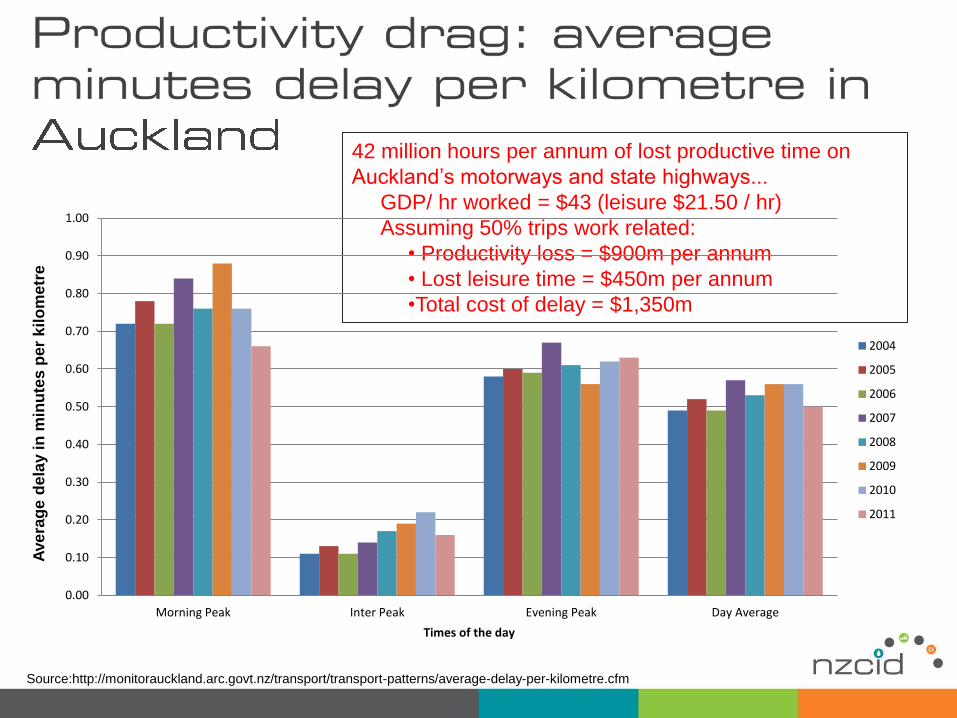
42 million hours per annum of lost productive time on
Auckland’s motorways and state highways...
GDP/ hr worked = $43 (leisure $21.50 / hr)
Assuming 50% trips work related:
• Productivity loss = $900m per annum
• Lost leisure time = $450m per annum
•Total cost of delay = $1,350m
Source:http://monitorauckland.arc.govt.nz/transport/transport-patterns/average-delay-per-kilometre.cfm
0.00
0.10
0.20
0.30
0.40
0.50
0.60
0.70
0.80
0.90
1.00
Morning Peak Inter Peak Evening Peak Day Average
Ave
rag
e d
ela
y i
n m
inu
tes
per
kil
om
etr
e
Times of the day
2004
2005
2006
2007
2008
2009
2010
2011
0
200
400
600
800
1000
1200
1400
1600
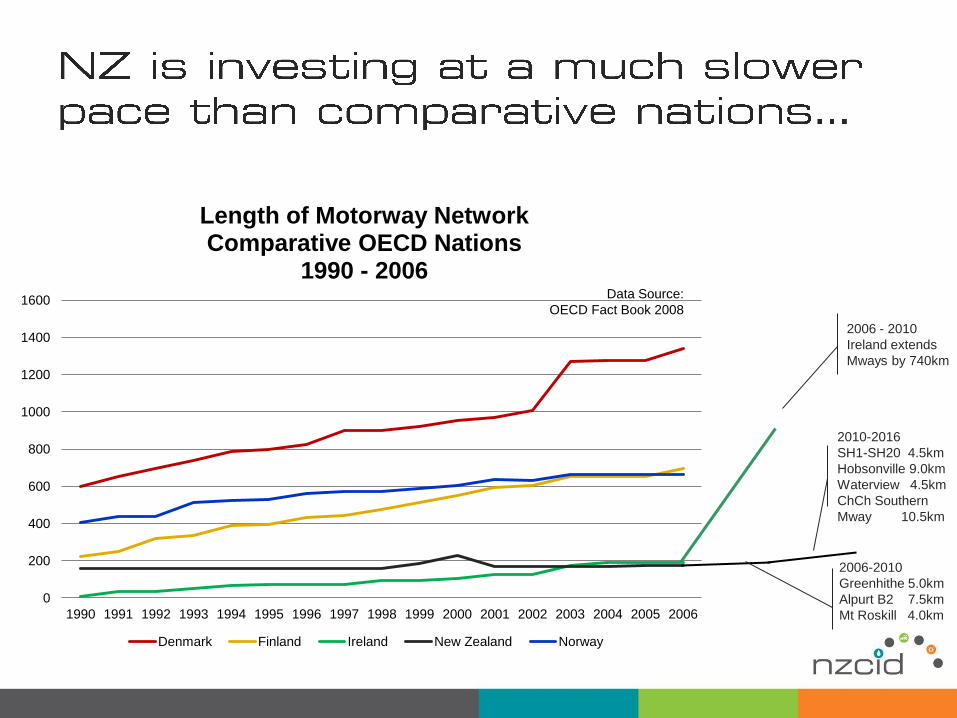
1990 1991 1992 1993 1994 1995 1996 1997 1998 1999 2000 2001 2002 2003 2004 2005 2006
Length of Motorway Network Comparative OECD Nations
1990 - 2006
Denmark Finland Ireland New Zealand Norway
Data Source:
OECD Fact Book 2008
2010-2016
SH1-SH20 4.5km
Hobsonville 9.0km
Waterview 4.5km
ChCh Southern
Mway 10.5km
2006-2010
Greenhithe 5.0km
Alpurt B2 7.5km
Mt Roskill 4.0km
2006 - 2010
Ireland extends
Mways by 740km

Ernst Young
calculated the total
economic
contribution of
Sydney’s toll road
network to the NSW
economy was a net
economic present
value of $22.7
billion…
Ernst Young,
July 2008

• Bangladesh, China, India, Indonesia, Israel, Japan,
Malaysia, Pakistan, Philippines, Singapore, Taiwan,
Thailand, United Arab Emirates, South Africa,
Morocco, Croatia, France, Italy, Ireland, The
Netherlands, Norway, Poland, Portugal, Russia,
Slovenia, Spain, Sweden, Switzerland, United
Kingdom, North and South America, Brazil,
Canada, Colombia, Ecuador, Mexico, Panama,
United States, Australia, New Zealand (sort of)

$ million
Puhoi Wellsford 2,300
Northern Busway Extension 600
Waitemata Harbour Crossing 5,300
City Rail Link 2,200
Avondale Southdown Rail 1,000
South Western East Tamaki
Corridor
1,250
AMETI 1,500
3rd Freight Line Papakura to
Port
700
Airport road access & rail loop 1,890
Improved port access 1,000
City Centre Transport
Improvements
520
Arterial Upgrades for freight
and public transport
2,000
State highway pinch points 1,200
Busway to Botany Flat Bush 90
Rail to Albany 6,000
Total 27,550

Project Funding
gap $m
Western Ring Route by 2015 0
Inner City Rail Loop by 2020 (subject to viable transport land development plan) $2,200
AMETI and SH20 to 1 east west connection by 2025 $2,600
Additional Waitemata Harbour Crossing by 2030 (subject to viable transport land development plan)
$5,200
Total funding deficit $10,000
Borrowed over 30 years @ 6% = annual repayments of $700m per annum
Circa: 50% increase in council rates, or 40 cents regional fuel tax

-
200.00
400.00
600.00
800.00
1,000.00
1,200.00
1,400.00
1,600.00
1,800.00
2,000.00
2013 2014 2015 2016 2017 2018 2019 2020 2021 2022
New & improved infrastructure for State highways
Maintenance & operation of State highways
Maintenance & operation of local roads
Renewal of local roads
Renewal of State highways
Public transport services
New & improved infrastructure for local roads
Public transport infrastructure
Walking & cycling facilities
Public Transport Infrastructure
only $36m per annum on average
& non State Highway spending
declining in real terms

0
200,000
400,000
600,000
800,000
1,000,000
1,200,000
1,400,000
1,600,000
09/10 10/11 11/12 12/13 13/14 14/15 15/16 16/17 17/18 18/19
Total Other Programmes Total Commitments Waikato Expressway
WRR Tauranga Eastern Christchurch Motorways
Foxton to Wellington Puhoi to Wellsford Uncommitted Non RoNS
Indicative Funding available from NLTF+tolls
Source: NZTA
Smaller state highway
projects being squeezed –
Not sustainable
Need to increase land
transport revenue

• All forms of debt
• Allow time payment
• Intergenerational equity
• But…
• Where does the money
come from to repay the
debt?
• Council or government
debt
• Infrastructure Bonds
• Public Private
Partnerships
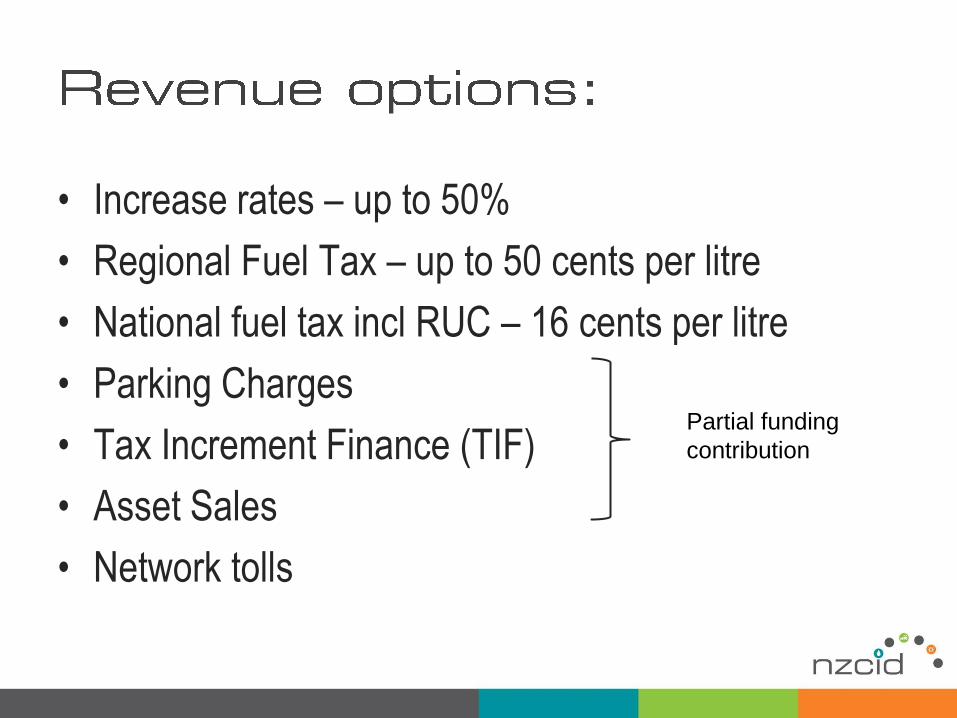
• Increase rates – up to 50%
• Regional Fuel Tax – up to 50 cents per litre
• National fuel tax incl RUC – 16 cents per litre
• Parking Charges
• Tax Increment Finance (TIF)
• Asset Sales
• Network tolls
Partial funding
contribution

Source: Sinclair Knight Mertz

• ACIL manages total
investment assets currently
worth $1.195 billion ($881
million net)
• Returns for Port of Auckland:
• Potentially $400m assuming
49% partial sell down?
• Retain land and sell port
operations?
Kota Jaya, under a Hong Kong flag) in the Port of Auckland,
Ports of Auckland Parent 2010 2011
Return on Assets 6.5% 3.1%
Return on Equity 11.8% 5.7%

• Revenue:
• 915,000 cars / day join the
motorway system
• “Average” $2.00 per car =
$1.8m / day
• = $ 668 m per annum
• NPV $668m per annum over 30
years @ 6% = $9 billion
• Equivalent to… 50% increase in
rates or 40 cents per litre regional
fuel tax
• $9 billion supplemented by other
revenue streams could fund
major transport projects
• Funding source for PPPs etc

• Number plate
recognition
• $6.00 daily cap
• Cost of collection
20%
• Potential for real
time pricing


Excise Tax
Road charging revenue
2010 2020 2030 2040
Fuel Efficiency and Alternative Powered Vehicles
Road User
Charges &
Tolls
GPS based
real time
charging
Total Funding Envelope
Real $$$
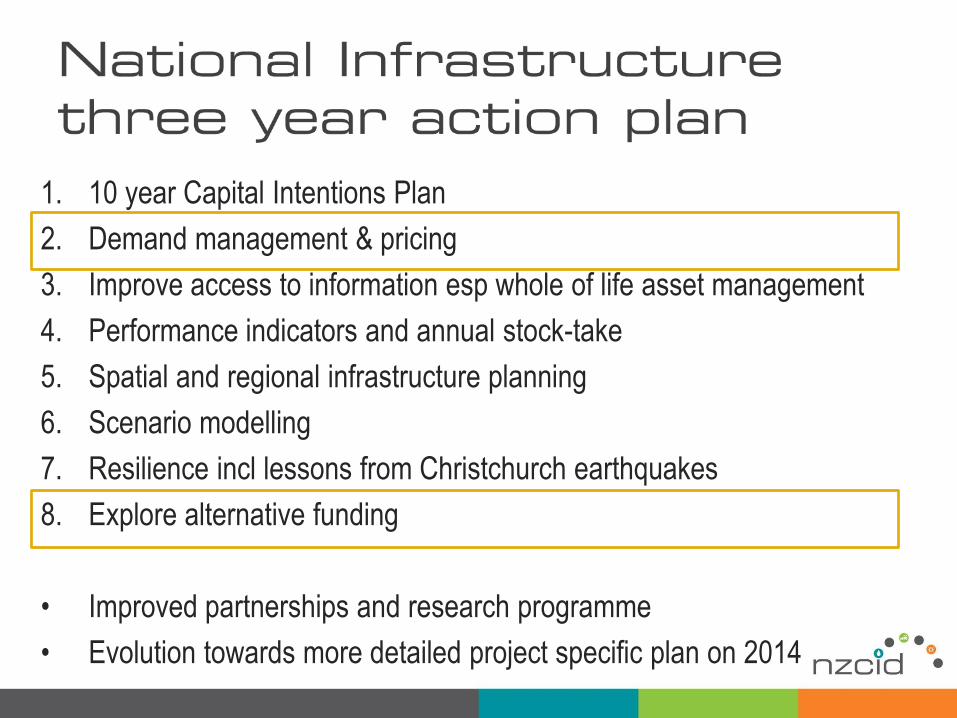
1. 10 year Capital Intentions Plan
2. Demand management & pricing
3. Improve access to information esp whole of life asset management
4. Performance indicators and annual stock-take
5. Spatial and regional infrastructure planning
6. Scenario modelling
7. Resilience incl lessons from Christchurch earthquakes
8. Explore alternative funding
• Improved partnerships and research programme
• Evolution towards more detailed project specific plan on 2014

• Auckland transport system requires
significant investment to support
regional growth
• Current funding methods are
insufficient on their own – both
nationally and regionally
• Debt can be used to enable early
progress but where does the revenue
come from to service the debt?
• TIF, asset sales and parking charges
have potential to part fund new
investment
• Network pricing is means to achieve a
step change in transport funding and
delivering transport network efficiency

More time
with my son
More
trains
More
jobs
done
More
transport
choices
Lower
rates
Faster
trips
More
fares
More
cycle
tracks
More
buses
More
deliveries
More
sales
We car
pool
Greater
efficiency
People support network pricing...