20
News U Can Use March 15, 2019

News U Can Use March 15, 2019

The Week that was…
11th March to 15th March
2

Indian Economy
• India’s retail inflation increased to 2.57% in Feb 2019 as against downwardly revised
1.97% (2.05% originally reported) in Jan 2019 and 4.44% in the same month of the
previous year. The drop came as food prices continued to decline with the consumer food
price index contracting 0.66% in Feb 2019 compared with a revised contraction of 2.24%
(2.17% contraction originally reported) in Jan 2019 but an expansion of 3.26% in the same
month of the previous year.
• The Index of Industrial Production (IIP) declined to 1.7% in Jan 2019 against 2.6% in Dec
2018. For the period from Apr 2018 to Jan 2019, IIP grew 4.4% as against an increase of
4.1% in the same period of the previous year.
• Wholesale Price Index (WPI) based inflation rose to 2.93% in Feb 2019 from 2.76% in the
previous month and 2.74% during the same period of the previous year. The WPI Food
Index also increased from 1.84% in Jan 2019 to 3.29% in Feb 2019.
• India’s trade deficit narrowed to a 17 month low of $9.60 billion in Feb 2019 from $14.73
billion in the previous month and $12.30 billion in the same month of the previous year.
Trade deficit narrowed sharply as imports came down 5.41% over the year to $36.26
billion in Feb 19 from $38.34 billion in the same month of the previous year. Exports
meanwhile increased 2.44% over the year to $26.67 billion in Feb 19 from $26.03 billion in
the same month of the previous year.
3

Indian Equity Market
4
Domestic Equity Market Indices
Indices 15-Mar-19 1 Week Return YTD Return
S&P BSE Sensex 38,024.32 3.69% 5.42%
Nifty 50 11,426.85 3.55% 5.19%
S&P BSE Mid-Cap 15,171.52 2.48% -1.73%
S&P BSE Small-Cap 14,837.18 2.12% 0.89%
Source: MFI Explorer
NSE Advance/Decline Ratio
Date Advances Declines Advance/Decline Ratio
11-Mar-19 1312 524 2.50
12-Mar-19 1193 645 1.85
13-Mar-19 657 1184 0.55
14-Mar-19 775 1056 0.73
15-Mar-19 770 1069 0.72Source: NSE
• Indian equity markets closed on a
positive note in the week ended Mar
15, 2019. Gains reflected a part of what
experts see an election rally. The
Election Commission declared Apr 11,
2019, as the start of the elections and
results will be declared on May 23,
2019. Investors stayed optimistic as
polls suggested the ruling party has
high chances of coming back to power.
• Positive global cues boosted market
sentiment. U.S. retail sales data came
stronger than expected in Jan 2019 and
the U.K. Prime Minister got "legally
binding" guarantees from the European
Union for the modified Brexit deal.
China’s Premier pledging support for
the slowing Chinese economy also
supported sentiment.
• Markets are hoping for another rate-cut
by the Reserve Bank of India (RBI)
considering inflation looks in control.
RatiosS&P BSE
SensexNifty 50
S&P BSE
Mid Cap
S&P BSE
Small Cap
P/E 28.15 28.01 32.83 -125.6
P/B 3.2 3.61 2.63 2.28
Dividend Yield 1.13 1.18 0.96 0.87
Source: BSE, NSE Value as on Mar 15, 2019

Indian Equity Market (contd.)
5
Sectoral Indices
IndicesLast Returns (in %)
Closing* 1-Wk 1-Mth
S&P BSE Auto 19,695.38 1.88% 7.84%
S&P BSE Bankex 32,915.02 5.88% 9.82%
S&P BSE CD 23,037.67 3.23% 9.22%
S&P BSE CG 18,402.40 3.60% 12.13%
S&P BSE FMCG 11,607.90 0.09% 2.19%
S&P BSE HC 14,237.72 1.90% 5.99%
S&P BSE IT 15,158.73 0.84% -1.43%
S&P BSE Metal 11,224.21 1.80% 12.08%
S&P BSE Oil & Gas 14,954.97 4.51% 14.39%
S&P BSE Auto 19,695.38 1.88% 7.84%
S&P BSE Bankex 32,915.02 5.88% 9.82%
S&P BSE Realty 1,951.79 6.54% 12.16%Source: Thomson Reuters Eikon *Value as on Mar 15, 2019
• On the BSE sectoral front, indices closed on
a positive note. S&P BSE Realty was the
major gainer, up 6.54% followed by S&P BSE
Bankex that grew 5.88%.
• Gains in realty stocks likely came following
reports that a global investment firm expects
housing revival is likely towards the end of
2019. Banking stocks likely gained on hopes
of ruling party at the Centre post the
upcoming elections. S&P BSE Oil & Gas and
S&P BSE Capital Goods grew 4.51% and
3.60%, respectively. While, S&P BSE
Consumer Durables grew 3.23%.
Indian Derivatives Market Review
• Nifty Mar 2019 Futures were at 11,470.45, a premium of 43.60 points, over the spot
closing of 11,426.85. The total turnover on NSE’s Futures and Options segment for the
week stood at Rs. 58.92 lakh crore as against Rs. 41.06 lakh crore for the week to Mar 8.
• The Put-Call ratio stood at 0.79 compared with the previous week’s close of 0.87.
• The Nifty Put-Call ratio stood at 1.68 against the previous week’s close of 1.60.
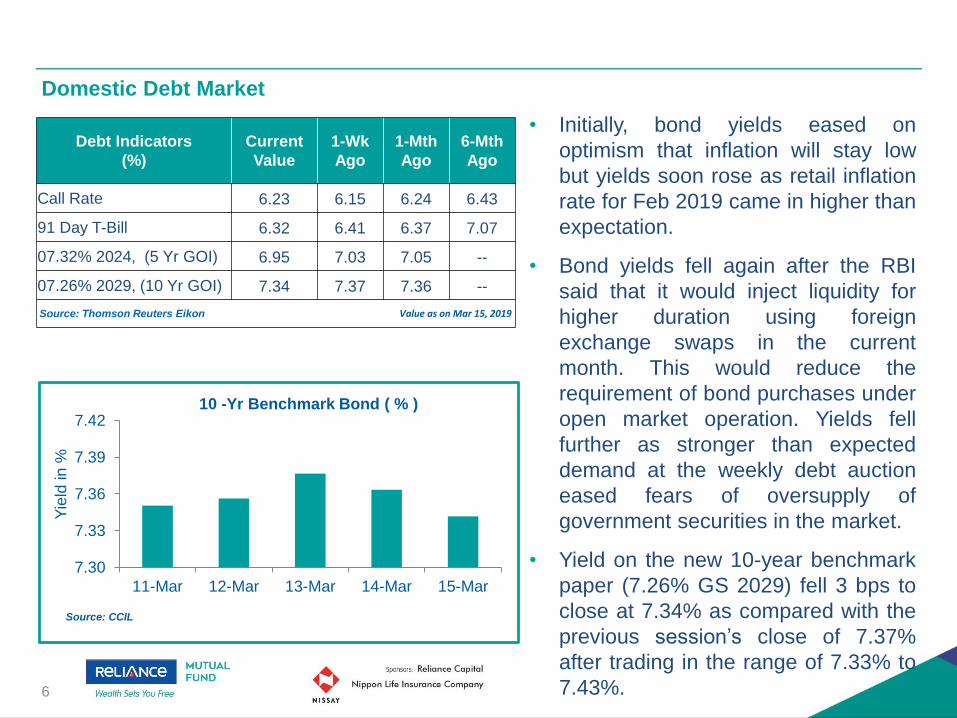
Domestic Debt Market
6
Debt Indicators
(%)
Current
Value
1-Wk
Ago
1-Mth
Ago
6-Mth
Ago
Call Rate 6.23 6.15 6.24 6.43
91 Day T-Bill 6.32 6.41 6.37 7.07
07.32% 2024, (5 Yr GOI) 6.95 7.03 7.05 --
07.26% 2029, (10 Yr GOI) 7.34 7.37 7.36 --
Source: Thomson Reuters Eikon Value as on Mar 15, 2019
• Initially, bond yields eased on
optimism that inflation will stay low
but yields soon rose as retail inflation
rate for Feb 2019 came in higher than
expectation.
• Bond yields fell again after the RBI
said that it would inject liquidity for
higher duration using foreign
exchange swaps in the current
month. This would reduce the
requirement of bond purchases under
open market operation. Yields fell
further as stronger than expected
demand at the weekly debt auction
eased fears of oversupply of
government securities in the market.
• Yield on the new 10-year benchmark
paper (7.26% GS 2029) fell 3 bps to
close at 7.34% as compared with the
previous session’s close of 7.37%
after trading in the range of 7.33% to
7.43%.
7.30
7.33
7.36
7.39
7.42
11-Mar 12-Mar 13-Mar 14-Mar 15-Mar
Yie
ld in
%
10 -Yr Benchmark Bond ( % )
Source: CCIL

Domestic Debt Market (Spread Analysis)
7
MaturityG-Sec Yield
(%)
Corporate Yield
(%)
Spread
bps
1 Year 6.62 8.14 151
3 Year 6.73 8.25 152
5 Year 7.07 8.34 127
10 Year 7.64 8.69 105
Source: Thomson Reuters Eikon Value as on Mar 15, 2019
• Yields on gilt securities fell on 1-year paper,
3 to 7 years’ maturities, and 10-, 12- and 13-
year papers by up to 12 bps. Yields
increased across the remaining maturities
by up to 2 bps.
• Corporate bond yields fell across the
maturities in the range of 2 bps to 9 bps.
The maximum contraction was witnessed on
3-year paper and the minimum on 15-year
paper.
• Difference in spread between AAA corporate
bond and gilt expanded across 1 to 6 years’
maturities by up to 6 bps, closed steady on
7- and 10-year papers and contracted by 4
bps on 15-year paper.
-10
-7
-4
-1
2
6.00
7.00
8.00
9.00
3 Mths 6 Mths 1 Yr 5 Yrs 10 Yrs 20 Yrs 30 Yrs
India Yield Curve Shift (%) (W-o-W)
Change in bps 15-Mar-19 08-Mar-19
Yie
ldin
%C
ha
nge
in b
ps
Source: Thomson Reuters Eikon

Regulatory Updates in India
8
• The government modified rules governing Special Economic Zones (SEZ) to include value
addition earning regulations along with the existing positive net foreign exchange earning
requirement to setup a unit. It has prescribed criteria while renewing its validity. As per the
updated rules, the “prescribed value addition earning requirement” will apply in the proposal
to setup a unit in an SEZ, besides the positive net foreign exchange earning requirement.
• According to media reports, the finance ministry may borrow around 60% of the Rs. 7.1 lakh
crore budgeted gross borrowings for fiscal 2019-20 in its first half (H1) from the market. This
will be done to meet part-redemption, expenditures for welfare schemes and keep the fiscal
deficit in check. The government had borrowed 47.5% of its budgeted full-year target
(gross) through bonds in the first half of 2018-19 -- much lower than the 60-65% in the
corresponding period over the previous five years -- and had dipped more into the National
Small Savings Fund (NSSF) to finance the fiscal deficit as it sought to ease pressure on the
bond market that has witnessed a spurt in yield that time.
• Media reports said, Niti Aayog and the commerce ministry are working on an index to rank
states on their readiness for exports and promote a healthy competition among them. The
export index will rank states on half-a-dozen key parameters, including their policies, ease
of doing business, infrastructure access to finance, and output, which will assess the overall
export market and exports from each state.

Regulatory Updates in India (contd..)
9
• The Election Commission has given the nod for holding the GST Council meeting on Mar
19. The meeting will consider various issues including the implementation of lower GST
rates for the real estate sector. Following the approval from the Election Commission,
notices have been sent from the GST Council Secretariat to states for the 34th meeting of
the Council on Mar 19, media reports said. The nod from the Election Commission was
required as the Model Code of Conduct has been in force since Mar 10, 2019.
• Tax authorities are questioning Indian businesses that paid most of their Goods and
Services Tax (GST) liability using input tax credit or reported significant variation in turnover.
This has upset the industry and prompted it to petition the authorities against such moves.
Tax officials have sent emails seeking information from businesses that paid over 95% of
their dues using input tax credit to ascertain the key factors responsible for subdued GST
collections.
• According to media news, the RBI doesn’t have data on banned Rs. 500 and Rs. 1,000
notes used to pay at petrol pumps, government hospitals, public transport, among others.
The media reports said this citing a reply to Right to Information (RTI) query. RBI said,
referring to a part of the RTI to IRDAI, there is no information on banned notes used to pay
for insurance policies as “it is not maintained by the Authority”.

Global News/Economy
• According to the Commerce Department, U.S. retail sales rose 0.2% in Jan 2019 after
tumbling by a revised 1.6% in Dec 2018. The rebound in retail sales came despite a
substantial decrease in sales by motor vehicle and parts dealers, which nosedived by 2.4%
in Jan 2019 after rising 0.3% in Dec 2018.
• According to a report from the Labor Department, U.S.’ consumer price index (CPI) rose
0.2% in Feb 2019 after remaining unchanged for three consecutive months. The increase in
consumer prices matched economist estimates..
• The Euro zone's industrial production grew in Jan 2019 after declining in the previous two
months. The pace of expansion exceeded expectations, figures from the statistical office
showed. Industrial production increased 1.4% from Dec 2018, when it fell 0.9%.
• The Bank of Japan (BoJ) held its monetary policy steady and maintained interest rate at -
0.1% on current accounts that financial institutions maintain at the bank. The bank decided
to purchase government bonds so that the yield of 10-year JGBs will remain at around 0%. It
stated that it will conduct purchases of Japanese government bonds in a flexible manner so
that the outstanding amount will increase at an annual pace of about JPY 80 trillion.
10

Global Equity Markets
11
Global Indices
Indices 15-Mar-191-Week
Return
YTD
Return
Dow Jones 25,848.87 1.57% 10.81%
Nasdaq 100 7,306.99 4.15% 15.43%
FTSE 100 7,228.28 1.74% 7.43%
DAX Index 11,685.69 1.99% 10.67%
Nikkei Average 21,450.85 2.02% 7.18%
Straits Times 3,200.18 0.13% 4.28%Source: Thomson Reuters Eikon Value as on Mar 15, 2019
U.S.
• U.S. markets traded higher backed by a
series of encouraging economic data. A
report showed unexpected increase in
durable goods orders and rise in U.S.
retail sales in Jan 2019. Buying interest
found additional support from modest
inflation data in Feb 2019, which raised
hopes that the U.S. Federal Reserve
(Fed) may continue to refrain from
raising interest rates anytime soon.Europe
• European markets witnessed gains, with investors taking positive cues from merger-
acquisition news in the banking sector. A series of upbeat earnings, coupled with the
recent developments on Brexit buoyed market sentiment. U.K. lawmakers voted in favour
of delaying the process of exiting from European Union by at least three months, but
decisively rejected a call for a second referendum. Investors also remained hopeful for a
U.S.-China trade deal.
Asia
• Asian markets reflected gains in global peers with U.K. lawmakers backing delay in the
Brexit process and Chinese Premier pledging support for the slowing economy during his
annual news conference at the end of the National People's Congress.
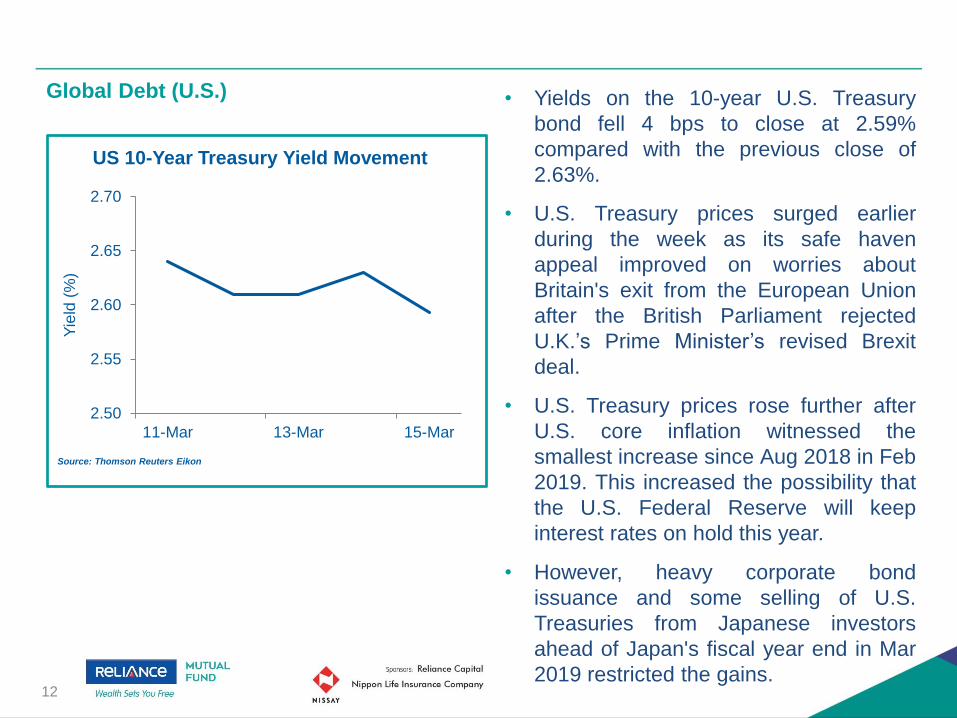
Global Debt (U.S.)
12
• Yields on the 10-year U.S. Treasury
bond fell 4 bps to close at 2.59%
compared with the previous close of
2.63%.
• U.S. Treasury prices surged earlier
during the week as its safe haven
appeal improved on worries about
Britain's exit from the European Union
after the British Parliament rejected
U.K.’s Prime Minister’s revised Brexit
deal.
• U.S. Treasury prices rose further after
U.S. core inflation witnessed the
smallest increase since Aug 2018 in Feb
2019. This increased the possibility that
the U.S. Federal Reserve will keep
interest rates on hold this year.
• However, heavy corporate bond
issuance and some selling of U.S.
Treasuries from Japanese investors
ahead of Japan's fiscal year end in Mar
2019 restricted the gains.
2.50
2.55
2.60
2.65
2.70
11-Mar 13-Mar 15-Mar
Yie
ld (
%)
US 10-Year Treasury Yield Movement
Source: Thomson Reuters Eikon

Commodities Market
13
Performance of various commodities
Commodities Last Closing* 1-Week Ago
Brent Crude($/Barrel) 66.10 63.07
Gold ($/Oz) 1,301.13 1,298.01
Gold (Rs/10 gm) 31,966 32,123
Silver ($/Oz) 15.28 15.31
Silver (Rs/Kg) 37,993 37,826
Source: Thomson Reuters Eikon *Value as on Mar 15, 2019
Gold
• Gold prices inched up as global growth
concerns resurfaced after the Chinese
Premier commented that the Chinese
economy is facing downward pressure.
Also, the BoJ lowered the assessment
of the overseas economies.
Brent Crude
• Brent crude prices jumped after the
Energy Information Administration (EIA)
data revealed a fall in U.S. crude
stockpiles in the last week. Besides,
OPEC-led supply cut for Apr 2019 and
U.S. sanction on Iran and Venezuela
against oil exports supported the
commodity’s prices.
Baltic Dry Index
• The Baltic Dry Index registered a rise on
the back of improved capesize and
panamax activities.
9.40
9.70
10.00
10.30
15-Feb-19 25-Feb-19 7-Mar-19
Global Commodity Movement
Gold Spot ($/Oz) Silver Spot ($/Oz) Brent ($/bbl)
Glo
ba
lC
om
mo
dity P
rice
s
Rebased to 10
Source: Thomson Reuters Eikon
4.80%
0.24%
-0.21%
15-Mar-19

9.40
9.80
10.20
10.60
15-Feb-19 25-Feb-19 7-Mar-19
USD GBP Euro JPYSource: RBI
Cu
rren
cy P
rice
s (
in t
erm
s o
f IN
R)
Rebased to 10 Currency Movement
15-Mar-19
Currencies Markets
14
Movement of Rupee vs Other Currencies
Currency Last Closing* 1-Wk Ago
US Dollar 69.21 70.10
Pound Sterling 91.64 91.80
EURO 78.34 78.55
100 Yen 61.99 63.13
Source: RBI Figures in INR , *Value as on Mar 15, 2019
Rupee
• The rupee rose against the U.S. dollar
initially following downbeat U.S. jobs data
for Feb 2019, gains in the domestic
equity market and greenback selling by
exporters. However, intermittent dollar
purchases by the RBI capped the gains.
Euro
• The euro rose against the greenback on
growing possibility that the U.S. Fed will
keep interest rates on hold for the time
being after U.S. CPI grew for the first
time in four months in Feb 2019 but at a
slow pace.
Pound
• The pound rose against the greenback
initially after the British Parliament
rejected leaving the EU without a deal.
Yen
• The yen weakened against the
greenback after the Bank of BoJ kept its
monetary policy unchanged.
-0.17%-1.27%
-0.27%
-1.81%

The Week that was…
11th March to 15th March
15

The Week that was (Mar 11 – Mar 15)
16
Date EventsPresent
Value
Previous
Value
Monday,
March 11, 2019
• U.S. Retail Sales Advance (MoM) (Jan) 0.20% -1.60%
• Germany Industrial Production (YoY) (Jan) -3.30% -3.90%
Monday,
March 12, 2019
• India Consumer Prices Index (YoY) (Feb) 2.57% 1.97%
• India Index of Industrial Production (YoY) (Jan) 1.70% 2.60%
• U.S. Consumer Prices Index (YoY) (Feb) 1.50% 1.60%
• U.K. Gross Domestic Product (MoM) (Jan) 0.50% -0.40%
• U.K. Industrial Production (YoY) (Jan) -0.90% -0.90%
• U.K. Manufacturing Production (YoY) (Jan) -1.10% -2.10%
Monday,
March 13, 2019
• U.S. Durable Goods Orders (Jan P) 0.40% 1.30%
• Eurozone Industrial Production (YoY) (Jan) -1.10% -4.20%
• U.S. Construction Spending (MoM) (JAN) 1.30% -0.80%
Monday,
March 14, 2019
• India Wholesale Prices Index (YoY) (Feb) 2.93% 2.76%
• China Industrial Production YTD (YoY) (Feb) 5.30% 6.20%
• China Retail Sales YTD (YoY) (Feb) 8.20% 9.00%
• U.S. Export Price Index (YoY) (Feb) 0.30% -0.20%
Monday,
March 15, 2019
• Eurozone Consumer Prices Index (YoY) (Feb F) 1.50% 1.40%
• U.S. Industrial Production (MoM) (Feb) 0.10% -0.60%

17
The Week Ahead
18th March to 22nd March

18
The Week Ahead
Day Event
Monday,
March 18, 2019
• U.K. House Prices (YoY) (Mar)
• Japan Industrial Production (YoY) (Jan F)
• U.S. Housing Market Index (Mar)
Tuesday,
March 19, 2019
• Eurozone Economic Sentiment (Mar)
• Eurozone Current Situation (Mar)
• U.K. Unemployment Rate 3Mths (Jan)
• U.S. Factory Orders (Jan)
Wednesday,
March 20, 2019
• U.S. Federal Reserve Rate Decision
• U.K. Consumer Price Index (YoY) (Feb)
Thursday,
March 21, 2019
• Bank of England Rate Decision
• Japan Consumer Price Index (YoY) (Feb)
• U.S. Leading Index (Feb)
Friday,
March 22, 2019
• U.S. Wholesale Inventories (MoM) (Jan)
• U.S. Existing Home Sales (MoM) (FEB)
Disclaimer
The information herein is meant only for general reading purposes and contains all factual and statistical information pertaining to Industry and markets whichhave been obtained from independent third party sources and which are deemed to be reliable. The information provided cannot be considered as guidelines,recommendations or as a professional guide for the readers. It may be noted that since Reliance Nippon Life Asset Management Company Limited (RNAM) has notindependently verified the accuracy or authenticity of such information or data, or for that matter the reasonableness of the assumptions upon which such dataand information has been processed or arrive data; RNAM does not in any manner assures the accuracy or authenticity of such data and information. Some of thestatements & assertions contained in these materials may reflect RNAM’s views or opinions, which in turn may have been formed on the basis of such data orinformation. The Sponsor(s), the Investment Manager, the Trustee or any of their respective directors, employees, affiliates or representatives do not assume anyresponsibility for, or warrant the accuracy, completeness, adequacy and reliability of such data or information. Whilst no action has been solicited based upon theinformation provided herein, due care has been taken to ensure that the facts are accurate and opinions given are fair and reasonable, to the extent possible. Thisinformation is not intended to be an offer or solicitation for the purchase or sale of any financial product or instrument. Recipients of this information should relyon information/data arising out of their own investigations. Before making any investments, the readers are advised to seek independent professional advice,verify the contents in order to arrive at an informed investment decision. None of the Sponsor(s), the Investment Manager, the Trustee, their respective directors,employees, affiliates or representatives shall be liable in any way for any direct, indirect, special, incidental, consequential, punitive or exemplary damages,including on account of lost profits arising from the information contained in this material.
All information contained in this document has been obtained by ICRA Online Limited from sources believed by it to be accurate and reliable. Although reasonablecare has been taken to ensure that the information herein is true, such information is provided ‘as is’ without any warranty of any kind, and ICRA Online Limited orits affiliates or group companies and its respective directors, officers, or employees in particular, makes no representation or warranty, express or implied, as to theaccuracy, suitability, reliability, timelines or completeness of any such information. All information contained herein must be construed solely as statements ofopinion, and ICRA Online Limited, or its affiliates or group companies and its respective directors, officers, or employees shall not be liable for any losses or injury,liability or damage of any kind incurred from and arising out of any use of this document or its contents in any manner, whatsoever. Opinions expressed in thisdocument are not the opinions of our holding company, ICRA Limited (ICRA), and should not be construed as any indication of credit rating or grading of ICRA forany instruments that have been issued or are to be issued by any entity.
Mutual Fund Investments are subject to market risks, read all scheme related documents carefully.
19

Thank you foryour time.


