IntroductionSeismic attributes have proliferated in the last three dec-ades at a rapid rate and have helped interpreters in mak-ing accurate predictions in hydrocarbon exploration and development. Attributes sensitive to amplitude, such as impedance inversion and AVO, are widely used for litho-logical and petrophysical prediction of reservoir proper-ties. Other attributes, such as coherence and curvature, are particularly useful in mapping the structure and shape of geological features of interest. It is these latter types of attributes that are of interest for fault/fracture characteri-zation, and in this paper we discuss the applications of volu-metric curvature attributes for this purpose.
Horizon-based curvature attributes (Roberts, 2001) have been used in seismic data interpretation for predicting frac-tures ever since Lisle (1994) demonstrated the correlation of curvature values to fractures measured on an outcrop. Dif-ferent measures of curvature (Gaussian, strike, dip, etc.) have been shown by different workers to be highly correlated with fractures (Hart, 2002; Ericsson et al., 1988; Sigismondi and Soldo, 2003; Massaferro et al., 2003); many more applica-tions can be found in Chopra and Marfurt (2007a, 2007b). As the name implies, horizon-based curvature is comput-ed directly from a picked seismic horizon which in gener-al requires that the data quality be good and that the hori-zon of interest corresponds to a prominent impedance con-trast. Horizons picked on noisy surface seismic data or when picked through regions where no continuous surface exists can produce misleading curvature measures. A common means of addressing such problems is to spatially filter the horizon picks, with the goal of removing the noise and retain-ing features of geologic interest (Bergbauer et al., 2003; Cho-pra et al. 2006).
Once picked and filtered, a mathematical quadratic sur-face is fitted to the picked data within a user-defined aper-ture. The different measures of curvature are then comput-ed analytically from the coefficients of the quadratic surface. Roberts (2001) demonstrated the application of different cur-vature attributes including minimum and maximum curva-tures, mean curvature, dip curvature, strike curvature, most-positive and most-negative curvature, and shape index. Of this list, we find the most-positive and most-negative curva-ture measures to be the easiest to directly relate to commonly encountered geologic structural and stratigraphic features.
Instead of beginning with a picked horizon, volumetriccurvature begins by first computing dip and azimuth using a small analysis window (9 traces by +/-10 ms for the examples
Volumetric curvature attributes for fault/fracture characterization
Satinder Chopra1 and Kurt J. Marfurt2
1 Arcis Corporation, Calgary. E-mail: [email protected] University of Houston, Houston
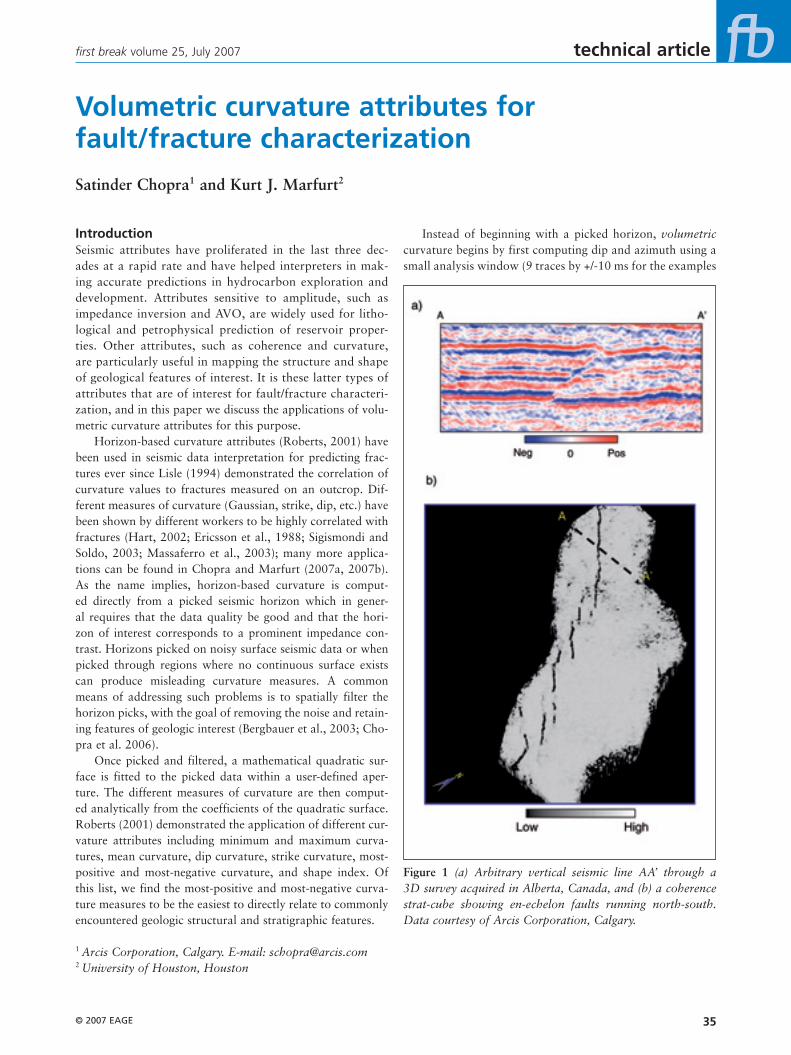
Figure 1 (a) Arbitrary vertical seismic line AA’ through a 3D survey acquired in Alberta, Canada, and (b) a coherence strat-cube showing en-echelon faults running north-south. Data courtesy of Arcis Corporation, Calgary.
technical article first break volume 25, July 2007
shown in the figures that follow) for every point in the 3D volume. By using a vertical analysis window and the analytic (original trace and its Hilbert transform) rather than just the original trace, volumetric estimates of dip and azimuth are in general more robust than horizon-based estimates. Al-Dos-sary and Marfurt (2006) demonstrated that volumetric com-putation of curvature attributes alleviates the need for pick-ing horizons, especially in regions through which no continu-ous surface exists. Chopra and Marfurt (2007a) compare the applications of horizon-based vs. volume-based curvature on land data acquired in Alberta, Canada, and show that volu-metric curvature is less sensitive to acquisition footprint.
Bergbauer et al. (2003) showed that horizon-based cur-vature images having different wavelengths provide differ-ent perspectives of the same geology. Al-Dossary and Mar-furt (2006) generalized this application to volumetric appli-cations. ‘Multispectral’ curvature computation yields both long-wavelength and short-wavelength curvature estimates, which enhance geologic features having different scales. Tight (short-wavelength) curvature often delineates details within intense, highly localized fracture systems. Broad (long-wavelength) curvature often enhances subtle flexures on the scale of 100-200 traces that are difficult to see in conventional seismic, but are frequently correlated to frac-ture zones that are below seismic resolution, as well as to collapse features and diagenetic alterations that result in broader bowls.
Al Dossary and Marfurt (2006) compute multispec-tral volume estimates of curvature by applying ‘fractional derivatives’ to their volumetric estimates of the inline and
crossline components of reflector dip. They define the frac-tional derivative as
where the operator F denotes the Fourier transform, where u is an inline or crossline component of reflector dip, and where is a fractional real number that typi-cally ranges between 1 (giving the first derivative) and 0 (giving the Hilbert transform) of the dip. The nomen-clature ‘fractional derivative’ was borrowed from Coop-er and Cowans (2003); however, an astute mathemati-cian will note that the i is not in the parentheses. In this manner we can interpret the equation above as simply a low pass filter of the form kx
( -1) applied to a convention-al first derivative.
The space domain operators corresponding to different values of mentioned above are convolved with the previ-ously computed dip components estimated at every sample and trace within the seismic volume. In addition, the deriv-atives are applied to a circular rather than linear window of traces, thereby avoiding a computational bias associat-ed with the acquisition axes. Lower values of decrease the contribution of the high wavenumbers, thereby shifting the bandwidth towards longer wavelength. Larger values of shift the spectrum to shorter wavelengths. Since seis-mic data are sampled with spatial aliasing in mind, we find that a value of =0.25 provides excellent ‘long-wavelength’ images while a value of =0.80 provides good ‘short-wave-length’ images.
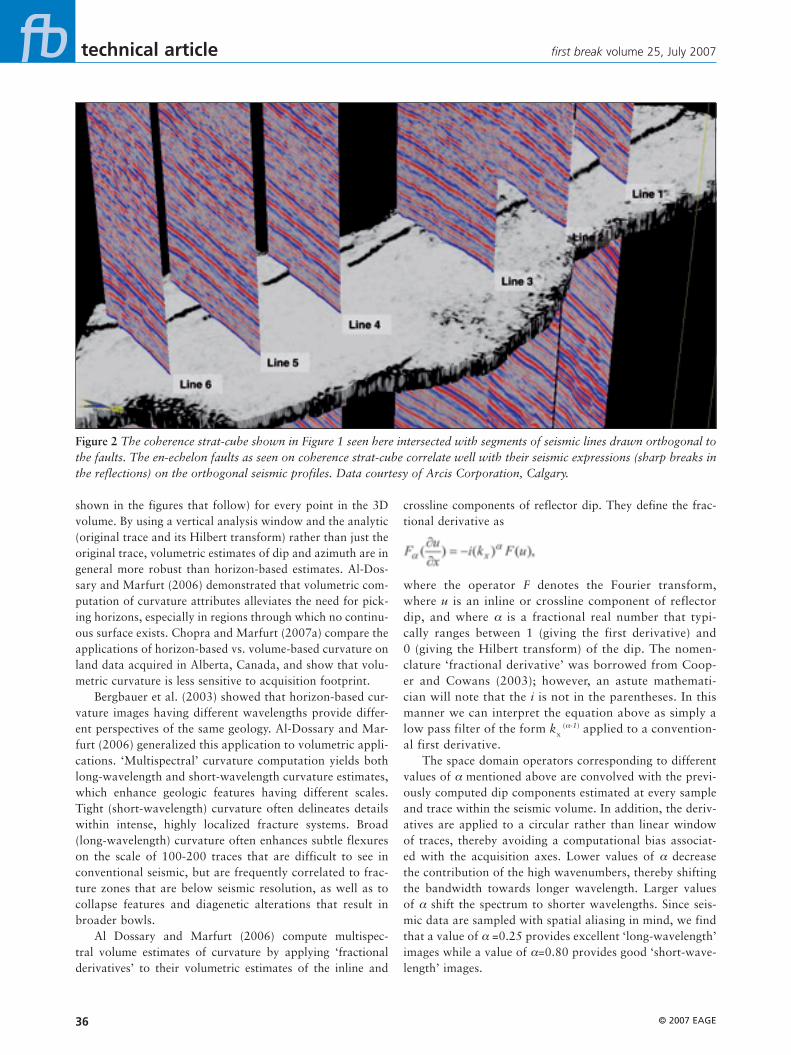
Figure 2 The coherence strat-cube shown in Figure 1 seen here intersected with segments of seismic lines drawn orthogonal to the faults. The en-echelon faults as seen on coherence strat-cube correlate well with their seismic expressions (sharp breaks in the reflections) on the orthogonal seismic profiles. Data courtesy of Arcis Corporation, Calgary.
Example 1Figure 1a shows a vertical seismic section AA’ from a 3D seismic survey from south-central Alberta, Canada that cuts a reverse fault seen in the centre of the section. A coherence strat-cube was created around the black horizon picks on the vertical section to interpret the faults in the area. A strat-cube is a sub-volume of seismic data or its attributes, either bounded by two horizons which may or may not be parallel
or covering seismic data above and/or below a given horizon. Figure 1b shows the coherence strat-cube at the level of the horizon, depicting a clear set of en-echelon faults running almost north-south. The position of the section AA’ is also indicated on the strat-cube display. The addition of relief in the 3D coherence strat-cube display provides a feel for the throw of the faults. By displaying vertical seismic sections perpendicular to features of interest on the strat cube, the
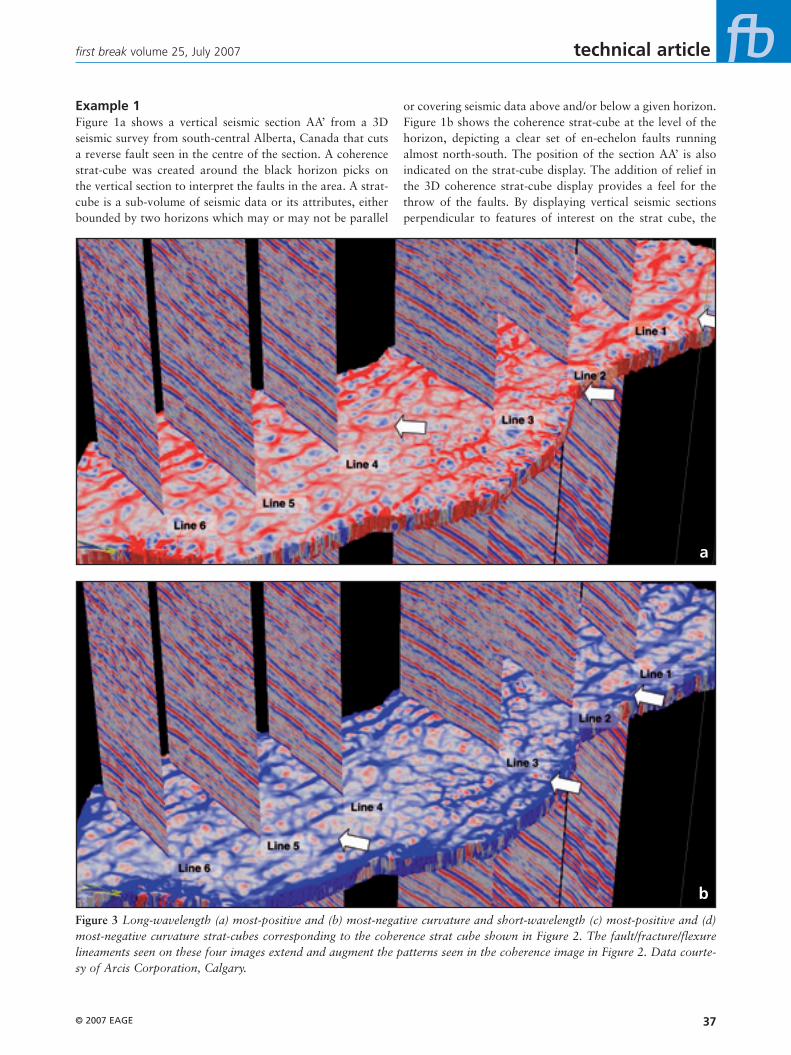
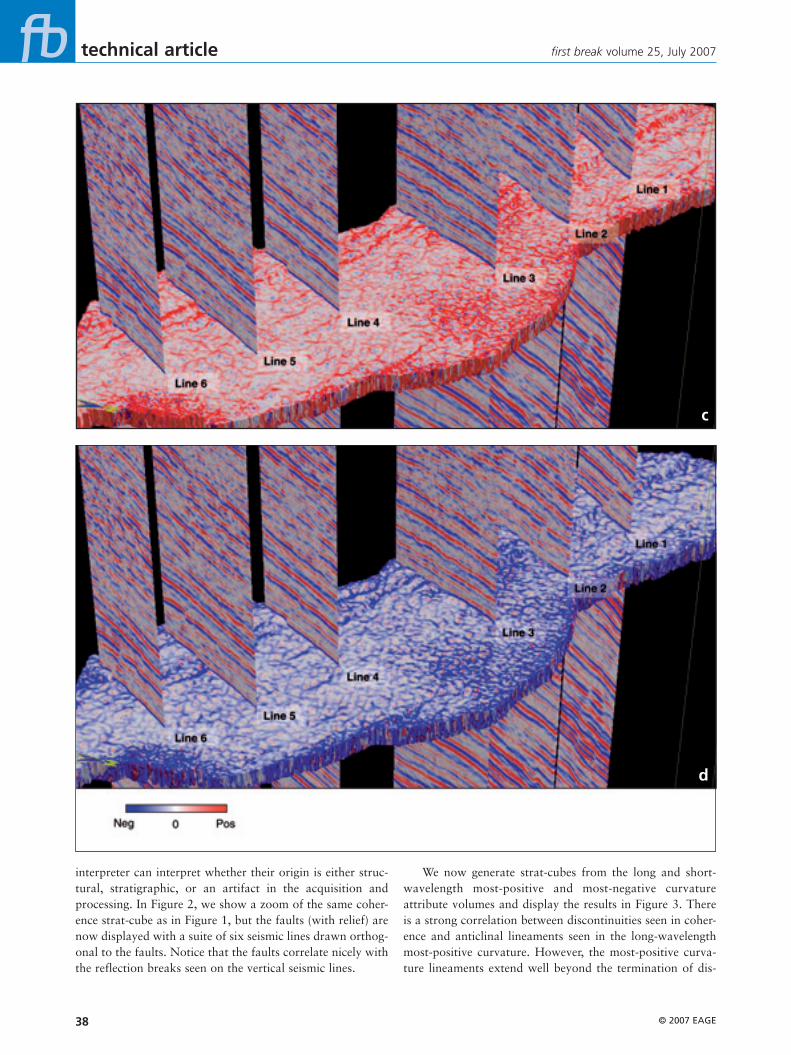
Figure 3 Long-wavelength (a) most-positive and (b) most-negative curvature and short-wavelength (c) most-positive and (d) most-negative curvature strat-cubes corresponding to the coherence strat cube shown in Figure 2. The fault/fracture/flexure lineaments seen on these four images extend and augment the patterns seen in the coherence image in Figure 2. Data courte-sy of Arcis Corporation, Calgary.
technical article first break volume 25, July 2007
interpreter can interpret whether their origin is either struc-tural, stratigraphic, or an artifact in the acquisition and processing. In Figure 2, we show a zoom of the same coher-ence strat-cube as in Figure 1, but the faults (with relief) are now displayed with a suite of six seismic lines drawn orthog-onal to the faults. Notice that the faults correlate nicely with the reflection breaks seen on the vertical seismic lines.
We now generate strat-cubes from the long and short-wavelength most-positive and most-negative curvature attribute volumes and display the results in Figure 3. There is a strong correlation between discontinuities seen in coher-ence and anticlinal lineaments seen in the long-wavelength most-positive curvature. However, the most-positive curva-ture lineaments extend well beyond the termination of dis-
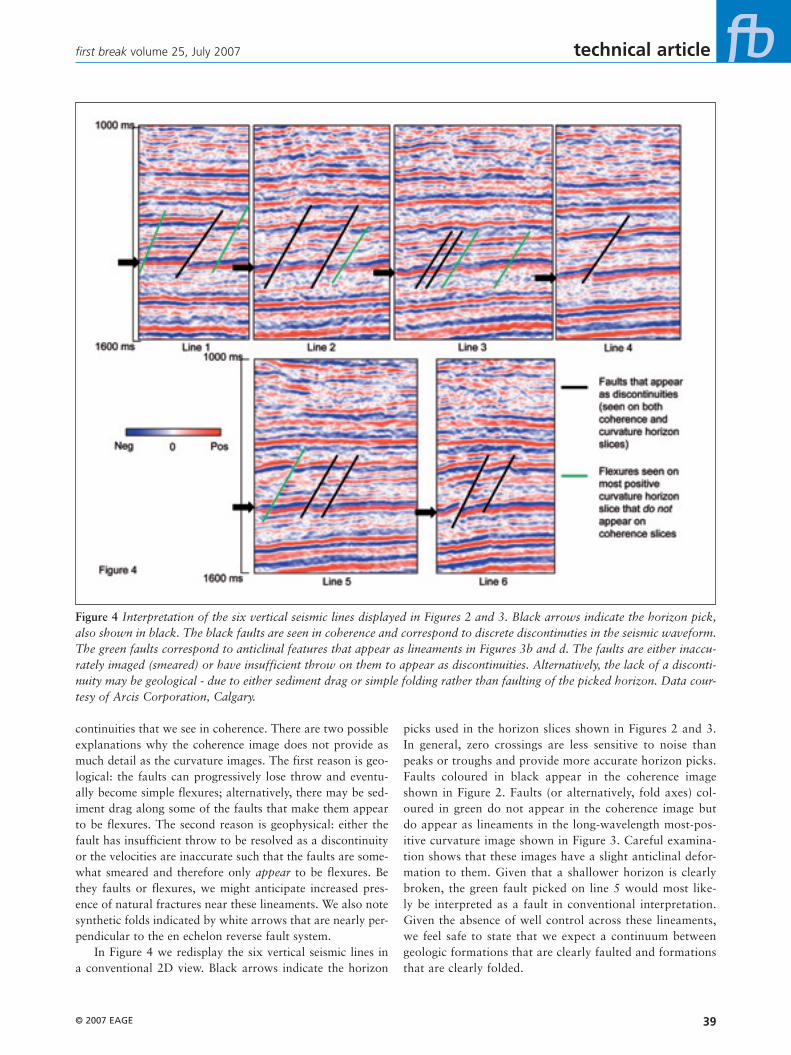
continuities that we see in coherence. There are two possible explanations why the coherence image does not provide as much detail as the curvature images. The first reason is geo-logical: the faults can progressively lose throw and eventu-ally become simple flexures; alternatively, there may be sed-iment drag along some of the faults that make them appear to be flexures. The second reason is geophysical: either the fault has insufficient throw to be resolved as a discontinuity or the velocities are inaccurate such that the faults are some-what smeared and therefore only appear to be flexures. Be they faults or flexures, we might anticipate increased pres-ence of natural fractures near these lineaments. We also note synthetic folds indicated by white arrows that are nearly per-pendicular to the en echelon reverse fault system.
In Figure 4 we redisplay the six vertical seismic lines in a conventional 2D view. Black arrows indicate the horizon
picks used in the horizon slices shown in Figures 2 and 3. In general, zero crossings are less sensitive to noise than peaks or troughs and provide more accurate horizon picks. Faults coloured in black appear in the coherence image shown in Figure 2. Faults (or alternatively, fold axes) col-oured in green do not appear in the coherence image but do appear as lineaments in the long-wavelength most-pos-itive curvature image shown in Figure 3. Careful examina-tion shows that these images have a slight anticlinal defor-mation to them. Given that a shallower horizon is clearly broken, the green fault picked on line 5 would most like-ly be interpreted as a fault in conventional interpretation. Given the absence of well control across these lineaments, we feel safe to state that we expect a continuum between geologic formations that are clearly faulted and formations that are clearly folded.
Figure 4 Interpretation of the six vertical seismic lines displayed in Figures 2 and 3. Black arrows indicate the horizon pick, also shown in black. The black faults are seen in coherence and correspond to discrete discontinuties in the seismic waveform. The green faults correspond to anticlinal features that appear as lineaments in Figures 3b and d. The faults are either inaccu-rately imaged (smeared) or have insufficient throw on them to appear as discontinuities. Alternatively, the lack of a disconti-nuity may be geological - due to either sediment drag or simple folding rather than faulting of the picked horizon. Data cour-tesy of Arcis Corporation, Calgary.
technical article first break volume 25, July 2007
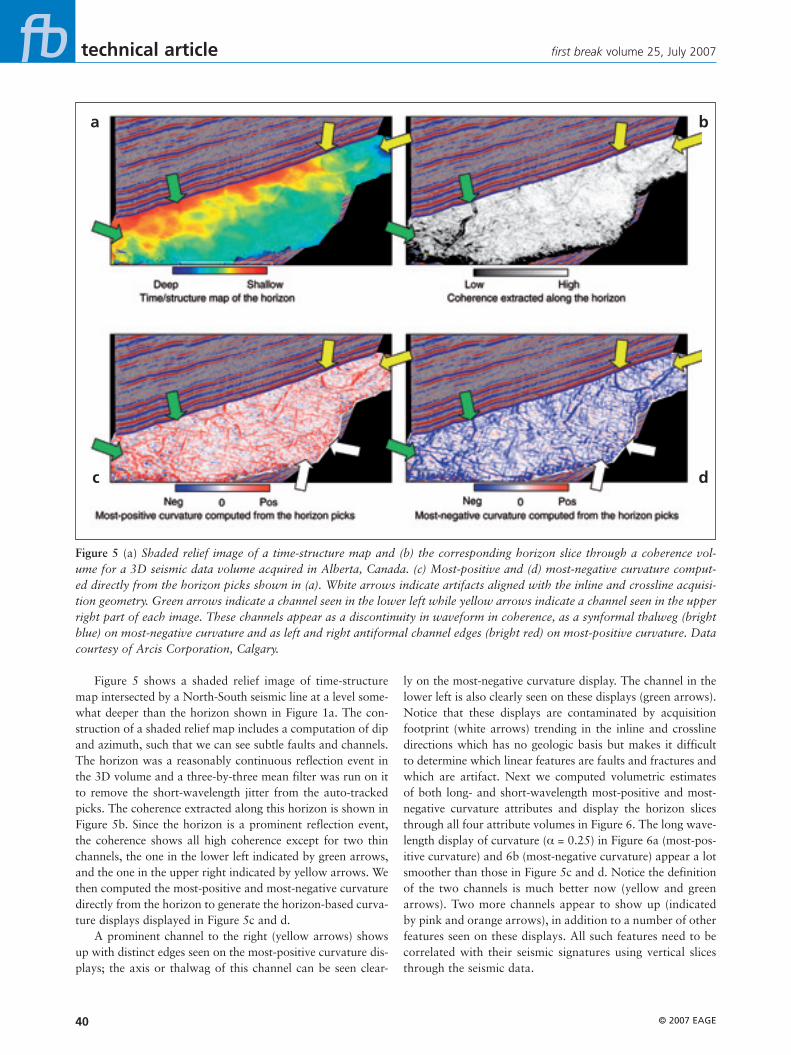
Figure 5 shows a shaded relief image of time-structure map intersected by a North-South seismic line at a level some-what deeper than the horizon shown in Figure 1a. The con-struction of a shaded relief map includes a computation of dip and azimuth, such that we can see subtle faults and channels. The horizon was a reasonably continuous reflection event in the 3D volume and a three-by-three mean filter was run on it to remove the short-wavelength jitter from the auto-tracked picks. The coherence extracted along this horizon is shown in Figure 5b. Since the horizon is a prominent reflection event, the coherence shows all high coherence except for two thin channels, the one in the lower left indicated by green arrows, and the one in the upper right indicated by yellow arrows. We then computed the most-positive and most-negative curvature directly from the horizon to generate the horizon-based curva-ture displays displayed in Figure 5c and d.
A prominent channel to the right (yellow arrows) shows up with distinct edges seen on the most-positive curvature dis-plays; the axis or thalwag of this channel can be seen clear-
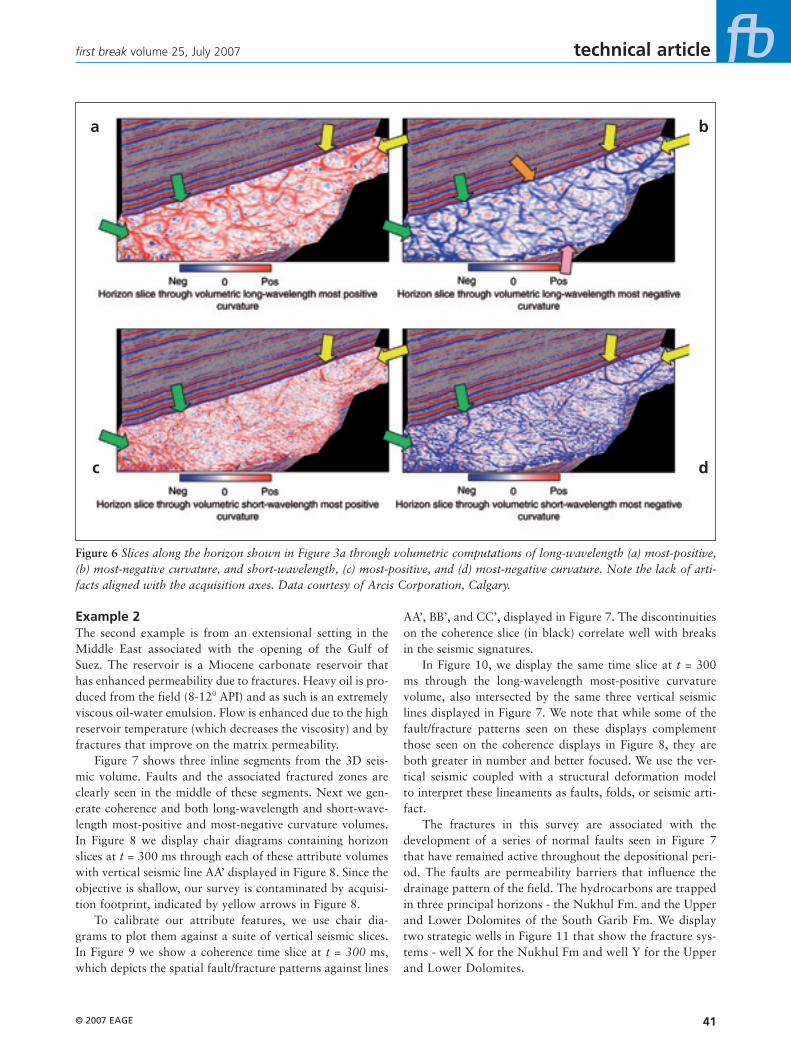
ly on the most-negative curvature display. The channel in the lower left is also clearly seen on these displays (green arrows). Notice that these displays are contaminated by acquisition footprint (white arrows) trending in the inline and crossline directions which has no geologic basis but makes it difficult to determine which linear features are faults and fractures and which are artifact. Next we computed volumetric estimates of both long- and short-wavelength most-positive and most-negative curvature attributes and display the horizon slices through all four attribute volumes in Figure 6. The long wave-length display of curvature ( = 0.25) in Figure 6a (most-pos-itive curvature) and 6b (most-negative curvature) appear a lot smoother than those in Figure 5c and d. Notice the definition of the two channels is much better now (yellow and green arrows). Two more channels appear to show up (indicated by pink and orange arrows), in addition to a number of other features seen on these displays. All such features need to be correlated with their seismic signatures using vertical slices through the seismic data.
Figure 5 (a) Shaded relief image of a time-structure map and (b) the corresponding horizon slice through a coherence vol-ume for a 3D seismic data volume acquired in Alberta, Canada. (c) Most-positive and (d) most-negative curvature comput-ed directly from the horizon picks shown in (a). White arrows indicate artifacts aligned with the inline and crossline acquisi-tion geometry. Green arrows indicate a channel seen in the lower left while yellow arrows indicate a channel seen in the upper right part of each image. These channels appear as a discontinuity in waveform in coherence, as a synformal thalweg (bright blue) on most-negative curvature and as left and right antiformal channel edges (bright red) on most-positive curvature. Data courtesy of Arcis Corporation, Calgary.
Example 2The second example is from an extensional setting in the Middle East associated with the opening of the Gulf of Suez. The reservoir is a Miocene carbonate reservoir that has enhanced permeability due to fractures. Heavy oil is pro-duced from the field (8-120 API) and as such is an extremely viscous oil-water emulsion. Flow is enhanced due to the high reservoir temperature (which decreases the viscosity) and by fractures that improve on the matrix permeability.
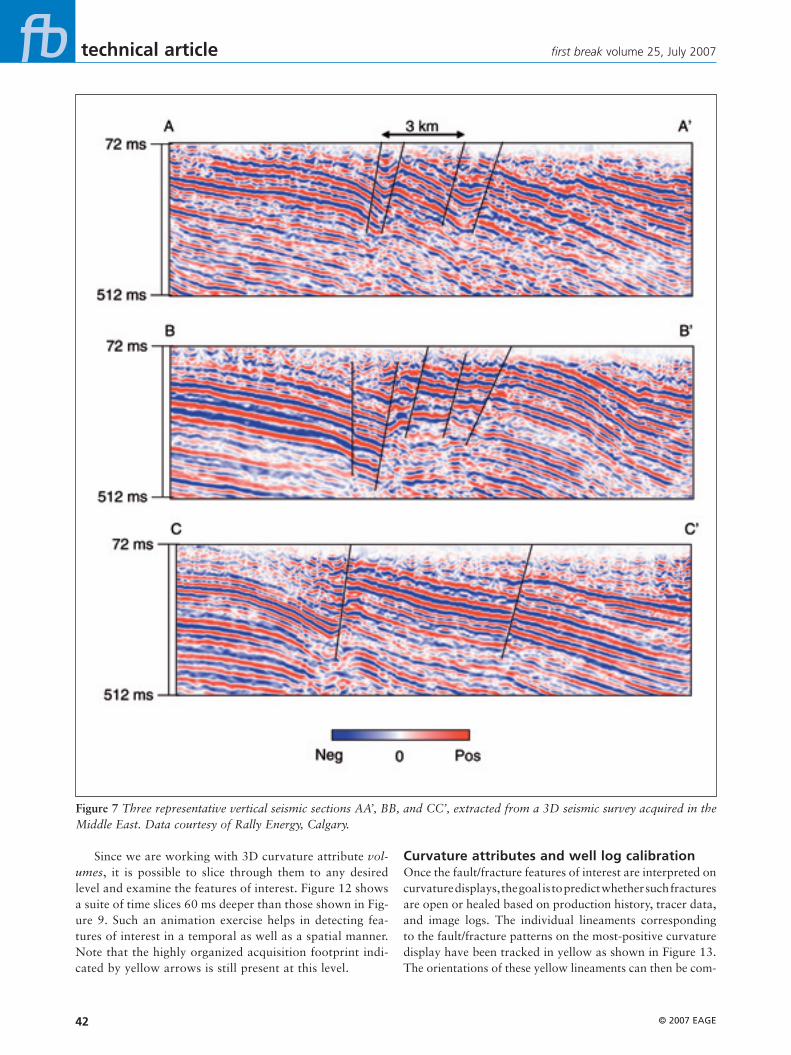
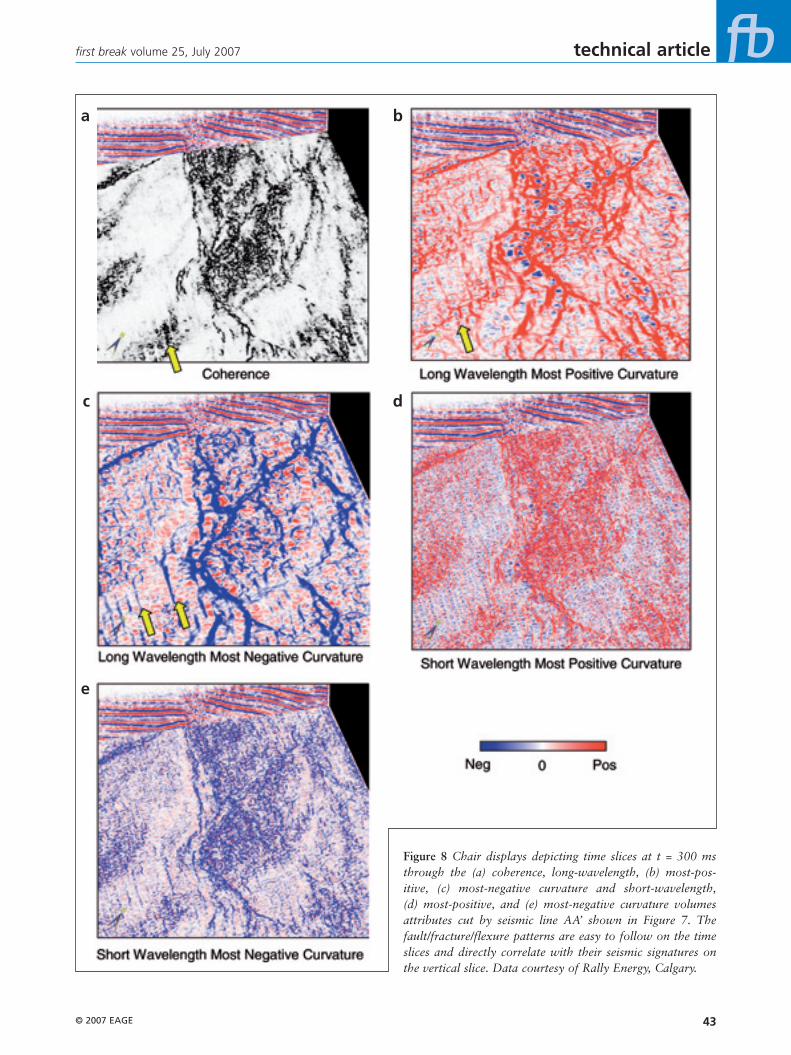
Figure 7 shows three inline segments from the 3D seis-mic volume. Faults and the associated fractured zones are clearly seen in the middle of these segments. Next we gen-erate coherence and both long-wavelength and short-wave-length most-positive and most-negative curvature volumes. In Figure 8 we display chair diagrams containing horizon slices at t = 300 ms through each of these attribute volumes with vertical seismic line AA’ displayed in Figure 8. Since the objective is shallow, our survey is contaminated by acquisi-tion footprint, indicated by yellow arrows in Figure 8.
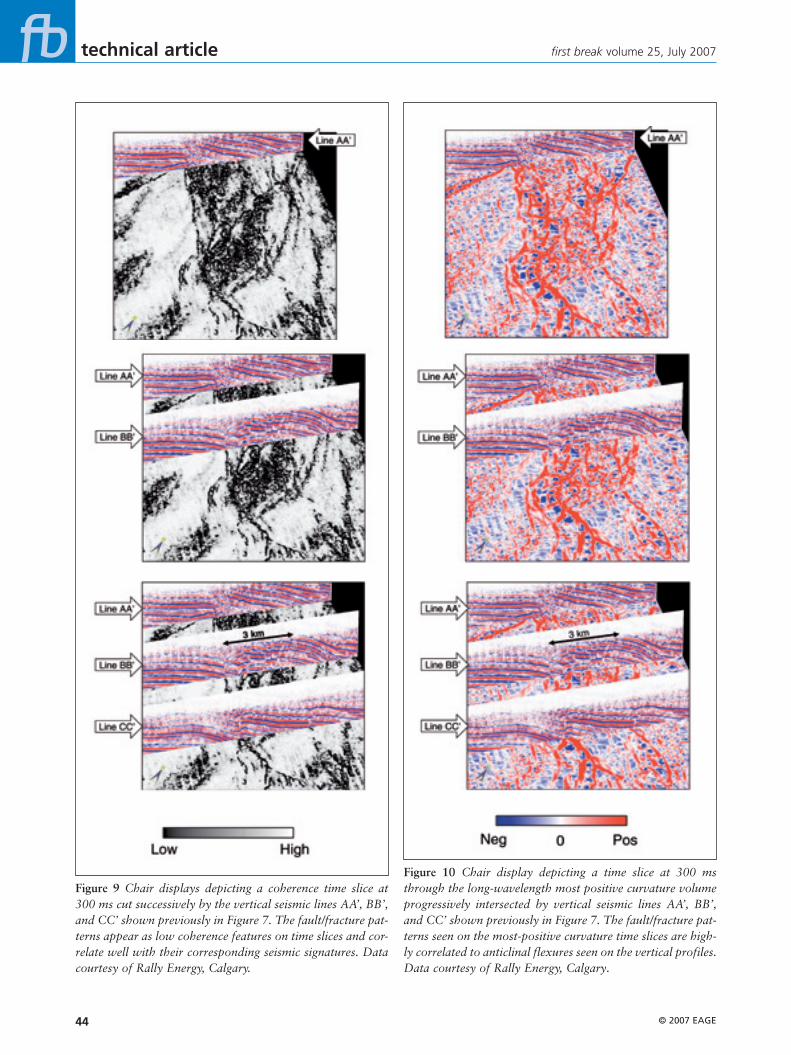
To calibrate our attribute features, we use chair dia-grams to plot them against a suite of vertical seismic slices. In Figure 9 we show a coherence time slice at t = 300 ms, which depicts the spatial fault/fracture patterns against lines
AA’, BB’, and CC’, displayed in Figure 7. The discontinuities on the coherence slice (in black) correlate well with breaks in the seismic signatures.
In Figure 10, we display the same time slice at t = 300 ms through the long-wavelength most-positive curvature volume, also intersected by the same three vertical seismic lines displayed in Figure 7. We note that while some of the fault/fracture patterns seen on these displays complement those seen on the coherence displays in Figure 8, they are both greater in number and better focused. We use the ver-tical seismic coupled with a structural deformation model to interpret these lineaments as faults, folds, or seismic arti-fact.
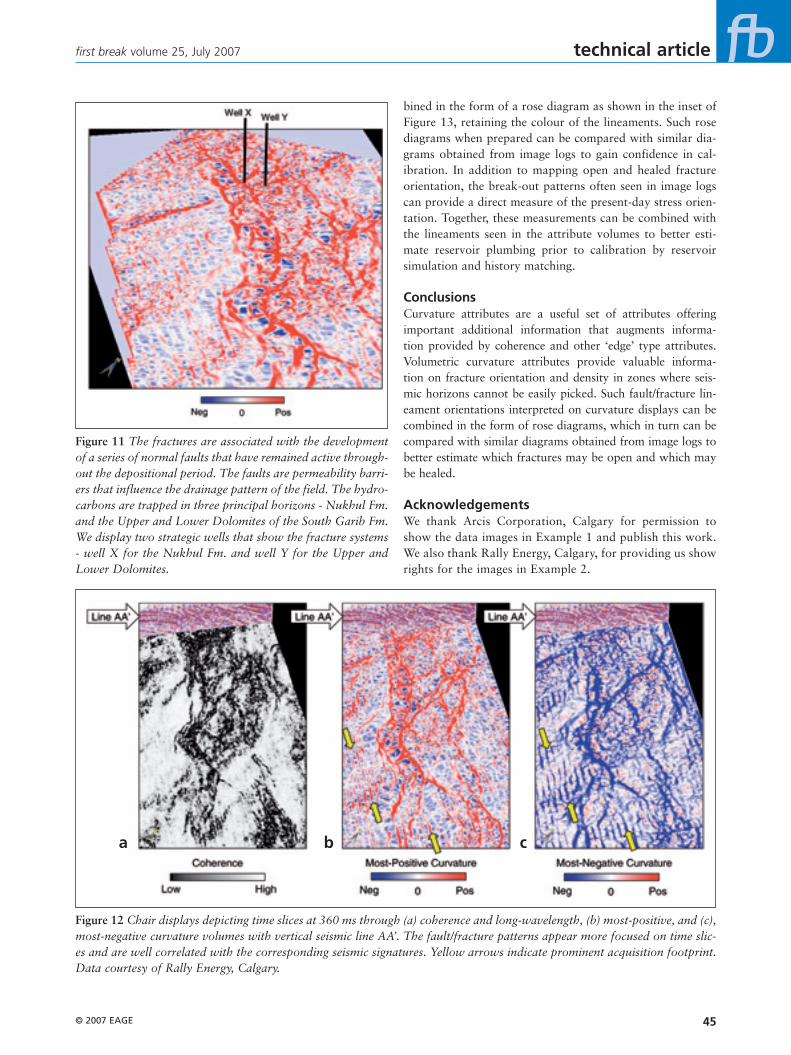
The fractures in this survey are associated with the development of a series of normal faults seen in Figure 7 that have remained active throughout the depositional peri-od. The faults are permeability barriers that influence the drainage pattern of the field. The hydrocarbons are trapped in three principal horizons - the Nukhul Fm. and the Upper and Lower Dolomites of the South Garib Fm. We display two strategic wells in Figure 11 that show the fracture sys-tems - well X for the Nukhul Fm and well Y for the Upper and Lower Dolomites.
Figure 6 Slices along the horizon shown in Figure 3a through volumetric computations of long-wavelength (a) most-positive, (b) most-negative curvature, and short-wavelength, (c) most-positive, and (d) most-negative curvature. Note the lack of arti-facts aligned with the acquisition axes. Data courtesy of Arcis Corporation, Calgary.
technical article first break volume 25, July 2007
Since we are working with 3D curvature attribute vol-umes, it is possible to slice through them to any desired level and examine the features of interest. Figure 12 shows a suite of time slices 60 ms deeper than those shown in Fig-ure 9. Such an animation exercise helps in detecting fea-tures of interest in a temporal as well as a spatial manner. Note that the highly organized acquisition footprint indi-cated by yellow arrows is still present at this level.
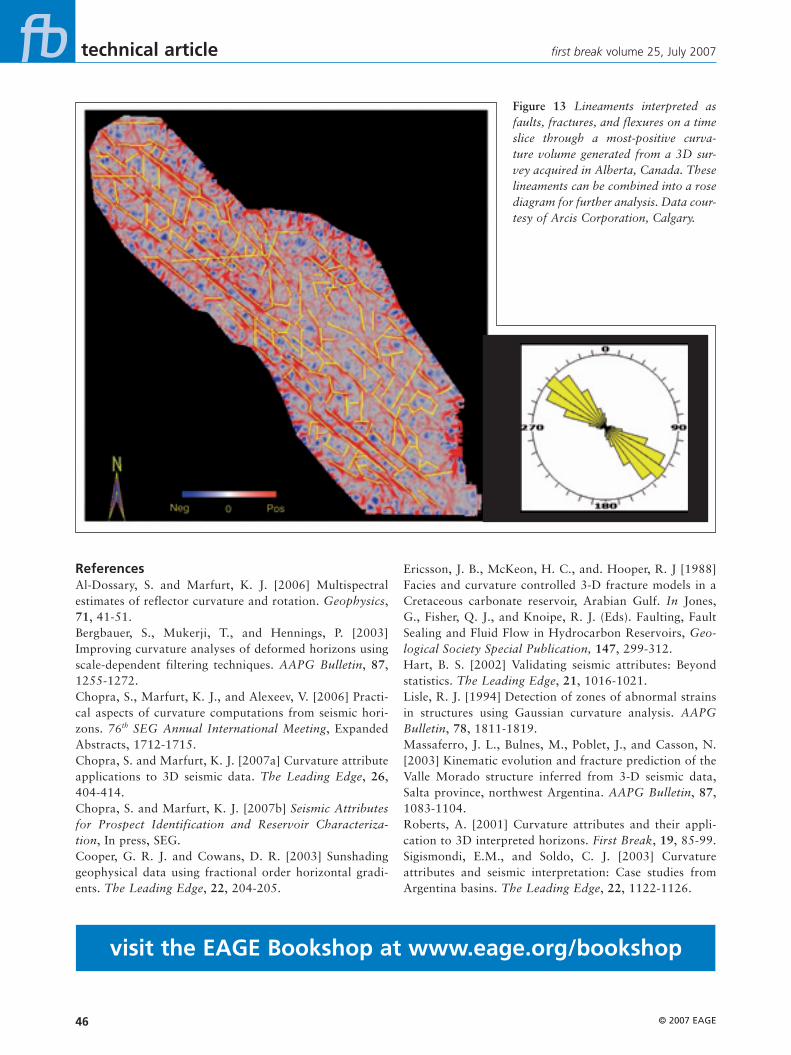
Curvature attributes and well log calibrationOnce the fault/fracture features of interest are interpreted on curvature displays, the goal is to predict whether such fractures are open or healed based on production history, tracer data, and image logs. The individual lineaments corresponding to the fault/fracture patterns on the most-positive curvature display have been tracked in yellow as shown in Figure 13. The orientations of these yellow lineaments can then be com-
Figure 7 Three representative vertical seismic sections AA’, BB, and CC’, extracted from a 3D seismic survey acquired in the Middle East. Data courtesy of Rally Energy, Calgary.
Figure 8 Chair displays depicting time slices at t = 300 ms through the (a) coherence, long-wavelength, (b) most-pos-itive, (c) most-negative curvature and short-wavelength, (d) most-positive, and (e) most-negative curvature volumes attributes cut by seismic line AA’ shown in Figure 7. The fault/fracture/flexure patterns are easy to follow on the time slices and directly correlate with their seismic signatures on the vertical slice. Data courtesy of Rally Energy, Calgary.
technical article first break volume 25, July 2007
Figure 9 Chair displays depicting a coherence time slice at 300 ms cut successively by the vertical seismic lines AA’, BB’, and CC’ shown previously in Figure 7. The fault/fracture pat-terns appear as low coherence features on time slices and cor-relate well with their corresponding seismic signatures. Data courtesy of Rally Energy, Calgary.
Figure 10 Chair display depicting a time slice at 300 ms through the long-wavelength most positive curvature volume progressively intersected by vertical seismic lines AA’, BB’, and CC’ shown previously in Figure 7. The fault/fracture pat-terns seen on the most-positive curvature time slices are high-ly correlated to anticlinal flexures seen on the vertical profiles. Data courtesy of Rally Energy, Calgary.
bined in the form of a rose diagram as shown in the inset of Figure 13, retaining the colour of the lineaments. Such rose diagrams when prepared can be compared with similar dia-grams obtained from image logs to gain confidence in cal-ibration. In addition to mapping open and healed fracture orientation, the break-out patterns often seen in image logs can provide a direct measure of the present-day stress orien-tation. Together, these measurements can be combined with the lineaments seen in the attribute volumes to better esti-mate reservoir plumbing prior to calibration by reservoir simulation and history matching.
ConclusionsCurvature attributes are a useful set of attributes offering important additional information that augments informa-tion provided by coherence and other ‘edge’ type attributes.Volumetric curvature attributes provide valuable informa-tion on fracture orientation and density in zones where seis-mic horizons cannot be easily picked. Such fault/fracture lin-eament orientations interpreted on curvature displays can be combined in the form of rose diagrams, which in turn can be compared with similar diagrams obtained from image logs to better estimate which fractures may be open and which may be healed.
AcknowledgementsWe thank Arcis Corporation, Calgary for permission to show the data images in Example 1 and publish this work. We also thank Rally Energy, Calgary, for providing us show rights for the images in Example 2.
Figure 12 Chair displays depicting time slices at 360 ms through (a) coherence and long-wavelength, (b) most-positive, and (c), most-negative curvature volumes with vertical seismic line AA’. The fault/fracture patterns appear more focused on time slic-es and are well correlated with the corresponding seismic signatures. Yellow arrows indicate prominent acquisition footprint. Data courtesy of Rally Energy, Calgary.
Figure 11 The fractures are associated with the development of a series of normal faults that have remained active through-out the depositional period. The faults are permeability barri-ers that influence the drainage pattern of the field. The hydro-carbons are trapped in three principal horizons - Nukhul Fm. and the Upper and Lower Dolomites of the South Garib Fm. We display two strategic wells that show the fracture systems - well X for the Nukhul Fm. and well Y for the Upper and Lower Dolomites.
technical article first break volume 25, July 2007
ReferencesAl-Dossary, S. and Marfurt, K. J. [2006] Multispectral estimates of reflector curvature and rotation. Geophysics,71, 41-51.Bergbauer, S., Mukerji, T., and Hennings, P. [2003] Improving curvature analyses of deformed horizons using scale-dependent filtering techniques. AAPG Bulletin, 87,1255-1272.Chopra, S., Marfurt, K. J., and Alexeev, V. [2006] Practi-cal aspects of curvature computations from seismic hori-zons. 76th SEG Annual International Meeting, Expanded Abstracts, 1712-1715.Chopra, S. and Marfurt, K. J. [2007a] Curvature attribute applications to 3D seismic data. The Leading Edge, 26,404-414.Chopra, S. and Marfurt, K. J. [2007b] Seismic Attributes for Prospect Identification and Reservoir Characteriza-tion, In press, SEG.Cooper, G. R. J. and Cowans, D. R. [2003] Sunshading geophysical data using fractional order horizontal gradi-ents. The Leading Edge, 22, 204-205.
Ericsson, J. B., McKeon, H. C., and. Hooper, R. J [1988] Facies and curvature controlled 3-D fracture models in a Cretaceous carbonate reservoir, Arabian Gulf. In Jones, G., Fisher, Q. J., and Knoipe, R. J. (Eds). Faulting, Fault Sealing and Fluid Flow in Hydrocarbon Reservoirs, Geo-logical Society Special Publication, 147, 299-312.Hart, B. S. [2002] Validating seismic attributes: Beyond statistics. The Leading Edge, 21, 1016-1021.Lisle, R. J. [1994] Detection of zones of abnormal strains in structures using Gaussian curvature analysis. AAPG Bulletin, 78, 1811-1819.Massaferro, J. L., Bulnes, M., Poblet, J., and Casson, N. [2003] Kinematic evolution and fracture prediction of the Valle Morado structure inferred from 3-D seismic data, Salta province, northwest Argentina. AAPG Bulletin, 87,1083-1104.Roberts, A. [2001] Curvature attributes and their appli-cation to 3D interpreted horizons. First Break, 19, 85-99.Sigismondi, E.M., and Soldo, C. J. [2003] Curvature attributes and seismic interpretation: Case studies from Argentina basins. The Leading Edge, 22, 1122-1126.
Figure 13 Lineaments interpreted as faults, fractures, and flexures on a time slice through a most-positive curva-ture volume generated from a 3D sur-vey acquired in Alberta, Canada. These lineaments can be combined into a rose diagram for further analysis. Data cour-tesy of Arcis Corporation, Calgary.