rat Comodo Next Generation Security Information and Event Management Software Version 1.4 Administrator Guide Guide Version 1.4.101915 Comodo Security Solutions 1255 Broad Street Clifton, NJ 07013
Transcript
rat
ComodoNext Generation Security Information and Event
Table of Contents 1 Introduction to Comodo NxSIEM.............................................................................................................................................3
1.1 Logging-in to the Administrative Console.....................................................................................................................4 2 The Main Interface ....................................................................................................................................................................5 3 The Dashboard..........................................................................................................................................................................8 4 Customer Asset Management................................................................................................................................................19
4.1 Adding Customers.........................................................................................................................................................21 4.2 Adding Assets for Monitoring.......................................................................................................................................24
4.2.1 Hard Assets...........................................................................................................................................................25 4.2.2 Soft Assets............................................................................................................................................................30
4.3 Downloading and Installing the NxSIEM Agent on Endpoints...................................................................................32 4.4 Configuring Nxlog and Rsyslog to Send Logs to NxSIEM Server..............................................................................38 4.5 Editing Customers.........................................................................................................................................................40
5 Log Collection Agents and Policies.......................................................................................................................................43 5.1 Collection Agents...........................................................................................................................................................43
5.1.1 Downloading NxSIEM Agents for Windows and Linux Endpoints....................................................................44 5.1.2 Managing Agents..................................................................................................................................................45 5.1.3 Agentless Log Collection.....................................................................................................................................47
9 Live Lists................................................................................................................................................................................145 9.1 Managing Live Lists.....................................................................................................................................................146 9.2 Managing Live List Content.........................................................................................................................................150
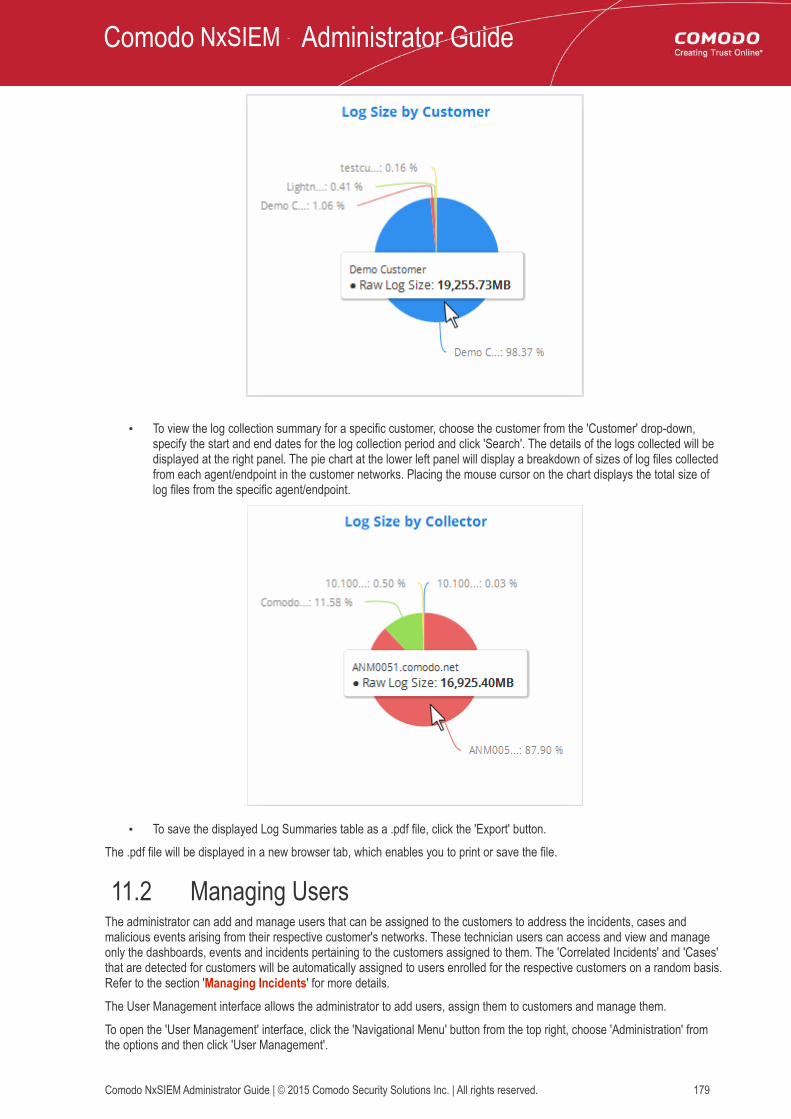
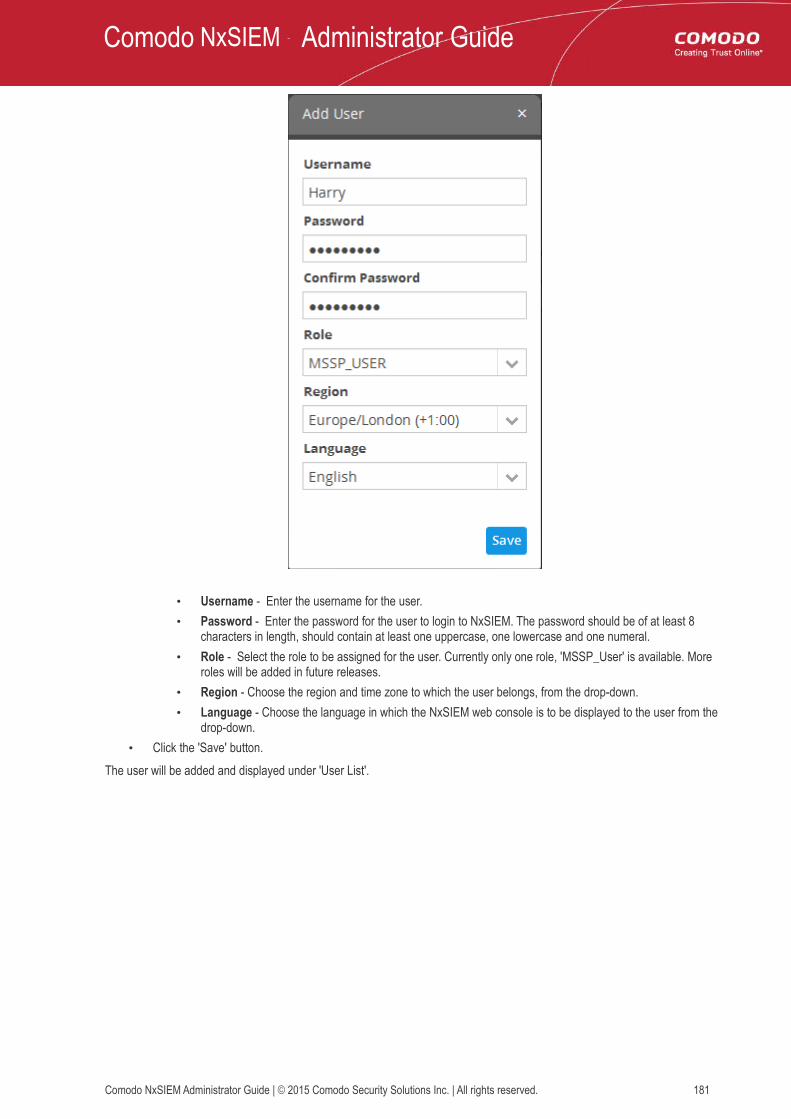
11.1 Viewing Log Collection Summaries..........................................................................................................................177 11.2 Managing Users..........................................................................................................................................................179 11.3 Viewing License and Subscription Details and Configuring NxSIEM Platform URL............................................185
Appendix 1 - Field Groups and Event Items Description.......................................................................................................187Appendix 2 - Configuring Endpoints to Forward Logs to NxSIEM server............................................................................190About Comodo..........................................................................................................................................................................191
1 Introduction to Comodo NxSIEMComodo NxSIEM is a security intelligence and event management product (SIEM) built exclusively for MSPs to help them grow their business. NxSIEM features advanced event log monitoring, built-in reporting, multiple pre-set queries, a powerful custom-query interface, automatic assignment of incidents to personnel, customizable dashboards and real-time alerts. NxSIEMs multi-tenancy architecture enables MSPs to manage their customers from a single deployment and benefit from "big data" scalability as their log sizes increase.
Features• Real-time event monitoring and processing• Long-term log retention, archiving and backup• Multiple 'Ready-to-go' queries to address typical use-cases • Powerful query creation interface for custom queries• Configurable custom dashboards• Custom report generation and report scheduling• Incident and case management• Choice of agent or agent-less log collection• Per-customer policy creation and management• Immediate alerts and incident delegation • 'Live Lists' of event parameters for use in queries and correlation rules• Rapid search over huge volumes of data
Guide StructureThis guide is intended to take you through the configuration and use of Comodo Managed Security Service Provider Platform and is broken down into the following main sections.
• Introduction to Comodo NxSIEM• Logging-in to the Administrative Console
• The Main Interface• The Dashboard• Customer Asset Management
• Adding Customers• Adding Assets for Monitoring• Downloading and Installing the NxSIEM Agent on Endpoints• Configuring Nxlog and Rsyslog to Send Logs to NxSIEM Server• Editing Customers
• Live Lists• Managing Live Lists• Managing Live List Content
• Managing Reports• Administration
• Viewing Log Collection Summaries• Managing Users• Viewing License and Subscription Details and Configuring NxSIEM Platform URL
• Appendix 1 - Field Groups and Event Items Description • Appendix 2 - Configuring Endpoints to Forward Logs to NxSIEM server
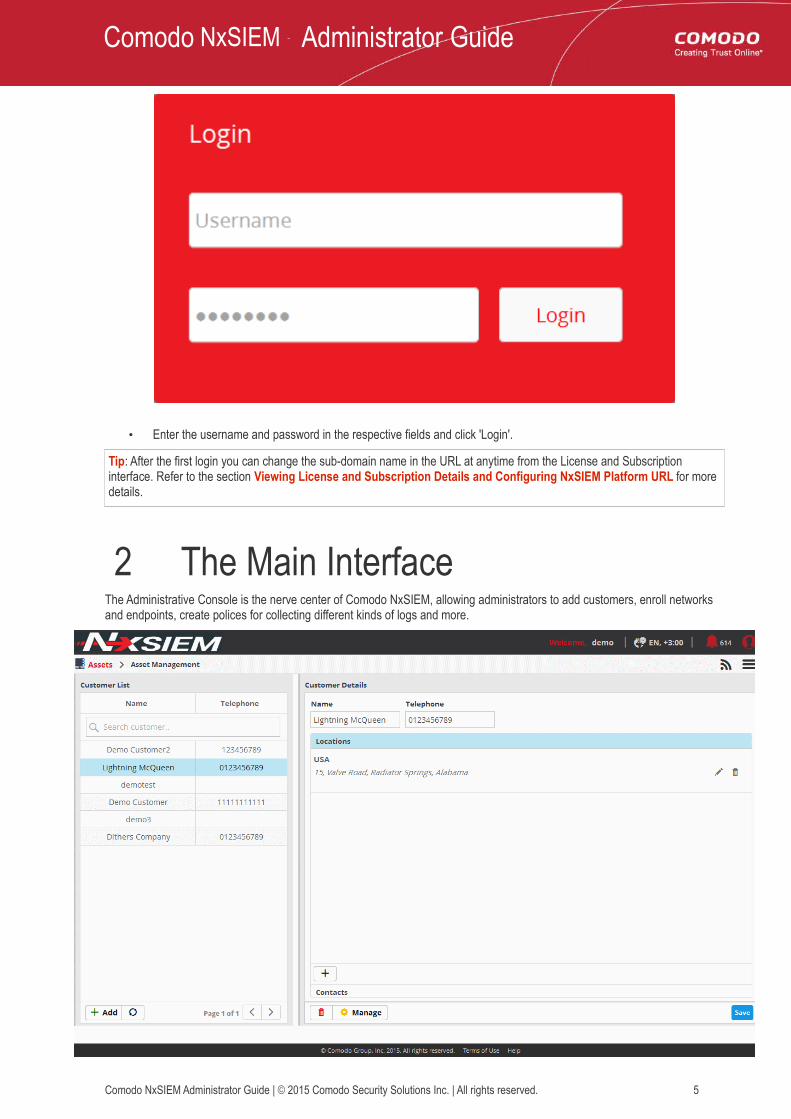
1.1 Logging-in to the Administrative ConsoleComodo NxSIEM service is a offered as a web based application, its administrative interface can be accessed using any browser. Enter the URL of Comodo NxSIEM that was provided at the time of subscription to the service.
• Enter the username and password in the respective fields and click 'Login'.
Tip: After the first login you can change the sub-domain name in the URL at anytime from the License and Subscription interface. Refer to the section Viewing License and Subscription Details and Configuring NxSIEM Platform URL for more details.
2 The Main Interface The Administrative Console is the nerve center of Comodo NxSIEM, allowing administrators to add customers, enroll networks and endpoints, create polices for collecting different kinds of logs and more.
Once logged-in, the title bar displays the administrator's 'Usename', region and language, the number of incidents, and options to change the administrator's profile settings and password. The main configuration area is displayed depending on the option chosen from the drop-down, that appears on clicking the menu button at the top right. The following table explains the elements in the title bar.
Title Bar Controls - Descriptions
Displays the username of the currently logged-in administrator
Displays the location, language and time zone settings as per the currently logged-in administrator.
Displays the number of incidents detected. Clicking on the notification icon opens the Incident Management interface that allows the administrator to view the list of incidents from all the customers, assign them to respective administrative users, create cases and assign them to administrative users. Refer to the section Incidents and Cases for more details.
Allows the currently logged-in administrator to edit their location and language, change their login password and logout of the console. Refer to the following section 'Changing Password and Language Settings' for more details.
Operational Feeds button - Clicking this button displays the batch operations that were completed and currently running, for example, customer creation and so on.
Navigational Menu button - Clicking this button allows administrators to navigate to the required main functional areas of the console: Dashboard, Assets, Agents, Investigation, Rules, Incidents, Live Lists, Reporting and Administration.
Main Functional Areas• Dashboard - Allows the administrator to view graphical summary of all occurred events, top detected applications,
most active agents, attack sources, firewall event sources and more. Refer to the section 'The Dashboard' for more details.
• Assets - Allows the administrator to add new customers, manage existing customers, add and manage networks for the customers, configuring Nxlog and syslog servers and more. Refer to the section 'Customer Asset Management' for more details.
• Agents - Allows the administrator to download MSSP agent for Windows and Linux, manage the agents that are installed on systems, create polices for the purpose of collecting various kinds of logs from devices, systems and more. Refer to the section 'Log Collection Agents and Policies' for more details.
• Investigation - Allows administrators to create event queries and view the results from event queries in pie charts, bar charts and spider charts. Refer to the section 'Query Management' for more details.
• Rules - Allows the administrator to create rules for analyzing the processed logs and to provide alerts for certain conditions. Refer to the section 'Managing Rules' for more details.
• Incidents - Allows the administrator to manage incidents, both Correlated Incidents and Default Incidents, assign/reassign incidents to users, create groups of incidents as cases and assign to users and more. Refer to the section 'Incidents and Cases' for more details.
• Lists - Allows the administrator to create lists of values for fields like sources, destinations, networks, that can be used in creating event queries and correlation rules. Refer to the section Live Lists for more details.
• Reporting - Allows the administrator to generate customer specific reports. The reports are available for different kinds of events such as login failures and successes, suspicious login attempts and more. Refer to the section 'Managing Reports' for more details.
• Administration - Allows administrators to view a summary of logs collected from different customers, add and manage administrative users and assign them to specific customer(s), view license and subscription details and set the sub-domain name for configuring Access URL for the administrative interface . Refer to the section 'Administration' for more details.
Changing Password and Language SettingsThe administrator can change their location and language settings and login password by clicking the user icon displayed at the right end of the title bar.
To change the password
• Click the button and choose 'Change Password' from the drop-down.
The 'Change Password' dialog will appear.
• Enter your current password in the 'Old Password' field• Enter your new password in the 'New Password' field and confirm it in the next field.• Click the 'Submit' button.
Use the new password next time you login to the NxSIEM platform.
To change the Region and Language Settings
• Click the button and choose 'Region & Language' from the drop-down.
• Choose the region and time zone to be followed from the 'Region' drop-down.• Choose the language in which the NxSIEM web console is to be displayed from the 'Language' drop-down.• Click the 'Submit' button.
The settings will be changed and will take effect from your next login.
3 The DashboardThe dashboard provides a snapshot summary of collected logs, events and incidents that were detected from customer networks for a selected period of time. This allows administrators to more effectively track customer progress, diagnose potential issues and to make informed decisions should corrective actions need to be taken. The default view shows the details collected for all enrolled customers. The administrator can filter the statistics for specific customer by selecting the customer from the left and for time periods ranging from last one hour to previous 24 hours by selecting the period from the drop-down at the top right.
The 'Situational Awareness' dashboard contains three tabs, 'Log Collection', 'Security Events' and 'Incidents'.
• Log Collection - The 'Log Collection' tab displays graphical summaries of number of logs collected from different networks, and applications and products running on the customer networks.
• Security Events - The 'Security Events' tab provides critical information such as top 10 attack sources, top 10 attack destinations, top 10 firewall event sources and number of firewall events happened per minute.
• Incidents - The 'Incidents' tab provides details such as incident list, top 10 alerts, open incidents and unassigned incidents.
The 'Situational Awareness' Dashboard is displayed by default whenever you log-in to NxSIEM. To switch to the Dashboard interface from any other interface, click the 'Menu' button, choose 'Dashboard' from the options and click 'Situational Awareness'.
Selecting Customer and Time PeriodThe left hand side menu displays a list of all the customers enrolled to NxSIEM with other details such as number of events, number of open incidents, number of networks, number of zones and number of agents for each customer. The top item in the list displays a consolidated summary of details from all the customers.
• To view the charts with details from all the customers on the dashboard, select 'All' from the list• To view the charts pertaining to a selected customer on the dashboard, select the customer from the list• To update the list of customers and number of events, click the refresh button at the top
The drop-down at the top left allows you to choose the time period for which the statistics are to be displayed. You can choose the time period from the last one hour to last 24 hours.
The dashboard will display the graphs for the selected customer with the details collected within the selected period.
Tip: In addition to the 'Situation Awareness' dashboard that displays the statistics of pre-defined parameters, the administrator can create custom dashboards specific to the customers, to display the results of event queries, as pie-charts, bar-charts and/or spider charts. The custom dashboards enable the administrator to view important details from often complex queries in an easily digested chart format and to effectively track, monitor and analyze the activities of their customers. Refer to the section 'Configuring Custom Dashboards' for more details.
Log Collection ChartsThe 'Log Collection' tab displays statistics of logs collected from the selected customer networks as four charts, 'Logs per Minute', 'Logs per Collector', 'Top Applications' and 'Top Products'. Comodo NxSIEM gathers logs from various systems, tools and devices so that the data may be searched, correlated and used to create reports.
Logs per MinuteThe chart shows the number of logs collected from various sources in selected customer network at different time points.
Placing the mouse cursor on the graph shows the exact number of logs collected at that time point as a tool tip.
Logs per CollectorThe 'Logs per Collector' chart shows the number of log entries collected from different agents/networks pertaining to the selected customer's networks.
Placing the mouse cursor on a bar shows the exact number of the log entries collected from the respective agent as a tool tip.
Top ApplicationsThe 'Top Applications' pie-chart shows the percentage breakup of number of log entries received from events generated by various applications running in the customer's network.
Placing the mouse cursor on a sector shows the exact number of the log entries collected from the respective application as a tool tip.
The 'Top Products' pie-chart shows the percentage breakup of number of log entries of events generated by network appliances and firewalls connected to the customer's network.
Placing the mouse cursor on a sector shows the exact number of the log entries collected from the respective product, as a tool tip.
Security EventsThe 'Security Events' tab in the dashboard displays summaries of events detected from the customer networks as four graphs, 'Top Attack Sources', 'Top Attack Destinations', 'Top Firewall Event Sources' and 'Firewall Events Per Minute'. Comodo NxSIEM gathers logs from various systems, tools and devices so that the data may be searched, correlated and used to create these reports. The data is then analyzed automatically and graphs are displayed accordingly.
Top 10 Attack SourcesThe bar graph displays the top attack events, from where the events originated and the type of attack events. The IP addresses of the systems from where the attacks came are displayed on the X-axis. Placing the mouse cursor over an event will display its details such as the event name and the number of times the attack event is generated from the source. The value in the Y-axis displays the number of attack events. You can hide/view a graph bar by clicking on the respective event name at the bottom. View all the attack event names by using the triangle buttons below it.
Top Attack DestinationsThe bar graph displays the top attack events, the type of attacks and the affected systems. The IP addresses of the systems that were attacked are displayed on the X-axis. Placing the mouse cursor over an event will display its details such as the event name and the number of times the system was attacked. The value in the Y-axis displays the number of attack events. At the bottom of the graph, the attack event names with color coding are displayed. You can hide/view a graph bar by clicking on the respective event name at the bottom. View all the attack event names by using the triangle buttons below it.
Top Firewall Event SourcesThe bar graph displays the occurrence details of top 10 firewall events, for example, a block event, that occurred on the endpoints. The IP addresses of the systems from where the firewall events originated are displayed on the X-axis and the number of times the events occurred is displayed on the Y-axis. Placing the mouse cursor over an event source will display the number of times the event occurred on the system.
The bar graph provides occurrence details of firewall events on a per minute basis for better analysis. For example, administrators can get the time when the greatest number of firewall events occurs for a customer or if no events are coming from a customer, it may indicate malfunctioning communications with the agent or issue with log forwarding. Placing the mouse cursor over the graph will display the day, date, time and the number of times the event occurred.
IncidentsComodo NxSIEM generates alerts based on rules that are defined in Rule Creation & Activation interface and these alerts are automatically assigned as incidents to administrative users enrolled for the respective customers to take necessary actions. Refer to the section 'Administration' to know about assigning users to customers. When the alerts are assigned to users, they are called 'Incidents' and incidents that are not closed are called 'Open Incidents'. Alerts that are not assigned are called 'Unassigned Incidents'. You can also add incidents manually in the 'Incidents' screen and assign them to users. These are classified as 'Default' and incidents that are detected automatically via alerts are called 'Correlated'. Refer to the section 'Managing Incidents' to know how to add incidents manually, view assigned alerts, edit and close the incidents.
• Click the 'Incidents' tab after selecting a customer from the left side.
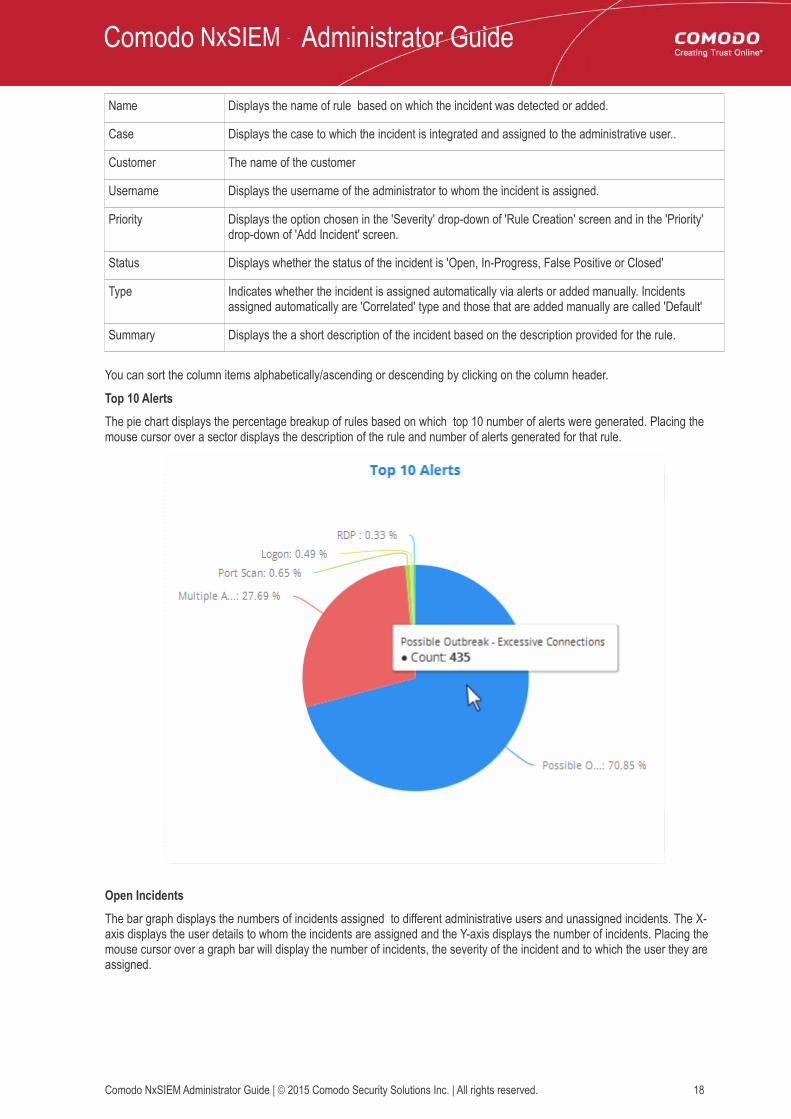
Name Displays the name of rule based on which the incident was detected or added.
Case Displays the case to which the incident is integrated and assigned to the administrative user..
Customer The name of the customer
Username Displays the username of the administrator to whom the incident is assigned.
Priority Displays the option chosen in the 'Severity' drop-down of 'Rule Creation' screen and in the 'Priority' drop-down of 'Add Incident' screen.
Status Displays whether the status of the incident is 'Open, In-Progress, False Positive or Closed'
Type Indicates whether the incident is assigned automatically via alerts or added manually. Incidents assigned automatically are 'Correlated' type and those that are added manually are called 'Default'
Summary Displays the a short description of the incident based on the description provided for the rule.
You can sort the column items alphabetically/ascending or descending by clicking on the column header.
Top 10 AlertsThe pie chart displays the percentage breakup of rules based on which top 10 number of alerts were generated. Placing the mouse cursor over a sector displays the description of the rule and number of alerts generated for that rule.
Open IncidentsThe bar graph displays the numbers of incidents assigned to different administrative users and unassigned incidents. The X-axis displays the user details to whom the incidents are assigned and the Y-axis displays the number of incidents. Placing the mouse cursor over a graph bar will display the number of incidents, the severity of the incident and to which the user they are assigned.
4 Customer Asset ManagementThe administrator can add and manage customers whose networks and endpoints are to be monitored and managed, though the 'Asset management' interface.
To open the 'Asset Management' interface, click the 'Menu' button at the top right, choose 'Assets' and click 'Asset Management'.
The 'Asset Management' interface displays the list of the customers on the left hand side pane and the details of the selected customer on the right hand side pane.
The following sections explain on managing customers and their assets and configuring for customer networks for sending logs to NxSIEM server.
• Adding new customers• Adding Customer's Assets for Monitoring
• Downloading and Installing NxSIEM Agent on customers' endpoints for log collection• Downloading and Installing Nxlog and Rsyslog configuration files for fetching logs from Nxlog and Rsyslog
servers in customers' networks• Editing Customers
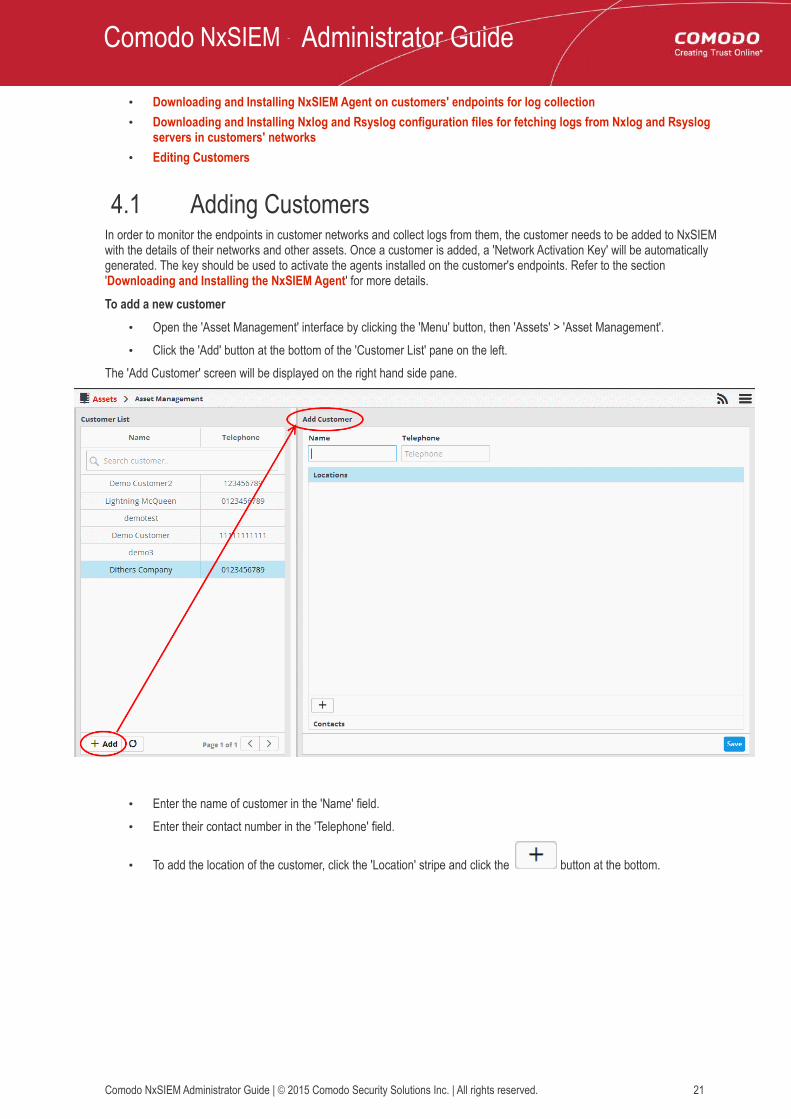
4.1 Adding CustomersIn order to monitor the endpoints in customer networks and collect logs from them, the customer needs to be added to NxSIEM with the details of their networks and other assets. Once a customer is added, a 'Network Activation Key' will be automatically generated. The key should be used to activate the agents installed on the customer's endpoints. Refer to the section 'Downloading and Installing the NxSIEM Agent' for more details.
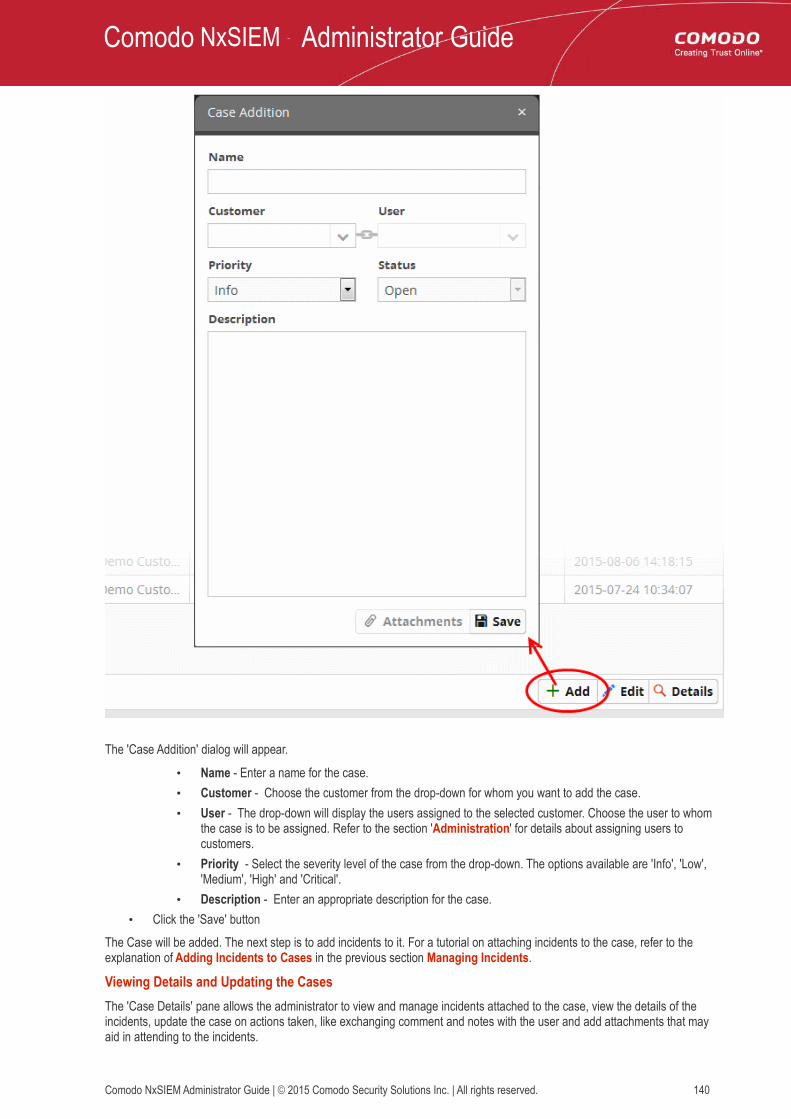
To add a new customer• Open the 'Asset Management' interface by clicking the 'Menu' button, then 'Assets' > 'Asset Management'.• Click the 'Add' button at the bottom of the 'Customer List' pane on the left.
The 'Add Customer' screen will be displayed on the right hand side pane.
• Enter the name of customer in the 'Name' field.• Enter their contact number in the 'Telephone' field.
• To add the location of the customer, click the 'Location' stripe and click the button at the bottom.
• Select the country in which the company is located, from the 'Country' drop-down• Enter the address of the company in the 'Address' field.• Click the 'Add' button.
The location will be added and displayed in the screen.
• Repeat the process to add more locations for the customer.
• To add the contact details of the customer, click the 'Contacts' stripe and click the button at the bottom..
sections 'Adding Assets for Monitoring' and 'Downloading and Installing the NxSIEM Agent on Endpoints' for more details.
4.2 Adding Assets for MonitoringIn order to collect logs and monitor events on customer networks, administrators need to add the customer's network assets to NxSIEM. Administrators should enroll the endpoints and software assets (such as services) that they wish to monitor.
To add assets for a customer• Open the 'Asset Management' interface by clicking the 'Menu' button, then 'Assets' > 'Asset Management'.• Select the customer whose assets are to be added, from the left hand side pane.
The Customer Details pane will open in the right.
• Click 'Manage' at the bottom left of the right pane
The interface for adding customer's assets will open. It contains two tabs:
• Hard Assets - Allows you to add networks and zones to be monitored by entering their start and end IP addresses. Refer to the following section Hard Assets for more details.
• Soft Assets - Allows you to add soft assets like services hosted from the network by specifying their URL, website and so on. Refer to the following section Soft Assets for more details.
4.2.1 Hard AssetsThe 'Hard Assets' interface allows administrators to add and manage networks for the enrolled customers. NxSIEM allows the administrator to add several networks for each customer by specifying their start and end addresses. Each network can be divided as zones depending on the organizational requirements.
For each network or the zone defined for a customer:
• A unique activation key is generated. The activation key is used to activate the log collection agent installed on Windows and Linux endpoints in the network/zone, for connection to the NxSIEM server and to send logs from them. Refer to the section Downloading and Installing NxSIEM Agent on Endpoints for more details.
• A unique authentication token is generated. The authentication token can be used as 'AGENTLESS_AUTH_TOKEN' parameter on the configuration script that can be run on Linux endpoints with RSYSLOG utility, for agent less log collection from them. Refer to the section Agentless Log Collection for more details.
• Configuration files for RSYSLOG and NXLOG utilities are generated. The configuration files can be directly run on endpoints with RSYSLOG and NXLOG utilities respectively without any re-configuration, for them to send logs to NXSIEM server. Refer to the section Configuring Nxlog and Rsyslog servers to send logs to NxSIEM server for more details.
To open the Hard Assets interface for a customer• Open the 'Asset Management' interface by clicking the 'Menu' button, then 'Assets' > 'Asset Management'.• Select the customer whose assets are to be added, from the left hand side pane.
The Customer Details pane will open in the right.
• Click 'Manage' at the bottom left of the right pane and choose the 'Hard Assets' tab.
The list of networks/zones added for the selected customer is displayed in the right hand side pane with action buttons. The network token and the activation key for the selected network are displayed in the lower right pane.
Hard Assets: Action - Controls
Clicking this icon displays the authentication token, agent activation key and download buttons for the pre-configured RSYSLOG and NXLOG configuration script files for the network/zone in the lower right pane.
Allows you to reset the authentication token for the network/zone and generate new one. Once the token is changed, the old token becomes invalid. The NxSIEM server will not be able to collect logs
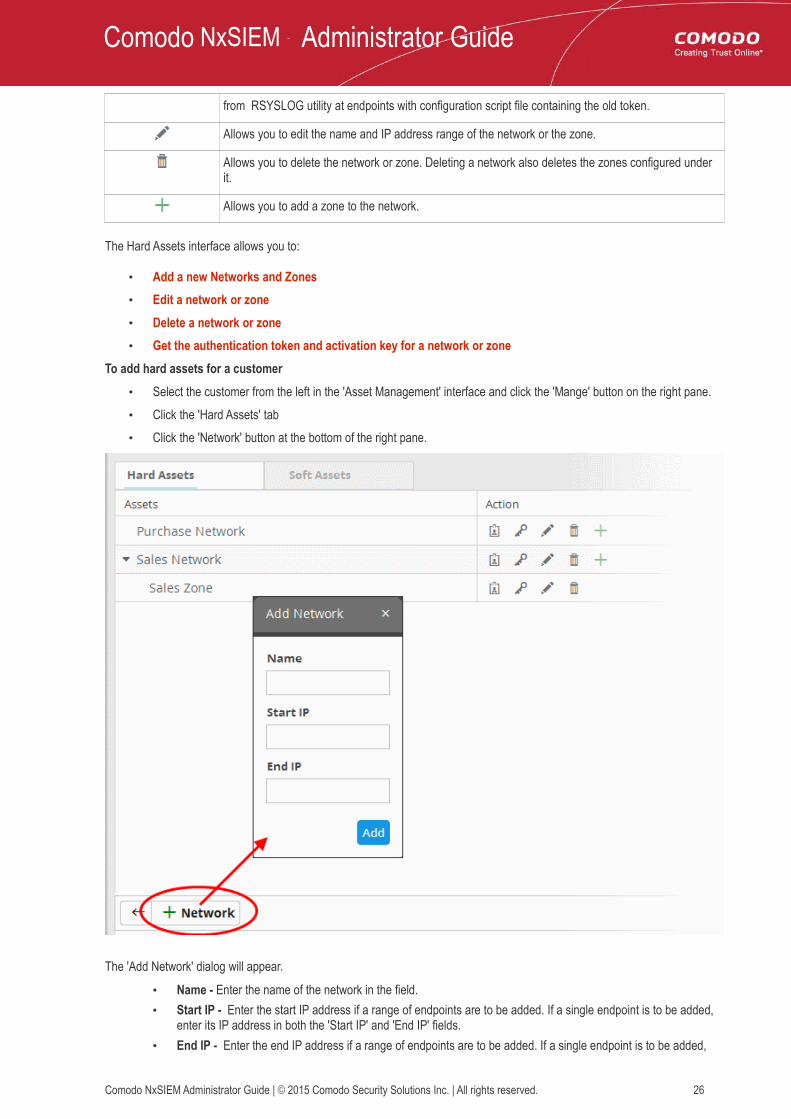
from RSYSLOG utility at endpoints with configuration script file containing the old token.
Allows you to edit the name and IP address range of the network or the zone.
Allows you to delete the network or zone. Deleting a network also deletes the zones configured under it.
Allows you to add a zone to the network.
The Hard Assets interface allows you to:
• Add a new Networks and Zones• Edit a network or zone• Delete a network or zone• Get the authentication token and activation key for a network or zone
To add hard assets for a customer• Select the customer from the left in the 'Asset Management' interface and click the 'Mange' button on the right pane.• Click the 'Hard Assets' tab• Click the 'Network' button at the bottom of the right pane.
The 'Add Network' dialog will appear.
• Name - Enter the name of the network in the field.• Start IP - Enter the start IP address if a range of endpoints are to be added. If a single endpoint is to be added,
enter its IP address in both the 'Start IP' and 'End IP' fields.• End IP - Enter the end IP address if a range of endpoints are to be added. If a single endpoint is to be added,
enter its IP address in both the 'Start IP' and 'End IP' fields.• Click the 'Add' button.
The network will be added and a unique authentication token and agent activation key will be generated for the network. Clicking the button in the new network row will display the token and the key at the bottom of the right pane.
• Repeat the process to add more networks.To add a zone to a network
• Click the button in the row of the network.
The 'Add Zone' dialog will appear.
• Name - Enter the name of the zone in the field.• Start IP - Enter the start IP address if a range of endpoints are to be added for the zone. If a single endpoint is to
be added, enter its IP address in both the 'Start IP' and 'End IP' fields.
• End IP - Enter the end IP address if a range of endpoints are to be added for the zone. If a single endpoint is to be added, enter its IP address in both the 'Start IP' and 'End IP' fields.
• Click the 'Add' button.The Zone will be added to the network and a unique authentication token and agent activation key will be generated for the zone. Clicking the button in the row of the new zone will display the token and the key at the bottom of the right pane.
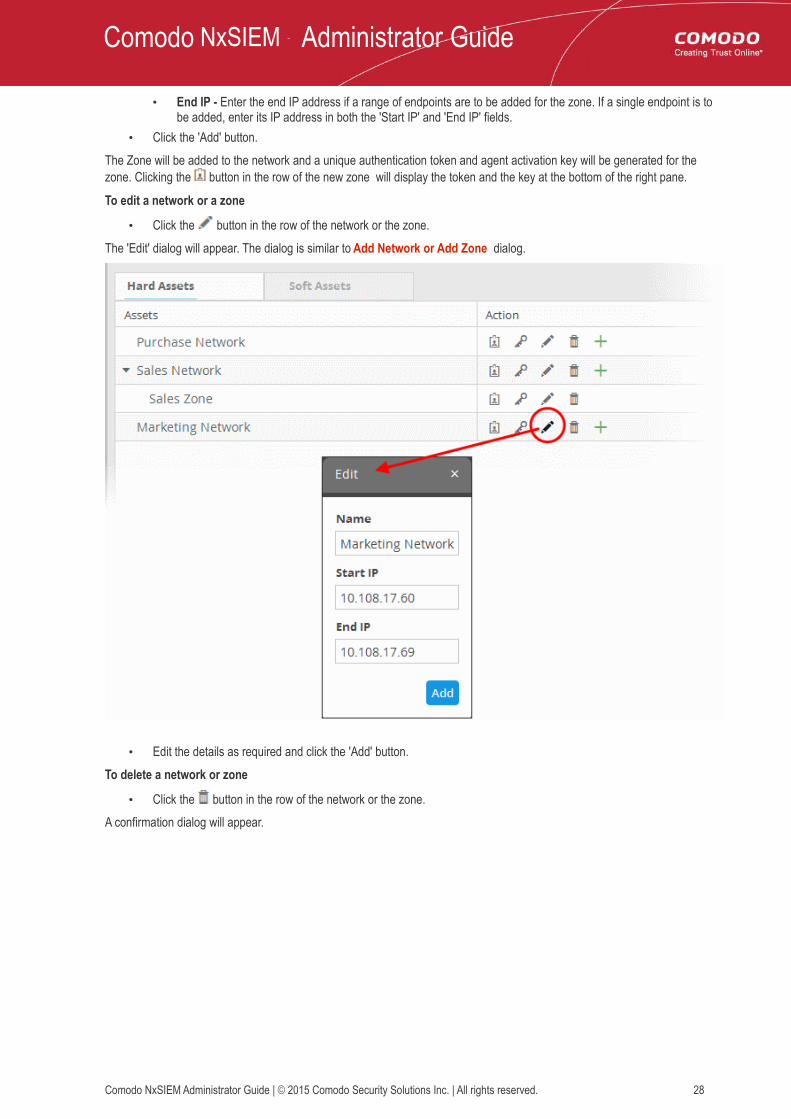
To edit a network or a zone
• Click the button in the row of the network or the zone.The 'Edit' dialog will appear. The dialog is similar to Add Network or Add Zone dialog.
• Edit the details as required and click the 'Add' button.To delete a network or zone
• Click the button in the row of the network or the zone.A confirmation dialog will appear.
• Click 'Yes' to remove the network or the zone. Please note that if a network is removed, the zones under it will also be removed.
To get the authentication token, activation key and the configuration script files for a network or a zone
• Click the button in the row of the network or zone.The authentication token and the agent activation key for the item will be displayed at the bottom of the screen.
• Authentication token - The authentication token can be used as 'AGENTLESS_AUTH_TOKEN' parameter on the configuration script that can be run on Linux endpoints with RSYSLOG utility, for agent less log collection from them. Refer to the section Agentless Log Collection for more details.
• Activation key - The activation key is used to activate the log collection agent installed on Windows and Linux endpoints in the network/zone, for connection to the NxSIEM server and to send logs from them. Refer to the section
Downloading and Installing NxSIEM Agent on Endpoints for more details. • Configuration Script Download Buttons - The configuration files can be directly run on endpoints with RSYSLOG
and NXLOG utilities respectively without any re-configuration, for them to send logs to NXSIEM server. Refer to the section Configuring Nxlog and Rsyslog servers to send logs to NxSIEM server for more details.
4.2.2 Soft AssetsThe 'Soft Assets' interface allows administrators to add and manage the services hosted from the customer networks and to create a list of important URLs, domains or IP addresses, which acts as a reference list for the operators/administrators/analysts. Suppose if any of the items displayed in this screen is affected by an incident, the operator/administrator/analyst may decide to act upon it, say for example escalate the incident from high to critical or choose any other action as required.
To open the Soft Assets interface for a customer• Open the 'Asset Management' interface by clicking the 'Menu' button, then 'Assets' > 'Asset Management'.• Select the customer whose assets are to be added, from the left hand side pane.
The Customer Details pane will open in the right.
• Click 'Manage' at the bottom left of the right pane and choose the 'Soft Assets' tab.
The list of soft assets added for the customer will be displayed. The Hard Assets interface allows you to:
• Add new Soft Assets• Remove Soft Assets
To add soft assets for a customer• Open the 'Asset Management' interface by clicking the 'Menu' button, then 'Assets' > 'Asset Management'.• Select the customer whose assets are to be added, from the left hand side pane.
The Customer Details pane will open in the right.
• Click 'Manage' at the bottom left of the right pane and choose the 'Soft Assets' tab.• Click the 'Add' button from the bottom of the right pane.
4.3 Downloading and Installing the NxSIEM Agent on Endpoints
There are two methods administrators can use to collect logs from endpoints connected to customer networks:
• Collection Agent - A Log Collection Agent installed on Windows and Linux endpoints forwards the logs to the NxSIEM server
• Agent less Collection - On target endpoints, administrators use our pre-defined scripts to configure RSYSLOG or NXLOG utilities to send the logs to the NxSIEM server
This section explains the installation of the collection agent on endpoints. The agent setup file for Windows and Linux endpoints can be downloaded from the NxSIEM administrative console. For each network and zone added, NxSIEM generates a unique agent activation key which has to be used for configuring the agent to connect to the server. Refer to the explanation of getting the activation key for a network or zone in the previous section, Hard Assets, for more details.
The next sections in this guide cover:
• Downloading the Agent Setup file• Installation on Windows Endpoints• Installation on Linux Endpoints
Downloading the Setup FilesThe agent setup files for Windows and Linux can be downloaded from the 'Agent Download' tab:
• Click the navigation button at top right then 'Agents' > 'Collection Agents' > 'Agent Download', as shown:
The 'Agent Download' page contains installation instructions and download links for Windows and Linux agents:
• Click the 'windows-agent-setup.jar' or 'linux-agent-setup.gz' button to download the respective agent.• Transfer the setup files to required endpoints for installation.
Installation on Windows EndpointsPrerequisites for a Windows agent installation:
• Software: Java 1.7 or higher preferably downloaded from Sun website.
Tip: Ensure that the network to which the endpoint is connected is added to NxSIEM for the customer. Keep the Unique Agent Activation Key of the customer/network handy to authorize the agent to connect to NxSIEM server. Refer to the explanation of getting the activation key for a network or zone in the previous section Hard Assets for more details.
To install the Agent and enroll the endpoint • Navigate to the location where the 'Windows-agent-setup' file is saved at the endpoint and double click on it.
• Click 'Yes' to continue the agent installation
• By default the collection agent is installed at C:\Program Files\MSSP Agent. If you want to install the agent in a location other than the default, click 'Browse' to choose a different location.
• Activation Key - Copy and paste the activation key that was generated for the customer network or zone for which you want to enroll the endpoint.
• Zookeeper Server Address - Enter the Zookeeper server address, including the port number.• Kafka Server Address - Enter the Kafka server address, including the port number.
• Click 'Next'The installation progress will be displayed...
….and on completion, the success dialog will be displayed.
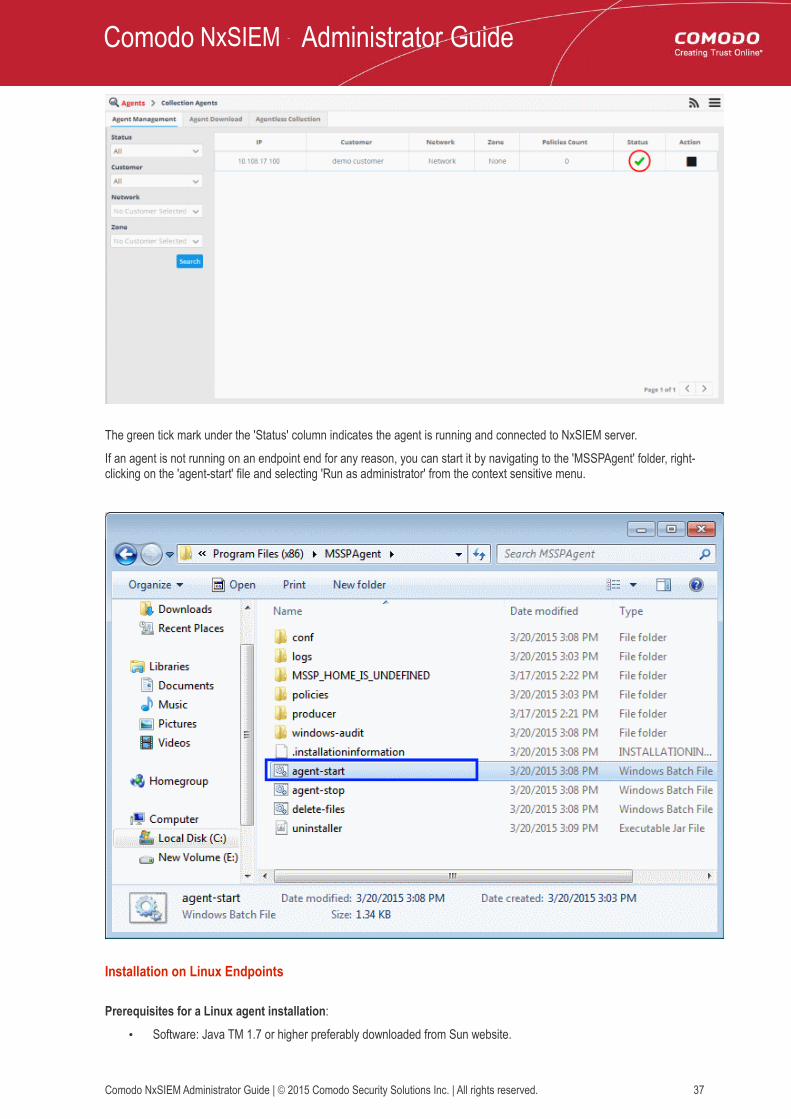
The green tick mark under the 'Status' column indicates the agent is running and connected to NxSIEM server.
If an agent is not running on an endpoint end for any reason, you can start it by navigating to the 'MSSPAgent' folder, right-clicking on the 'agent-start' file and selecting 'Run as administrator' from the context sensitive menu.
Installation on Linux Endpoints
Prerequisites for a Linux agent installation:
• Software: Java TM 1.7 or higher preferably downloaded from Sun website.
Tip: Ensure that the network to which the endpoint is connected is added to NxSIEM for the customer. Keep the Unique Agent Activation Key of the customer/network handy to authorize the agent to connect to NxSIEM server. Refer to the explanation of getting the activation key for a network or zone in the previous section Hard Assets for more details.
To install the Agent and enroll the endpoint • Navigate to the location on the endpoint where you saved 'linux-agent-setup.tar.gz' and extract it.• Open /etc/hosts file, add the IP-Hostname pairs of Zookeeper and Kafka servers and save it.• Run the installation file with the following command.
/install.sh - <IP address of Kafka server:port number> -<IP address of Zookeeper server:port number> -<Activation key for the customer/network>The log collection agent will be installed at /opt/comodo/mssp/mssp-log-agent directory.
• Start the agent manually by running the command start-agent.sh under /opt/comodo/mssp/mssp-log-agent /bin directory
The agent will establish a connection to the NxSIEM server and the endpoint will be listed for the customer under the respective network/zone.
• To stop the agent, run the command stop-agent.sh under /opt/comodo/mssp/mssp-log-agent /bin directory
4.4 Configuring Nxlog and Rsyslog to Send Logs to NxSIEM Server
Comodo NxSIEM features agent-less log collection from Windows/Linux endpoints connected to customers' networks, through the use of Nxlog and Rsyslog utilities. This is useful for customers who do not wish to install agents on their endpoints. The NXLOG utility (Windows endpoints) and the RSYSLOG utility (Linux endpoints) need to be configured to send logs to the NxSIEM server.
Comodo NxSIEM provides ready-made configuration script files for each customer's /network/zone which can be downloaded from the respective 'Customer Details' page. Once connected, the NxSIEM server will be able to receive and store logs from the customer's endpoints.
The following sections explain more about:
• Configuring the NXLOG Utility • Configuring the RSYSLOG Utility
Configuring the NXLOG UtilityAdministrators can download a specific customer's NXLOG configuration file from the administrative console and use this to configure the NXLOG utilities installed on Windows endpoints connected to the customer's network.
To download the NXLOG Configuration File• Open the 'Asset Management' interface by clicking the 'Menu' button, then 'Assets' > 'Asset Management'.• Select the customer from the left hand side pane.
The 'Customer Details' pane will open at the right.
• Click 'Manage' at the bottom left of the right pane and choose the 'Hard Assets' tab.
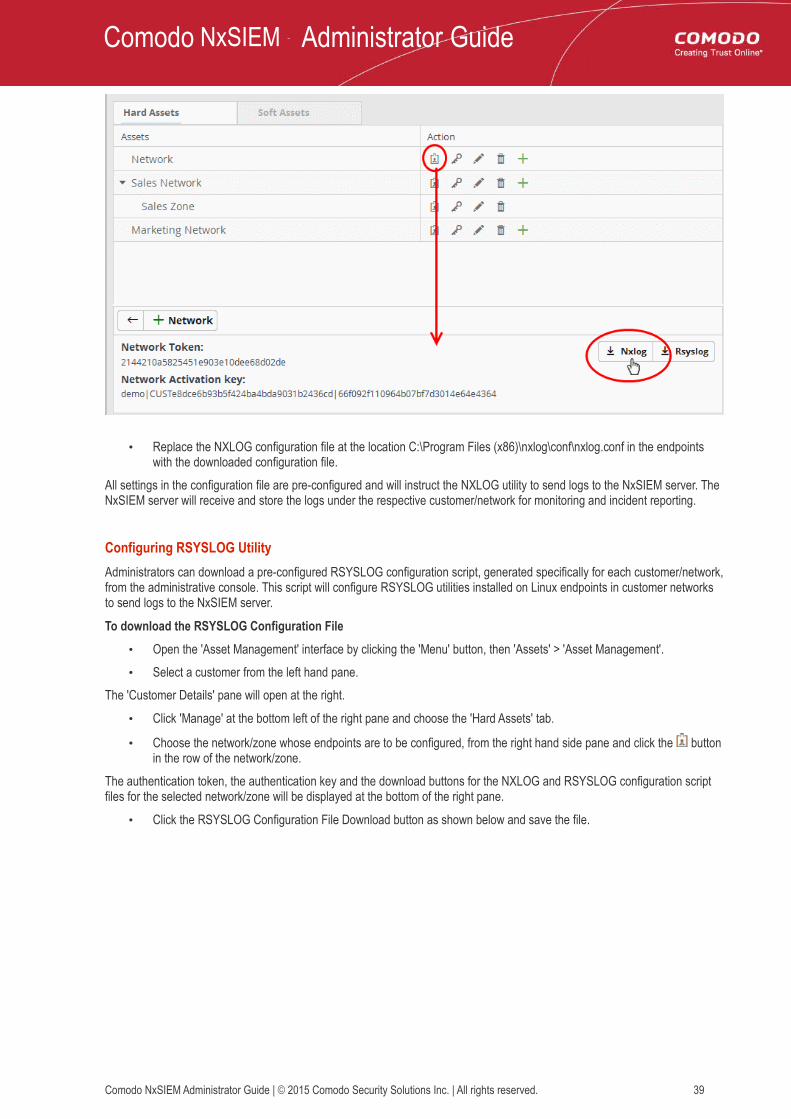
• Choose the network/zone you wish to configure from the right hand side pane and click the button in the row of the network/zone.
The authentication token, the authentication key and the download buttons for the NXLOG and RSYSLOG configuration script files for the selected network/zone will be displayed at the bottom of the right pane.
• Click the NXLOG Configuration File Download button as shown in the screenshot below and save the file:
• Replace the NXLOG configuration file at the location C:\Program Files (x86)\nxlog\conf\nxlog.conf in the endpoints with the downloaded configuration file.
All settings in the configuration file are pre-configured and will instruct the NXLOG utility to send logs to the NxSIEM server. The NxSIEM server will receive and store the logs under the respective customer/network for monitoring and incident reporting.
Configuring RSYSLOG UtilityAdministrators can download a pre-configured RSYSLOG configuration script, generated specifically for each customer/network, from the administrative console. This script will configure RSYSLOG utilities installed on Linux endpoints in customer networks to send logs to the NxSIEM server.
To download the RSYSLOG Configuration File• Open the 'Asset Management' interface by clicking the 'Menu' button, then 'Assets' > 'Asset Management'.• Select a customer from the left hand pane.
The 'Customer Details' pane will open at the right.
• Click 'Manage' at the bottom left of the right pane and choose the 'Hard Assets' tab.
• Choose the network/zone whose endpoints are to be configured, from the right hand side pane and click the button in the row of the network/zone.
The authentication token, the authentication key and the download buttons for the NXLOG and RSYSLOG configuration script files for the selected network/zone will be displayed at the bottom of the right pane.
• Click the RSYSLOG Configuration File Download button as shown below and save the file.
• Run the script file on all required endpoints. The script will configure the RSYSLOG utility to send logs to NxSIEM server. The NxSIEM server will receive and store the logs under the respective customer/network for monitoring and incident reporting.
Alternatively, you can download the script file for configuring the RSYSLOG utility from 'Agents' > 'Collection Agents' > 'Agentless Collection' interface, manually enter the parameters for the customer network to be monitored and run the script at the endpoints. Refer to the section Agentless Log Collection for more details.
4.5 Editing CustomersAdministrators can edit the details of a customer such as name of the company, its address and location. If required, the customer can also be removed from NxSIEM.
To edit a customer's details• Open the 'Asset Management' interface by clicking the 'Menu' button, then 'Assets' > 'Asset Management'.• Select the customer from the left hand side pane.
The 'Customer Details' pane will open at the right.
• Edit the details as required and click the 'Add' button and then the 'Save' button at the bottom of the interface.
• To remove a contact for the customer, click the button and then click the 'Save' button at the bottom of the interface.
• To remove a customer, click the button beside the 'Manage' button at the bottom.A confirmation dialog will appear.
• Click 'Yes' to remove the customer.If a customer is removed, all the hard and soft assets added for the customer will also be removed and the customers networks will not be monitored.
5 Log Collection Agents and PoliciesComodo NxSIEM is capable of collecting logs in two ways - by deploying agents or by using NXLOG/RYSLOG software utilities (agent-less collection). You can download the agents, configure polices to collect logs and more from the 'Agents' menu.
Refer to the following sections for more details:
• Collection Agents• Log Collection Policies
5.1 Collection AgentsThe 'Collection Agents' interface allows administrators to download NxSIEM agents for Windows and Linux endpoints, manage
agents and configure RSYSLOG software utility for agent-less log collection.
To open the 'Collection Agents' interface, click the 'Navigational Menu' button from the top right, choose 'Agents' and then click 'Collection Agents'.
The 'Collection Agents' interface has three tabs:
• Agent Management - Displays all customer endpoints that have log collection agents installed. Also allows the administrator to manually start and stop agents as required. Refer to the section Managing Agents for more details.
• Agent Download - Enables administrators to download the log collection agent installation files for Windows and Linux endpoints. Refer to the section Downloading NxSIEM Agents for Windows and Linux Endpoints for more details.
• Agentless Collection - Enables administrators to download configuration scripts for the Linux RSYSLOG utility. This will allow you to collect logs from Linux endpoints without installing the collection agent. Refer to the section Agentless Log Collection for more details.
5.1.1 Downloading NxSIEM Agents for Windows and Linux EndpointsComodo NxSIEM uses agents deployed on endpoints to collect logs for monitoring and analysis. After installation, each agent needs to be activated using the activation key specific for the customer's network.
To download the agent setup file• Click the 'Navigational Menu' button from the top right, then choose 'Agents' > 'Collection Agents'• Click the 'Agent Download' tab:
The 'Agent Download' page contains instructions for installing the agent on Windows and Linux endpoints and allows you to download the agent installation files. Read the instructions fully.
• Click the 'windows-agent-setup.jar' or 'linux-agent-setup.gz' button to download the respective agent.After downloading the agent setup file, transfer it to the endpoint that you want to import into NxSIEM and monitor and install the agent. For more details on installing the agent, refer to the section Downloading and Installing the NxSIEM Agent on Endpoints.
5.1.2 Managing AgentsThe 'Agent Management' interface allows administrators to view all customer endpoints that have the log collection agent installed, allow with details such as network and zone, the number of collection policies deployed on the agents and more. The administrator can also manually start/stop the agent at the required endpoints.
To access the agent management interface• Click the 'Navigational Menu' button from the top right and choose 'Agents' from the options and then click 'Collection
IP The IP address of the endpoint that is enrolled.
Customer The name of the customer to which the enrolled endpoint is linked.
Network The name of the network to which the endpoint is added. Refer to the section 'Hard Assets' for more details on adding networks/zones.
Zone The name of the zone to which the endpoint is added. Refer to the section 'Hard Assets' for more details on adding networks/zones.
Policies Count The number of log collection policies in effect on the agent. Refer to the section 'Log Collection Policies' for more details on deploying policies to agents.
Status Indicates whether the agent is running or stopped.
Action Allows administrators to stop or start the agent.
Filter OptionsThe filter options on the left allow you to display endpoints according customer, network, running status and more.
• Status - Allows you to filter the list depending on the current running status of the agents. The options available are:• All - Displays all the endpoints• Up - Displays the endpoints whose agents are running• Down - Displays the endpoints whose agents are stopped
• Customer - Allows you to filter the list depending on the customers. You can further refine the list by choosing the network/zone added for the customer.
• Network - Allows you to filter the list by choosing the network pertaining to the selected customer.• Zone - Allows you to filter the list by choosing the zone formed in the chosen network.
• Click 'Search' after selecting the filter parameters to filter the list.
• Click the button in the row of the agent, under the 'Action' column to stop an agent. The agent stopped message will be displayed:
To restart an agent
• Click the button in the row of the agent, under the 'Action' column.
5.1.3 Agentless Log CollectionAs an alternative to installing an agent, logs can be collected from endpoints by configuring the Nxlog (Windows) and Rsyslog (Linux) utilities on target endpoints.
The NxSIEM console contains customer-specific configuration scripts for both utilities which will automatically configure the utilities to send logs to NxSIEM.
Scripts can be configured and deployed in two ways:
• Pre-configured script files - The administrator can download ready-made configuration script files with all parameters pre-configured for a specific customer/network from the 'Hard Assets' interface. This is the most convenient way of configuring NXLOG and RSYSLOG utilities at the endpoints to send logs to the NXSIEM server. Refer to the section Configuring Nxlog and Rsyslog to Send Logs to NxSIEM Server for more detailed explanations on downloading the script files and deploying them.
• Manually configure RSYSLOG/NXLOG scripts - Administrators can download configuration scripts for RSYSLOG and NxLOG and manually set the parameters such as network authentication token, name of product from which the logs are to be collected and so on. These scripts can be used to configure RSYSLOG and NxLOG utilities at Linux and Windows based endpoints to send logs to the NXSIEM server.
To download the manual configuration script for RSYSLOG and NxLOG• Click the 'Menu' button from the top right, choose 'Agents' and then click 'Collection Agents'• Click the 'Agentless Collection' tab.
The 'Agentless Collection' page contains instructions on downloading the scripts, setting the parameters and configuring the RSYSLOG/NxLOG utilities using the scripts.
5.2 Log Collection PoliciesCollection policies allow administrators to define events for which logs should be collected, the sources from which logs are collected and so on. These can then be deployed to control the behavior of agents on managed customer endpoints. These logs are used to generate incidents, can be queried and used to generate comprehensive event reports. Refer to the sections 'Configuring Event Queries' and 'Report Generation' for more details.
Four types of collection policies are available in NxSIEM:
• Audit Policy - Agents collect the audit events from the host machine. This policy type does not require any additional configuration.
• Flat File Policy - This policy type allows administrators to configure agents to track and send specific files from the agent's host machine.
• Remote Collection Policy - This policy type allows administrators to configure agent installed on one machine to track a log file from another machine.
• Syslog Policy - This policy type allows administrators to configure the agent to collect Syslog entries from a specific port
Log collection policies can be configured and deployed from the 'Collection Policies' interface.
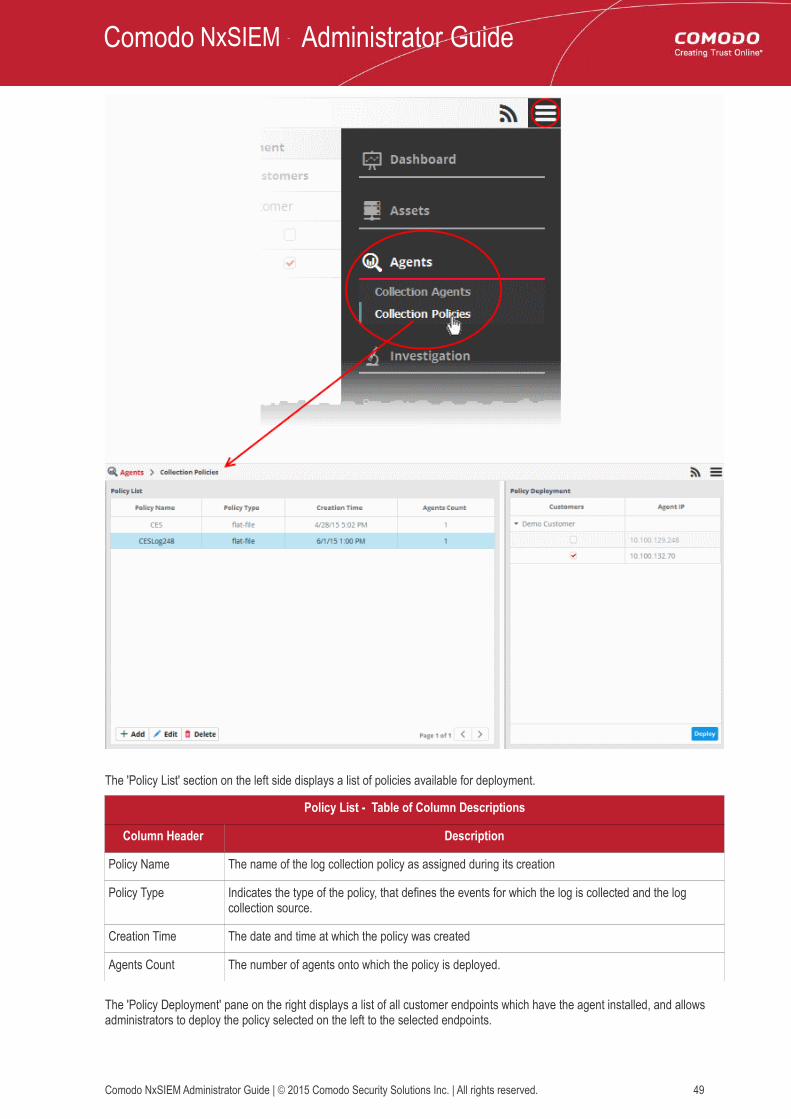
To open the 'Collection Policies' screen, click the 'Navigational Menu' button from the top right and choose 'Agents' from the options and then click 'Collection Policies'.
The 'Policy List' section on the left side displays a list of policies available for deployment.
Policy List - Table of Column Descriptions
Column Header Description
Policy Name The name of the log collection policy as assigned during its creation
Policy Type Indicates the type of the policy, that defines the events for which the log is collected and the log collection source.
Creation Time The date and time at which the policy was created
Agents Count The number of agents onto which the policy is deployed.
The 'Policy Deployment' pane on the right displays a list of all customer endpoints which have the agent installed, and allows administrators to deploy the policy selected on the left to the selected endpoints.
Customers The name of the customer. Below each customer, the check boxes indicate the deployment state of the policy selected from the left hand side pane on the corresponding endpoint shown in the Agent IP column. The check boxes can be used to deploy or remove the selected policy to the endpoints. Refer to the section 'Deploy a policy' for more details.
Agent IP The IP addresses of the systems in which the agents are installed
Following sections contain descriptions of different types of policies, and explain on creating and deploying policies to selected agents:
5.2.1 Audit Events PolicyThe 'Audit Event' policy type allows administrators to collect logs from audit events at the endpoints. The audit event logs are available by default in Windows and Linux systems and this type of policy does not require any additional configuration. The administrator can create a schedule to collects logs and define a blackout period during which the agent will not collect logs. The newly created policy can then be deployed onto the agents installed in the customer's endpoints. Refer to the section 'Configuring Log Collection Policies' for more details.
To create an audit policy
• Open the Collection Policies interface by clicking the 'Navigational Menu' button from the top right, choosing 'Agents' from the options and then clicking 'Collection Policies'.
• Click the 'Add' button at the bottom of the 'Collection Policies' screen at the left.The configuration screen for creating a new policy will be displayed.
• Choose 'Audit' from the 'Policy Type' drop-down.The configuration screen for Audit Policy will be displayed.
• Enter a name for the new policy in the 'Policy Name' field at the top.The Audit policy does not require any additional configuration as it instructs the agent to collect logs from audit events and is to be always ON. Hence the configuration area at the right is disabled for this policy type.
The policy will be added to NxSIEM and will be available for deployment to endpoints. Refer to the section 'Configuring Log Collection Policies' for more details on deploying the newly created policy onto customer's endpoints.
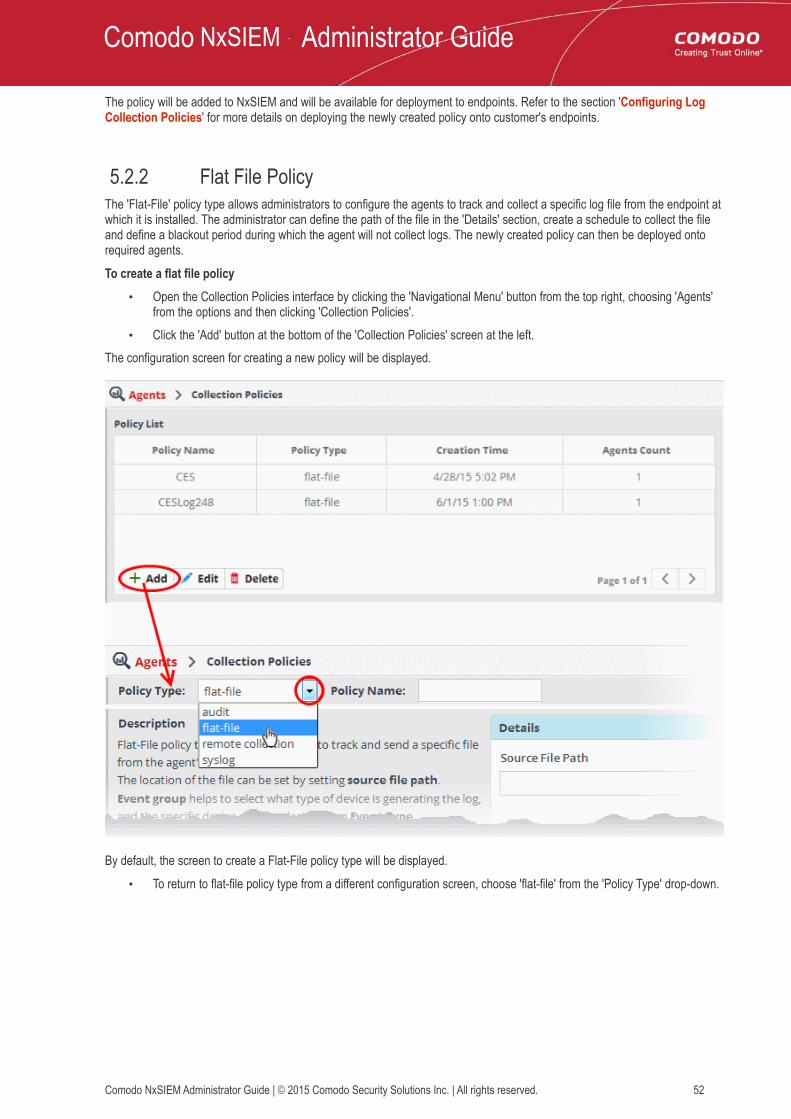
5.2.2 Flat File PolicyThe 'Flat-File' policy type allows administrators to configure the agents to track and collect a specific log file from the endpoint at which it is installed. The administrator can define the path of the file in the 'Details' section, create a schedule to collect the file and define a blackout period during which the agent will not collect logs. The newly created policy can then be deployed onto required agents.
To create a flat file policy• Open the Collection Policies interface by clicking the 'Navigational Menu' button from the top right, choosing 'Agents'
from the options and then clicking 'Collection Policies'.• Click the 'Add' button at the bottom of the 'Collection Policies' screen at the left.
The configuration screen for creating a new policy will be displayed.
By default, the screen to create a Flat-File policy type will be displayed.
• To return to flat-file policy type from a different configuration screen, choose 'flat-file' from the 'Policy Type' drop-down.
• Enter a name for the new policy in the 'Policy Name' fieldNext you need to configure the details defining the source of log collection, schedule and blackout period of log collection.
To configure the details for the new policy• Click the 'Details' stripe
• Source File Patch - Enter the location of the log file in the endpoint that the agent should collect and forward to NxSIEM server
• Event Group: Select the 'Event Group' for which the log should be collected. The options available are:• Firewall and UTM• Application• Endpoint Security• Data Protection• Network Intrusion Detection & Protection• Network Monitoring
• Event Type - Choose the product for which the logs are to be collected, based on the chosen event group. • Time Type - Select the time stamp that the agent should use for the logs, whether to use host machine's
time stamp or the log's own time stamp• Time Format - Select the time format to be used, from the drop-down.
The 'Timing' section allows you to define the period for log collection.
• Occurs - Select the period for log collection from the drop-down. The options available are:• Hourly• Daily• Weekdays• Weekend• Weekly• Monthly
• Reoccurs every - Enter the frequency for log collection at the chosen days. For example, if you select 'Daily' and enter 2, then the agent will collect the logs once in every 2 days
• Occurs At - Enter the exact time at which the log should be collectedThe 'Duration' section allows you to define the start and end months for the period of log collection.
• Start - Select the start month from the drop-down• End - Select the end month from the drop-down
The 'Timing' section allows you to define the blackout period.
• Occurs - Select the period for blackout from the drop-down. The options available are:• Daily• Weekdays• Weekend• Weekly• Monthly
• Reoccurs every - Enter the frequency for blackout period. For example, if you choose daily and enter 2, then the blackout will occur once in every 2 days
The 'Duration' section allows you to define the start and end time for blackout duration within the chosen period.
• Start - Enter the start time for the blackout duration• End - Enter the end time for the blackout duration
• Click the 'Submit' button to save your changes.
The policy will be added to NxSIEM and will be available for deployment to endpoints. Refer to the section 'Configuring Log Collection Policies' for more details on deploying the newly created policy onto customer's endpoints.
5.2.3 Remote Log Collection PolicyThe 'Remote Collection' policy is similar to the 'Flat-File' policy except this is configured to collect logs from an endpoint with no agent installed, using agent installed on another endpoint. Additional information required for this policy includes IP or domain address of the endpoint from which the logs are to be collected, username and password to access the log and connection protocol. The administrator can create a schedule to collects the logs.
To create a remote log collection policy• Open the Collection Policies interface by clicking the 'Navigational Menu' button from the top right, choosing 'Agents'
from the options and then clicking 'Collection Policies'.• Click the 'Add' button at the bottom of the 'Collection Policies' screen at the left.
The configuration screen for creating a new policy will be displayed.
• Choose 'remote collection' from the 'Policy Type' drop-down.The configuration screen for remote collection policy will be displayed.
• Enter a name for the new policy in the 'Policy Name' fieldNext you need to configure the details defining the source of log collection and the schedule for log collection.
To configure the details for the new policy• Click the 'Details' stripe
• Source File Patch - Enter the location of the log file in the remote endpoint that the agent from another endpoint should collect and forward to NxSIEM server.
• Type - Select the type of address to be entered for the remote endpoint. The options available are 'IP' and 'Domain'. Enter the address of the remote endpoint as per the chosen type in the field that appears below the 'Type' field.
• Time Type - Select the time stamp that the agent should use for the logs, whether to use host machine's time stamp or the log's own time stamp
• Time Format - Select the time format to be used, from the drop-down.• Time Type - Select the time stamp that the agent should use for the logs. The optiion avawhether host
machine's time stamp or the log's own time stamp.• Username - Enter the username of an administrative account for the agent to log-in to the remote endpoint,
in order to access the log files.• Password - Enter the password for the administrative account.• Protocol - Select the type of protocol to be used for the agent to connect to the remote endpoint to collect
the logs.• Event Group - Select the 'Event Group' for which the log should be collected. The options available are:
• Firewall and UTM• Application• Endpoint Security• Data Protection• Network Intrusion Detection & Protection• Network Monitoring
• Event Type - Choose the product for which the logs are to be collected, based on the chosen event group. To create a schedule
The 'Timing' section allows you to define the period for log collection.
• Occurs - Select the period for log collection from the drop-down. The options available are:• Hourly• Daily• Weekdays• Weekend• Weekly• Monthly
• Reoccurs every - Enter the frequency for log collection at the chosen days. For example, if you select 'Daily' and enter 2, then the agent will collect the logs once in every 2 days
• Occurs At - Enter the exact time at which the log should be collectedThe 'Duration' section allows you to define the start and end months for the period of log collection.
• Start - Select the start month from the drop-down• End - Select the end month from the drop-down
• Click the 'Submit' button to save your changes.
The policy will be added to NxSIEM and will be available for deployment to endpoints. Refer to the section 'Configuring Log Collection Policies' for more details on deploying the newly created policy onto customer's endpoints.
5.2.4 Syslog PolicyThe 'Syslog' policy allows administrators to configure the agent installed on one endpoint to listen to a specified port of remote endpoints with no agent installed, in order to collect the logs from them, for example from a Syslog server, Linux servers and Windows servers that use syslog protocol in order to collect the logs. Please note that these systems must be configured to send logs from syslog to the endpoint on which the agent is installed. Multiple remote endpoints can be added for a single policy and each endpoint can be configured to provide log pertaining to specific events. No schedule and blackout options are available for this type of policy.
• Open the Collection Policies interface by clicking the 'Navigational Menu' button from the top right, choosing 'Agents' from the options and then clicking 'Collection Policies'.
• Click the 'Add' button at the bottom of the 'Collection Policies' screen at the left.The configuration screen for creating a new policy will be displayed.
• Choose 'syslog' from the 'Policy Type' drop-down.The configuration screen for syslog policy will be displayed.
• Enter a name for the new policy in the 'Policy Name' fieldNext you need to configure the details defining the source of log collection.
• Port - Specify the port number which will be used by the agent in one endpoint to connect to the remote endpoint(s).
• Connection Type - Select the type of connection protocol to be used for the agent to connect to the remote endpoint to collect the logs from the drop-down. The options available are TCP, UDP and BOTH.
Note: The port number and the connection type should match with the syslog connection configuration made at the remote endpoints.
• Click the 'Add' button at the bottom end of the list of remote endpoints. to add the endpoints from which the logs should be fetched.
• IP - Enter the IP address of the remote endpoint. • Event Group - Select the 'Event Group' for which the log should be collected. The options available are:
• Firewall and UTM• Application• Endpoint Security• Data Protection• Network Intrusion Detection & Protection• Network Monitoring
• Event Type - Choose the product for which the logs are to be collected, based on the chosen event group. • Click the 'Submit' button in the 'Add Event Group' dialog.
The remote endpoint will be added to the policy.
• Repeat the process to add more number of remote endpoints.• Click the 'Submit' button to save your changes.
The policy will be added to NxSIEM and will be available for deployment to endpoints. Refer to the section 'Configuring Log Collection Policies' for more details on deploying the newly created policy onto customer's endpoints.
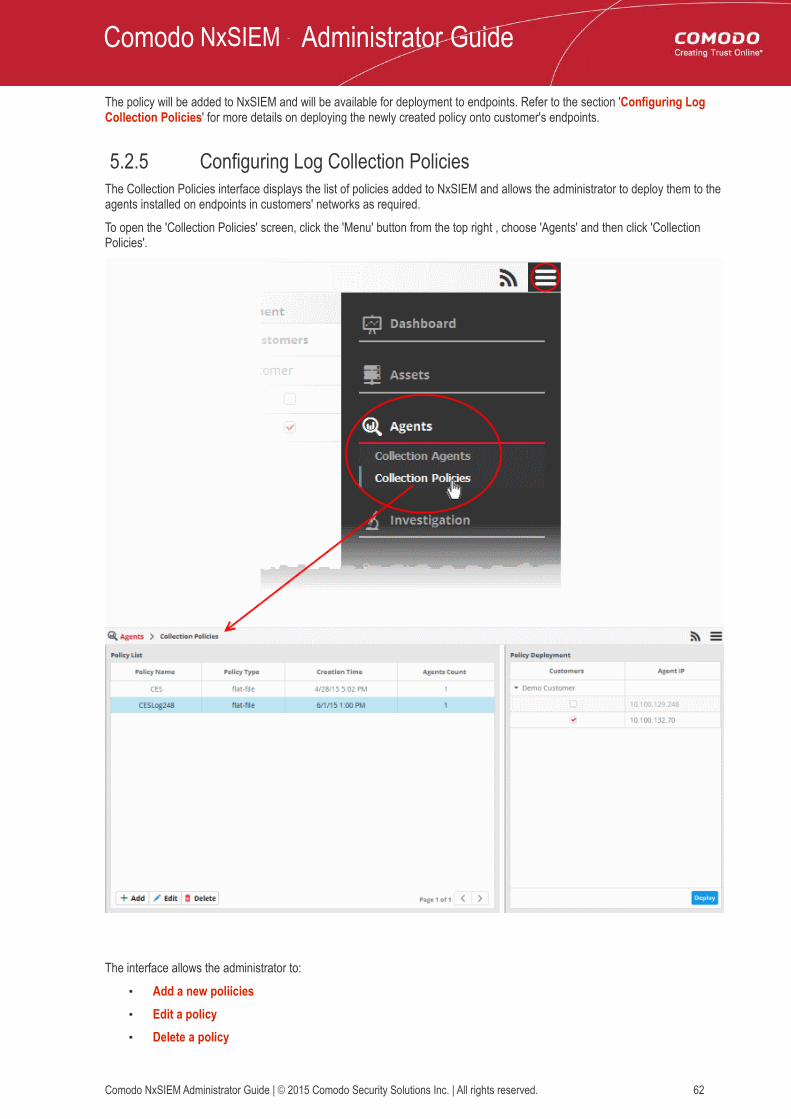
5.2.5 Configuring Log Collection PoliciesThe Collection Policies interface displays the list of policies added to NxSIEM and allows the administrator to deploy them to the agents installed on endpoints in customers' networks as required.
To open the 'Collection Policies' screen, click the 'Menu' button from the top right , choose 'Agents' and then click 'Collection Policies'.
The interface allows the administrator to:
• Add a new poliicies• Edit a policy• Delete a policy
To add a new policy• Click the 'Add' button on the bottom of the screen.
Refer to the sections 'Audit Events Policy', 'Flat File Policy', 'Remote Log Collection Policy' and 'Syslog Policy' for details on adding different types of policies.
To edit a policy• Select the policy from the list that you want to edit and click the 'Edit' button at the bottom of the screen.
The configuration interface of the selected policy type will be displayed. Edit the details as required. The editing procedure is similar to adding a new policy process. Refer to the sections 'Audit Events Policy', 'Flat File Policy', 'Remote Log Collection Policy' and 'Syslog Policy' for more details.
To delete a policy• Select the policy from the list that you want to remove and click the 'Delete' button at the bottom of the screen.
A confirmation dialog will appear.
• Click 'Yes' to remove the policy.If a policy is deleted it will be automatically removed from all the agents on which it was deployed.
• Select the policy from the 'Policy List' pane at the right of the Collection Policies interfaceThe Policy Deployment pane at the right displays the list of all endpoints from all the customers. The endpoints on which the policy is already applied, are indicated with tick mark in the checkboxes beside them under each customer.
• To deploy the selected policy to a new endpoint, select the checkbox beside it under the respective customer name.• To remove the policy from the endpoints de-select the checkboxes beside them under the respective customer name
• Click the 'Deploy' button.
The 'Agents Count' column will also be updated and the number of agents on which the policy is deployed.
To view policy deployment statusThe 'Agent Count' column in the 'Policy List' section displays the number of systems onto which the policies are deployed.
• Click on a policy to view the systems onto which they are deployed.
6 Query ManagementThe administrator can query the logs database to search for logs corresponding to specific events from specific customers. The 'Investigation' feature allows the administrators to build queries for searching specific logs, for constructing correlation rules for identifying incidents and to create custom dashboards which display the resulting data as graphical charts. Comodo NxSIEM ships with a set of predefined queries for each customer and also allows you to add custom queries for customers according to your requirements.
6.1 Configuring Event QueriesThe 'Event Query' interface allows administrators to search for specific events using built-in queries. The administrator can also add custom 'Event Queries' according to specific requirements. You have to create conditions for a search and configure the results table accordingly to display the search results. Queries can be made to search for events that occurred during a specific time period in the selected customer's networks. The results table displays events which match the query with the fields specified for the results table as columns. The results table even allows you to perform an IP look up of external IP addresses involved in the event.
Once created, an event query can also be used for:
• Constructing custom dashboards which display query results as graphical charts. Refer to the section 'Configuring Custom Dashboard' for more details.
• Constructing 'Correlation Rules' which identify harmful events/incidents on customer networks and assign them to customer administrators for attention. Refer to the section Managing Rules for more details.
To open the 'Event Query' interface, click the 'Menu' button at top right, choose 'Investigation' then 'Event Query'.
The left hand panel displays a list of predefined queries and custom queries for the selected customer. The main panel displays the parameters of the selected query and the output of the query in the lower pane. Click 'Search' to run the query.
The 'New Query' tab contains a query builder which allows you to create a new query for the selected customer. Any queries you create will be added to 'Custom queries'.
Event Query Interface - Table of controls
The 'Customers' drop-down allows you to select the customer for which you want to query events and/or add custom queries.
Allows you to add a new 'Queries' folder to the left side panel
Allows you to a add new event query under a selected query folder
Allows you to delete selected query folders or event queries
Allows you to add conditions for a query. The options available from the drop-down are: • AND• OR• NOT
• Click the button to add a condition for a query.
• Click the button to delete a condition
Allows you to expand or collapse the upper pane to view the complete list of conditions in the query.
Allows you to configure the 'Results' table for the query displayed in the upper pane.
Allows you to save a newly created or edited event query, configured from the upper pane.
Allows you to save a copy of the query to a different folder or a new query created using an existing query as a template, with a different name.
Allows you to configure alerts and email notifications based on the quantity of events detected by the query within a specified period. Refer to the explanation under 'Configure duration based alerts' for more details.
Allows you to run a query search for a specific period in the past. You can set the start end dates to search for events matching the conditions defined in the query and click the 'Search' button in the 'Advanced Search' dialog that appears on clicking this button to view the list of events. Please note the event query created for searching events in the specific period in the past using this option, cannot be saved.
Allows you choose the time period from which events are fetched. Periods range from 1 hour to 7 days.
Allows you to run a search operation based on the configured query.
The interface allows administrators to:
• Manage query folders• Add and Manage event queries• Configure results table for a query• Configure duration based alerts• Run event queries
• View Results Table• Perform IP Lookup of External IP Addresses from results using IPVOID• Perform Lookup of IP Address/Domains from results using Virus Total• Add Field values to Live Lists from results• View Aggregated results• Update and Refine Queries from results
Manage a Query FolderQuery folders contain collections of event queries. Every new query must be placed in a query folder.
Creating a query folder• Choose the customer from the 'Customers' drop-down at the top of the left panel.
Predefined queries added for a customer are displayed in a tree structure in the 'Queries' pane.
• Choose the parent folder to create a new sub-folder and click the button. The Folder Name dialog will appear.
• Enter the name for the folder and click the 'Add' buttonThe folder will be saved and displayed on the left side
The relevant event queries can now be placed under the newly created folder. Refer to 'Manage an Event Query' for more details.
Editing a query folder
• To edit the name of a query folder, select it and click the button
• Edit the name as required and click the 'Save' button
Deleting a query folder
• To delete a query folder, select it and click the buttonA confirmation dialog will appear.
• Click 'Yes' in the In the confirmation dialog. Please note all event queries in the folder will also be deleted.
Manage an Event QueryEvent queries can be created in two ways:
• Creating a new event query by defining conditions• Creating a new query using an existing query as a template
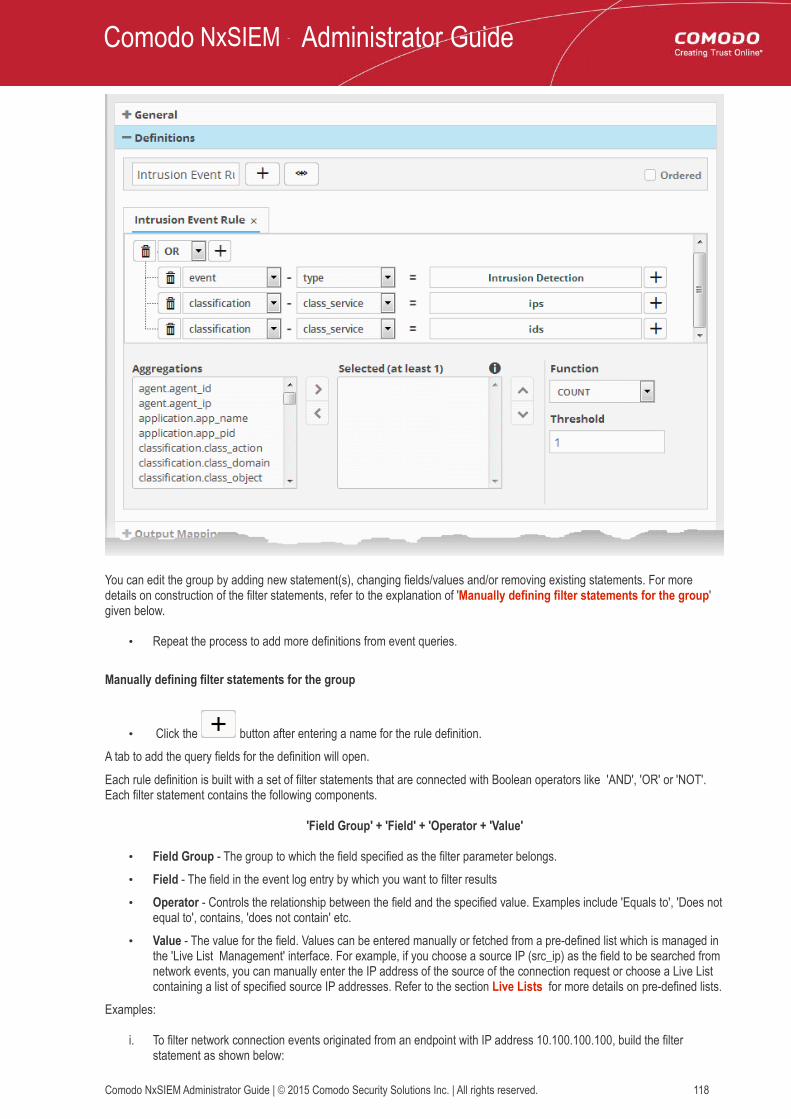
Creating a new event queryAn event query is built with a set of filter statements that connected by Boolean operators, 'AND', 'OR' or 'NOT'. Each filter contains the following components.
'Field Group' + 'Field' + 'Operator + 'Value'
• Field Group - The group to which the field specified as the filter parameter belongs. • Field - The field in the event log entry by which you want to filter results• Operator - Controls the relationship between the field and the specified value. Examples include 'Equals to', 'Does not
equal to', contains, 'does not contain' etc.• Value - The value for the field. Values can be entered manually or fetched from a pre-defined list which is managed in
the Live List Management' interface. For example, if you choose a source IP (src_ip) as the field to be searched from network events, you can manually enter the IP address of the source of the connection request or choose a Live List containing a list of specified source IP addresses.
When the query is run, events will be fetched from the database and checked against the filter statements one by one.
Examples:
i. To search for network connection events originated from an endpoint with IP address 10.100.100.100, build the filter statement as shown below:
'Source' + 'src_ip' + '=' + '10.100.100.100'ii. To search for network connection events originated from a set of endpoint whose IP addresses start with
10.100.100.xxx, build the filter statement as shown below:'Source' + 'src_ip' + 'AB*' + '10.100.100
iii. To search for network connection events originated from a set of endpoint whose IP addresses are defined in the 'Live List type' named 'Internal' under the 'Live List' named 'IP Blacklist' build the filter statement as shown below:
'Source' + 'src_ip' + '[a]' + 'IP Blacklist' + 'Internal'You can create more complex queries by adding more filter statements and linking them using 'AND', 'OR', or 'NOT'. For example:
• To search for network connection events originated from an endpoint with IP address 10.100.100.100, and destined to another endpoint with IP address 10.100.100.120, build the filter statements with an AND combination as shown below:
'Source' + 'src_ip' + '=' + '10.100.100.100'
AND
'Destination' + 'dst_ip' + '=' + '10.100.100.120'To add a new event query for a customer
• Select the customer from the 'Customers' drop-down at the top of the left hand panel.• Select the appropriate folder or create a new query folder under which you want to create an event query.
Alternatively, you can also select a folder while saving a query.
• Click the button.
A 'New Query' tab will be displayed.
Tip: You can also use the 'New Query' tab that is displayed as the first tab on selecting a customer, to create a new query. You can save the created query by selecting an appropriate folder from the left side panel.
The next step is to add the filters for the query.
• Choose the combination condition for the query filter statements to be defined from the drop-down in the 'Query Builder' pane. The options available are:
• AND• OR• NOT
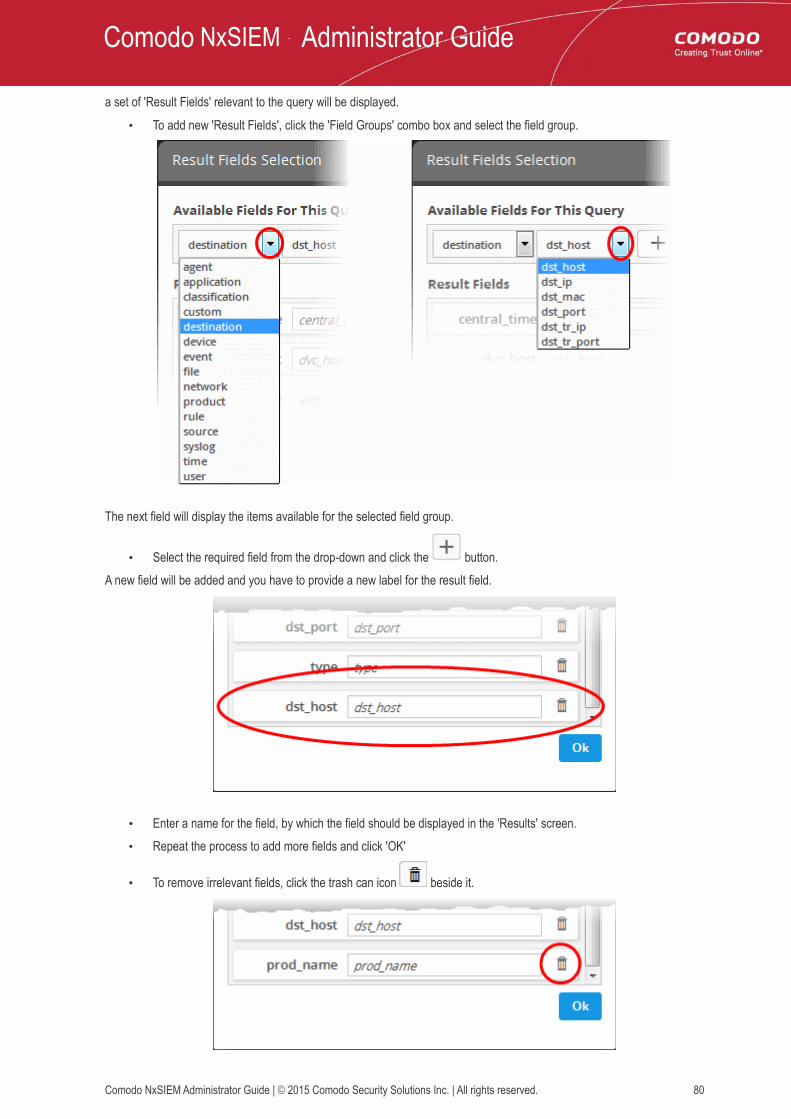
• Click the button to add a filterThe 'Field Groups' drop-down and 'Fields' drop-down will appear. The 'Fields' drop-down will contain options relevant to the 'Field Group' chosen from the drop-down at the left.
• Choose the field group you wish to add to the filter from the 'Field Groups' drop-down.
The next field will display the fields available for the selected field group.
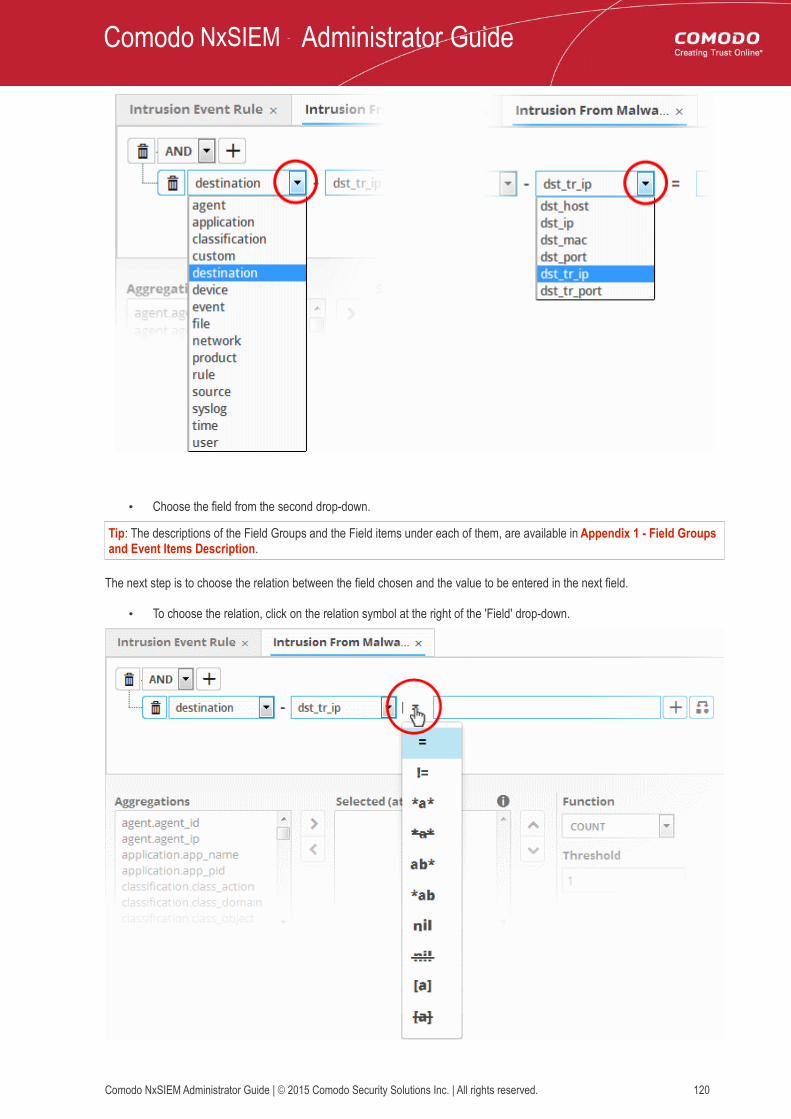
Tip: The descriptions of the Field Groups and the Field items under each of them, are available in Appendix 1 - Field Groups and Event Items Description.
The next step is to choose the relationship operator between the two fields.
• To choose an operator, click the drop-down between the two fields:
The types operators depends on the field chosen. The following table explains the various operator symbols:
Relation Operator Description Entering the value for the 'Field'
Equals to Manually enter a value in the field to the right of the operator. Events containing the same value will be identified by the query.
Does not equal to Manually enter a value in the field to the right of the operator. Events that do not contain the value will be identified by the query.
Greater than Applicable only for fields with numerical values, for example, port numbers.Manually enter a value in the field to the right of the operator. The query will identify events that contain values greater than the entered value.
Greater than or equal to Applicable only for fields with numerical values, for example, port numbers.Manually enter a value in the field to the right of the operator. The query will identify events that contain values equal to or greater than the entered value.
Less than Applicable only for fields with numerical values, for example, port numbers.Manually enter a value in the field to the right of the operator. The query will identify events that contain values less than the entered value.
Less than or equal to Applicable only for fields with numerical values, for example, port numbers.Manually enter a value in the field to the right of the operator. The query will identify events that contain values equal to or lower than the entered value.
Contains Manually enter a value in the field to the right of the operator. The
query will identify events that contain the entered value somewhere in the string.For example, to search for events with source IP addresses containing 123 anywhere in the address, enter '123'.
Does not contain Manually enter a value in the field to the right of the operator. The query will identify events that do not contain the entered value anywhere in the string.For example, to search for events with source IP addresses that do not contain 123 anywhere in the address, enter '123'.
Starts with Manually enter a value in the field to the right of the operator. The query will identify events that begin with the entered value.For example, to search for events with source IP addresses starting with 192, enter '192'.
Ends with Manually enter a value in the field to the right of the operator. The query will identify events that end with the entered value.For example, to search for events with source IP addresses that end with 123, enter '123'.
Is Empty Searches for events in which the selected field is empty (does not contain any value).For example, to search for the events with no values in their source IP address fields, select 'Is Empty'.
Is Not Empty Searches for events in which the selected field is not empty (contains a value of some kind).For example, to search for the events with some IP addresses values in their source IP address fields, select 'Is Not Empty'.
Is in List Allows you to configure the filter statement to fetch values for the field from a pre-defined live list containing specific values for the field type.Background:Live Lists enable administrators to add and manage lists of values for different fields for use in queries and correlation rules. Lists can be created and the values can be updated manually or configured to be fetched from outputs of correlation rules. The updates in a list will be immediately reflected in the queries and the rules in which it is used, relieving the administrator from the burden of updating queries and rules for change in values to be queried. For more details on Live Lists management, refer to the section Live Lists.
On selecting as the relation parameter, drop-down options will appear for the List and the List type:
The first drop-down shows the Live Lists that contain values for the selected query field. The second drop-down shows the List Types within the selected 'Live List'.
• Choose the Live List to be used in the query filter from
the first drop-down.• Choose the sub list that contains the set of values to be
included in the query filter from the second drop-down.All the values contained in the list will be included as values for the Field specified in the filter statement.
Not in List Allows you to configure the filter statement to search for the events that do not contain specific values from a pre-defined live list .
On selecting as the relation parameter, drop-down options will appear for the List and the List type:
The first drop-down shows the Live Lists that contain values for the selected query field. The second drop-down shows the List Types within the selected 'Live List'.
• Choose the Live List to be used in the query filter from the first drop-down.
• Choose the sub list that contains the set of values to be input as exclusions to the query filter from the second drop-down.
The results will display all events that do not contain the values in the live lists.
If you are adding values for source parameters like source IP address, source port, source MAC etc., but wish to reverse the
parameter, click the switch icon that appears to the right of the statement. The field group and the field selected will automatically switch from source to destination or vice-versa.
• For example, if you are specifying a live list containing values of source IPs for the source IP field, but want to change them to destination IPs, you can click the switch button.
• To add a sub-filter statement, click the button beside the filter and repeat the process. • To set the relationship between each statement, use the drop-down menu.• For example, the query below will return events whose source ends with 10.100 OR .com AND whose destination is
86.105.227.125
Tip: You can update and refine a query by adding more filters once you have seen the results. Refer to the section Updating a Query for more details.
• To add more filter statements to the query, click the button and repeat the process.
• To delete a filter , click the button beside it.• Click the 'Save' button in the 'Query Builder' screen.
• Enter the name of the query in the 'Query Name' field and click the 'Save' button .The 'Event Query' will be saved under the selected folder and displayed.
Note: If you didn't select a folder in the first step you will be asked to do so when saving the query.
The next step is to run the event query. Before that, however, the 'Results' table must be checked and configured so that it is relevant to the event query. Refer to 'Configure Results Table for a Query' for more details.
Creating a new query using an existing query as a templateYou can select a pre-defined query and modify its parameters to create a new query.
To create a query from an existing query• Select the customer from the 'Customers' drop-down at the top of the left hand panel.• Select the query from the list of queries in the left panel.
The query will be expanded under a new tab in the right side panel.
• Add or remove the query filter statements and/or edit the parameters in the existing filter statements. The process is same as creating a new condition as explained above.
• Select the folder in which the new query is to be saved.• Click 'Save as' from the 'Query Builder' pane.
The Query Name dialog will appear.
• Enter a new name for the query and click 'Save'.The 'Event Query' will be saved and displayed under the selected folder.
The next step is to run the event query but before that the 'Results' table must be checked and configured so that it is relevant to the event query. Refer to 'Configure Results Table for a Query' for more details.
Configure Results Table for a QueryIn order to display the event fields relevant to a specific query, the 'Results' table must first be configured.
• Select an event query from the left side and click the button from the 'Query Builder' pane.The 'Result Fields Selection' dialog will be displayed.
The same 'Field Groups' and 'Fields' used for in the 'Query Builder' will be available for inclusion in the results table. By default
a set of 'Result Fields' relevant to the query will be displayed.
• To add new 'Result Fields', click the 'Field Groups' combo box and select the field group.
The next field will display the items available for the selected field group.
• Select the required field from the drop-down and click the button.A new field will be added and you have to provide a new label for the result field.
• Enter a name for the field, by which the field should be displayed in the 'Results' screen.• Repeat the process to add more fields and click 'OK'
• To remove irrelevant fields, click the trash can icon beside it.
• Click the 'Ok' button• Click the 'Save' button in the 'Query Builder' screen to save your changes.
'Event Queries' can also be used to populate charts in a custom dashboard. Refer to the section 'Configuring Custom Dashboard' for more details.
Configure Duration Based AlertsNxSIEM dynamically monitors customer networks for events based on used-defined queries. Administrators can configure queries to generate alerts if the number of events exceeds or falls below a certain threshold in a certain time-period.
Examples - administrators can request alerts if the number of events matching a query exceeds 1000 in 10 minutes, or if no events are detected for a query for 15 minutes.
Alerts can be configured to send notification emails to the administrator and/or set to generate an 'Incident' which is assigned to a user. For more details on Incidents, refer to the section Managing Incidents.
To schedule a query to generate alerts
• Select a saved event query from the left side and click the 'Schedule' button from the 'Query Builder' pane.
The 'Schedule Info' dialog will be displayed for the selected query.
• Description - Enter a short description for the schedule• Duration - Enter the time period specified for monitoring the number of events matching the query, in
minutes.• Severity - Select the severity level for the alert to be generated by the schedule• Activation - Specify whether the schedule is to be activated or not from the drop-down. You can switch the
activation state of a schedule at any time from the 'Schedule Info' dialog.• Count - Set the threshold for the number of events.
• > - Will generate an alert if the number of events detected in the specified 'duration' exceeds the value in the text field.
• < - Will generate an alert if the number of events detected in the specified 'duration' is lower than the value in the text field
• To generate an alert if no events are detected within the specified duration, choose less than and enter 'zero' ('<' and '0')
• Action - Choose how NxSIEM should react if the alert's conditions are triggered.• Send e-mail - NxSIEM sends a notification email to the administrator if the conditions are met• Create Incident - An incident is created and assigned to a user to investigate. Refer to the section
Managing Incidents for more details.• Click 'Save' in the Schedule Info dialog to save the schedule.
The event query added with a schedule.
• To edit a schedule of a query or switch the schedule between 'active' and 'inactive' states, select the query from the list at the left, click the 'Schedule' button, change the values in the 'Schedule Info' dialog and click 'Save'.
Run an Event QuerySaved event queries can be run at anytime to obtain a list of matching events within a chosen period of time. The results can be viewed in two ways:
• As a results table with columns selected as explained above. You can view the full details of any event in its 'Details Pane' containing values for all the fields in the log entry. The Details pane also allows you to add values of selected fields to Live Lists for use in new event queries and correlation rules. You can also run look-ups of IP addresses and domains involved in the event. More explanations are available under 'View Results Table'.
• As aggregations of results, with identified events grouped based on selected event field(s) and the resultant event groups ranked based on specified aggregation function. More explanations are available under View Aggregated Results.
To run an event query• Select an event query from the left.• Select the period for which you want to run the query.
• To view recent events, select the period from the drop-down at the bottom right of the 'Query Builder' pane and click the 'Search' button. Options range from the last hour to the last 7 days.
• To view events that occurred within specific dates, click the calendar button, enter the 'Start' and 'End' dates in the 'Advanced Search' dialog and click 'Search'.
(explained above). Clicking on an event allows you to view its details. More details on the 'Results Table' are available under 'View Results Table'.
• Aggregations - The Aggregations tab allows you to group identified events and view aggregation results. More details on aggregations are available under 'View Aggregated Results'.
View Results TableAfter running a query, the 'Results' tab is opened by default in the lower pane. You can click the 'Results' tab to view the results table if you are currently viewing the aggregation results.
The 'Results' tab contains a table of event log records that match the event query. The event fields form the table columns. Events can be created in the Query Builder pane. Refer to the explanation of 'Configure results table for a query' for more details.
Each page in the 'Results' table displays 20 entries. You can navigate to successive pages using the left and right arrows at the bottom-right. To open a specific page, click the page number at bottom-right then enter the page number in the text box:
You can view complete details of an event log entry from the 'Results' table and use the values to add further filters statements to the query in order to refine the search. You can also perform IP and Domain lookups and feed these values to live lists for use in other queries and correlation rules.
• To view the details of an event, click on the result row.
External IP addresses and domain names are highlighted in yellow.
• Clicking on a field adds the field with its value as a filter statement to the query, enabling you to refine your search for events that contain the same value in the respective field and/or to create a new query. Refer to the explanation under Update and Refine Queries from results for more details.
• If you click the gear icon that appears when you hover your mouse over a field you will see a context sensitive menu:
From the context sensitive menu, you can:
• Perform IP lookup of external IP addresses using IPVOID• Perform IP Address/Domain lookup using Virus Total • Add the value to a Live List
Performing IP Lookup of External IP Addresses using IPVOIDYou can view the scan report containing IP address information and IP Blacklist Report for any external IP address detected in an event. The 'Details' pane of an event query result displays the detected external IP address field in yellow, which acts as a shortcut to perform the IP Look up through IPVOID website.
To perform IP Look up of External IP address• Click on the event involving connection to an external network or host from the results table to open its 'Details' pane.
The fields containing external IP address(es) are highlighted in yellow as shown in the example below.
Performing IP Address/Domain Lookup using Virus Total
You can view the IP address information/Domain information for external IP addresses/domains detected in an event from the 'Virus Total' website. The 'Details' pane of an event query result displays the fields containing external IP address/domain names
field in yellow, which acts as a shortcut to perform the look up.
To perform IP/Domain Look up using Virus Total• Click on the event involving connection to an external network or host from the results table to open its 'Details' pane.
The fields containing external IP address/Domain name are highlighted in yellow as shown in the example below.
• Hover the mouse cursor over the field and click on the gear icon that appears at the right.• Click on the 'Virus Total' option.
You will be taken to the Virus Total web page which contains information about the IP address/domain.
An example is shown below.
Adding Field values to Live Lists from ResultsYou can add values for certain fields detected in an event to Live Lists defined in NxSIEM, for use in other queries and
Background Note on Live Lists: Live Lists enable administrators to add lists of values for fields used in queries and correlation rules. Lists can be updated manually or configured to fetch values by a correlation rule. List updates will be immediately reflected in the queries and the rules in which it is used, relieving the administrator of the burden of updating them manually. For more details on Live List management, refer to Live Lists.
To add a field value from an event to a live list:
• Click an event on the results table to open its 'Details' pane. • Hover the mouse cursor over the field containing the value to be added to a list and and click on the gear icon that
appears at the right:
• Click on the 'Add to List' option.The 'List Content Add' dialog will appear. The 'Value' field in the dialog is pre-populated with the chosen value.
• Select the Live List and the list type to which the value is to be added, from the respective drop-downs under 'List Management'.
• Enter the date till which the value is valid in the Due Date field. You can click the calendar icon at the left of the field and choose the date. On the specified date, the value will be automatically removed from the list. If you want the value to be permanently valid, select the 'Permanent' checkbox.
• Select the customer to which the value is applicable from the 'Customer' drop-down.• Click 'Submit'.
The value will be added to the respective List Type and all the queries and correlation rules in which the list is deployed, will be updated immediately.
View Aggregated ResultsThe 'Aggregations' tab allows you to aggregate responses from an event query and to view aggregated results. Events can be grouped based on values of selected fields to form event groups. Event groups can then be ranked based on the aggregation function selected and results can be viewed in ascending or descending order according to rank.
To view the aggregation of events• Click the 'Aggregations' tab in the lower right pane of the 'Event Query' interface
Aggregating events involves four steps:
• Step 1 - Select the event field(s) on which events are to be grouped• Step 2 - Select the aggregation function• Step 3 - Select the order of ranking based on how you want to see the aggregation results• Step 4 - Set the limit for number of results to be displayed
Step 1 - Select the event field(s) on which events are to be groupedThe first step is to choose the event fields by which the events should be grouped. Event groups will be formed so that each event group will have events with same value for the selected field. If you select more than one field, the combinations of values in the selected fields will be taken into account for grouping.
To select the event field(s) for grouping
• Choose the 'Field Group' from the first drop-down under 'Event Fields'The next drop-down will be populate with the fields belonging the chosen group
• Choose the 'Field' from the second drop-down and click the button.The field will be added to the list below 'Event Fields'
• Repeat the process to add more fields for grouping.Step 2 - Select the aggregation functionThe event groups formed based on the fields chosen in the first step are ranked based on the function chosen from the 'Aggregation Function' drop-down. The available options are:
• Count - The event groups are ranked based on the number of events in each group. For example, if you choose Source IP as 'Field' then the group which contains the most events on a particular source IP will have the top rank and the group containing the lowest number of events is ranked lowest. You can further control how the data is displayed by modifying the 'Order By' and 'Limit' parameters.
• Sum - The event groups are ranked based on sum of values in another field that contains numerical value. If you choose 'Sum', you need to select another field that contains a numerical value, like bytes in/out. The event groups are ranked based on the sum of the values in the chosen numerical field from all the events in that group. For example, if we choose 'Bytes-in' as numerical value, then the system adds up the values in the 'Bytes-in' field of all the events in a group and ranks the group accordingly. This will tell you which source IP has the most incoming traffic. The event group with the highest SUM in the 'Bytes-in' field is ranked top and vice-versa.
• Average - Similar to above. Event groups are ranked based on the average of the values of the chosen numerical field from all the events in that group. (e.g. the average of values of 'Bytes_in' field of events in the group, if we take the same example as above)
• Minimum - Similar to above. The event groups are ranked based on the minimum of the values of chosen numerical field from all the events in that group.
• Maximum - Similar to above. The event groups are ranked based on the maximum of the values of chosen numerical field from all the events in that group.
To set the aggregation function• Choose the function from the 'Aggregation Function' drop-down.• If you choose 'Sum', 'Average', 'Maximum' or 'Minimum', then you should choose an item which is it useful to measure.
For example, 'Bytes-in' can be measured and is suitable for the Sum, Average, Max and Min functions. On the other hand, there would be little value in applying these functions to destination port numbers.
Step 3 - Select the order of ranking based on how you want to see the aggregation resultsYou can choose how event groups should be ranked from the 'Order By' drop-down. The available options are:
• Ascending - The group with the lowest rank will be top of the list. A limit of 5 will show the 5 groups with the lowest ranks.
• Descending - The group with the highest rank will be top of the list.. A limit of 5 will show the 5 groups with the highest ranks.
Step 4 - Set the limit for number of results to be displayedThe last step is to set a limit for the number of event groups to be displayed as aggregation results in ascending or descending order as chosen in the previous step.
• To set the limit, choose/enter the number of results to be displayed, in the 'Limit' drop-down combo box.• Click 'Submit'.
The results will be displayed in the Aggregation Results pane at the right.
Updating an Event QueryEvent queries can be updated and refined at any time from the Event Query Interface. For example, you may wish to add new filters or to remove filters that offer little value.
To update a query• Select the customer from the 'Customers' drop-down at the top of the left hand side panel.• Choose the query to be updated, from the 'Queries' list at the left.
The Query with its filter statements will be displayed in a new tab at the right panel
• To delete a filter , click the button beside it.• To add a new filter, follow the process explained in the section Creating a New Event Query.
A new filter will be added with the parameter contained in the field chosen from the 'Details' pane
• To save the query with the new filter, click 'Save'.• To create a new query with the existing and newly added filters, leaving the existing query unchanged, select the
category folder from the left click 'Save as' and save the new query with a new name.
6.2 Configuring Custom DashboardsThe 'Custom Dashboards' interface allows administrators to view updated results from event queries as pie charts, bar charts time charts and spider charts. By viewing important data from often complex queries in an easily digested chart format, administrators can more effectively track, monitor and analyze the activities of their customers. Refer to the section 'Configuring Event Queries' to know more about event queries.
To open the 'Custom Dashboards' interface, click the 'Menu' button from the top right, choose 'Investigation' and then click 'Custom Dashboards'.
The left hand side panel of the interface displays a list of predefined queries and custom queries added for the selected customer under respective folders. The right hand side panel displays the custom dashboards generated for the queries selected from the LHS pane under respective tabs.
By default, The first tab displays a New Dashboard tab that allows you to create a new dashboard for the selected customer.
Each dashboard tab can displays four charts for the selected query.
Custom Dashboards Interface - Table of controls
The 'Customers' drop-down allows you to select the customer for which you want to query events and/or add custom queries.
Allows you to add a new 'Dashboards' folder to the left side panel
Allows to edit the name of a 'Dashboards' folder
Allows you to a add a new dashboard by selecting an event query added for the selected customer.
Allows to delete selected dashboards folders or dashboards.
The interface allows administrators to:
• Manage Dashboard folder• Configure a custom dashboard • Create an event query for specific events from the Dashboard• Edit a dashboard tile• Delete a dashboard tile
Managing Dashboard FoldersYou can create and manage dashboard folders to accommodate the custom dashboards of specific type and to display them as tree structure.
To create a new Dashboard Folder• Select the parent folder under which you wish to create a new folder
• Click the button at the bottom of the screen.
• Enter a name for the folder and click the 'Add' button
Configuring Custom Dashboards You can add any number of custom dashboards for a customer for different event queries. If required, you can create new queries specifically for custom dashboards and save them, from the Event Query interface. For a tutorial on creating new queries, refer to the explanation of Manage an Event Query in the section Configuring Event Queries.
Each dashboard can display up to four charts. Each chart is constructed from the following parameters.
• Name - A name to identify the chart.• Selected Event Query - The query whose results are to be displayed in the chart. The query can be selected from the
list of queries, added fro the selected customer. The events that are detected based on the query for the last one hour will be displayed in the charts.
• Group By - The field, based on whose values, the events identified by the query are to be grouped and shown in the chart. Event groups will be formed so that each event group will have events with same value for the selected field.
• Aggregation Function - The event groups formed based on the fields chosen in the 'Group by' option, are ranked based chosen 'Aggregation Function'. The event groups are indicated in the charts in ascending or descending order as chosen in the 'Order by' setting. The available options are:
• Count - The event groups are ranked based on the number of events in each group. For example, if you choose Source IP as 'Field' then the group which contains the most events on a particular source IP will have the top rank and the group containing the lowest number of events is ranked lowest. You can further control how the data is displayed by modifying the 'Order By' and 'Limit' parameters.
• Sum - The event groups are ranked based on sum of values in another field that contains numerical value. If you choose 'Sum', you need to select another field that contains a numerical value, like 'bytes in'/'bytes out'. The event groups are ranked based on the sum of the values in the chosen numerical field from all the events in that group. For example, if we choose 'Bytes-in' as numerical value, then the system adds up the values in the 'Bytes-in' field of all the events in a group and ranks the group accordingly. The event group having the sum of values in the 'Bytes-in' field as maximum is ranked top and vise-versa.
• Average - Similar to above. Event groups are ranked based on the average of the values of the chosen numerical field from all the events in that group. (e.g. the average of values of 'Bytes_in' field of events in the group, if we take the same example as above)
• Maximum - Similar to above. The event groups are ranked based on the maximum of the values of chosen numerical field from all the events in that group.
• Minimum - Similar to above. The event groups are ranked based on the minimum of the values of chosen numerical field from all the events in that group.
• Order By - You can choose the order in which the event groups are to be indicated in the chart, based on their ranking. The available options are:
• Ascending - The group with the lowest rank will be top of the list. A limit of 5 will show the 5 groups with the lowest ranks.
• Descending - The group with the highest rank will be top of the list.. A limit of 5 will show the 5 groups with the highest ranks.
• Limit - The number of event groups to be displayed in the chart For example, If you want to view the identify the source IPs of top 5 endpoints that are involved in large file transfers and hence consume large bandwidth resource, you can:
• Create and save a query for identifying file transfer events• Construct a chart by selecting the query• Group the events by Source IPs• Aggregate the event groups by the sum of 'Bytes-out'• Set the chart to display top 5 groups in descending order
The screenshot below shows the resulting dashboard chart constructed with the parameters as described above:
To create a new dashboard• Select the customer from the 'Customers' drop-down at the top of the left hand side panel.• Select the appropriate folder or create a new dashboard folder under which you want to create a new dashboard.
Alternatively, you can also select a folder while saving a dashboard.
• Click the button.
A 'New Dashboard' tab will be displayed.
Tip: You can also use the 'New Dashboard' tab that is displayed as the first tab on selecting a customer, to create a new dashboard. You can save the created dashboard by selecting an appropriate folder from the left side panel.
• Click on a graph type from the optionsThe 'Add' screen will be displayed for configuring the results to be shown in the chart.
The left hand side pane allows you to enter a name for the chart and displays the list of event queries that were pre-configured for the customer's network. You can select the event query for which the chart is to be displayed, from the list. The right hand side pane displays options for configuring the chart and a preview pane.
Add Chart - Form Parameters
Parameter Description
Name Enter an appropriate name for the dashboard tile
Queries Displays the list of predefined and custom event queries added for the selected customer. Select the event query for which the results are to be displayed in the chart.
Group By The drop-down displays the fields, configured as event query results table column headers for the selected event query. Refer to 'Configure results table for a query' for more details.Choose the Field based on whose values, the events identified by the query are to be grouped and shown in the chart.
Aggregation Function Allows you to choose the aggregation operation to be applied for ranking the event groups and show them in ascending or descending order, in the chart. The options available are:
• Count - The event groups are ranked based on the number of events in each group. For example, if you choose Source IP as 'Field' then the group which contains the most events on a particular source IP will have the top rank and the group containing the lowest number of events is ranked lowest. You can further control how the data is displayed by modifying the 'Order By' and 'Limit' parameters.
• Sum - The event groups are ranked based on sum of values in another field that contains numerical value. If you choose 'Sum', you need to select another field that contains a numerical value, like bytes in/out. The event groups are ranked based on the sum of the values in the chosen numerical field from all the events in that group. For example, if we
choose 'Bytes-in' as numerical value, then the system adds up the values in the 'Bytes-in' field of all the events in a group and ranks the group accordingly. This will tell you which source IP has the most incoming traffic. The event group with the highest SUM in the 'Bytes-in' field is ranked top and vice-versa.
• Average - Similar to above. Event groups are ranked based on the average of the values of the chosen numerical field from all the events in that group. (e.g. the average of values of 'Bytes_in' field of events in the group, if we take the same example as above).
• Maximum - Similar to above. The event groups are ranked based on the maximum of the values of chosen numerical field from all the events in that group.
• Minimum - Similar to above. The event groups are ranked based on the minimum of the values of chosen numerical field from all the events in that group.
Order By Allows you to choose the order in which the event groups are to be indicated in the chart, based on their ranking. The available options are:
• Ascending - The group with the lowest rank will be top of the list. A limit of 5 will show the 5 groups with the lowest ranks.
• Descending - The group with the highest rank will be top of the list. A limit of 5 will show the 5 groups with the highest ranks.
Limit Enter the number of events to be displayed for the chart
Preview This button allows to preview the chart before adding it to the tile
Add Click this button to add the chart to the dashboard tile
• Enter the parameters for the chart as shown in the table above and click the 'Preview' button to check the chart before adding it to the dashboard tile
Placing the mouse cursor over a section will display the details of that particular event query.
• Click the 'Save' button.The 'Save' dialog will appear.
• Enter the name for the dashboard in the 'Name' field• Select the period at which the event query results chart should be updated from the 'Refresh Interval' drop-down. The
options range from 30 seconds to 5 minutes.• Click the 'Save' button
The dashboard will be saved and its name will be displayed on the tab and under the folder it was saved.
You can add as many custom dashboards for various event queries configured for a customer by repeating the same process.
Creating an Event Query for Specific Events from the Dashboard ChartYou can create new event queries for the customer to view the filtered results from the dashboard tiles.
To create a new query
• Click on the portion of the chart that indicates the events for which a new query is to be built
The query builder will open for the customer, with all the query parameters pre-configured for the specific event type indicated in the chart.
• If you want to change the parameters, directly edit on the 'Query Builder' interface.• To view the results of the query, click 'Search'. The results will be displayed as a table in the lower right pane.• Choose the folder in which the query is to be saved, from the list of folders in the left hand side pane and click 'Save'
The Query will be saved. You can search for the events at anytime using the query.
Editing a Dashboard TileThe custom dashboard tiles can be edited at anytime to change the query for which the results are displayed, the grouping and aggregation operation of the results and so on.
To edit a dashboard tile• Place the mouse cursor over a tile to view the 'Edit', 'Delete' and 'Tool Tip' icons.
• Click the trash can icon. The confirmation dialog will appear.
• Click 'Yes' to confirm the deletion.
7 Managing Rules NxSIEM identifies events that may cause harm to customer networks (for example, a firewall breach) based on monitoring rules and alerts them as 'Incidents'. The logs collected from the customer networks are checked by the rules engine. If any data matches a configured rule then NxSIEM will immediately generate an alert and create an 'Incident'. Incidents created by rules are classified as 'Correlated Incidents' and automatically assigned to administrative users for their perusal and remedial action. Refer to the section 'Incidents and Cases' and 'Administration' for more information.
Rules are created by defining query groups and aggregation parameters based on which the identified events are to be aggregated in the results. Each query group can be created by selecting saved 'Event Queries' and/or by adding new queries.
The output from a correlation rule is also created as an event and can be queried from the 'Event Query' interface. Each rule can be configured with 'Output Mappings' that define the fields to be displayed in the result events in the 'Events Query' interface. You can even configure a rule to just to create output events on identifying the events that match the rule and not to create alerts.
Also, selected field values of the outputs of a correlation rule can be used to update entries in Live Lists. Live Lists are configured to contain lists of field values that can be used as query parameters in a query or a rule. If a list is updated, the updated values are automatically reflected in the queries or rule in which the list is used. For more details on managing Live Lists, refer to the section Live Lists.
Comodo NxSIEM adds a set of predefined correlation rules under respective category folder for each newly created customer.
The 'Rules Activation and Creation interface' allows the administrator to create and manage the correlation rules for each
To open the 'Rules Activation and Creation' interface interface, click the 'Menu' button from the top right, choose 'Rules' and then click 'Rules Activation and Creation'.
The left hand side panel displays a list of predefined correlation rules and the custom rules added for the selected customer. The right hand side panel displays the details of the rule chosen from the list and allows the administrator to configure the rule. The rules are added to their respective folders based on their category.
Rule Correlation and Activation - Table of controls
The 'Customers' drop-down allows you to select the customer for which you want to manage correlation rules.
Allows you to add a new category folder for adding the rules.
Allows to edit the name and description of a 'Rules' folder
Allows you to a add new correlation rule under the chosen folder.
Allows to delete rules folders or rules
The interface allows administrators to:
• Manage rules folders• Manage correlation rules
Manage a Correlation Rules FolderThe correlation rules folder contains a collection of rules of specific category. Every new rule must be placed in a rules folder.
Creating a correlation rules folder• Choose the customer from the 'Customers' drop-down at the top of the left panel.
The predefined and custom rules added for the customer is displayed as a folder tree structure in the 'Correlation Rules' pane.
• Choose the parent folder to create a new sub-folder and click the button. The Folder Name dialog will appear.
• Enter a name for the rules folder in the 'Folder Name' field• Enter a description for the category of rules to be added to the new folder• Click the 'Add' button
The folder will be saved and displayed on the left side.
The relevant correlation rules can now be placed under the newly created folder. Refer to the 'Manage a Correlation Rule' section for more details.
• Click 'Yes' in the In the confirmation dialog. Please note all the rules in the folder will also be deleted.
Configuring a Correlation RuleThe administrator can create correlation rules similar to a query, in order to identify events that might be harmful to the endpoint or the network and to generate an 'Incident'. The identified incidents are automatically addressed to the users allotted for the respective customer for remedial action. A rule is created by adding rule definitions with groups of filter statements and aggregation parameters for aggregating the events that are detected by the rule.
The detection of events based on a rule is also created as an event, that could be queried from the 'Event Query' interface. You can configure the values to be fetched for the fields for the output events generated by the rule every time. This enables the administrator to generate further refined new queries and rules based on output events of a rule. Refer to the explanation of Output Mappings for more details.
To create a correlation rule• Select the customer from the 'Customers' drop-down on the left side.• Select the appropriate rule category folder or create a new correlation rule folder under which you want to create a
correlation rule.
• Click the button
The configuration screen for creating the new rule will be displayed in the right hand side panel. It has four sections:
• General - Allows you to specify the name and description for the rule, select the severity level, window duration for rule, to set rule active or inactive and set whether or not to create an Incident when this rule is met.
• Definitions - Allows to define the queries for the rule and select aggregation parameters for grouping identified events and more.
• Output Mappings - Allows you to select the field values to be included in the output events generated based on the rule. The output events can be queried from the 'Event Query' interface (Optional).
• List Mappings - Allows you to map live lists to which the selected field values of the events detected by the rule is to be updated (Optional).
General• Click the 'General' Stripe to open the General Configuration area.
• Name - Enter a name for the rule• Severity - Choose the severity level that will be assigned to the incident that matches the rule. The options available
are:• Info• Low• Medium• High• Critical
• Window Duration (minutes) - Enter the minimum duration (in minutes) for the event to be identified as an incident based on the rule.
• Activation - Choose whether you want the rule to be active or inactive from the drop-down• Create Alarm - Configure whether or not an 'Incident' is to be created and an alert is to be sent to the administrator,
when the rule is met. If selected, the rule creates an incident and an output event which can be queried from the 'Event Queries' interface. Else the rule creates only the output event and does not an Incident.
• Description - Enter an appropriate description for the rule. The Description entered in this field will appear as the 'Summary' in the incident generated by the rule.
DefinitionsEach rule is constructed with a set of filter condition statement groups to identify the events and generate alarms. The Definitions stripe allows to define filter statement groups and aggregation parameters for the rule. You can add filter statement groups by selecting saved queries and/or by manually defining them.
• Click the 'Definitions' stripe to open the 'Definitions' area.
• To add a filter statement group as a rule definition, enter a name for the rule definition.The next step is to add the filter condition statement groups to the definition. This can be done in two ways:
• Select an Event Query and import the filter statement from it• Manually define filter statements for the group
Selecting an Event Query and import filter statements:
• Click the button after entering a name for the rule definition.
You can edit the group by adding new statement(s), changing fields/values and/or removing existing statements. For more details on construction of the filter statements, refer to the explanation of 'Manually defining filter statements for the group' given below.
• Repeat the process to add more definitions from event queries.
Manually defining filter statements for the group
• Click the button after entering a name for the rule definition.A tab to add the query fields for the definition will open.
Each rule definition is built with a set of filter statements that are connected with Boolean operators like 'AND', 'OR' or 'NOT'. Each filter statement contains the following components.
'Field Group' + 'Field' + 'Operator + 'Value'
• Field Group - The group to which the field specified as the filter parameter belongs.• Field - The field in the event log entry by which you want to filter results• Operator - Controls the relationship between the field and the specified value. Examples include 'Equals to', 'Does not
equal to', contains, 'does not contain' etc.• Value - The value for the field. Values can be entered manually or fetched from a pre-defined list which is managed in
the 'Live List Management' interface. For example, if you choose a source IP (src_ip) as the field to be searched from network events, you can manually enter the IP address of the source of the connection request or choose a Live List containing a list of specified source IP addresses. Refer to the section Live Lists for more details on pre-defined lists.
Examples:
i. To filter network connection events originated from an endpoint with IP address 10.100.100.100, build the filter statement as shown below:
'Source' + 'src_ip' + '=' + '10.100.100.100'ii. To filter network connection events originated from a set of endpoint whose IP addresses start with 10.100.100.xxx,
build the filter statement as shown below:'Source' + 'src_ip' + 'AB*' + '10.100.100
iii. To filter network connection events originated from a set of endpoint whose IP addresses are defined in the 'Live List type' named 'Internal' under the 'Live List' named 'IP Blacklist' build the filter statement as shown below:
'Source' + 'src_ip' + '[a]' + 'IP Blacklist' + 'Internal'You can create more complex queries by adding more filter statements and linking them using 'AND', 'OR', or 'NOT'. For example:
• To filter network connection events originated from an endpoint with IP address 10.100.100.100, and destined to another endpoint with IP address 10.100.100.120, build the filter statements with an AND combination as shown below:
'Source' + 'src_ip' + '=' + '10.100.100.100'
AND
'Destination' + 'dst_ip' + '=' + '10.100.100.120'
To manually add a filter statement group• Choose the combination condition for the query(ies) to be defined from the drop-down at the top left. The options
available are:• AND• OR• NOT
• Click the button beside the drop-down to add a query filter. The 'Field Groups' drop-down and 'Fields' drop-down will appear. The 'Fields' drop-down will contain options relevant to the 'Field Group' chosen from the drop-down at the left.
• Choose the field group you wish to add to the filter from the 'Field Groups' drop-down.The next field will display the fields available for the selected field group.
Tip: The descriptions of the Field Groups and the Field items under each of them, are available in Appendix 1 - Field Groups and Event Items Description.
The next step is to choose the relation between the field chosen and the value to be entered in the next field.
• To choose the relation, click on the relation symbol at the right of the 'Field' drop-down.
The types operators depends on the field chosen. The following table explains the various operator symbols:
Relation Operator Description Entering the value for the 'Field'
Equals to Manually enter a value in the field to the right of the operator. Events containing the same value will be identified by the filter.
Does not equal to Manually enter a value in the field to the right of the operator. Events that do not contain the value will be identified by the filter.
Greater than Applicable only for fields with numerical values, for example, port numbers.Manually enter a value in the field to the right of the operator. The filter will identify events that contain values greater than the entered value.
Greater than or equal to Applicable only for fields with numerical values, for example, port numbers.Manually enter a value in the field to the right of the operator. The filter will identify events that contain values equal to or greater than the entered value.
Less than Applicable only for fields with numerical values, for example, port numbers.Manually enter a value in the field to the right of the operator. The filter will identify events that contain values less than the entered value.
Less than or equal to Applicable only for fields with numerical values, for example, port numbers.Manually enter a value in the field to the right of the operator. The filter will identify events that contain values equal to or lower than the entered value.
Contains Manually enter a value in the field to the right of the operator. The filter will identify events that contain the entered value somewhere in the string.For example, to search for events with source IP addresses containing 123 anywhere in the address, enter '123'.
Does not contain Manually enter a value in the field to the right of the operator. The filter will identify events that do not contain the entered value anywhere in the string.For example, to search for events with source IP addresses that do not contain 123 anywhere in the address, enter '123'.
Starts with Manually enter a value in the field to the right of the operator. The filter will identify events that begin with the entered value.For example, to search for events with source IP addresses starting with 192, enter '192'.
Ends with Manually enter a value in the field to the right of the operator. The filter will identify events that end with the entered value.For example, to search for events with source IP addresses that end with 123, enter '123'.
Is Empty Searches for events in which the selected field is empty (does not contain any value).For example, to search for the events with no values in their source IP address fields, select 'Is Empty'.
Is Not Empty Searches for events in which the selected field is not empty (contains a value of some kind).For example, to search for the events with some IP addresses values in their source IP address fields, select 'Is Not Empty'.
Is in List Allows you to configure the filter statement to fetch values for the field from a pre-defined live list containing specific values for the field type.Background:Live Lists enable administrators to add and manage lists of values for different fields for use in queries and correlation rules. Lists can be created and the values can be updated manually or configured to be fetched from outputs of correlation rules. The updates in a list will be immediately reflected in the queries and the rules in which it is used, relieving the administrator from the burden of updating queries and rules for change in values to be queried. For more details on Live Lists management, refer to the section Live Lists.
On selecting as the relation parameter, drop-down options will appear for the List and the List type:
The first drop-down shows the Live Lists that contain values for the selected query field. The second drop-down shows the List Types within the selected 'Live List'.
• Choose the Live List to be used in the query filter from the first drop-down.
• Choose the sub list that contains the set of values to be included in the query filter from the second drop-down.
All the values contained in the list will be included as values for the Field specified in the filter statement.
Not in List Allows you to configure the filter statement to search for the events that do not contain specific values from a pre-defined live list .
On selecting as the relation parameter, drop-down options will appear for the List and the List type:
The first drop-down shows the Live Lists that contain values for the selected query field. The second drop-down shows the List Types within the selected 'Live List'.
• Choose the Live List to be used in the query filter from the first drop-down.
• Choose the sub list that contains the set of values to be input as exclusions to the query filter from the second drop-down.
The results will display all events that do not contain the values in the live lists.
If you are adding values for source parameters like source IP address, source port, source MAC etc., but wish to reverse the
parameter, click the switch icon that appears to the right of the statement. The field group and the field selected will automatically switch from source to destination or vice-versa.
For example, if you are specifying a live list containing values of source IPs for the source IP field, but want to change them to destination IPs, you can click the switch button.
• To add more number of query filters under the same combination chosen in the first step, click the button beside the same combination and repeat the process.
• To add a sub-filter statement, click the button beside the filter and repeat the process. • To set the relationship between each statement, use the drop-down menu.• For example, the statements below will return events whose source ends with 10.100 OR .com AND whose
• To delete a filter , click the button beside it.You can add multiple query definitions for a single rule and these are tied together.
• To add a new definition, enter the name of the new definition and add the filter statements as explained above.• If you want the rules engine to process the definitions of the rule in order, select the 'Ordered' checkbox.
For example, under the first tab you can create a rule that checks for a brute force attack on a destination IP and in the second tab you can create a rule for intrusion detection. The rules engine checks for brute force attack and intrusion events and if any destination IP of the second tab matches the destination IP of the first tab, then an incident is created. Please note the number of selected aggregates should be equal for all the tabs in order to correctly define the fields in the 'Output Mappings' section. For example, if you select 4 aggregate fields in the first tab, then all other tabs for the rule should also have 4 aggregate fields.
The next step is to select the field values based on which the events that meet the rule are to be aggregated to create the incident.. For example if you want the rule to search the source details from where the event occurred, then you have to select the appropriate event value from the 'Aggregations' box and move it to the 'Selected' box.
• Select the required values from the 'Aggregation' box and move them to the 'Selected' box by clicking the button.
• To remove a value added to the 'Selected' box by mistake, select it and click the button.
• To reorder in the values in the 'Selected' box, select them one by one and click the or buttons.
The next step is to define the 'Aggregation Function' and 'Aggregation Threshold' for the defined query. The 'Function' drop-down has three options:
• COUNT - Select this if the incident is to be generated if the number of events that met the queries in the definition reach a certain number and enter the number in the Threshold field that appears on selecting this option.
• DISTINCT_COUNT - Choose this for the definition that checks for a range of events, for example, different source IPs to a single IP, choose the event items in the 'Distinct Field' combo boxes and enter the value in the 'Threshold' field.
• SUM - Choose this for the definition that checks for a numeric value, for example, number of bytes transferred or the rule hit count, select the event item in the 'Sum (Count)' field and enter the value in the 'Threshold' field.
You can create any type of rules as required for your customers. For better insight into rules creation, please check out the built-in predefined rules on the left side of the 'Rule Creation & Activation' screen.
Output MappingsIn addition to generating an 'Incident', NxSIEM generates a new event as output event every time when events are detected as per a correlation rule. The output event can be queried from the 'Event Query' interface and its details can be used to generate further event queries for the customer.
The 'Output Mappings' area allows you to define the values to be fetched for selected fields of the output event from the respective input events detected by the rule. You can choose only values that are common to all the input events that generated an 'Incident' as per the rule.
To configure output mappings for the rule• Click the 'Output Mappings' Stripe to open the 'Output Mappings' area.
• Choose the Field to be configured for the output event by selecting the Field Group from the first drop-down and the field from the second drop-down.
• In the 'Value' field, enter the variable that will fetch the value of the selected aggregate field in the 'Definitions' tab. The variable should be in the format ~r:1, ~r:2 and so on. The variable '~r:1' will fetch the value of the first selected aggregate parameter, the variable '~r:2' will fetch the value of the second selected aggregate parameter and so on. If you enter some text, the field value will be static for that field for the new event generated on correlation.
• Click the button to add the field value.
If you enter some text, the field value will be static for that field for the new event generated on correlation. For example, to enter a message for the 'Message' field, choose 'Event' > 'Message' from the drop-downs and enter the message in the third field .
• Add more fields to fetch the values for, by repeating the same procedure.
List MappingsEach Live List managed from the 'Lists' > 'Lists Management' interface, is configured to contain a list of defined values of a specific field value. The live lists can be used to provide values for respective fields in event queries or in correlation rules relieving the administrator to enter several values for a single field one by one. Also, when a list is updated with addition of new values or removal of existing values, the query/rule in which it is used is automatically updated, hence the administrator need not modify the query/rule every time for changes in values. The values in a list can be populated in two ways:
• Manual - The administrator can manually enter the values for the field in the respective list, from the 'Live List Content Management' interface, accessible by clicking 'Lists' > 'Live List Content Management' from the navigation menu.
• Automatic - From the events detected by a correlation rule. The administrator can map a rule to Live Lists and configure the fields of the events from which the values are to be updated to the respective list.
For more details on managing Live Lists, refer to the chapter Live Lists.
The 'List Mappings' area allows you to choose the Live Lists to which the selected field values of the events detected by the rule are to be automatically updated. As a prerequisite, you should have chosen the field values to be collected, as the aggregation parameters for the query defined in the rule.
For example, if you want to collect the source IP addresses from the events identified by a rule that detects access to malware domains, in a live list that contain list of IP addresses of infected endpoints, you can map the respective live list to the rule and configure for the values of source IP address fields of the events to be fed to the list. The 'Source IP' field field should have been set as a aggregation parameter in the query defined for the rule.
To map live lists to a rule• Click the 'List Mappings' Stripe to open the 'List Mappings' area.
• Choose the list to be updated by selecting the 'List' from the first drop-down and the 'List Type' from the second drop-down.
More details on Lists and List Types are available in the chapter Live Lists.
• In the 'Relation' field, enter the variable that will fetch the value of the selected aggregate field from the 'Definitions' area. The variable should be in the format ~r:1, ~r:2 and so on. The variable '~r:1' will fetch the value of the first selected aggregate parameter, the variable '~r:2' will fetch the value of the second selected aggregate parameter and so on. Care should be taken that the field values contained in the specified list should be same as the aggregate parameter chosen by entering the relation parameter. For example, If the list contains Source IPs, and if the 'source.src_ip' is chosen as first aggregate parameter for the rule, then for collecting the source IPs from the events identified by the rule, enter ~r:1.
• Choose the validity period for the value in the live list from the Time To Live (TTL) drop-down that appears next. The options available are from '5 minutes' to 'No Limit'. On lapse of the TTL period, the value fetched to the list by the rule will be automatically deleted.
• Click the button to add the list mapping.
• Repeat the process to add more number of list mappings to the rule to fetch values from different fields for different live lists.
To remove a list mapping entry added by mistake or that is no longer needed, click the icon under the 'Action' column for that mapping entry.
• Click the 'Save' button to save your rule for the customer.The rules engine checks the events from the logs and if it matches the rule, generates an alert and creates an incident created. Also a new event is generated which will have the selected field values selected in the 'Output Mappings' area. If there are more than one query definition tabs are added for a rule, please make sure the number of selected aggregates is equal for all the tabs in order to correctly define the fields in the 'Output Mappings' section. For example, in the 'Definitions' section if you select 4 aggregate fields in the first tab, then all other tabs for the rule should also have 4 aggregate fields.
• Click 'Yes' in the confirmation dialog to remove the rule.
8 Incidents and CasesNxSIEM generates alerts when it identifies events which match correlation rules that have been defined for each customer in the Rule Creation & Activation interface. These alerts are automatically assigned as 'Incidents' to the 'users' allotted to the respective customer. Each 'Incident' has a status of 'Open' until it is closed by a user once the issue related to the event has been resolved. Administrators can also manually add incidents and assign them to users if certain actions are required on customer networks.
A series of incidents on the same network which are assigned to the same user, can be grouped together as a 'Case'. The case can then be assigned to a user for collective investigation.
The number of open incidents is dynamically displayed beside the notification icon in the title bar of the administration console.
The 'Incidents' menu allows the user to manage incidents and cases. To open the 'Incidents' menu, click the menu button at top right and choose 'Incidents':
The following sections explain more about:
• Managing Incidents• Managing Cases
8.1 Managing IncidentsThe 'Incident Management' interface displays a list of incidents along with details such as customer network, the user to whom it is assigned and so on. Administrators can view incident details, reassign them to different users, add incidents to a case, close/re-open incidents and more.
To open the 'Incident Management' interface, click the 'Menu' button from the top right, choose 'Incidents' and then click 'Incident Management'.
The panel on the left allows you to filter which incidents are displayed.
• To view all incidents without filtering, select 'All' in all the filter option drop-downs and click 'Search'. • To view incidents detected from specific customer networks, assigned to specific users, of specific type, status and/or
priority, select the option(s) from the respective drop-downs and click 'Search'.
Tip: To view a list of all incidents on all customer networks in this interface, click the notification icon on the title bar:
The example below, shows all incidents from all customer networks.
The left panel displays a pie-chart showing a breakdown of incidents based on priority. Placing the mouse cursor over a sector displays the count of incidents and priority/severity level.
Date Displays the precise date and time at which the incident was detected or added.
Name For incidents added by correlation rules - The 'Name' column displays the name of the rule based on which the incident was detected.
For manually added incidents - The 'Name' column displays the name as entered during its creation.Case Displays the name of the case to which the incident is attached. A case is a collection of incidents
assigned to a user for collective investigation and countermeasure. Refer to the section Managing Cases for more details.
Customer Indicates the customer on whose network the incident was detected.
Username Indicates the user to whom the incident is assigned for investigation.
Priority For incidents added by correlation rules - The 'Priority' column displays the severity level of the incident, as configured for the rule based on which the incident was detected.
For manually added events - The 'Priority' field displays their severity level as entered during creation.Status Displays the status of the incident on whether it is attended or yet to be attended. The possible values
Type Indicates whether the incident is added manually or by a correlation rule. The possible values are:• Default - Incident is added manually• Correlated - Incident is added based on a correlation rule.
Summary For incidents added by correlation rules - The 'Summary' column displays a short description of the it as defined in the rule based on which the it was detected.
For manually added events - The 'Summary' field displays the short description of it as entered during its creation.
Sorting Options:• Clicking on any column header sorts the items in alphabetical order of entries in that column.
Following sections explain on:
• Viewing the details of incidents• Adding and assigning incidents to users• Editing and Reassigning an incident• Adding incidents to cases
Viewing the details of incidentsThe administrator can view the complete details including of an incident from the 'Incident Details' pane. The 'Incident Details' pane also allows the administrator to view the details of events detected by the same rule from other endpoints in the same customer network at different time points.
To view the details of an incident• Select an incident that you want to view the details and click the 'Details' button at the bottom
The 'Incident Details' pane for the selected incident will be displayed. It provides complete information about the incident such as the name of the rule that triggered the alert, name of the customer, type of incident and more. Use the 'Drill Down' report to view all the devices affected by the incident.
The upper portion displays the details like name of the rule that triggered the incident, name of the customer, type of incident, date and time the incident was created and so on. Placing the mouse cursor over an item shows the full details as a tool tip.
The 'Event Fields' pane at the right displays the values of all the fields of the event detected as the incident. The 'Value Matrix' pane at the bottom right displays the aggregation values fed by the rule from the detected event, in order to generate a new event indicating the event detection by it. Refer to the explanation of 'Output Mappings' under 'Configuring a Correlation Rule' in the section Managing Rules for more details.
The 'Drill Down' pane at the left allows you to view the details of the incidents identified by the same rule.
• To view the events, expand the folder structure under drill-down and select the time point.The field values of the respective event detected at the time point will be displayed at the right.
Manually Adding an IncidentIn addition to the incidents reported by the correlation rules, the administrator can manually add an incidents in order to assign specific jobs to the user allotted to a customer. The manually added incidents can also be attached to a case for combined investigation and action by the user.
To add and assign an incident• Click the 'Add' button at the bottom of the screen.
• Name - Enter a name for the incident.• Customer - Choose the customer from the drop-down for whom you want to add the incident.• User - The drop-down will display the users assigned to the selected customer. Choose the user to whom
the incident is to be assigned. Refer to the section 'Administration' for details about assigning users to customers.
• Priority - Select the severity level of the incident from the drop-down. The options available are 'Info', 'Low', 'Medium', 'High' and 'Critical'.
• Status - Select the status of the incident from the drop-down. The options available are - Open, In Progress, False-Positive and Closed.
• Description - Enter an appropriate description for the incident• Click the 'Save' button
The incident will be added and displayed in the 'Incident List' and will be available for attachment to a case. Please note that incidents added manually will be classified as 'Default'.
Editing and Reassigning an IncidentYou can change the status, edit the name, severity level of an incident at any time. You can also reassign an incident to a different user if required.
To edit an incident• Use the filter options at the left to view the list of incidents pertaining to a specific customer, assigned to a specific
user, specific type, status and/or priority level .• Select the incident that you want to edit from the list and click the 'Edit' button at the bottom.
• Edit the details like Name, priority, status as required.• To reassign the incident select the new user to whom the incident has to be assigned, from the User drop-down.
Note: The 'User' drop-down will display only the users that are added for the customer. Refer to the section 'Administration' for details about assigning users to customers.
• Click the Save button for your changes to take effect.
Adding Incidents to CasesA 'Case' is a collection of mutually related or a series of incidents for collective investigation and remedial action by the user to whom it is assigned. The administrator can create a case and assign to a same user, from the 'Case Management' interface and attach incidents to cases from the 'Incident Management' interface. For more details on creation and management of cases, refer to the section Managing Cases.
To attach an incident to a case• Use the filter options at the left to view the list of incidents pertaining to a specific customer, assigned to a specific
user, specific type, status and/or priority level .• Select the incident that you want to add to case and click the 'Attach' button.
The 'Incident Attachment to Case' pane will open with a list of cases assigned to the same user to whom the selected incident is assigned.
• Select the case to which the incident needs to be added• Click 'Save'.
The incident will be added to the case.
8.2 Managing CasesNxSIEM allows the administrator to group 'Incidents' that are mutually related or identified as series of events as a 'Case' and assign it to the user allotted for the customer. The user will be able to view the list of incidents to be attended together, take a consolidated remedial action and close the case.
For example, if an intruder executes Brute Force attack and access a network and tries to identify the vulnerable endpoints in the network by performing a port scan, the brute force attack is added as an incident and port scans at different endpoints are added as separate incidents in NxSIEM, if appropriate correlation rules are deployed for the customer. These incidents can be combined as a case and assigned to the user allotted for the customer for a collective remedial action.
The Case Management interface allows the administrator to create and manage cases. To open the 'Case Management' interface, click the 'Menu' button from the top right, choose 'Incidents' and then click 'Case Management'.
The Left side panel contains the options for selecting the cases to be displayed in the right panel using the filter options. The right side panel displays the list of cases with their details as a table.
• To view all incidents without filtering, select 'All' in all the filter option drop-downs and click 'Search'. • To view the cases created for a specific customer, assigned to a specific user, of specific, status and/or priority, select
the option(s) from the respective drop-downs and click 'Search'.
Case List - Table of Column Descriptions
Column Header Description
Date Displays the precise date and time at which the case was created.
Name Displays the name of the case.
Customer Indicates the customer for whom the case was created.
Username Indicates the user allotted to the customer, to whom the case is assigned for investigation.
Priority Indicates the severity level of the case as set by the administrator.
Status Displays the status of the case on whether it is attended or yet to be attended. The possible values are:
• Open;• In-Progress;• False-Positive;• Closed.
Description A short description of the case as entered by the administrator.
Last Update Time Displays the date and time at which the case was last updated by adding or removing incidents, adding notes etc.
Sorting Options:• Clicking on any column header sorts the items in alphabetical order of entries in that column.
The following sections explain on:
• Creating cases• Viewing details and updating the cases• Editing cases
Creating CasesThe administrator can create cases and assign to specific users from the case Management interface. The incidents can be attached to the case only from the 'Incident Management' interface.
To add a case• Click the 'Add' button at the bottom right of the 'Case Management' interface
• Name - Enter a name for the case.• Customer - Choose the customer from the drop-down for whom you want to add the case.• User - The drop-down will display the users assigned to the selected customer. Choose the user to whom
the case is to be assigned. Refer to the section 'Administration' for details about assigning users to customers.
• Priority - Select the severity level of the case from the drop-down. The options available are 'Info', 'Low', 'Medium', 'High' and 'Critical'.
• Description - Enter an appropriate description for the case.• Click the 'Save' button
The Case will be added. The next step is to add incidents to it. For a tutorial on attaching incidents to the case, refer to the explanation of Adding Incidents to Cases in the previous section Managing Incidents.
Viewing Details and Updating the CasesThe 'Case Details' pane allows the administrator to view and manage incidents attached to the case, view the details of the incidents, update the case on actions taken, like exchanging comment and notes with the user and add attachments that may aid in attending to the incidents.
To view the details of a case• Use the filter options at the left to view the list of cases pertaining to a specific customer, assigned to a specific user,
specific type, status and/or priority level .• Choose the case from the 'Case List' at the right and click the 'Details' button.
The upper portion displays the general details like name of the case, priority, customer, status, user to whom the case is assigned and so on. The lower portion contains three stripes that allow you to:
• Incident List - View and manage list of incidents attached to the case and view details on individual incidents• Note List - View and add notes to the case• Attachment List - View and share files that may be useful to investigate and take remedial measures for the incidents
To view and manage incidents • Click the 'Incident List' stripe to open the 'Incident List' pane.
The 'Incident List' displays the list of incidents attached to the list with their details, as a table, similar to the 'Incident List' in the Incident Management interface. Refer to Incident List - Table of Column Descriptions in the section Managing Incidents for explanations of the details displayed.
• To view the full details of an incident, select the incident and click 'Show'.
The 'Incident Details' pane for the selected incident will be displayed. Refer to the explanation of Viewing the details of incidents in the section Managing Incidents for more information on the details displayed in this pane.
• To remove an attended/closed incident or incident added by mistake, from the case, select the case and click the
'Detach' button . A confirmation dialog will appear.
• Click 'Yes' to remove the incident from the case.
To view and add notes to the case• Click the 'Note List' stripe to open the 'Note List' pane.
The 'Notes List' displays the list of comments and notes entered by the administrator and user that attends the case. You can add your comments to the case, through this pane.
• To view the full details of an incident, select the incident and click 'Show'.
• To add a new note/comment, enter the text in the text box at the bottom and click 'Save'.To share files for use in attending the case
• Click the 'Attachment List' stripe to open the 'Attachment List' pane.The pane displays the list of files that were shared in regard to the case, with comments entered for them.
• To upload a file to the case• Click 'Upload', navigate to the file to be uploaded in the 'File Upload' dialog and click 'Open'.
The file will be added for uploading and a text box will be displayed for entering the description of the file.
• Enter a description for the file in the text box and click 'Save'. The file will be uploaded and added t the list. The user attending the case can download and use the file.
• To download a file, click the download icon beside the file to be downloaded and save the file.• To remove a file from the case, click the thrash can icon beside the file.
Editing CasesYou can change the status, edit the name and severity level of a case at any time. You can also reassign the case to a different individual if required. Also you will be able to view the incidents attached to the case and update the case while editing the case. For example, if you are re-assigning a case to a new user, you can add a note on that to the case.
To edit a case• Use the filter options at the left to view the list of cases pertaining to a specific customer, assigned to a specific user,
specific type, status and/or priority level .• Select the case that you want to edit from the list and click the 'Edit' button at the bottom.
The 'Case Update' dialog will appear.
• Edit the details like Name, priority, status as required.• To reassign the case to a new user, select the new user to whom the incident has to be assigned, from the User drop-
Note: The 'User' drop-down will display only the users that are added for the customer. Refer to the section 'Administration' for details about assigning users to customers.
• Click the 'Save' button for your changes to take effect.• To view the list of incidents and update the case, click the 'Attachments' button.
The 'Case Details' pane will appear. For more details on managing the case from this pane, refer to the explanation of Viewing Details and Updating the Cases.
9 Live ListsLive Lists allows administrators to create and manage lists of defined values for fields which can be used as parameters in event queries and correlation rules. For example, a list can be created with the IP addresses of malicious domains which could be used for the 'Destination Translated IP' (dst_tr_ip) field of a query designed to identify events involving access to malware domains.
Any updates to a live list are dynamically reflected in all queries and rules in which it is used.
Live lists are created by first specifying the event field then populating it with values. Values can be populated in two ways:
• Values can be manually entered• Correlation rules can be configured to feed values from events to a live list
Each Live List can be defined with several list types, each type containing a set of values. For example, you can create a Live List called 'IP Blacklist' which contains two types, 'Internal' (IP addresses of infected internal hosts) and 'External' (IP addresses of external malware hosts). These two lists can be used separately if required.
To open the 'Live List' interface, click the menu button at top right and choose 'Lists':
9.1 Managing Live ListsThe 'Live List Management' interface allows administrators to create and manage Live Lists and their types for different customers. Each 'Live List' can be configured for a single field type and a single live list can be made to have several 'Types' for defining different sets of values for the same field for use in different 'Event Queries' and 'Correlation Rules'. You can also define the time period for which a value entered in the list is valid.
For example, you can create a Live List 'IP Blacklist' with two types, 'Internal' ( containing IP addresses of infected internal hosts in a network) and 'External' ( containing IP addresses of external malware hosting domains). These two list types can be used separately as appropriate to different types of queries and rules.
Note: The Live List Management interface allows you to only create and manage lists for various fields. The values for the fields can be manually added from the Live List Content Management interface. Refer to the section Managing Live List Content.
To open the 'Live List Management' interface, click the 'Menu' button from the top right, choose 'Lists' from the options and then click 'Live List Management'
The interface displays a list of Live Lists added to NxSIEM with their details and controls for adding a new list, switching a list between active and inactive states and viewing the values added to a list.
Live List Summary Table - Column Descriptions
Column Header Description
Name Displays the name of the live list
Type Displays the types available for the live list
Field Displays the event log entry field for which the list contains the values.
Active Indicates whether the list is active or not.
Following sections explain on:
• Creating new lists• Changing activation state of lists• Viewing the values entered for a list
Creating new listsA new live list can be created by specifying a name, adding types and defining the field for which the values are to be populated in the list. The values for the field can be specified for each type only from the 'Live List Content Management' interface. Explanations on adding values to the list types are available in the section Managing Live List Content..
To create a new list
• Click the 'Add' button at the bottom right of the 'Live List Management' interface.
• Enter a name for the live list in the 'Name' field.
• Add a name for a list type to be create in the Type text box and click the button.The Type will be added to the list of types in the left pane.
• Repeat the process to add more types for the types.
• To remove a type added by mistake, select the type from the list and click the thrash can icon .• Specify the field for which the values are to be populated in the list by selecting the 'Field Group' and choosing the
Field from the respective drop-downs above the left pane.
The field will be added to the list of fields in the right pane.
• Repeat the process if you want to add more fields.
• To remove a field added by mistake, select the field from the list and click the thrash can icon .• Leave the 'Active' checkbox selected if you want the list to be active on creation. If you want to turn the list active at a
later time, clear this checkbox.• Click the 'Submit' button.
Caution: The name, types and filed values once configured for a list cannot be changed or removed later. Please re-check these details before clicking 'Submit'.
The List will be added to NxSIEM. The next step is to manage the values for the list. Refer to the section Managing Live List Content for more details.
Changing Activation State of ListsThe Live Lists can be switched between active and inactive states at any time. The inactive lists do not feed the values to the event queries and the correlation rules in which they are used.
To change the active/inactive state of a list
• Choose the list from the 'Live List Summary' interface and click the 'Change' button at the bottom right.
• Click 'Yes' to confirm the change.The change in the state of the list will be indicated under the 'Active' column in the 'Live List Summary' interface.
Viewing the Values Entered for a ListThe administrator can view the values for all types, added for a live list and can edit them.
To view the values in a list
• Choose the list from the 'Live List Summary' interface and click the 'Show' button at the bottom right.
The 'Live List Content Management' interface will open with a list of values added to the list.
For more details on adding new values and editing existing values, refer to the following section Managing Live List Content.
9.2 Managing Live List ContentThe values for a Live List can be populated in two ways:
• The values can be manually entered to the list. • Correlation rules that are used for identifying events based on certain criteria and to generate incidents, can be
configured to feed the values from the events identified by it, to the live lists. Refer to the explanation of List Mappings in the section Managing Rules.
This section explains on manually adding values to lists and managing existing values. The 'Live List Content Management' interface allows the administrator to view the values added to all or selected lists, manually add new values, edit existing values
To open the 'Live List Content Management' interface, click the 'Menu' button from the top right, choose 'Lists' and then click 'Live List Content Management'.
By default, the Live List Contents table shows the values added to all the lists. You can filter the table to view the values added to a specific list using the filter options from the top.
Live List Contents Table - Column Descriptions
Column Header Description
Value Displays the value added to a list.
Live List Displays the Live List to which the value belongs.
Type Displays the type of the Live List, to which the value belongs.
Due Date Indicates date and time till which the value is valid in the list. On lapse of the due date, the value will be automatically removed from the list.
Customer Displays the customer to which the value is applicable.
Sorting and Filtering Options:• Clicking on any of 'Value', 'Live List' and 'Type' table header sorts the items in alphabetical order of entries in that
column. • To filter the values for a specific customer choose the customer from the 'Customer' drop-down and click 'Search'.• To view the values belonging to a specific Live List, choose the list from the 'Live List' drop-down and click 'Search'.• To view the values belonging to a specific Live List Type, select the list from the 'Live List' drop-down, then choose the
type from the 'Type' drop-down and click 'Search'.The interface allows you to:
• Manually add values to live lists• Edit existing values in a list• Remove values from a list
• Click the 'Add' button at the bottom right of the 'Live List Content Management' interface.The List Content Add dialog will appear.
• Select the Live List and the list type to which the value is to be added, from the respective drop-downs under 'List Management'.
• Enter the value for the field defined for the Live List in the 'Value' field.• Enter the date till which the value is valid in the Due Date field. You can click the calendar icon at the left of the field
and choose the date. On the specified date, the value will be automatically removed from the list. If you want the value to be permanently valid, select the Permanent checkbox.
• Select the customer to which the value is applicable from the Customer drop-down.• Click 'Submit'.
The value will be added to the selected list type.
• Repeat the process for adding more values to the list.To edit an existing value in a list
• Select the Live List and choose the type from the 'Live List' and 'Type' drop-downs at the top of the Live List Content Management interface and click 'Search', to view only the values added to the required Live List/Type.
• Select the value and click the 'Edit' button at the bottom right of the interface.The List Content Edit dialog will appear for the chosen value. The dialog is similar to the List Content Add dialog. Refer to the section above for more details.
• Edit the details as required and click 'Submit'.The value will be edited and will take immediate effect on the Event Queries and Correlation Rules in which the Live List has been used.
To remove a value from a list • Select the Live List and choose the type from the 'Live List' and 'Type' drop-downs at the top of the Live List Content
Management interface and click 'Search', to view only the values added to the required Live List/Type.
• Select the value and click the 'Delete' button at the bottom right of the interface.A confirmation dialog will appear.
• Click Yes to confirm the removal.The list will be updated for the removal of the value and take effect immediately on the Event Queries and Correlation Rules in which the Live List has been used.
10 Managing Reports Comodo NxSIEM is capable of generating detailed event reports covering a wide range of security and productivity criteria. Reports can be generated for periods ranging from one hour to one month and configured to be displayed as tables, pie charts and bar charts. The data for the reports are fetched from the event query results. You can use both pre-defined queries and custom queries added for a customer or event create new custom queries to generate reports as required. Refer to the section 'Query Management' for more details about configuring event queries.
The Report Management interface allows the administrator to configure and generate reports for selected customers.
To open the Report Management interface, click the 'Navigational Menu' button from the top right, choose 'Reporting' from the options and then click 'Report Management.
The left hand side panel of the interface displays a list of predefined reports and custom queries added for the selected customer under respective category folders. The right hand side panel displays the configuration area for report generation.
Report Management Interface - Table of Controls and Fields
The 'Customers' drop-down allows you to select the customer for which you want to create or view the report(s).
Allows you to add a new report category folder to the left side panel
Allows to edit the name of a selected report category folder
Allows you to add a new report type under a selected category folder
Allows to delete selected report category folders or report type from the left hand side pane.
Name Displays the name of the report chosen from the left hand side pane. Allows you to enter the name for the report, when creating a new report.
Description Displays a brief description about the report chosen from the left hand side pane. Allows you to enter a brief description the for the report, when creating a new report.
Allows you to select the time period for report generation. Options ranges from the last hour to the entire previous month.
Report Elements Displays the list of contents in the report with details like their name, the event query based on which the data is populated in the report component and the type of the report component, like table, pie or bar chart.
Allows you to add a report element to the selected report and choose the type of chart for the report element.
Manage a Reports Category FolderEach report folder contains a collection of reports of a specific category. Every new report configured, must always be placed in a category folder.
Creating a reports group folder• Choose the customer from the 'Customers' drop-down at the top of the left panel.
A list of predefined reports added for the customer is displayed as a tree structure in the 'Reports' pane.
• Choose the parent folder to create a new sub-folder and click the button. The Folder Name dialog will appear.
• Enter a name for the new folder in the 'Folder Name' field• Enter a description for the folder• Click the 'Add' button
The folder will be saved and displayed on the left side.
The relevant reports can now be placed under the newly created folder. Refer to the 'Adding and Configuring a Report' for more details.
Editing a reports group folder
• To edit the name of a reports group folder, select it and click the button.The 'Folder Name' dialog will appear.
• Edit the name and/or the description as as required and click the 'Save' buttonAlternatively, click on the folder, edit the details on the right side and click the 'Save' button.
• To delete a reports group folder, select it and click the button.A confirmation dialog will appear.
• Click 'Yes' in the In the confirmation dialog. Please note all reports contained in the folder will also be deleted.
Add and Configure a ReportComodo NxSIEM ships with a set of pre-defined reports which are listed under the 'Comodo Built-in Reports' folder in the left hand side panel of the 'Report Management' interface. The interface also allows the administrator to configure custom reports for various categories of events for selected customer and save them under the respective category folder. The reports can be generated at anytime as and when required for the customer.
To add a new report for a customer• Choose the customer from the 'Customers' drop-down at the top of the left panel.
A list of predefined reports added for the customer is displayed as a tree structure in the 'Reports' pane.
• Select the appropriate folder or create a new folder under which you want to create a report.
• Enter a name for the report in the 'Name' field• Enter an appropriate description for the report in the 'Description' text box• Select the period for which the events are to be included in the report, from the 'Time' drop-down
The period options range from last one hour to the entire previous month of the report generation time.
The next step is to add the component tables/charts to be included in the report. The events for populating the tables/charts are fetched from the query results. Refer to the section 'Query Management' for more details about configuring event queries.
• Select the type of report element that should be added, from the drop-down at the bottom of the 'Report Elements'
• Table - The report component will contain the details of the events that match the query selected. Refer to the explanation on adding a table given below, for more details.
• Pie Chart - The report will contain a pie-chart showing the statistical summary of the events that are aggregated based on parameters configured for the chart. Refer to the explanation on adding a pie chart given below , for more details.
• Bar chart - The report will contain a bar-chart showing the statistical summary of the events that are aggregated based on parameters configured for the chart. Refer to the explanation on adding a bar chart given below , for more details.
'Table' type Report ElementThe Table Type report is configured just by selecting the event query from the list of queries added for the customer. The resultant report will contain all the details of the events that match the query, detected within the selected time period, displayed as a table.
To add a Table type report
• Select 'Table' from the drop-down and click the button beside it.The configuration dialog for adding a report table will appear with a list of all event queries configured for the customer.
• Enter the name for the report element in the 'Name' field.• Select the event query for which you want to generate a report in table format. This table is the same as configured in
the event queries.• Click the 'Add' button.
The report element will be added to the report.
'Pie Chart' type and Bar Chart Type Report ElementsThe chart type reports can be configured by specifying the following parameters:
'Event Query' + 'Group By' + 'Aggregation Function' + 'Order By' + 'Limit'• Event Query - The query whose results are to be displayed in the chart. The query can be selected from the list of
queries, added fro the selected customer. The events that are detected based on the query for the last one hour will be displayed in the charts.
• Group By - The field, based on whose values, the events identified by the query are to be grouped and shown in the chart. Event groups will be formed so that each event group will have events with same value for the selected field.
• Aggregation Function - The event groups formed based on the fields chosen in the 'Group by' option, are ranked based chosen 'Aggregation Function'. The event groups are indicated in the charts in ascending or descending order as chosen in the 'Order by' setting. The available options are:
• Count - The event groups are ranked based on the number of events in each group. For example, if you choose Source IP as 'Field' then the group which contains the most events on a particular source IP will have the top rank and the group containing the lowest number of events is ranked lowest. You can further control how the data is displayed by modifying the 'Order By' and 'Limit' parameters.
• Sum - The event groups are ranked based on sum of values in another field that contains numerical value. If you choose 'Sum', you need to select another field that contains a numerical value, like bytes in/out. The event groups are ranked based on the sum of the values in the chosen numerical field from all the events in that group. For example, if we choose 'Bytes-in' as numerical value, then the system adds up the values in the 'Bytes-in' field of all the events in a group and ranks the group accordingly. This will tell you which source IP has the most incoming traffic. The event group with the highest SUM in the 'Bytes-in' field is ranked top and vice-versa.
• Average - Similar to above. Event groups are ranked based on the average of the values of the chosen numerical field from all the events in that group. (e.g. the average of values of 'Bytes_in' field of events in the group, if we take the same example as above)
• Minimum - Similar to above. The event groups are ranked based on the minimum of the values of chosen numerical field from all the events in that group.
• Maximum - Similar to above. The event groups are ranked based on the maximum of the values of chosen numerical field from all the events in that group.
• Order By - You can choose the order in which the event groups are to be indicated in the chart, based on their ranking. The available options are:
• Ascending - The group with the lowest rank will be top of the list. A limit of 5 will show the 5 groups with the lowest ranks.
• Descending - The group with the highest rank will be top of the list.. A limit of 5 will show the 5 groups with the highest ranks.
• Limit - The number of event groups to be displayed in the chart
Example:
The following screenshot shows the preview of resulting pie chart from the following configuration parameters:
Name Enter an appropriate name for the report element
Queries Displays the list of predefined and custom event queries added for the selected customer. Select the event query for which the results are to be displayed in the chart.
Group By The drop-down displays the fields, configured as event query results table column headers for the selected event query. Refer to 'Configure results table for a query' for more details.Choose the Field based on whose values, the events identified by the query are to be grouped and shown in the chart.
Aggregation Function Allows you to choose the aggregation operation to be applied for ranking the event groups and show them in ascending or descending order, in the chart. The options available are:
• Count - The event groups are ranked based on the number of events in each group. For example, if you choose Source IP as 'Field' then the group which contains the most events on a particular source IP will have the top rank and the group containing the lowest number of events is ranked lowest. You can further control how the data is displayed by modifying the 'Order By' and 'Limit' parameters.
• Sum - The event groups are ranked based on sum of values in another field that contains numerical value. If you choose 'Sum', you need to select another field that contains a numerical value, like bytes in/out. The event groups are ranked based on the sum of the values in the chosen numerical field from all the events in that group. For example, if we choose 'Bytes-in' as numerical value, then the system adds up the values in the 'Bytes-in' field of all the events in a group and ranks the group accordingly. This will tell you which source IP has the most incoming traffic. The event group with the highest SUM in the 'Bytes-in' field is ranked top and vice-versa.
• Average - Similar to above. Event groups are ranked based on the average of the values of the chosen numerical field from all the events in that group. (e.g. the average of values of 'Bytes_in' field of events in the group, if we take the same example as above)
• Minimum - Similar to above. The event groups are ranked based on the minimum of the values of chosen numerical field from all the events in that group.
• Maximum - Similar to above. The event groups are ranked based on the maximum of the values of chosen numerical field from all the events in that group.
Order By Allows you to choose the order in which the event groups are to be indicated in the chart, based on their ranking. The available options are:
• Ascending - The group with the lowest rank will be top of the list. A limit of 5 will show the 5 groups with the lowest ranks.
• Descending - The group with the highest rank will be top of the list.. A limit of 5 will show the 5 groups with the highest ranks.
Limit Enter the number of events to be displayed for the chart
Preview This button allows to preview the chart before adding it to the report.
Add Click this button to add the chart to the report
• Enter the parameters for the chart as shown in the table above and click the 'Preview' button to check the chart before adding it to the report.
• Click the 'Add' button The configured report element will be added to the list.
To add 'Bar Chart' type report element
• Select 'Bar Chart' from the drop-down and click the button beside it.
The procedure is same as adding a pie chart report element explained above.
• Name - Displays the name of the report element• Query - Displays the name of the event query that was used to configure the report element• Type - Indicates the type of report element, whether table, pie or bar chart.
You can add as many report elements as required for a report.
• Click the 'Save' button to save all the report elements.Now that you have configured a report, you can generate the report and/or schedule the report generation.
Generate a ReportAfter configuring a report, you can generate it manually or specify the automatic generation of the report according to a schedule of your choice.
To manually generate a report • Choose the customer from the 'Customers' drop-down at the top of the left panel.
A list of predefined and custom reports added for the customer is displayed as a tree structure in the 'Reports' pane.
• Select the report from the list. The details of the report with the list of report elements will be displayed in the configuration area at the right.
The 'Generated Reports' area displays a list of reports generated manually or as per the schedule created for the report.
• Creation Time - The date and time the report was generated.• File Type - Currently only PDF format is available for reports. Future releases will support RTF files also.• Action - Allows to delete the generated report.
• To generate the report instantly, click the 'Generate' button.The report generation will be started and on completion, it will be added to the list under 'Generated Reports' and its time stamp will be added to the 'Creation Time' column.
• To download the report, clicking the time stamp under the 'Creation Time' column.• To view the report instantly select the 'Show Last Generated Report' check box.
Refer to the section 'Download / View a Report' for more details about how to download and /or view a report.
Schedule a Report GenerationYou can automate the process of report generation according to a schedule of your choice.
To schedule a report generation• Choose the customer from the 'Customers' drop-down at the top of the left panel.
A list of predefined and custom reports added for the customer is displayed as a tree structure in the 'Reports' pane.• Select the report from the list.
The details of the report with the list of report elements will be displayed in the configuration area at the right.
• Click the 'Schedule' button at the bottom of the 'Generated Reports' area.The 'Schedule Report' dialog will be displayed.
The 'Timing' section allows you to define the frequency for report generation.
• Occurs - Select the period for report generation from the drop-down. The options available are:• Hourly• Daily• Weekdays• Weekend• Weekly• Monthly
• Reoccurs every - Enter the frequency for report generation as per the chosen days. For example, if you select 'Daily' and enter 2, then the agent will collect the logs once in every 2 days
• Occurs At - Enter the exact time at which the report is to be generated at the set days.The 'Duration' section allows you to define the start and end days for the period of report generation.
• Start - Select the start month from the drop-down• End - Select the end month from the drop-down
• Click the 'Schedule' button.A confirmation message will be displayed at the top right side of the screen. The reports will be automatically generated as per the schedule and added to the list under 'Generated Reports' and represented by time stamps under the 'Creation Time' column. You can download required report(s) by clicking the respective time stamp.
Download / View a ReportThe 'Generated Reports' area in the 'Report Management' interface allows you to download and / or view any generated report.
To download / view a report• Choose the customer from the 'Customers' drop-down at the top of the left panel.
A list of predefined and custom reports added for the customer is displayed as a tree structure in the 'Reports' pane.
• Select the report from the list. The details of the report with the list of report elements will be displayed in the configuration area at the right.
The 'Generated Reports' area displays a list of reports generated manually or as per the schedule created for the report.
• To download a report, click on the time stamp link of it under the 'Creation Time' column.
You can download the report in .pdf format.
• To view the last generated report instantly, select the 'Show Last Generated Report' check box. The report will be displayed in the 'Last Generated Report' area, below 'Generated Reports' area.
Edit Report SettingsYou can change the name, description, report elements and their configuration at any time from the Report management interface.
To edit a report• Choose the customer from the 'Customers' drop-down at the top of the left panel.
A list of predefined and custom reports added for the customer is displayed as a tree structure in the 'Reports' pane.
• Select the report from the list. The details of the report with the list of report elements will be displayed in the configuration area at the right.
• Edit the name and description as required and click the 'Save' button at the bottom.To edit the details of a report element
• Select the report element from the list that you want to edit and click the edit button at the bottom.
The 'Update' screen for the selected report element will be displayed.
In the confirmation dialog, click the 'Yes' button to remove the report.
The report and all the report elements under it will be deleted.
Manage Generated ReportsThe 'Generated Reports' area in the Report Management interface displays a list of manually generated and scheduled report files for the report selected from the left.
• To sort the generated report list according to the date from latest to earliest and vice versa, click anywhere on the 'Creation Time' column header.
• To refresh the list of generated reports, click the button on the right.• To view the report that was generated last, select the 'Show Last Generated Report' check box
The report will be displayed below the section.
• To close the report, deselect the 'Show Last Generated Report' check box
• To delete a report file, click the thrash can icon under the 'Action' column
• Click the 'Ok' button to confirm the deletion of the report.
11 Administration The 'Administration' interface allows administrators to view log collection summaries, manage administrative users assigned to particular customer(s) and view license and subscription details and configure the sub-domain name for the NxSIEM URL.
The 'Administration' tab will only be visible to persons with administrative privileges, and not to regular 'users'.
To open the 'Administration' interface, click the menu button at top right and choose 'Administration':
Refer to the following sections for more details:
• Viewing Log Collection Summaries• Managing Users• Viewing License and Subscription Details and Configuring NxSIEM platform URL
11.1 Viewing Log Collection SummariesLog collection summaries provide an insight into event logs collected from agents and endpoints on customer networks. Administrators can view a history of log collection and can export the summaries to .pdf for offline analysis.
To open the 'Log Collection Summary' interface, click the 'Navigational Menu' button at top right, choose 'Administration' from the options and then click 'Log Collection Summary'.
The upper pane in the left side panel allows you to select the customer and the time period for which the log collection summaries are to be viewed. The lower pane in the left panel displays a pie chart that shows the breakup of sizes of log files collected from each agent/endpoint in the selected customer's networks.
Log Collection Summary Interface - Table of controls
The 'Customers' drop-down allows you to select the customer for which you want to view the log collection summary.
The 'Start' and 'End' fields allow you to define the period for which you want to view the log collection summaries for the selected customer. Use the calendar icons in the respective fields to specify the start and end dates.
Allows to search the logs collected from the customer within the specified time period. The details of the log collection are displayed in the 'Log Collection Summaries' table at the right.
Allows you to save the log collection summary table to a .pdf file and save it for future analysis.
The 'Log Collection Summaries' pane in the right hand side displays the summary of logs collected at each day from each agent/endpoint of the selected customer's networks, within the specified period.
Log Collection Summary Interface - Table of controls
Column Header Description
Creation Date Displays the date at which the customer was added to NxSIEM.
Customer Displays the name of the customer.
Summary Date Displays the log collection date for which the summary is displayed in the row.
Collector Displays the agent/endpoint from which the logs are collected
Event Count Displays the number of events for which the logs are collected on that day from that agent/endpoint.
Raw Log Size Displays the total size of log file collected from that agent/endpoint on that day.
• To view the log collection summary for all customers, choose 'All' from the 'Customer' drop-down, specify the start and end dates for the log collection period and click 'Search'. The details of the logs collected will be displayed at the right panel. The pie chart at the lower left panel will display a breakdown of sizes of log files collected from each customer network. Placing the mouse cursor on the chart displays the total size of log files from the specific customer.
• To view the log collection summary for a specific customer, choose the customer from the 'Customer' drop-down, specify the start and end dates for the log collection period and click 'Search'. The details of the logs collected will be displayed at the right panel. The pie chart at the lower left panel will display a breakdown of sizes of log files collected from each agent/endpoint in the customer networks. Placing the mouse cursor on the chart displays the total size of log files from the specific agent/endpoint.
• To save the displayed Log Summaries table as a .pdf file, click the 'Export' button. The .pdf file will be displayed in a new browser tab, which enables you to print or save the file.
11.2 Managing UsersThe administrator can add and manage users that can be assigned to the customers to address the incidents, cases and malicious events arising from their respective customer's networks. These technician users can access and view and manage only the dashboards, events and incidents pertaining to the customers assigned to them. The 'Correlated Incidents' and 'Cases' that are detected for customers will be automatically assigned to users enrolled for the respective customers on a random basis. Refer to the section 'Managing Incidents' for more details.
The User Management interface allows the administrator to add users, assign them to customers and manage them.
To open the 'User Management' interface, click the 'Navigational Menu' button from the top right, choose 'Administration' from the options and then click 'User Management'.
The 'User List' pane at the left displays a list of existing users and their roles. The 'Customer List' panel at the right displays the list of enrolled customers and the users assigned to them respectively. Refer to the section 'Adding Customers' to know about adding customers to the NxSIEM.
Following sections explain on:
• Adding users• Assigning a user to customer(s)• Edit user details• Remove a user• Reassign/remove customer access for a user
To add a user
• Click the 'Add' button at the bottom of the User List pane at the left. The 'Add User' dialog will appear.
• Username - Enter the username for the user.• Password - Enter the password for the user to login to NxSIEM. The password should be of at least 8
characters in length, should contain at least one uppercase, one lowercase and one numeral. • Role - Select the role to be assigned for the user. Currently only one role, 'MSSP_User' is available. More
roles will be added in future releases.• Region - Choose the region and time zone to which the user belongs, from the drop-down.• Language - Choose the language in which the NxSIEM web console is to be displayed to the user from the
drop-down.• Click the 'Save' button.
The user will be added and displayed under 'User List'.
To assign a user to customer(s)• Choose the user to be assigned to customer(s) from the 'User List' at the left.• Select the customer(s) to whom the user is to be assigned from the Customer List at the right side
• Click the 'Save' button.A confirmation dialog will appear.
To edit the details of a user• Choose the user whose details are to be changed and click the 'Edit' button from the bottom of the User List pane at
the right.
The 'Edit User' screen will be displayed.
The 'Edit User' dialog is similar to 'Add User' dialog. Refer to the section explaining adding a new user above for the descriptions of the fields available in this dialog.
• Edit the details as required and click the 'Save' button.
To remove a user• Choose the user to be removed and click the 'Delete' button from the bottom of the 'User List' pane at the right.
A confirmation dialog will appear.
• Click 'Yes' to confirm the removal.To reassign user to customer(s)
• Choose the user to be reassigned to a new customer(s) or removed from a customer, from the 'User List' at the left.The customers to whom the user is currently assigned will be indicated with their checkboxes selected, in the 'Customer List' at the right.
• To assign the user to new customer(s), select the new customer(s) from the 'Customer List' at the right side• To remove access to a customer from the user, deselect the customer.
A confirmation dialog will appear.
• Click 'Yes' to confirm the re-assignment.
11.3 Viewing License and Subscription Details and Configuring NxSIEM Platform URL
The License and Subscription interface displays the license details like license key, validity and so on and the limits set for Live Lists, log data storage period and so on. If the administrator wants to extend these limits, they can contact Comodo and request for them.
The interface also allows the administrator to change their MSSP service provider name and set the sub-domain name.
• You can set your desired service provider name for example, your company name as MSSP Name, so that the reports generated by NxSIEM will have your company name in their titles.
• You can set your desired sub-domain name, so that the access URL for your MSSP service will be set to https://<your subdomain name>.mssp.comodo.com/ui/start. All your administrators and users can login to your NxSIEM administrative console using this URL.
To open the 'License and Subscription' interface, click the 'Menu' button from the top right, choose 'Administration' and then click 'License and Subscription'.
The subscription details, license information and the limits set for the Live List count, data retention period and maximum log storage space covered by the license are displayed at the left. If you want to increase the limits, you can contact Comodo and place a request.
The 'Details' pane at the top right allows you to change your MSSP name and sub-domain name.
• To change the MSSP service provider name, directly edit the name in the 'MSSP Name' field. • To change the sub-domain name in the NxSIEM platform URL, directly enter the new sub-domain in the 'Subdomain
Name' field. • Click Save for your changes to take effect.
From the next login the administrators and the users should use the URL with the new sub-domain name to access the NxSIEM administrative console. The URL is of the form 'https://<new subdomain name>.mssp.comodo.com/ui/start.
Appendix 2 - Configuring Endpoints to Forward Logs to NxSIEM serverYou can configure endpoints in customer networks to forward logs to NxSIEM in several ways. There are two broad methods of log collection:
• Using The Log Collection Agent• Agentless Log Collection
Using NxSIEM AgentAgent Installation and ConfigurationYou can download the log collection agent from the NxSIEM interface, install on each endpoint and activate it using the unique key generated for the customer network/zone. Refer to the section Downloading and Installing the NxSIEM Agent on Endpoints for detailed explanation.
Remote Log CollectionAn agent installed on one endpoint in a network can be configured via a 'Remote Log Collection Policy' to acquire logs from another endpoint in which log collection is not installed. For more details on Log Collection Policies and their deployment to selected agents, refer to the section Log Collection Policies. For a tutorial on configuring a Remote Log Collection Policy, refer to the section Remote Log Collection Policy.
Agentless Log CollectionAgentless log collection involves configuring RSYSLOG and NXLOG utilities installed on Linux and Windows endpoints respectively. Configuration scripts for both RSYSLOG and NXLOG can be downloaded from the NxSIEM interface then run on endpoints to automatically forward logs to the NxSIEM server.
Using Ready Made Script FilesNxSIEM generates ready-made configuration script files with all parameters pre-configured for each enrolled customer/network. You can download the configuration script/file from the administrative console and deploy onto endpoints. This is the most convenient way of configuring NXLOG (Windows endpoints) and RSYSLOG (Linux endpoints) to send logs to the NXSIEM server. Refer to the section Configuring Nxlog and Rsyslog to Send Logs to NxSIEM Server for more detailed explanations on downloading the script files and deploying them.
Using manually Configurable Script FileNxSIEM allows you to download a configuration script for RSYSLOG which lets you manually set parameters such as network authentication token, name of product from which the logs are to be collected and so on. This script can be used to configure RSYSLOG utilities at Linux based endpoints to send logs to the NXSIEM server. For more details on downloading and configuring the script, refer to the section Agentless Log Collection.
About ComodoThe Comodo organization is a global innovator and developer of cyber security solutions, founded on the belief that every single digital transaction deserves and requires a unique layer of trust and security. Building on its deep history in SSL certificates, antivirus and endpoint security leadership, and true containment technology, individuals and enterprises rely on Comodo’s proven solutions to authenticate, validate and secure their most critical information.
With data protection covering endpoint, network and mobile security, plus identity and access management, Comodo’s proprietary technologies help solve the malware and cyber-attack challenges of today. Securing online transactions for thousands of businesses, and with more than 85 million desktop security software installations, Comodo is Creating Trust Online®. With United States headquarters in Clifton, New Jersey, the Comodo organization has offices in China, India, the Philippines, Romania, Turkey, Ukraine and the United Kingdom.