71
Next 1 Previous
| Date post: | 26-Dec-2015 |
| Category: |
Documents |
| Upload: | monica-rich |
| View: | 222 times |
| Download: | 1 times |

Next
1
Previous

Next
2
Previous
“وقل رب زدنى ” علمًا
Next
3
Previous
Teletraffic Analysis of the Next-generation Integrated Terrestrial/satellite Mobile Radio Networks
By:
Waleed Eid Al-HanafyWaleed Eid Al-Hanafy B.Sc., Electrical Communications Engineering
SUPERVISORS:
Dr. SamiSami A. El-DolilAssoc. Prof., Menoufia University, Faculty of Electronic Engineering
Dr. MostafaMostafa A. NofalAssoc. Prof., Menoufia University, Faculty of Electronic Engineering

Next
4
Previous
Objective of the ThesisObjective of the Thesis
Investigation of the integration between terrestrial Investigation of the integration between terrestrial mobile systems and satellite networks.mobile systems and satellite networks.
Implementation of integrated space/terrestrial Implementation of integrated space/terrestrial cellular model with different handoff priority cellular model with different handoff priority schemes for global mobile communications.schemes for global mobile communications.
Mixing data and voice services over the proposed Mixing data and voice services over the proposed global model.global model.
Next
5
Previous
OVERVIEW OF MOBILE RADIO SYSTEMS
OVERVIEW OF MOBILE RADIO SYSTEMS

Next
6
Previous
•First generation
•Second generation
- Analog techniques (TACS, AMPS, JMPS, NMT)
- Limited capacity
- Digital technology (GSM, DECT, CT2, ERMES)
- Increased system capacity and introduced more service features
- Improved system quality and significant reduction in system cost
Evolution of mobile communication systems
Next
7
Previous
•Third generation
- Multimedia applications features
- Trend towards globalization (communications anywhere-anytime)
- Provide personal services independently of the kind of network access (PSTN, cellular, satellite, etc.)
•The role of satellite- Complements terrestrial coverage areas, e.g., coverage of ships, aircraft and users in rural areas (maritime and aeronautical services)
- It is crucial to support the global roaming feature
- The main problem in satellite system design is the efficient use of two critical satellite resources (bandwidth and power)
Next
8
Previous
An alog
Mobile phone
Digital mobile
(GSM, DECT, ERMES, ...)
FPLM T S
UM T S
1stGen eration
2n dGen eration
3rdGen eration
1994 2000
Globalbeam(GEO)
Multiplebeam(GEO)
cellular like
(non-GEO)
Terrestria lFixed
Terrestria lM obile
Sate llite
UPT
An alog
Mobile phone
Digital mobile
(GSM, DECT, ERMES, ...)
FPLM T S
UM T S
1stGen eration
2n dGen eration
3rdGen eration
1994 2000
Globalbeam(GEO)
Multiplebeam(GEO)
cellular like
(non-GEO)
Terrestria lFixed
Terrestria lM obile
Sate llite
UPT
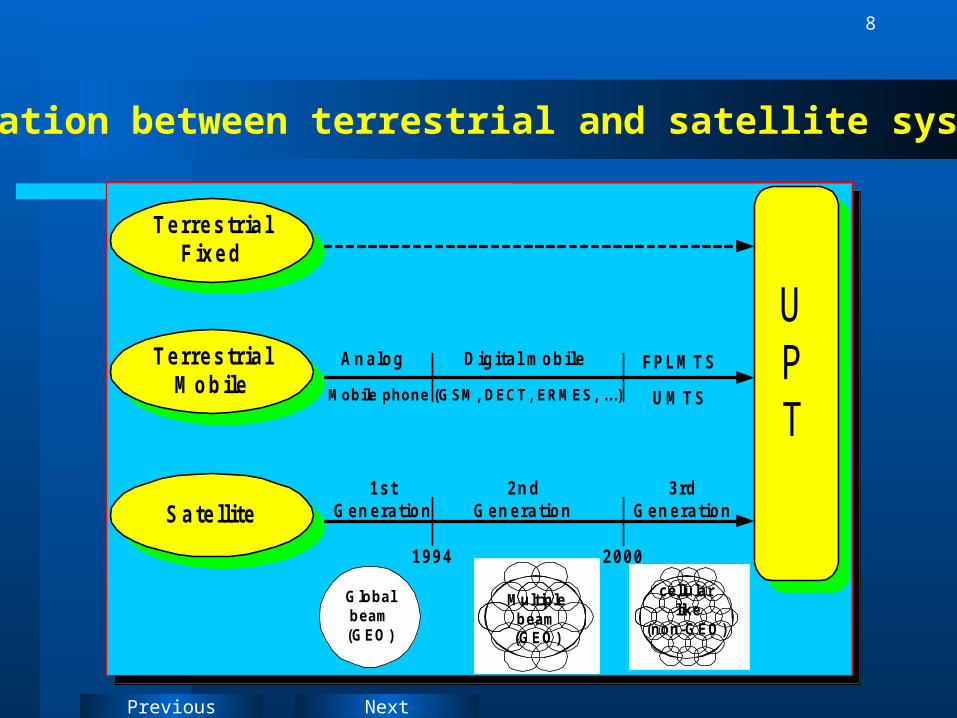
Integration between terrestrial and satellite systems
Next
9
Previous
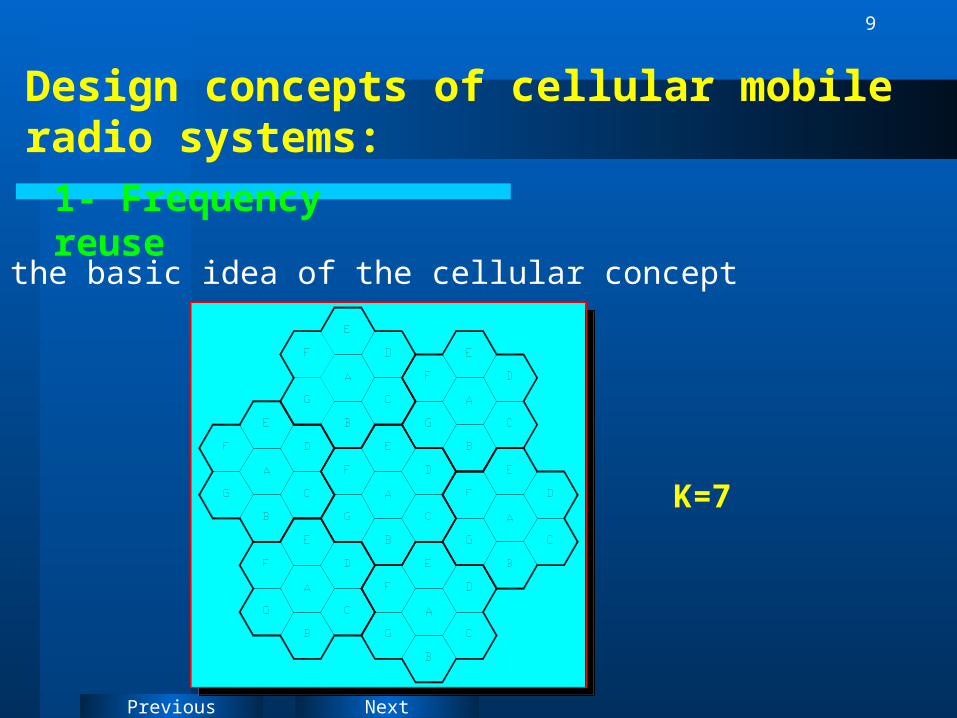
Design concepts of cellular mobile radio systems:
1- Frequency reuse
K=7
It is the basic idea of the cellular concept
Next
10
Previous
K3RD /
in
1nnD
RIC
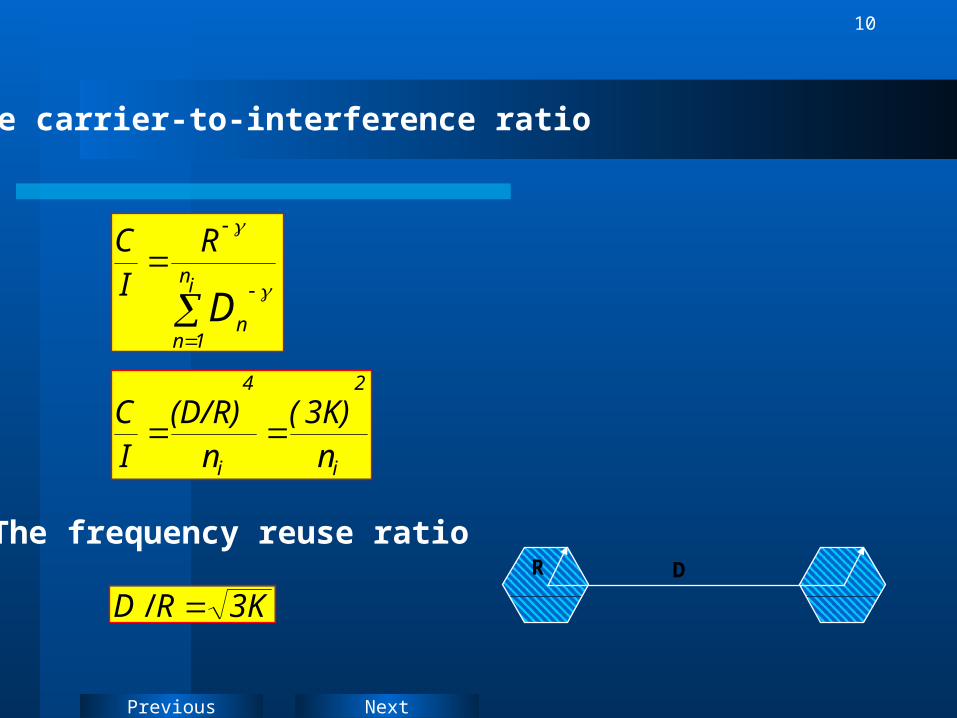
The frequency reuse ratio
The carrier-to-interference ratio
DR
i
2
i
4
nK)3(
n(D/R)
IC
Next
11
Previous
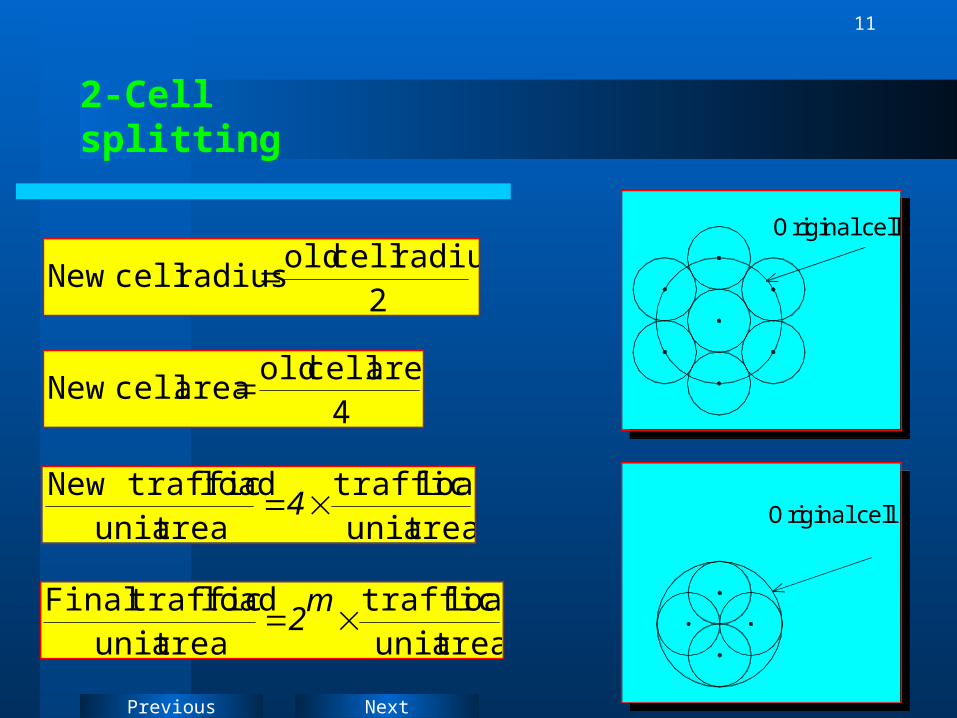
2-Cell splitting
2
radius cell old radius cell New
4area cell old
area cell New
areaunit load traffic
areaunit
load trafficNew 4
areaunit load traffic
areaunit
load trafficFinal m2
Original cellOriginal cell
Original cellOriginal cell

Next
12
Previous
3-Sectorization and trunking efficiency
Sectorizing a cell produces two effects:
Second, reduces trunking efficiency
First, reduces cochannel interference
(i. e., improved the C/I ratio)
With C/I ratio of at least 17 dB, an omnidirectional system requiresK=7, a three-sector system requiresK=4, and a six-sector system requires K=3
60120 60
120
Next
13
Previous
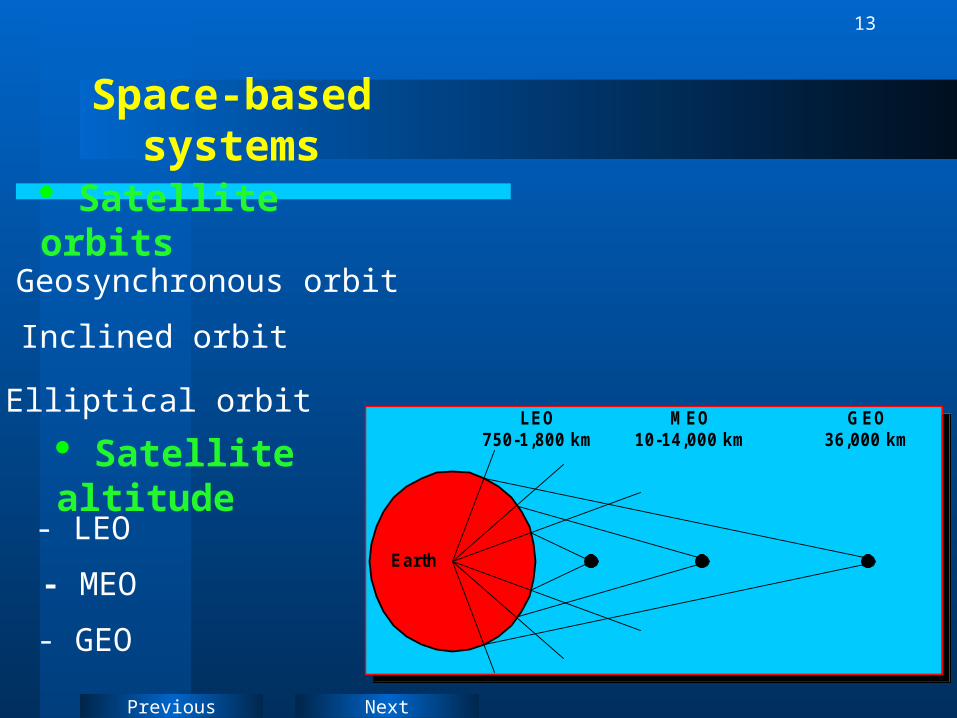
Space-based systems
Satellite orbits
GEO36,000 km
LEO750-1,800 km
MEO10-14,000 km
Earth
GEO36,000 km
LEO750-1,800 km
MEO10-14,000 km
Earth
- Inclined orbit
- Geosynchronous orbit
- Elliptical orbit
Satellite altitude
- MEO
- LEO
- GEO
Next
14
Previous
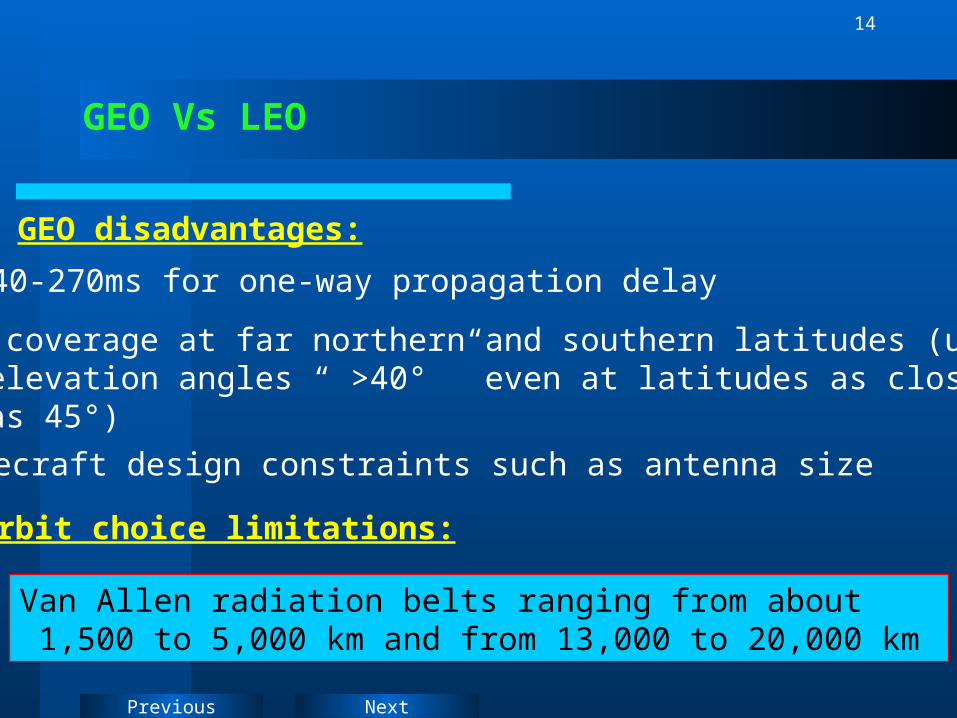
GEO Vs LEO
- 240-270ms for one-way propagation delay
- Lack of coverage at far northern and southern latitudes (unachievable required elevation angles “ >40° ” even at latitudes as close to the equator as 45°)
- Spacecraft design constraints such as antenna size
Van Allen radiation belts ranging from about 1,500 to 5,000 km and from 13,000 to 20,000 km
GEO disadvantages:
Orbit choice limitations:
Next
15
Previous
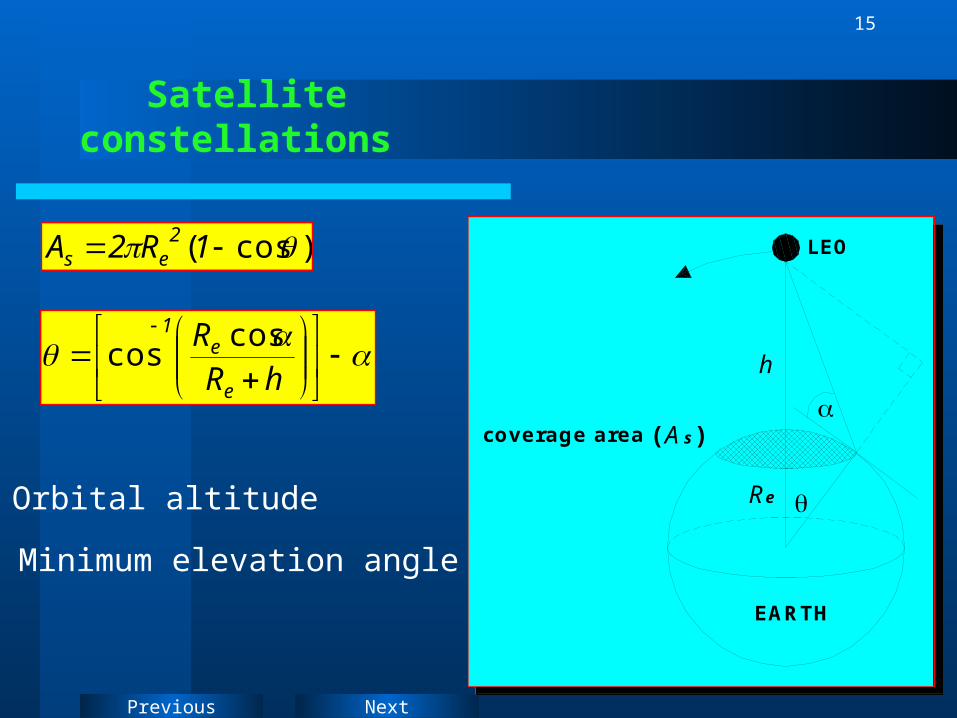
Satellite constellations
coverage area (As)
EARTH
Re
h
LEO
coverage area (As)
EARTH
Re
h
LEO)cos( 1R2A 2es
hR
R
e
e1 cos
cos
- Orbital altitude
- Minimum elevation angle
Next
16
Previous
0 10 20 30 40 50 60 70 80 9010
2
103
104
105
Radius of earth coverage, deg.
h-sa
telli
te a
ltit
ude,
km
alpha =010 20304050607080
0 10 20 30 40 50 60 70 80 9010
2
103
104
105
Radius of earth coverage, deg.
h-sa
telli
te a
ltit
ude,
km
alpha =010 20304050607080
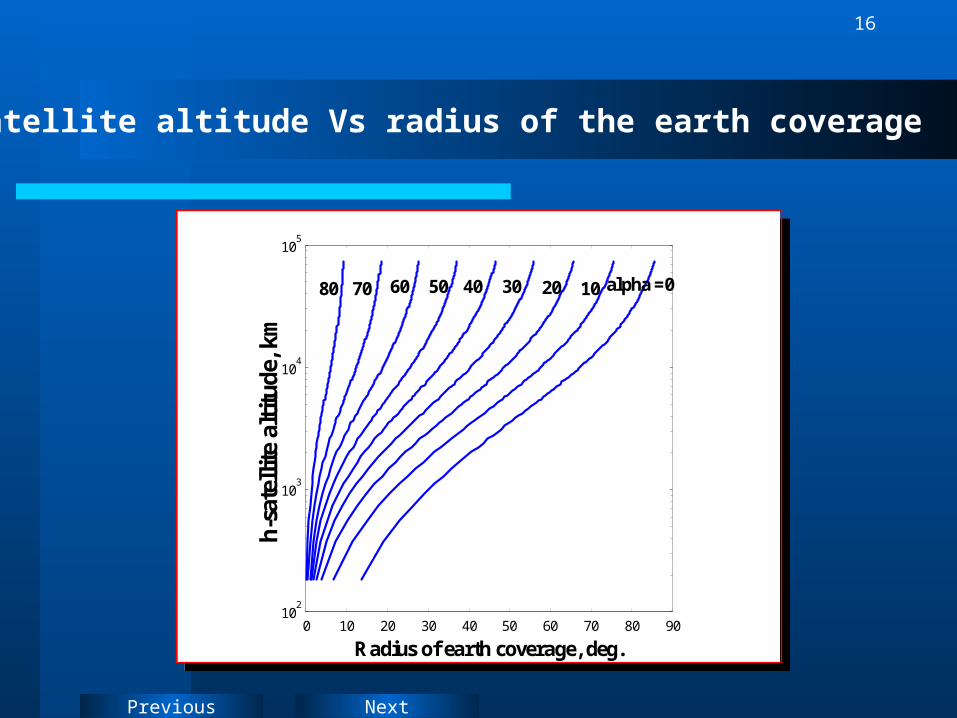
The satellite altitude Vs radius of the earth coverage

Next
17
Previous
102
103
104
105
104
105
106
107
108
109
h-satellite altitude, km
Cov
erag
e su
rfac
e ar
ea (
As)
, km
2
alpha=0
10
20 30
40 50 60
70
80 10
210
310
410
510
4
105
106
107
108
109
h-satellite altitude, km
Cov
erag
e su
rfac
e ar
ea (
As)
, km
2
alpha=0
10
20 30
40 50 60
70
80
The coverage surface area Vs satellite altitude

Next
18
Previous
Mobile radio channel characteristics
)()()( trtmtr 0
Where, m(t) is called local mean, also called slow fading, long-term fading, or log-normal fading
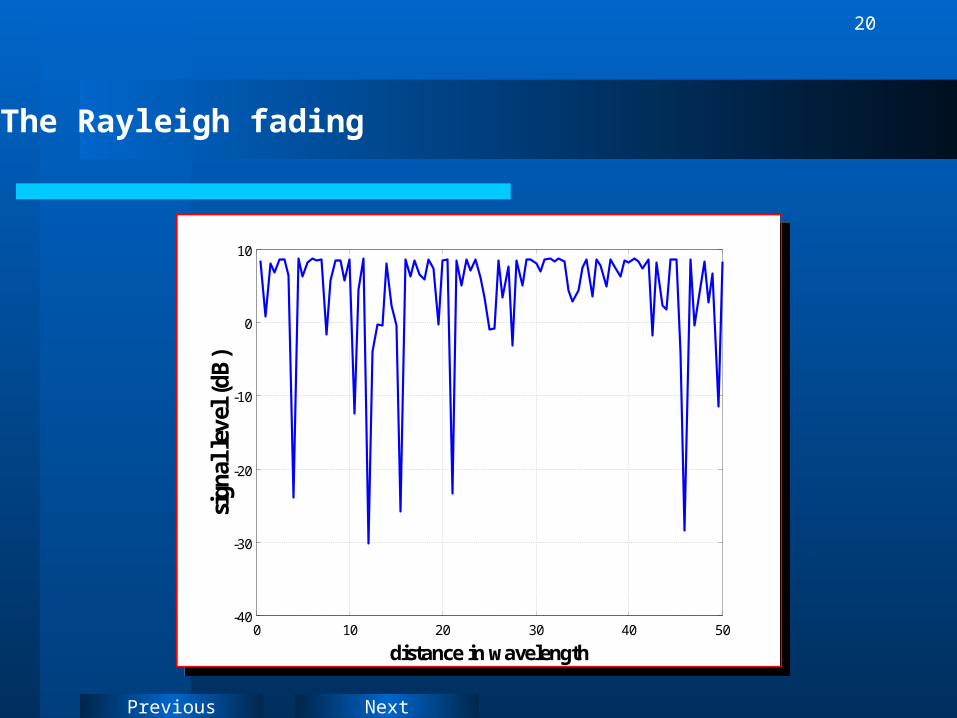
The factor r0 is called multipath fading, short-term fading, or Rayleigh fading
Satellite communicationShort line-of-sight radio links
20 dB/decade path-loss slope
Free space propagation model:
Mobile propagation model: 40 dB/decade path-loss slope
Next
19
Previous
BS antenna
(MS)
Diffracted signal
BS antenna
(MS)
Diffracted signal
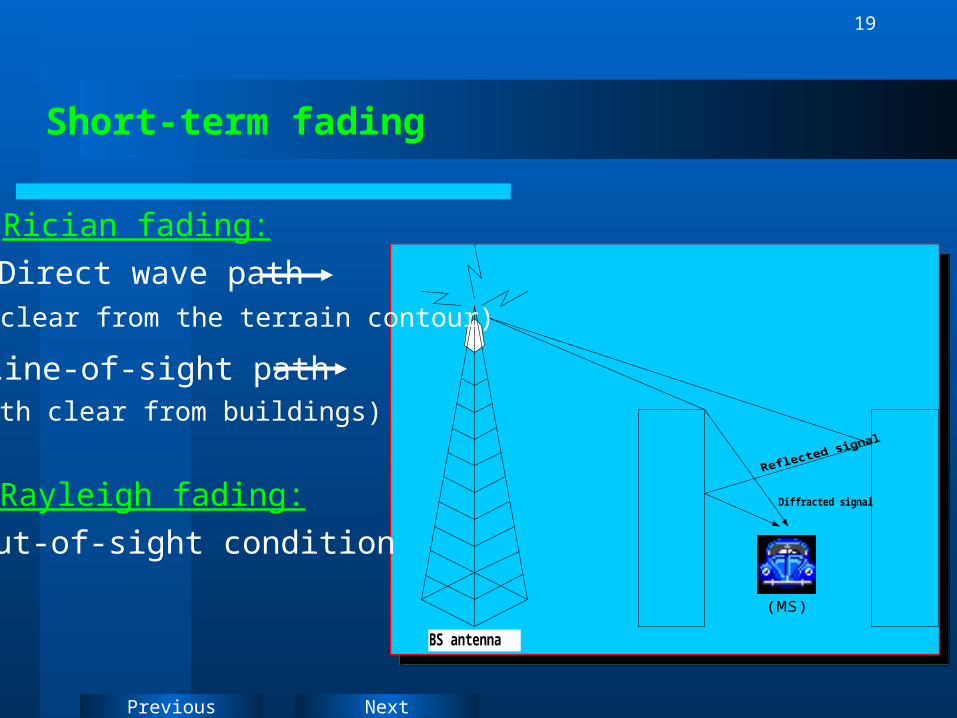
Direct wave path(path clear from the terrain contour)
Line-of-sight path(path clear from buildings)
Short-term fading
Rician fading:
Out-of-sight condition
Rayleigh fading:
Next
20
Previous
0 10 20 30 40 50-40
-30
-20
-10
0
10
distance in wavelength
sign
al le
vel (
dB)
0 10 20 30 40 50-40
-30
-20
-10
0
10
distance in wavelength
sign
al le
vel (
dB)
The Rayleigh fading
Next
21
Previous
MOBILITY MANAGEMENT IN MULTILAYERED
SYSTEMS
MOBILITY MANAGEMENT IN MULTILAYERED
SYSTEMS

Next
22
Previous
Global system design criteria :
Global coverage
Different user’s densities
Handoff priority verification
LEO or GEO satellite constellations
Multilayered system
Different H.O schemes
Next
23
Previous
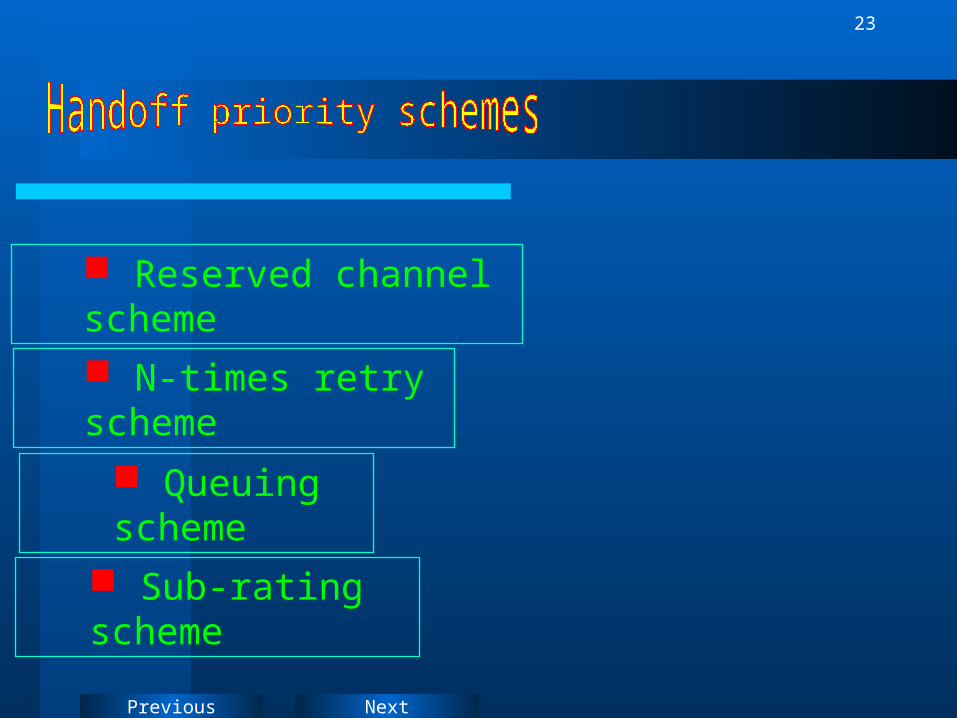
Reserved channel scheme
N-times retry scheme
Queuing scheme
Sub-rating scheme
Next
24
Previous
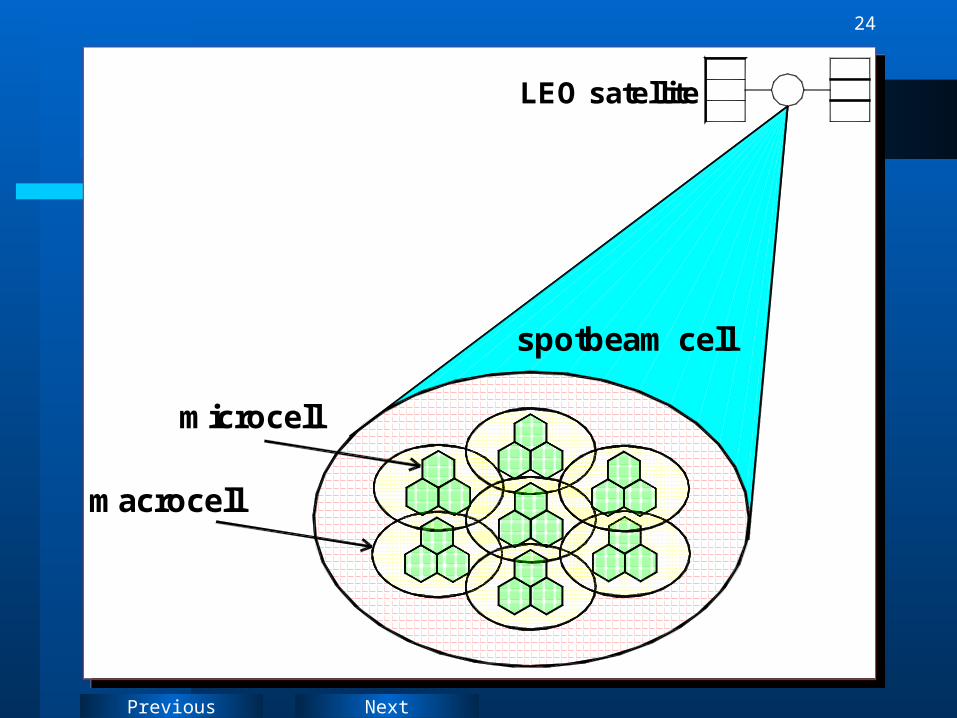
macrocell
microcell
spotbeam cell
LEO satellite
macrocell
microcell
spotbeam cell
LEO satellite
Next
25
Previous
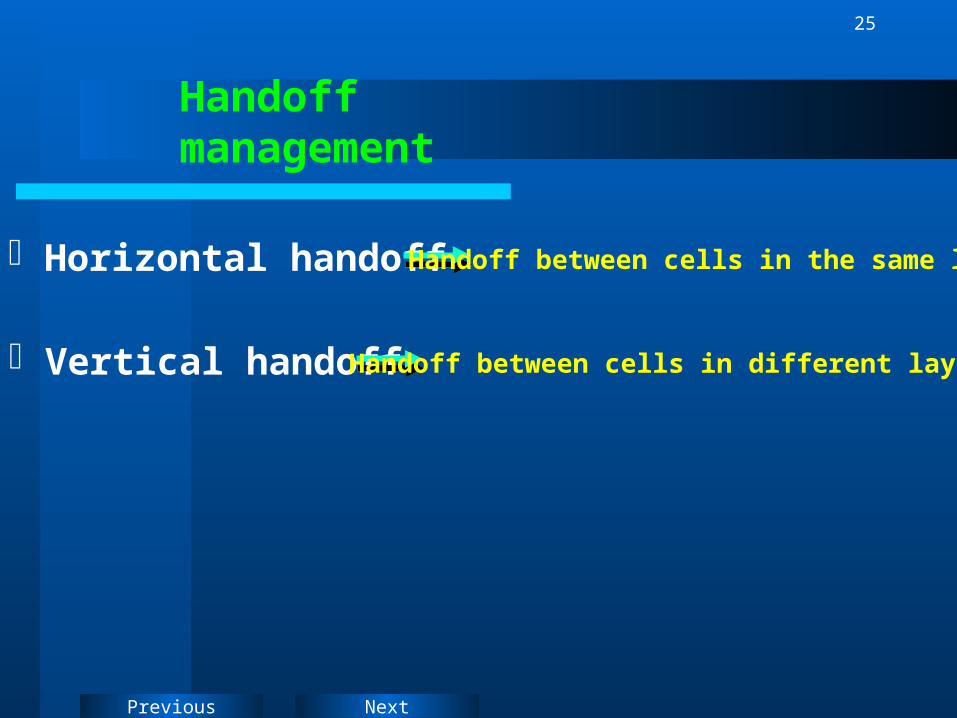
Handoff management
Horizontal handoff
Vertical handoff
Handoff between cells in the same layer
Handoff between cells in different layers
Next
26
Previous
MODELING AN INTEGRATED SPACE/TERRESTRIAL
CELLULARSYSTEM
MODELING AN INTEGRATED SPACE/TERRESTRIAL
CELLULARSYSTEM

Next
27
Previous
Model description :
1 2 C M
Layer-3(Spotbeam cells)
Layer-2(M acrocells)
Layer-1(M icrocells) 1 2 C m
1 2 C M
Layer-3(Spotbeam cells)
Layer-2(M acrocells)
Layer-1(M icrocells) 1 2 C m

Next
28
Previous
New call handling
CallBlocking
Call arrival
Next
29
Previous
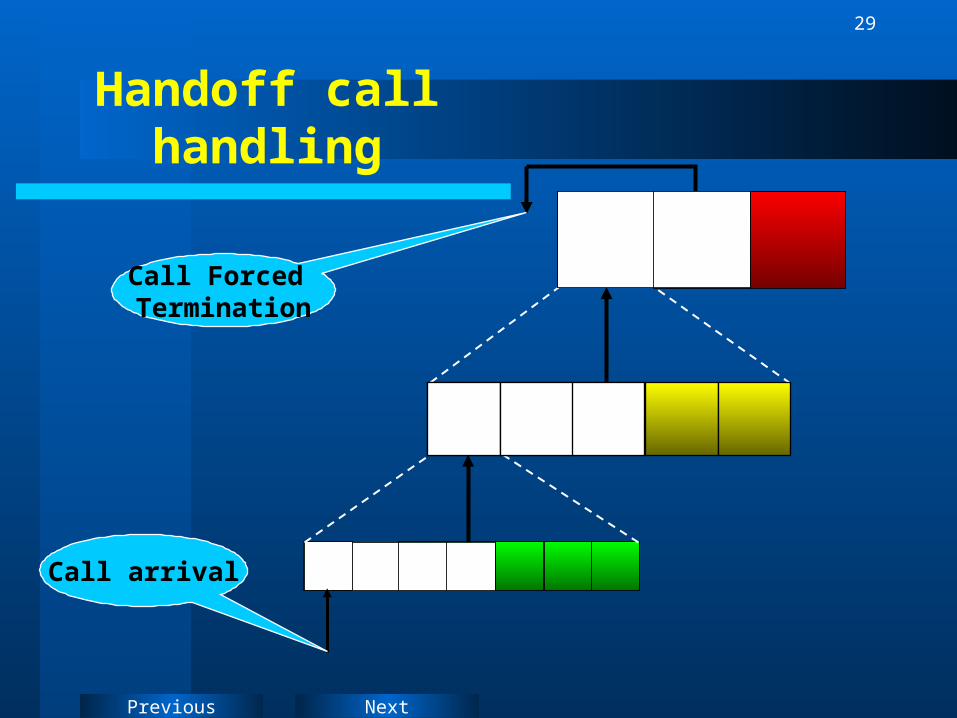
Handoff call handling
Call Forced Termination
Call arrival
Next
30
Previous
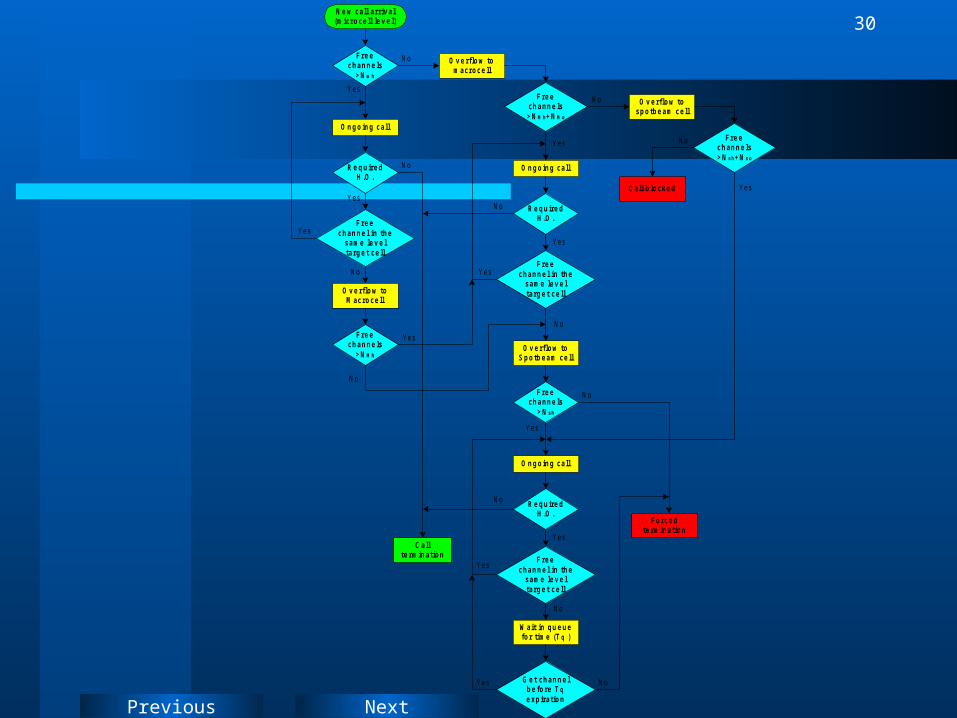
N e w call arr iv al(micro ce ll le v e l)
F re ech an n e ls
> N m h
O n g o in g call
R e q u ire dH .O .
F re ech an n e l in th e
same le v e ltarg e t ce ll
O v e rflo w toM acro ce ll
F re ech an n e ls
> N M h
O n g o in g call
R e q u ire dH .O .
F re ech an n e l in th e
same le v e ltarg e t ce ll
F re ech an n e ls
> N s h
O n g o in g call
R e q u ire dH .O .
F re ech an n e l in th e
same le v e ltarg e t ce ll
W ait in q u e u efo r time (T q )
O v e rflo w toS p o tb e am ce ll
Yes
Yes
C allte rmin atio n
No
YesNo
Yes
No
Yes
No
F re ech an n e ls> N M h+ N M o
O v e rflo w tomacro ce ll
No
Yes
Yes
No
Yes
F re ech an n e ls> N s h+ N s o
O v e rflo w tosp o tb e am ce ll
No
Yes
Yes
No
F o rce dte rmin atio n
Yes
No
C all b lo cke d
No
No
G e t ch an n e lb e fo re T qe xp iratio n
NoYes
Next
31
Previous
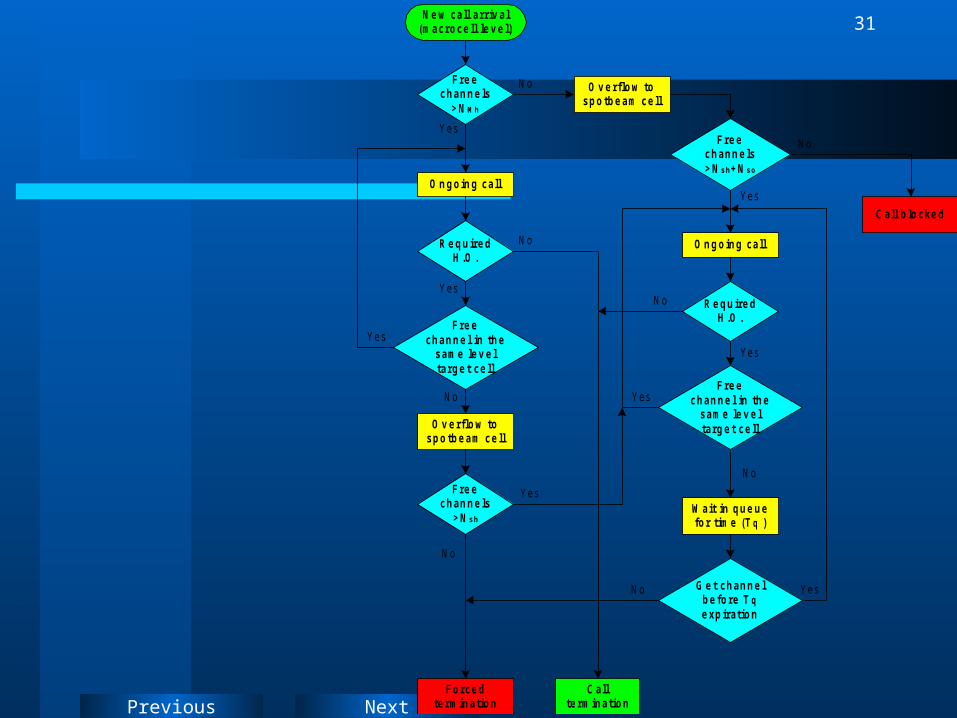
N e w call arr iv al(macro ce ll le v e l)
F re echan n e ls
> N M h
O n g o in g call
R e q u ire dH .O .
F re echan n e l in th e
same le v e ltarg e t ce ll
O v e rflo w tospo tb e am ce ll
F re echan n e ls
> N s h
O n g o in g call
R e q u ire dH .O .
F re echan n e l in th e
same le v e ltarg e t ce ll
Yes
Yes
C allte rmin atio n
No
YesNo
Yes
No
Yes
No
F re echan n e ls> N s h+ N s o
O v e rflo w tospo tb e am ce ll
No
Yes
Yes
No
No
C all b lo cke d
F o rce dte rmin atio n
W ait in q u e u efo r time (T q )
G e t ch an n e lb e fo re T qe xp iratio n
No Yes
Next
32
Previous
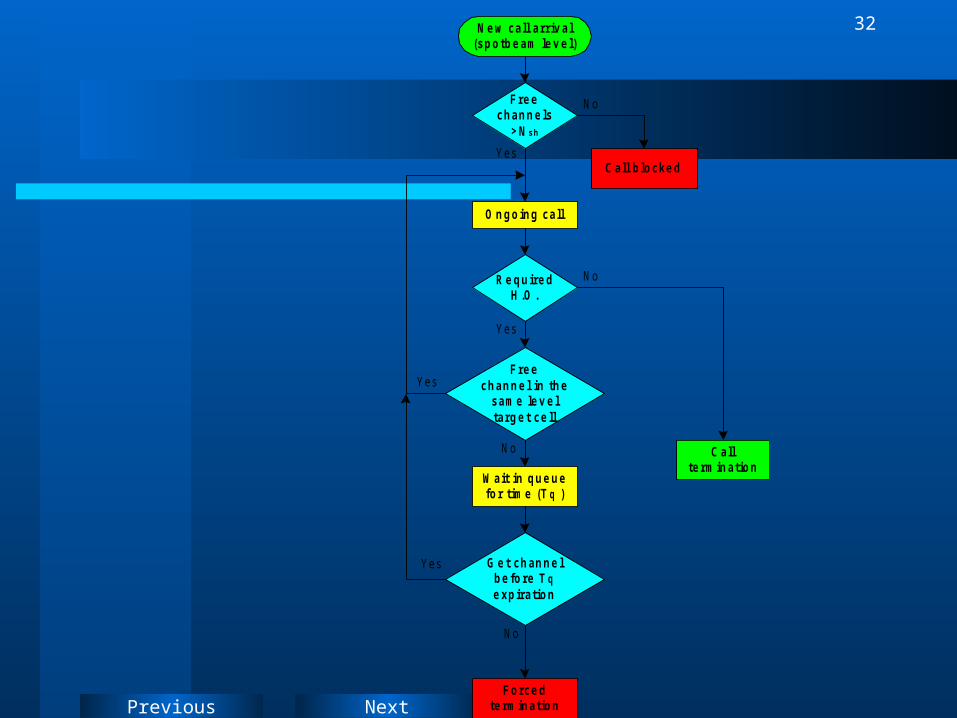
N e w call arr iv al(sp o tb e am le v e l)
F re ech an n e ls
> N s h
O n g o in g call
R e q u ire dH .O .
F re ech an n e l in th e
same le v e ltarg e t ce ll
Yes
Yes
C allte rmin atio n
No
No
Yes
No
No
C all b lo cke d
F o rce dte rmin atio n
W ait in q u e u efo r time (T q )
G e t ch an n e lb e fo re T qe xp iratio n
Yes
Next
33
Previous
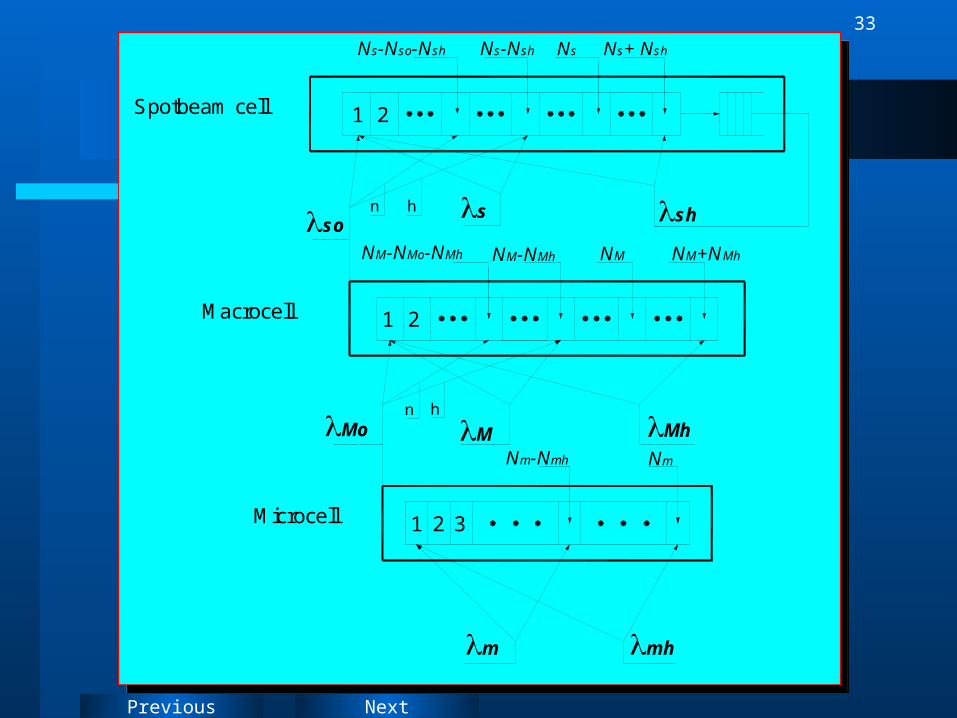
so
Microcell
Macrocell
Spotbeam cell
21
m mh
MMo
21 3
Nm-Nmh
hn
Mh
Nm
sn h
NM-NMo-NMh NM-NMh
1 2
sh
NM+NMhNM
NsNs-Nso-Nsh Ns-Nsh Ns+Nsh
so
Microcell
Macrocell
Spotbeam cell
21
m mh
MMo
21 3
Nm-Nmh
hn
Mh
Nm
sn h
NM-NMo-NMh NM-NMh
1 2
sh
NM+NMhNM
NsNs-Nso-Nsh Ns-Nsh Ns+Nsh
Next
34
Previous
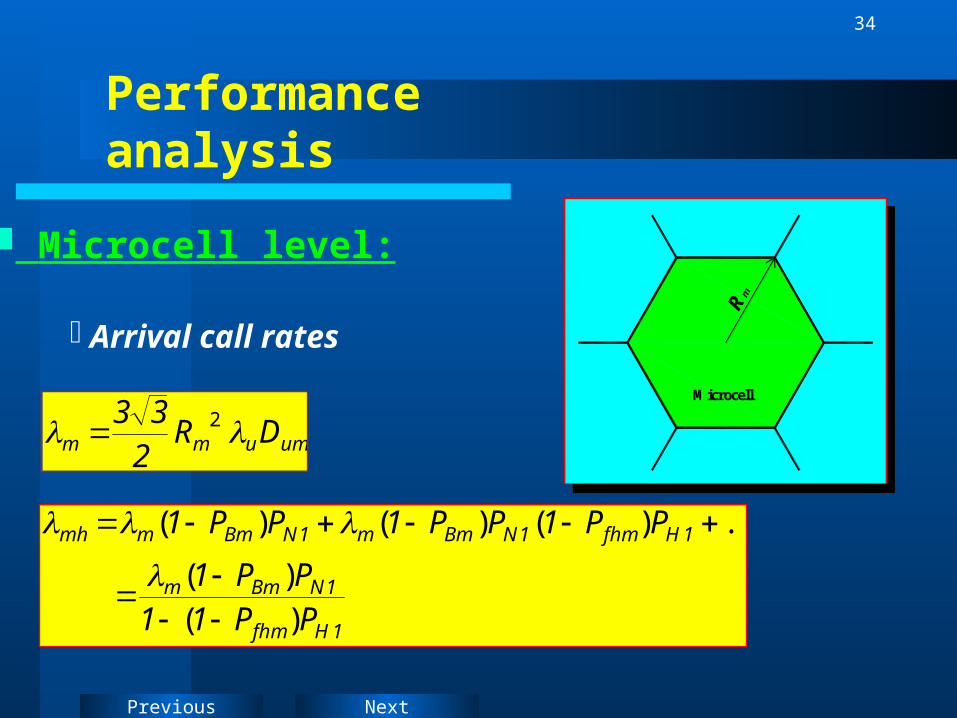
Performance analysis
Microcell level:
Arrival call rates
umumm DR2
33 2
1Hfhm
1NBmm
1Hfhm1NBmm1NBmmmh
PP11
PP1
PP1PP1PP1
)(
)(
...)()()(
RmRm
Microcell
RmRm
Microcell
Next
35
Previous
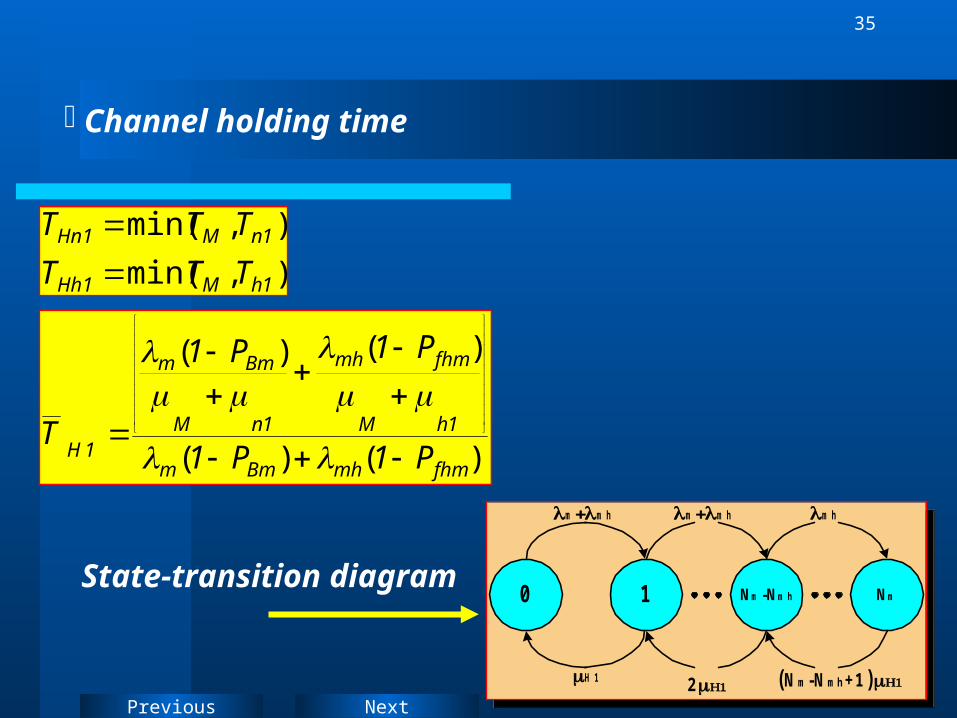
Channel holding time
NmNm -Nm h10
m m h
H 1 2
m h
(N m-N mh+1)
m m h
NmNm -Nm h10
m m h
H 1 2
m h
(N m-N mh+1)
m m h
State-transition diagram
)()(
)()(
fhmmhBmm
1hM
fhmmh
1nM
Bmm
1H P1P1
P1P1
T
),min(
),min(
1hM1Hh
1nM1Hn
TTT
TTT
Next
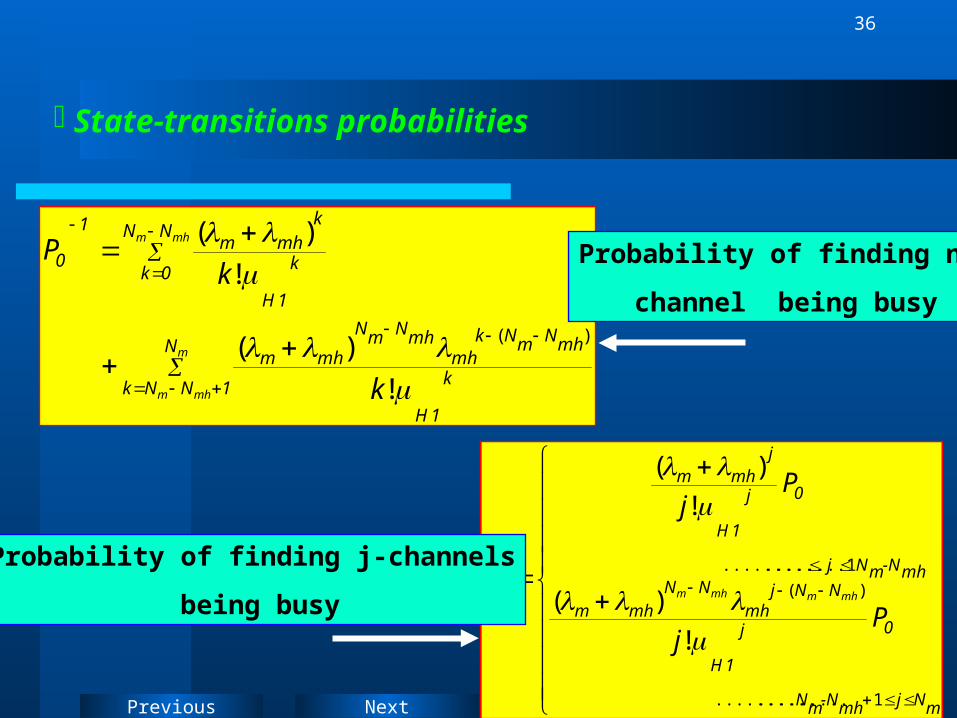
36
Previous
m
mhm
mhm
N
1NNkk
1H
mhNmNkmh
mhNmN
mhm
NN
0kk
1H
kmhm
1
0
k
kP
!
)(
!
)(
)(
mNjmh-NmN
0j
1H
NNjmh
NNmhm
mh-NmNj
0j
1H
jmhm
j
Pj
Pj
Pmhmmhm
1 ...................
)(
........1..........
!
)(
!
)(
Probability of finding j-channels
being busy
Probability of finding no
channel being busy
State-transitions probabilities

Next
37
Previous
Performance measures
m
mhm
N
NNjjBm PP
mNfhm PP
mBmmMon CP
mfhmmhMoh CP
MohMonMo
Next
38
Previous
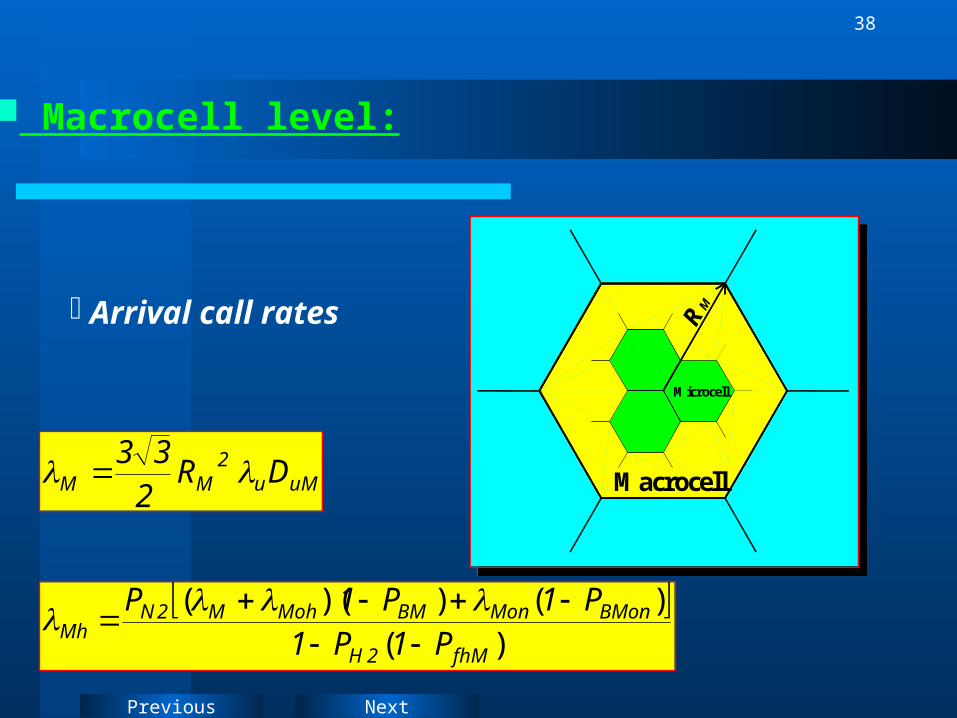
Macrocell level:
Arrival call rates
Macrocell
Microcell
RM
Macrocell
Microcell
RM
)(
)())((
fhM2H
BMonMonBMMohM2NMh P1P1
P1P1P
uMu2
MM DR2
33
Next
39
Previous
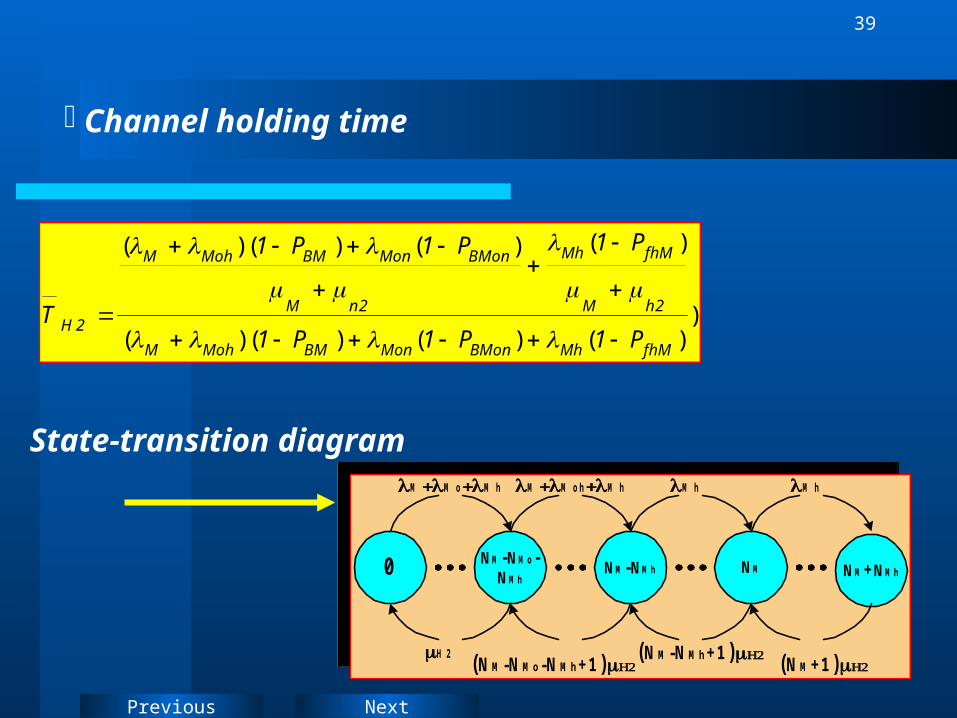
Channel holding time
State-transition diagram
NMNM -NM hNM -NM o-
NM h0 NM +NM h
M M oM h
H 2
M M o hM h M h M h
(N M -N M h+1)(N M -N M o-N M h+1) (N M +1)
NMNM -NM hNM -NM o-
NM h0 NM +NM h
M M oM h
H 2
M M o hM h M h M h
(N M -N M h+1)(N M -N M o-N M h+1) (N M +1)
))()()( )(
)()()( )(
fhMMhBMonMonBMMohM
2hM
fhMMh
2nM
BMonMonBMMohM
2HP1P1P1
P1P1P1
T

Next
40
Previous
Performance measures
MhM
MhMoM
NN
NNNjjBMon PP
MhM
MhM
NN
NNjjBMohBM PPP
MhM NNfhM PP
sohsonso
MBMonMonBMMson CPP )(
MBMohMohfhMMhsoh CPP )(
Next
41
Previous
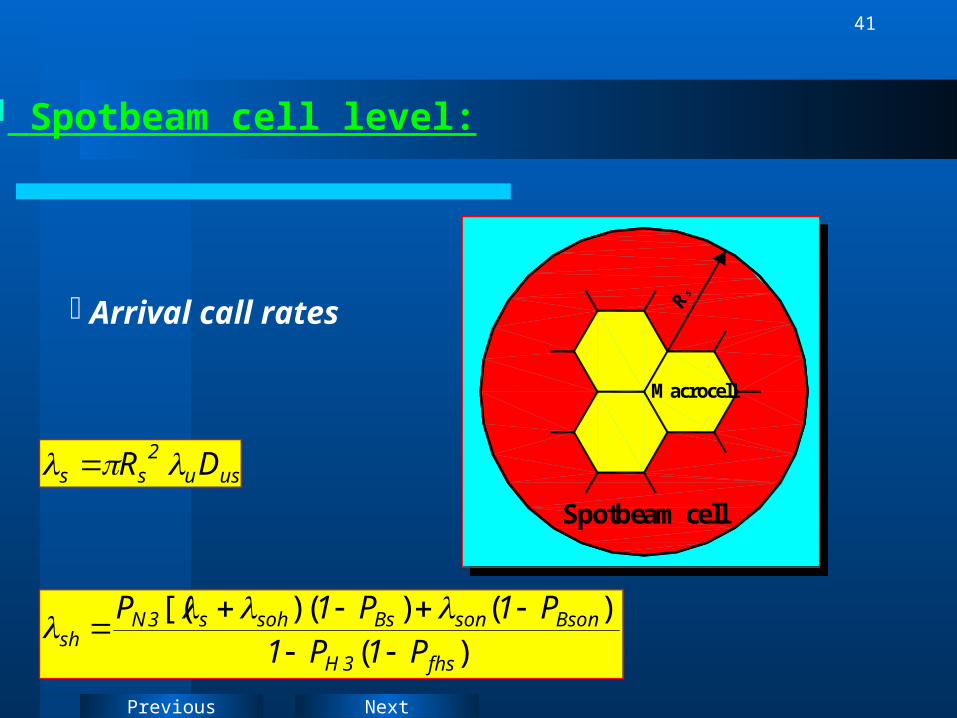
Spotbeam cell level:
Arrival call rates
Spotbeam cell
Macrocell
Rs
Spotbeam cell
Macrocell
Rs
)(
)]()( )[(
fhs3H
BsonsonBssohs3Nsh P1P1
P1P1P
usu2
ss DR

Next
42
Previous
Channel holding time
State-transition diagram
NsNs-NshNs-Nso-
Nsh0 Ns+Nsh
ss os h
H 3
ss o hs h s h s h s h
(N s-N so-N sh+1)(N s-N sh+1)(N s+1)
(N s+N sh)+q
NsNs-NshNs-Nso-
Nsh0 Ns+Nsh
ss os h
H 3
ss o hs h s h s h s h
(N s-N so-N sh+1)(N s-N sh+1)(N s+1)
(N s+N sh)+q
)()()( )(
)()()( )(
fhsshBsonsonBssohs
3hM
fhssh
3nM
BsonsonBssohs
3H PPP
PPP
T111
111

Next
43
Previous
Performance measures
shs NNjjBsohBs PPP
shsos NNNjjBson PP
)()()(
)(
shNk
1i
i
q3H
shs
q
q3H
shs
3Hshs
21
NN1
NN
NN1fhskP
sh
sNk
fhskkNfhs PPP

Next
44
Previous
Users classification
Terrestrial-only users, who access only the terrestrial
subnetwork at the microcell and macrocell layers.
Satellite-only users, with access only to the satellite sub network.
Dual-mode users using dual-mode telephone sets, to enable them to access both the terrestrial and the satellite sub network.
Next
45
Previous
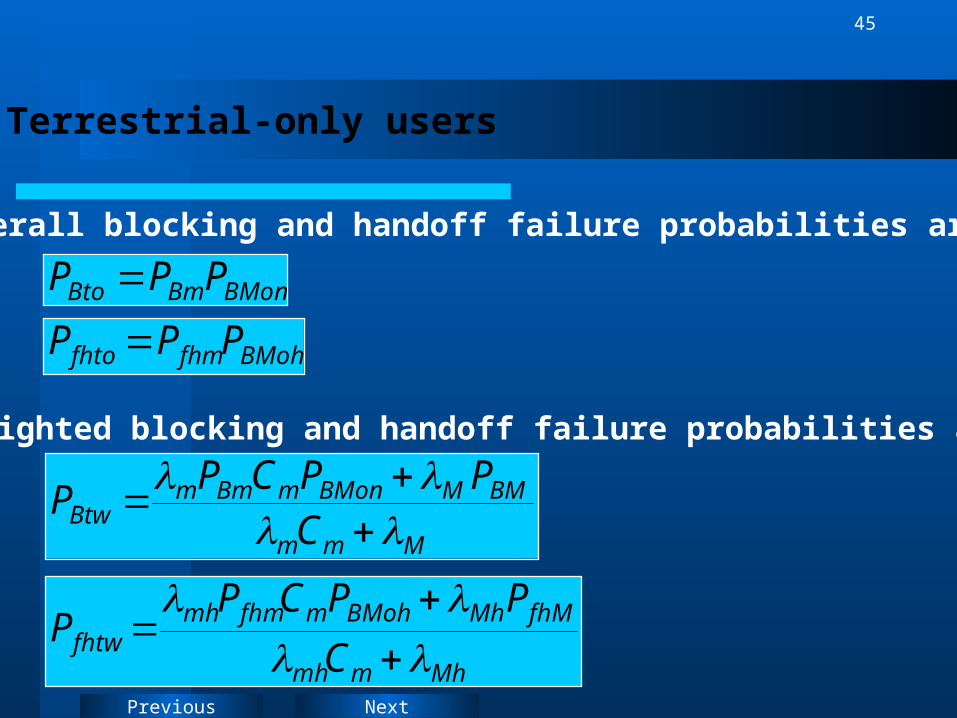
Terrestrial-only users
The overall blocking and handoff failure probabilities are:
BMonBmBto PPP
BMohfhmfhto PPP
The weighted blocking and handoff failure probabilities are:
Mhmmh
fhMMhBMohmfhmmhfhtw C
PPCPP
Mmm
BMMBMonmBmmBtw C
PPCPP
Next
46
Previous
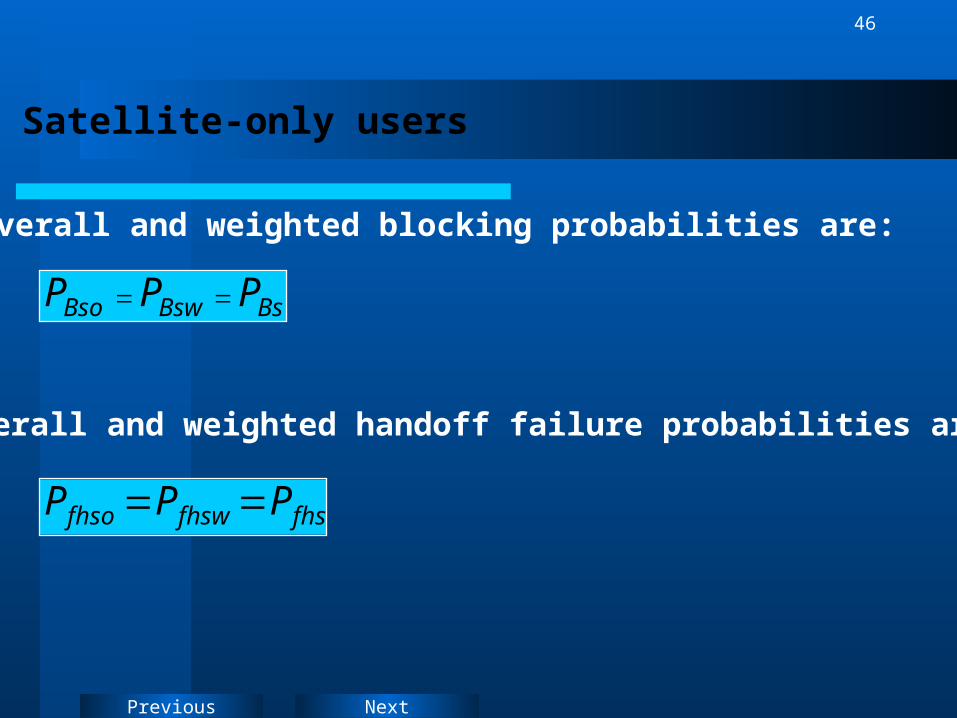
Satellite-only users
The overall and weighted blocking probabilities are:
BsBswBso PPP
fhsfhswfhso PPP
The overall and weighted handoff failure probabilities are:
Next
47
Previous
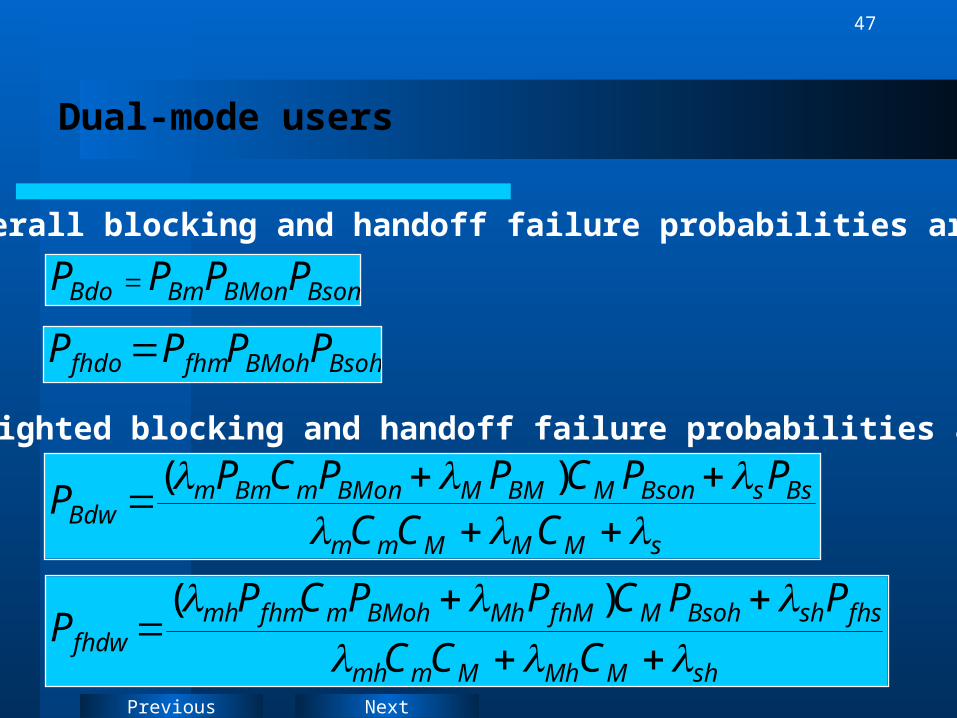
Dual-mode users
The overall blocking and handoff failure probabilities are:
The weighted blocking and handoff failure probabilities are:
BsonBMonBmBdo PPPP
BsohBMohfhmfhdo PPPP
sMMMmm
BssBsonMBMMBMonmBmmBdw CCC
PPCPPCPP
)(
shMMhMmmh
fhsshBsohMfhMMhBMohmfhmmhfhdw CCC
PPCPPCPP
)(
Next
48
Previous
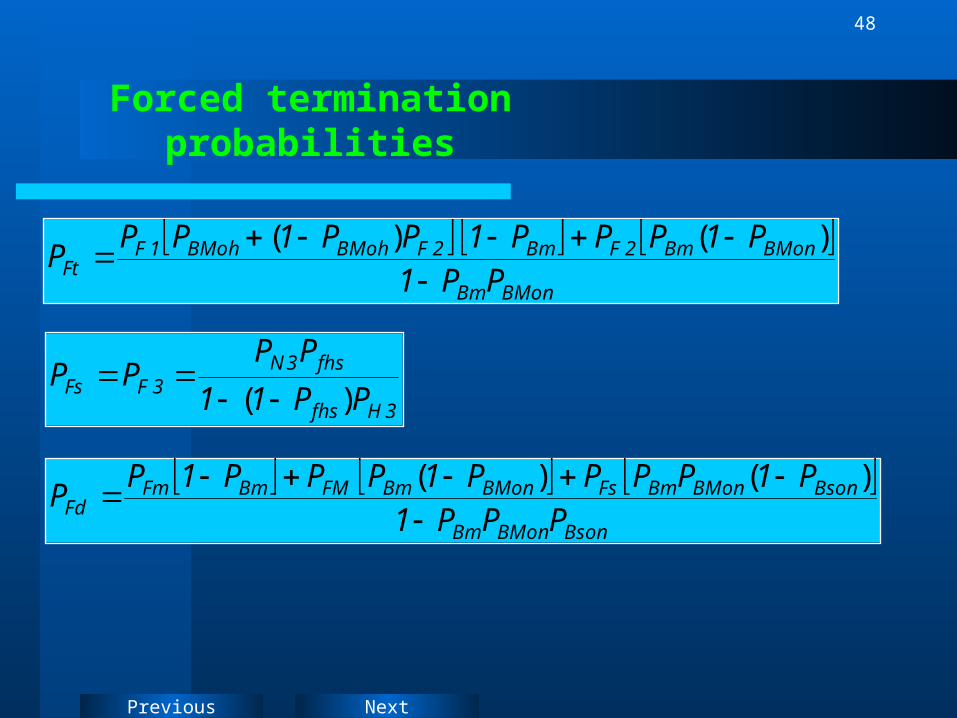
Forced termination probabilities
3Hfhs
fhs3N3FFs PP11
PPPP
)(
BMonBm
BMonBm2FBm2FBMohBMoh1FFt PP1
P1PPP1PP1PPP
)( )(
BsonBMonBm
BsonBMonBmFsBMonBmFMBmFmFd PPP1
P1PPPP1PPP1PP
)()(

Next
49
Previous
Noncompleted call probabilities
)( BtoFtBtonct P1PPP
)( BsFsBsncs P1PPP
)( BdoFdBdoncd P1PPP
Next
50
Previous
Results and discussionResults and discussion

Next
51
Previous
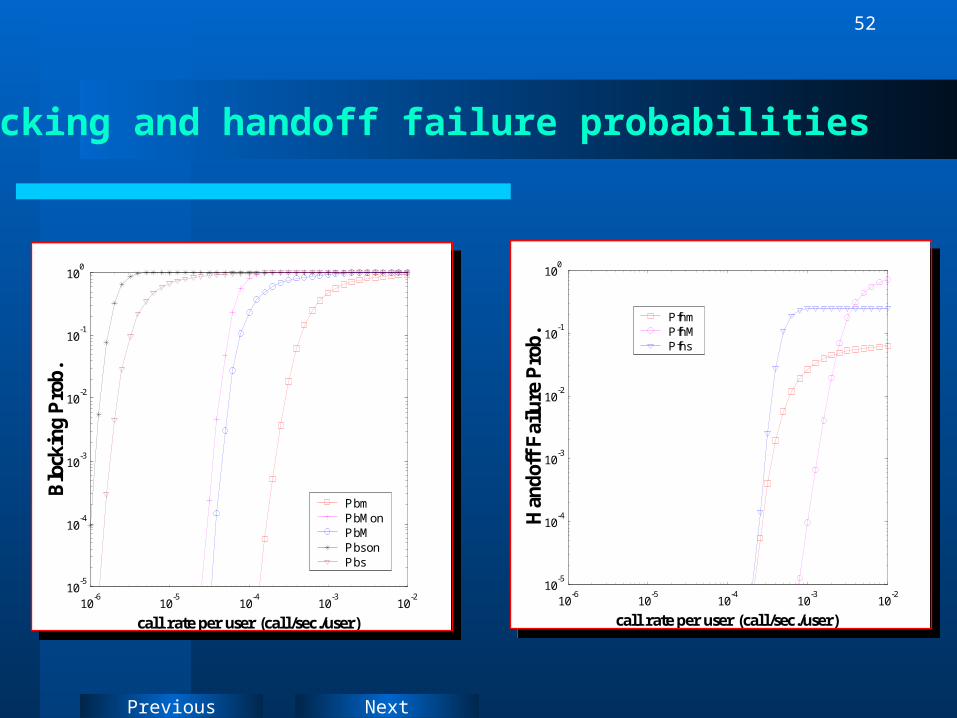
Numerical results
Rm=1km., RM=5km., Rs=70km.,
Cm=10, CM=30, Nm=16, Nmh=2,
NM=32, NMo=4, NMh=4, Ns=56,
Nso=7, Nsh=7, Dum=100 user/km2,
DuM=40 user/km2, Dus=6 user/km2,
TM=120s, , Vmax1=40 km./hr.
Vmax2=90 km./hr. Vmax3=120 km./hr.
10TT 3Hq /
Next
52
Previous
10-6
10-5
10-4
10-3
10-2
10-5
10-4
10-3
10-2
10-1
100
call rate per user (call/sec./user)
Blo
ckin
g P
rob.
Pbm PbMonPbM PbsonPbs
10-6
10-5
10-4
10-3
10-2
10-5
10-4
10-3
10-2
10-1
100
call rate per user (call/sec./user)
Blo
ckin
g P
rob.
Pbm PbMonPbM PbsonPbs
Blocking and handoff failure probabilities
10-6
10-5
10-4
10-3
10-2
10-5
10-4
10-3
10-2
10-1
100
call rate per user (call/sec./user)
Han
dof
f F
ailu
re P
rob.
PfhmPfhMPfhs
10-6
10-5
10-4
10-3
10-2
10-5
10-4
10-3
10-2
10-1
100
call rate per user (call/sec./user)
Han
dof
f F
ailu
re P
rob.
PfhmPfhMPfhs

Next
53
Previous
Overall blocking and handoff failure probabilities
10-6
10-5
10-4
10-3
10-2
10-5
10-4
10-3
10-2
10-1
100
call rate per user (call/sec./user)
Ov
eral
l B
lock
ing
Pro
b.
PbdoPbtoPbso
10-6
10-5
10-4
10-3
10-2
10-5
10-4
10-3
10-2
10-1
100
call rate per user (call/sec./user)
Ov
eral
l B
lock
ing
Pro
b.
PbdoPbtoPbso
10-6
10-5
10-4
10-3
10-2
10-5
10-4
10-3
10-2
10-1
100
call rate per user (call/sec./user)
Ove
rall
Han
doff
Fai
lure
Pro
b.PfhdoPfhtoPfhso
10-6
10-5
10-4
10-3
10-2
10-5
10-4
10-3
10-2
10-1
100
call rate per user (call/sec./user)
Ove
rall
Han
doff
Fai
lure
Pro
b.PfhdoPfhtoPfhso

Next
54
Previous
10-6
10-5
10-4
10-3
10-2
10-5
10-4
10-3
10-2
10-1
100
call rate per user (call/sec./user)
Wei
ghte
d H
ando
ff F
ailu
re P
rob.
PfhdwPfhtwPfhsw
10-6
10-5
10-4
10-3
10-2
10-5
10-4
10-3
10-2
10-1
100
call rate per user (call/sec./user)
Wei
ghte
d H
ando
ff F
ailu
re P
rob.
PfhdwPfhtwPfhsw
10-6
10-5
10-4
10-3
10-2
10-5
10-4
10-3
10-2
10-1
100
call rate per user (call/sec./user)
Wei
ghte
d B
lock
ing
Pro
b.
PbdwPbtwPbsw
10-6
10-5
10-4
10-3
10-2
10-5
10-4
10-3
10-2
10-1
100
call rate per user (call/sec./user)
Wei
ghte
d B
lock
ing
Pro
b.
PbdwPbtwPbsw
Weighted blocking and handoff failure probabilities

Next
55
Previous
10-6
10-5
10-4
10-3
10-2
10-5
10-4
10-3
10-2
10-1
100
call rate per user (call/sec./user)
Ov
eral
l Fo
rced
Ter
min
atio
n P
rob
.
PFdPFtPFs
10-6
10-5
10-4
10-3
10-2
10-5
10-4
10-3
10-2
10-1
100
call rate per user (call/sec./user)
Ov
eral
l Fo
rced
Ter
min
atio
n P
rob
.
PFdPFtPFs
10-6
10-5
10-4
10-3
10-2
10-5
10-4
10-3
10-2
10-1
100
call rate per user (call/sec./user)
Ove
rall
Non
com
plet
ed c
all P
rob.
PncdPnctPncs
10-6
10-5
10-4
10-3
10-2
10-5
10-4
10-3
10-2
10-1
100
call rate per user (call/sec./user)
Ove
rall
Non
com
plet
ed c
all P
rob.
PncdPnctPncs
Overall forced termination and noncompleted probabilities
Next
56
Previous
10-5
10-4
10-3
10-2
10-5
10-4
10-3
10-2
10-1
100
call rate per user (call/sec./user)
Han
doff
Fai
lure
Pro
b.
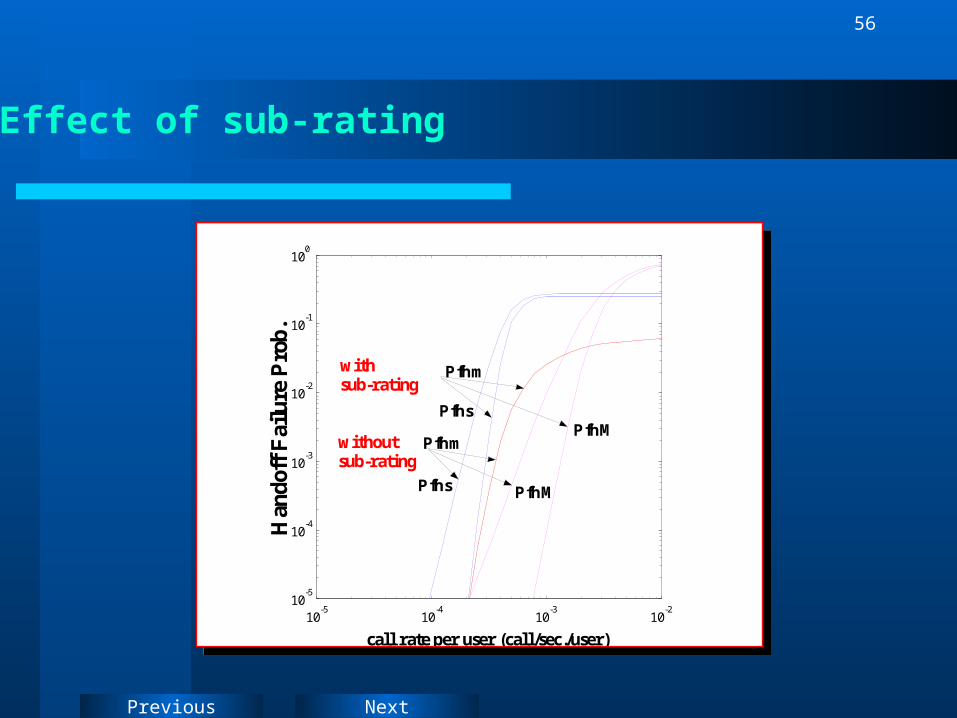
with sub-rating
without sub-rating
Pfhs PfhM
Pfhm
Pfhm
PfhM Pfhs
10-5
10-4
10-3
10-2
10-5
10-4
10-3
10-2
10-1
100
call rate per user (call/sec./user)
Han
doff
Fai
lure
Pro
b.
with sub-rating
without sub-rating
Pfhs PfhM
Pfhm
Pfhm
PfhM Pfhs
Effect of sub-rating

Next
57
Previous
10-5
10-4
10-3
10-2
10-5
10-4
10-3
10-2
10-1
100
call rate per user (call/sec./user)
Blo
ckin
g an
d H
.O. f
ailu
re p
rob.
Effect of RCS
Blocking:
Nmh=5 3 1
H.O. failure:Nmh=1
Nmh=3
Nmh=5
10-5
10-4
10-3
10-2
10-5
10-4
10-3
10-2
10-1
100
call rate per user (call/sec./user)
Blo
ckin
g an
d H
.O. f
ailu
re p
rob.
Effect of RCS
Blocking:
Nmh=5 3 1
H.O. failure:Nmh=1
Nmh=3
Nmh=5
10-5
10-4
10-3
10-2
10-5
10-4
10-3
10-2
10-1
100
call rate per user (call/sec./user)
Blo
ckin
g an
d H
.O. F
ailu
re P
rob.
Effect of RCS & SRS
Blocking:
NMh=5 3 1
H.O. failure:
NMh=1 3 5
10-5
10-4
10-3
10-2
10-5
10-4
10-3
10-2
10-1
100
call rate per user (call/sec./user)
Blo
ckin
g an
d H
.O. F
ailu
re P
rob.
Effect of RCS & SRS
Blocking:
NMh=5 3 1
H.O. failure:
NMh=1 3 5
Effect of RCS and SRS
Next
58
Previous
10-6
10-5
10-4
10-3
10-2
10-5
10-4
10-3
10-2
10-1
100
call rate per user (call/sec./user)
Blo
ckin
g an
d H
.O. f
ailu
re P
rob.
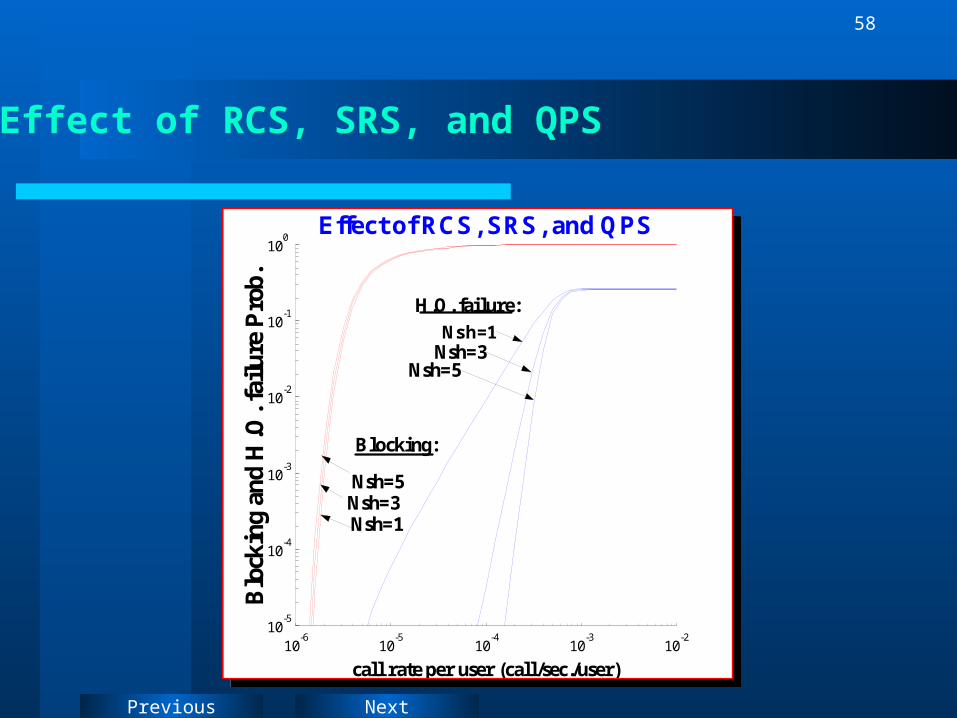
Effect of RCS, SRS, and QPS
Blocking:
H.O. failure:
Nsh=5 Nsh=3 Nsh=1
Nsh=1 Nsh=3
Nsh=5
10-6
10-5
10-4
10-3
10-2
10-5
10-4
10-3
10-2
10-1
100
call rate per user (call/sec./user)
Blo
ckin
g an
d H
.O. f
ailu
re P
rob.
Effect of RCS, SRS, and QPS
Blocking:
H.O. failure:
Nsh=5 Nsh=3 Nsh=1
Nsh=1 Nsh=3
Nsh=5
Effect of RCS, SRS, and QPS

Next
59
Previous
10-5
10-4
10-3
10-2
10-5
10-4
10-3
10-2
10-1
100
call rate per user (call/sec./user)
H.O
. fai
lure
Pro
b.
Effect of varying (Cm=5, 10, & 15)
Pfhm
PfhM Pfhs
Cm=5
Cm=10
Cm=15
10-5
10-4
10-3
10-2
10-5
10-4
10-3
10-2
10-1
100
call rate per user (call/sec./user)
H.O
. fai
lure
Pro
b.
Effect of varying (Cm=5, 10, & 15)
Pfhm
PfhM Pfhs
Cm=5
Cm=10
Cm=15
10-6
10-5
10-4
10-3
10-2
10-5
10-4
10-3
10-2
10-1
100
call rate per user (call/sec./user)
Blo
ckin
g P
rob.
Effect of varing (Cm=5, 10, & 15)
Pbm
(Cm=5, 10, & 15)
PbM Cm=5
Pbs
10 15
10-6
10-5
10-4
10-3
10-2
10-5
10-4
10-3
10-2
10-1
100
call rate per user (call/sec./user)
Blo
ckin
g P
rob.
Effect of varing (Cm=5, 10, & 15)
Pbm
(Cm=5, 10, & 15)
PbM Cm=5
Pbs
10 15
Effect of varying Cm

Next
60
Previous
10-6
10-5
10-4
10-3
10-2
10-5
10-4
10-3
10-2
10-1
100
call rate per user (call/sec./user)
Blo
ckin
g P
rob.
Effect of varing (CM=20, 30, & 40)
Pbm PbM Pbs
(CM=20, 30, & 40)
CM=20
30 40
10-6
10-5
10-4
10-3
10-2
10-5
10-4
10-3
10-2
10-1
100
call rate per user (call/sec./user)
Blo
ckin
g P
rob.
Effect of varing (CM=20, 30, & 40)
Pbm PbM Pbs
(CM=20, 30, & 40)
CM=20
30 40
10-5
10-4
10-3
10-2
10-5
10-4
10-3
10-2
10-1
100
call rate per user (call/sec./user)
H.O
. fai
lure
Pro
b.
Effect of varying (CM=20, 30, & 40)
Pfhm PfhM Pfhs
CM=20 30 40
10-5
10-4
10-3
10-2
10-5
10-4
10-3
10-2
10-1
100
call rate per user (call/sec./user)
H.O
. fai
lure
Pro
b.
Effect of varying (CM=20, 30, & 40)
Pfhm PfhM Pfhs
CM=20 30 40
Effect of varying CM

Next
61
Previous
10-6
10-5
10-4
10-3
10-2
10-5
10-4
10-3
10-2
10-1
100
call rate per user (call/sec./user)
Blo
ckin
g &
H.O
fai
lure
Pro
b.
Effect of Queue (Nsh=0)
Pbs Pfhs
10-6
10-5
10-4
10-3
10-2
10-5
10-4
10-3
10-2
10-1
100
call rate per user (call/sec./user)
Blo
ckin
g &
H.O
fai
lure
Pro
b.
Effect of Queue (Nsh=0)
Pbs Pfhs
10-4
10-3
10-2
10-4
10-3
10-2
10-1
100
call rate per user (call/sec./user)
Pfh
s(Tq=TH3/2)(Tq=TH3/4)(Tq=TH3/6)
Effect of Tq
10-4
10-3
10-2
10-4
10-3
10-2
10-1
100
call rate per user (call/sec./user)
Pfh
s(Tq=TH3/2)(Tq=TH3/4)(Tq=TH3/6)
Effect of Tq
Effect of infinite queue and Tq
Next
62
Previous
MIXING VOICE AND DATA SERVICES
(SERVICE INTEGRATION)
MIXING VOICE AND DATA SERVICES
(SERVICE INTEGRATION)

Next
63
Previous
shv+sond+sohd
+sd+shd
Mond+Mohd
+Md+Mhd
Monv
Microcell
Macrocell
mv+md+mhd mhv
Nm-NmhMohv+Mv
21 3
1 2
Mhv
Nm
sonv
Spotbeam cell
Ns-Nsh
NM-NMhNM-NMo-NMh
sohv
Ns-Nso-Nsh
21
sv
NM NM+P
Ns
shv+sond+sohd
+sd+shd
Mond+Mohd
+Md+Mhd
Monv
Microcell
Macrocell
mv+md+mhd mhv
Nm-NmhMohv+Mv
21 3
1 2
Mhv
Nm
sonv
Spotbeam cell
Ns-Nsh
NM-NMhNM-NMo-NMh
sohv
Ns-Nso-Nsh
21
sv
NM NM+P
Ns
Next
64
Previous
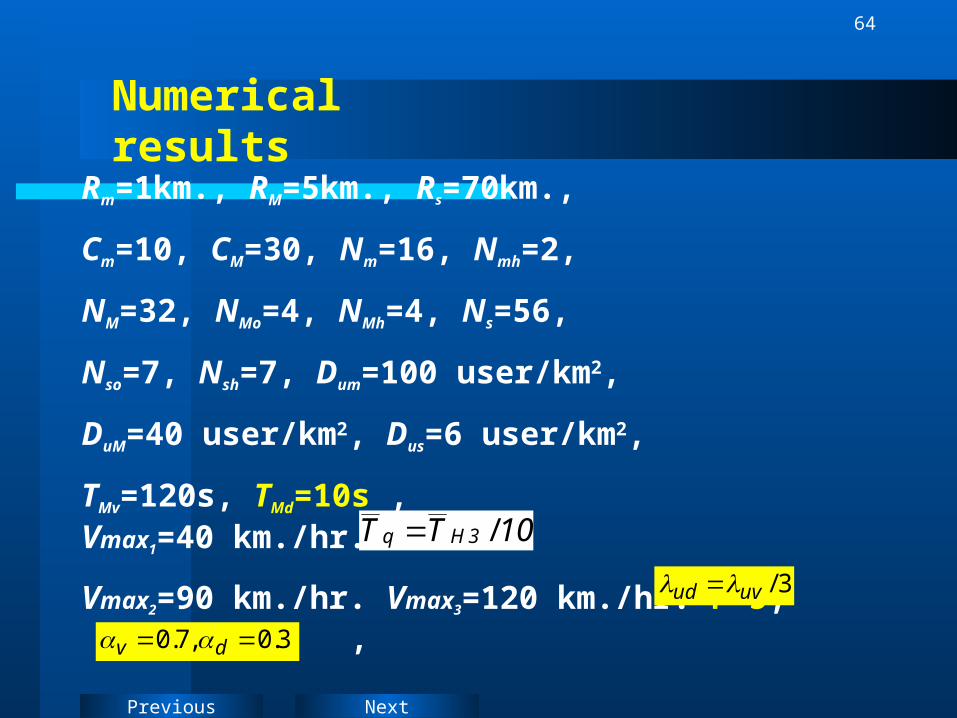
Numerical results
Rm=1km., RM=5km., Rs=70km.,
Cm=10, CM=30, Nm=16, Nmh=2,
NM=32, NMo=4, NMh=4, Ns=56,
Nso=7, Nsh=7, Dum=100 user/km2,
DuM=40 user/km2, Dus=6 user/km2,
TMv=120s, TMd=10s , Vmax1=40 km./hr.
Vmax2=90 km./hr. Vmax3=120 km./hr. P=5, ,
10TT 3Hq /
3.0 ,7.0 dv
3/uvud
Next
65
Previous
10-6
10-5
10-4
10-3
10-2
10-10
10-8
10-6
10-4
10-2
100
voice call rate per user (call/sec./user)
Mic
roce
ll B
lock
ing
Pro
b.
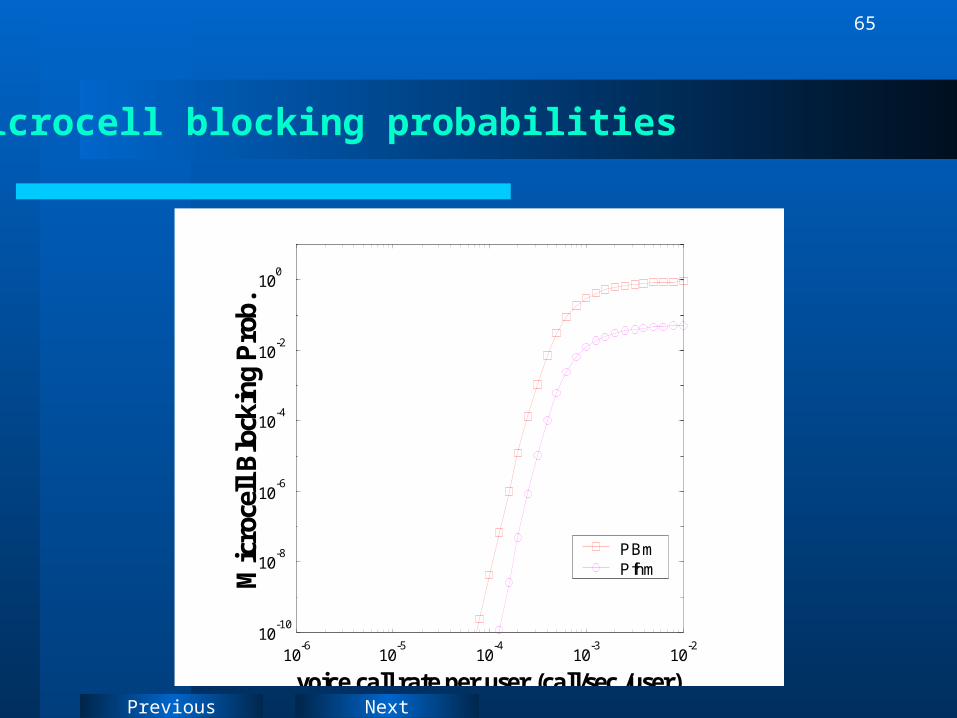
PBm Pfhm
Microcell blocking probabilities

Next
66
Previous
Macrocell blocking probabilities
10-6
10-5
10-4
10-3
10-2
10-10
10-8
10-6
10-4
10-2
100
voice call rate per user (call/sec./user)
Mac
roce
ll B
lock
ing
Pro
b.
PBMonvPBMv PfhMv PtnMd PthMd

Next
67
Previous
Spotbeam cell blocking probabilities
10-6
10-5
10-4
10-3
10-10
10-8
10-6
10-4
10-2
100
call rate per user (call/sec./user)
Spot
beam
cel
l Blo
ckin
g P
rob.
PBsonvPBsohvPBsv Pfhsv Ptnsd Pthsd
Next
68
Previous
CONCLUSIONCONCLUSION
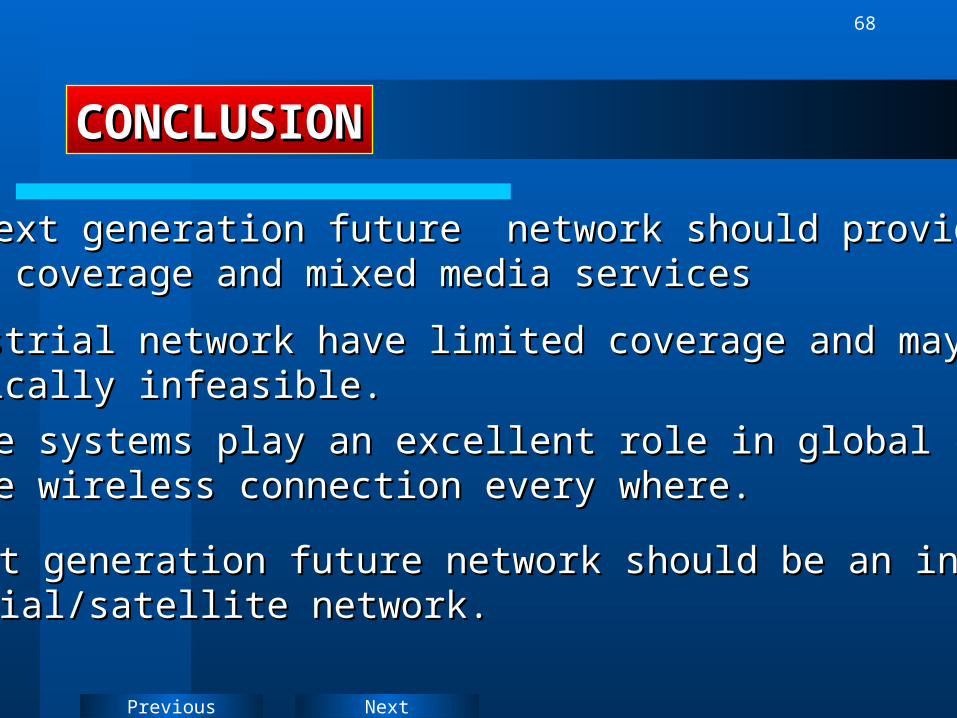
•Satellite systems play an excellent role in global coverage \Satellite systems play an excellent role in global coverage \To provide wireless connection every where. To provide wireless connection every where.
•The next generation future network should provideThe next generation future network should provideglobal coverage and mixed media servicesglobal coverage and mixed media services
•Terrestrial network have limited coverage and may be Terrestrial network have limited coverage and may be economically infeasible. economically infeasible.
•The next generation future network should be an integrated The next generation future network should be an integrated terrestrial/satellite network.terrestrial/satellite network.

Next
69
Previous
•Handling the traffic load in this multilayer network need an Handling the traffic load in this multilayer network need an intelligent protocol architecture. intelligent protocol architecture.
•Varieties of handoff priority schemes were proposed in Varieties of handoff priority schemes were proposed in order to improve the performance of the systemorder to improve the performance of the system ..
• The presented analysis will help network designers to The presented analysis will help network designers to implement the future global network based on sound concepts. implement the future global network based on sound concepts.
• Both data and voice services are integrated over the Both data and voice services are integrated over the integrated proposed model to handle different user types.integrated proposed model to handle different user types.

Next
70
Previous
FUTUREFUTURE WORKWORK
SoftwareSoftware radioradio
Software radio is a wireless communications device in which some
or all of the physical layer functions are implemented in software
Next
71
Previous
Thank YouThank You


