238

This page intentionally left blank.
Doc# E154701 iElectro Industries/GaugeTechThe Leader In Power Monitoring and Smart Grid SolutionsElectro Industries/GaugeTechThe Leader In Power Monitoring and Smart Grid Solutions
Nexus® 1500 Meter Installation and Operation Manual Version 1.10
Published by:
Electro Industries/GaugeTech
1800 Shames Drive
Westbury, NY 11590
All rights reserved. No part of this publication may be reproduced or transmitted in
any form or by any means, electronic or mechanical, including photocopying, record-
ing, or information storage or retrieval systems or any future forms of duplication, for
any purpose other than the purchaser's use, without the expressed written permission
of Electro Industries/GaugeTech.
© 2014 Electro Industries/GaugeTech
Nexus® is a registered trademark of Electro Industries/GaugeTech. The distinctive
shape, style and overall appearance of the Nexus® 1500 meter is a trademark of
Electro Industries/GaugeTech. Communicator EXTTM is a trademark of Electro Indus-
tries/GaugeTech
Windows® is a registered trademark of Microsoft Corporation in the United States
and/or other countries.

Doc# E154701 iiElectro Industries/GaugeTechThe Leader In Power Monitoring and Smart Grid SolutionsElectro Industries/GaugeTechThe Leader In Power Monitoring and Smart Grid Solutions
This page intentionally left blank.
Doc# E154701 iiiElectro Industries/GaugeTechThe Leader In Power Monitoring and Smart Grid SolutionsElectro Industries/GaugeTechThe Leader In Power Monitoring and Smart Grid Solutions
Customer Service and Support
Customer support is available 9:00 am to 4:30 pm, Eastern Standard Time, Monday
through Friday. Please have the model, serial number and a detailed problem descrip-
tion available. If the problem concerns a particular reading, please have all meter
readings available. When returning any merchandise to EIG, a return materials
authorization number is required. For customer or technical assistance, repair or
calibration, phone 516-334-0870 or fax 516-338-4741.
Product Warranty
Electro Industries/GaugeTech warrants all products to be free from defects in material
and workmanship for a period of four years from the date of shipment. During the
warranty period, we will, at our option, either repair or replace any product that
proves to be defective.
To exercise this warranty, fax or call our customer-support department. You will
receive prompt assistance and return instructions. Send the instrument, transporta-
tion prepaid, to EIG at 1800 Shames Drive, Westbury, NY 11590. Repairs will be made
and the instrument will be returned.
This warranty does not apply to defects resulting from unauthorized modification,
misuse, or use for any reason other than electrical power monitoring. The Nexus®
1500 meter is not a user-serviceable product.
THIS WARRANTY IS IN LIEU OF ALL OTHER WARRANTIES, EXPRESSED
OR IMPLIED, INCLUDING ANY IMPLIED WARRANTY OF MERCHANTABIL-
ITY OR FITNESS FOR A PARTICULAR PURPOSE. ELECTRO INDUSTRIES/
GAUGETECH SHALL NOT BE LIABLE FOR ANY INDIRECT, SPECIAL OR
CONSEQUENTIAL DAMAGES ARISING FROM ANY AUTHORIZED OR
UNAUTHORIZED USE OF ANY ELECTRO INDUSTRIES/GAUGETECH
PRODUCT. LIABILITY SHALL BE LIMITED TO THE ORIGINAL COST OF
THE PRODUCT SOLD.
Doc# E154701 ivElectro Industries/GaugeTechThe Leader In Power Monitoring and Smart Grid SolutionsElectro Industries/GaugeTechThe Leader In Power Monitoring and Smart Grid Solutions
Use of Product for Protection
Our products are not to be used for primary over-current protection. Any protection
feature in our products is to be used for alarm or secondary protection only.
Statement of Calibration
Our instruments are inspected and tested in accordance with specifications published
by Electro Industries/GaugeTech. The accuracy and a calibration of our instruments
are traceable to the National Institute of Standards and Technology through
equipment that is calibrated at planned intervals by comparison to certified standards.
For optimal performance, EIG recommends that any meter, including those manufac-
tured by EIG, be verified for accuracy on a yearly interval using NIST traceable accu-
racy standards.
Disclaimer
The information presented in this publication has been carefully checked for
reliability; however, no responsibility is assumed for inaccuracies. The information
contained in this document is subject to change without notice.
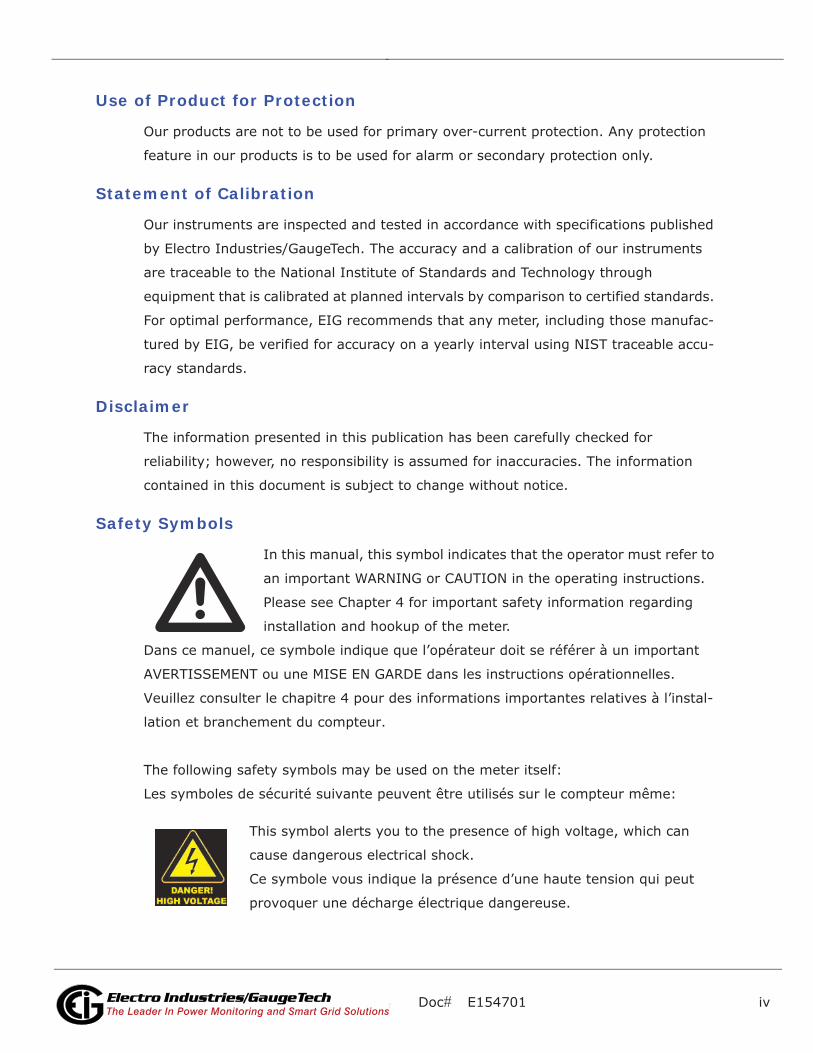
Safety Symbols
In this manual, this symbol indicates that the operator must refer to
an important WARNING or CAUTION in the operating instructions.
Please see Chapter 4 for important safety information regarding
installation and hookup of the meter.
Dans ce manuel, ce symbole indique que l’opérateur doit se référer à un important
AVERTISSEMENT ou une MISE EN GARDE dans les instructions opérationnelles.
Veuillez consulter le chapitre 4 pour des informations importantes relatives à l’instal-
lation et branchement du compteur.
The following safety symbols may be used on the meter itself:
Les symboles de sécurité suivante peuvent être utilisés sur le compteur même:
This symbol alerts you to the presence of high voltage, which can
cause dangerous electrical shock.
Ce symbole vous indique la présence d’une haute tension qui peut
provoquer une décharge électrique dangereuse.

Doc# E154701 vElectro Industries/GaugeTechThe Leader In Power Monitoring and Smart Grid SolutionsElectro Industries/GaugeTechThe Leader In Power Monitoring and Smart Grid Solutions
This symbol indicates the field wiring terminal that must be connected
to earth ground before operating the meter, which protects against
electrical shock in case of a fault condition.
Ce symbole indique que la borne de pose des canalisations in-situ qui doit être
branchée dans la mise à terre avant de faire fonctionner le compteur qui est protégé
contre une décharge électrique ou un état défectueux.
About Electro Industries/GaugeTech (EIG)
Founded in 1975 by engineer and inventor Dr. Samuel Kagan, Electro Industries/
GaugeTech changed the face of power monitoring forever with its first breakthrough
innovation: an affordable, easy-to-use AC power meter.
More than thirty years since its founding, Electro Industries/GaugeTech, the leader in
power monitoring and control, continues to revolutionize the industry with the highest
quality, cutting edge power monitoring and control technology on the market today.
An ISO 9001:2000 certified company, EIG sets the industry standard for advanced
power quality and reporting, revenue metering and substation data acquisition and
control. EIG products can be found on site at mainly all of today's leading manufactur-
ers, industrial giants and utilities.
EIG products are primarily designed, manufactured, tested and calibrated at our facil-
ity in Westbury, New York.

Doc# E154701 viElectro Industries/GaugeTechThe Leader In Power Monitoring and Smart Grid SolutionsElectro Industries/GaugeTechThe Leader In Power Monitoring and Smart Grid Solutions
This page intentionally left blank.
Doc# E154701 TOC - 1
Table of Contents
Electro Industries/GaugeTechThe Leader In Power Monitoring and Smart Grid SolutionsElectro Industries/GaugeTechThe Leader In Power Monitoring and Smart Grid Solutions
Table of Contents
Customer Service and Support iii
Product Warranty iii
Statement of Calibration iv
Disclaimer iv
About Electro Industries/GaugeTech v
1:Three-Phase Power Measurement 1-1
1.1: Three-Phase System Configurations 1-1
1.1.1: Wye Connection 1-1
1.1.2: Delta Connection 1-4
1.1.3: Blondel’s Theorem and Three Phase Measurement 1-6
1.2: Power, Energy and Demand 1-8
1.3: Reactive Energy and Power Factor 1-12
1.4: Harmonic Distortion 1-14
1.5: Power Quality 1-17
2: Nexus® 1500 Meter Overview 2-1
2.1: Meter Features 2-1
2.2: DNP V3.00 Level 2 2-3
2.3: V-Switch™ Technology 2-3
2.3.1: Upgrading the Meter’s V-Switch™ Key 2-4
2.6: Meter specifications 2-13
2.7: Standards Compliance 2-17
Doc# E154701 TOC - 2
Table of Contents
Electro Industries/GaugeTechThe Leader In Power Monitoring and Smart Grid SolutionsElectro Industries/GaugeTechThe Leader In Power Monitoring and Smart Grid Solutions
3: Hardware Installation 3-1
3.1: Mounting the Nexus® 1500 Meter 3-1
3.2: Meter and Panel Cut-out Dimensions 3-1
3.3: Mounting Instructions 3-4
3.4: Mounting the Optional External I/O Modules 3-6
4: Electrical Installation 4-1
4.1: Considerations When Installing Meters 4-1
4.2: CT Leads Terminated to Meter 4-5
4.3: CT Leads Pass Through (No Meter Termination) 4-6
4.4: Quick Connect Crimp-on Terminations 4-7
4.5: Wiring the Monitored Inputs and Voltages 4-8
4.6: Ground Connections 4-9
4.7: Fusing the Voltage Connections 4-9
4.8: Wiring the Monitored Inputs - Vaux 4-9
4.9: Wiring the Monitored Inputs - Currents 4-9
4.10: Isolating a CT Connection Reversal 4-10
4.11: Instrument Power Connections 4-10
4.12: Wiring Diagrams 4-11
5: Communication Wiring 5-1
5.1: Communication Overview 5-1
5.2: RJ45 and Fiber Ethernet Connections 5-1
5.3: ANSI Optical Port 5-1
5.4: USB Connection 5-3
Doc# E154701 TOC - 3
Table of Contents
Electro Industries/GaugeTechThe Leader In Power Monitoring and Smart Grid SolutionsElectro Industries/GaugeTechThe Leader In Power Monitoring and Smart Grid Solutions
5.5: RS485 Connections 5-3
5.5.1: Using the Unicom 2500 5-6
5.10: IRIG-B Connections 5-11
6: Using the Touch Screen Display 6-1
6.1: Introduction 6-1
6.2: Fixed System Screens 6-1
6.3: Dynamic Screens 6-7
7.1: Introduction 7-1
7.2: Nexus® 1500 Meter's Transformer Loss Compensation 7-4
7.2.1: Loss Compensation in Three Element Installations 7-5
7.2.1.1: Three-Element Loss Compensation Worksheet 7-6
8: Time-of-Use Function 8-1
8.1: Introduction 8-1
8.2: The Nexus® Meter's TOU Calendar 8-1
8.3: TOU Prior Season and Month 8-2
8.4: Updating, Retrieving and Replacing TOU Calendars 8-2
8.5: Daylight Savings and Demand 8-3
9:Network Communications 9-1
9.1: Hardware Overview 9-1
9.2: Specifications 9-2
9.3: Network Connection 9-2
9.4: Total Web Solutions 9-4
9.4.1: Viewing Webpages 9-5
Doc# E154701 TOC - 4
Table of Contents
Electro Industries/GaugeTechThe Leader In Power Monitoring and Smart Grid SolutionsElectro Industries/GaugeTechThe Leader In Power Monitoring and Smart Grid Solutions
10: Flicker Analysis 10-1
10.1: Overview 10-1
10.2: Theory of Operation 10-1
10.2.1: Summary 10-3
10.3: EN50160/IEC61000-4-30 Flicker Logging 10-5
10.4: EN50160/IEC61000-4-30 Flicker Polling Screen 10-8
10.5: Polling through Communications 10-12
10.6: Log Viewer 10-12
10.7: Performance Notes 10-12
11: Using the I/O Options 11-1
11.1: Overview 11-1
11.2: Installing Option Cards 11-1
11.3: Configuring Option Cards 11-2
11.4: Pulse Output/RS485 Option Card (485P) 11-3
11.4.1: Pulse Output/RS485 Option Card (485P) Wiring 11-5
11.5: Ethernet Option Card: RJ45 (NTRJ) or
Fiber Optic (NTFO) 11-6
11.6: Relay Output Option Card (6RO1) 11-8
11.6.1: Relay Output Option Card (6RO1) Wiring 11-9
11.7: Digital Input Option Card (16DI1) 11-10
11.7.1: Digital Input Option Card (16DI1) Wiring 11-11
11.8: Optional External I/O Modules 11-12
11.8.1: Port Overview 11-13
11.8.2: Installing Optional External I/O Modules 11-14
Doc# E154701 TOC - 5
Table of Contents
Electro Industries/GaugeTechThe Leader In Power Monitoring and Smart Grid SolutionsElectro Industries/GaugeTechThe Leader In Power Monitoring and Smart Grid Solutions
11.8.3: Power Source for External I/O Modules 11-14
11.8.4: Using PSIO with Multiple I/O Modules 11-15
11.8.4.1: Steps for Attaching Multiple I/O Modules 11-16
11.8.5: Factory Settings and Reset Button 11-17
11.8.6: Analog Transducer Signal Output Modules 11-18
11.8.6.1: Overview 11-19
11.8.6.2: Normal Mode 11-19
11.8.7: Digital Dry Contact Relay Output (Form C) Module 11-20
11.8.7.1: Overview 11-20
11.8.7.2: Communication 11-21
11.8.7.3: Normal Mode 11-21
11.8.8: Digital Solid State Pulse Output (KYZ) Module 11-22
11.8.8.1: Overview 11-22
11.8.8.2: Communication 11-23
11.8.8.3: Normal Mode 11-23
11.9: Additional External I/O Module Specifications 11-27
A: Installing the USB Virtual Comm Port A-1
A.1: Introduction A-1
A.2: Installing the Virtual Port's Driver A-1
A.3: Connecting to the Virtual Port A-3
B: Power Supply Options B-1
C: Using the IEC 61850 Protocol Ethernet Network
Server C-1
C.1: OVerview of IEC 61850 C-1
Doc# E154701 TOC - 6
Table of Contents
Electro Industries/GaugeTechThe Leader In Power Monitoring and Smart Grid SolutionsElectro Industries/GaugeTechThe Leader In Power Monitoring and Smart Grid Solutions
C.1.1: Relationship of Clients and Servers in IEC 61850 C-2
C.1.2: Structure of IEC 61850 Network C-4
C.1.2.1: Elements of an IEC 61850 Network C-5
C.1.3: Steps in Configuring an IEC 61850 Network C-7
C.1.4: Electro Industries’ Implementation of the IEC 61850
Server C-9
C.1.4.1: Nexus® 1500 Server Configuration C-11
C.1.5: Reference Materials C-12
C.1.6: Free Tools for IEC 61850 Start-up C-13
C.1.7: Commercial Tools for IEC 61850 Implementation C-13
C.2: Using the Nexus® 1500 Meter’s IEC 61850 Protocol
Ethernet Network Server C-14
C.2.1: Overview C-14
C.2.2: Configuring the IEC 61850 Protocol Ethernet
Network Server C-16
C.2.2.1: Configuring the Device Profile IEC 61850 Protocol
Ethernet Network Server Settings C-16
C.2.2.2: Configuring the Meter on the IEC 61850 Network C-18
C.4: Testing C-34
Glossary GL-1
Doc# E154701 1 - 1
1: Three-Phase Power Measurement
Electro Industries/GaugeTechThe Leader In Power Monitoring and Smart Grid SolutionsElectro Industries/GaugeTechThe Leader In Power Monitoring and Smart Grid Solutions
1:Three-Phase Power MeasurementThis introduction to three-phase power and power measurement is intended to
provide only a brief overview of the subject. The professional meter engineer or meter
technician should refer to more advanced documents such as the EEI Handbook for
Electricity Metering and the application standards for more in-depth and technical
coverage of the subject.
1.1: Three-Phase System Configurations
Three-phase power is most commonly used in situations where large amounts of
power will be used because it is a more effective way to transmit the power and
because it provides a smoother delivery of power to the end load. There are two
commonly used connections for three-phase power, a wye connection or a delta
connection. Each connection has several different manifestations in actual use.
When attempting to determine the type of connection in use, it is a good practice to
follow the circuit back to the transformer that is serving the circuit. It is often not
possible to conclusively determine the correct circuit connection simply by counting
the wires in the service or checking voltages. Checking the transformer connection
will provide conclusive evidence of the circuit connection and the relationships
between the phase voltages and ground.
1.1.1: Wye Connection
The wye connection is so called because when you look at the phase relationships and
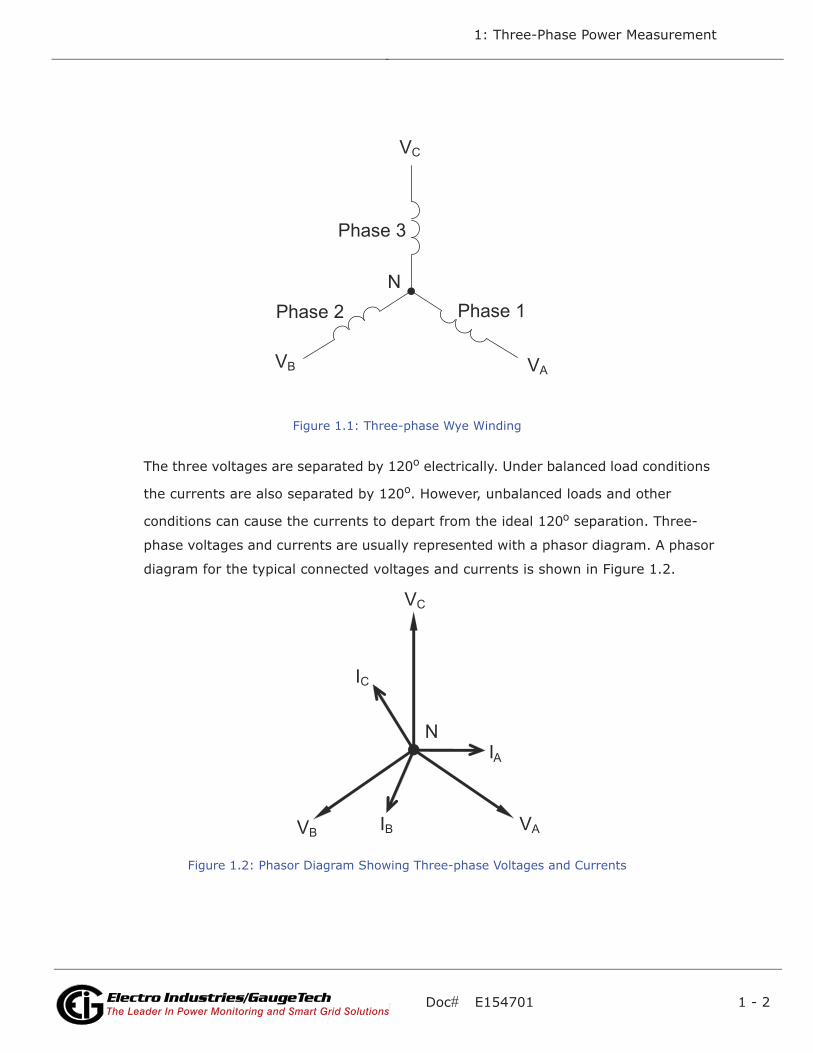
the winding relationships between the phases it looks like a Y. Figure 1.1 depicts the
winding relationships for a wye-connected service. In a wye service the neutral (or
center point of the wye) is typically grounded. This leads to common voltages of 208/
120 and 480/277 (where the first number represents the phase-to-phase voltage and
the second number represents the phase-to-ground voltage).
Doc# E154701 1 - 2
1: Three-Phase Power Measurement
Electro Industries/GaugeTechThe Leader In Power Monitoring and Smart Grid SolutionsElectro Industries/GaugeTechThe Leader In Power Monitoring and Smart Grid Solutions
Figure 1.1: Three-phase Wye Winding
The three voltages are separated by 120o electrically. Under balanced load conditions
the currents are also separated by 120o. However, unbalanced loads and other
conditions can cause the currents to depart from the ideal 120o separation. Three-
phase voltages and currents are usually represented with a phasor diagram. A phasor
diagram for the typical connected voltages and currents is shown in Figure 1.2.
Figure 1.2: Phasor Diagram Showing Three-phase Voltages and Currents
N
Phase 1
Phase 3
Phase 2
V C
V A V B
VA
VC
VB
N
IC
IA
IB
Doc# E154701 1 - 3
1: Three-Phase Power Measurement
Electro Industries/GaugeTechThe Leader In Power Monitoring and Smart Grid SolutionsElectro Industries/GaugeTechThe Leader In Power Monitoring and Smart Grid Solutions
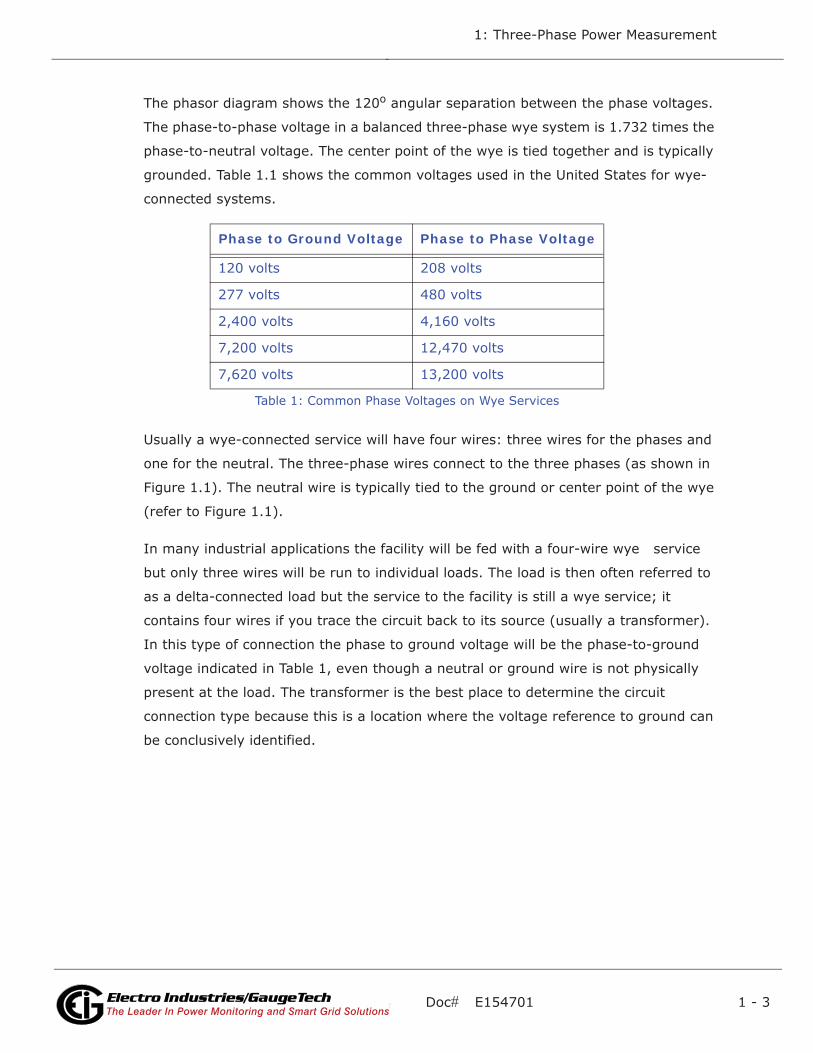
The phasor diagram shows the 120o angular separation between the phase voltages.
The phase-to-phase voltage in a balanced three-phase wye system is 1.732 times the
phase-to-neutral voltage. The center point of the wye is tied together and is typically
grounded. Table 1.1 shows the common voltages used in the United States for wye-
connected systems.
Usually a wye-connected service will have four wires: three wires for the phases and
one for the neutral. The three-phase wires connect to the three phases (as shown in
Figure 1.1). The neutral wire is typically tied to the ground or center point of the wye
(refer to Figure 1.1).
In many industrial applications the facility will be fed with a four-wire wye service
but only three wires will be run to individual loads. The load is then often referred to
as a delta-connected load but the service to the facility is still a wye service; it
contains four wires if you trace the circuit back to its source (usually a transformer).
In this type of connection the phase to ground voltage will be the phase-to-ground
voltage indicated in Table 1, even though a neutral or ground wire is not physically
present at the load. The transformer is the best place to determine the circuit
connection type because this is a location where the voltage reference to ground can
be conclusively identified.
Phase to Ground Voltage Phase to Phase Voltage
120 volts 208 volts
277 volts 480 volts
2,400 volts 4,160 volts
7,200 volts 12,470 volts
7,620 volts 13,200 volts
Table 1: Common Phase Voltages on Wye Services
Doc# E154701 1 - 4
1: Three-Phase Power Measurement
Electro Industries/GaugeTechThe Leader In Power Monitoring and Smart Grid SolutionsElectro Industries/GaugeTechThe Leader In Power Monitoring and Smart Grid Solutions
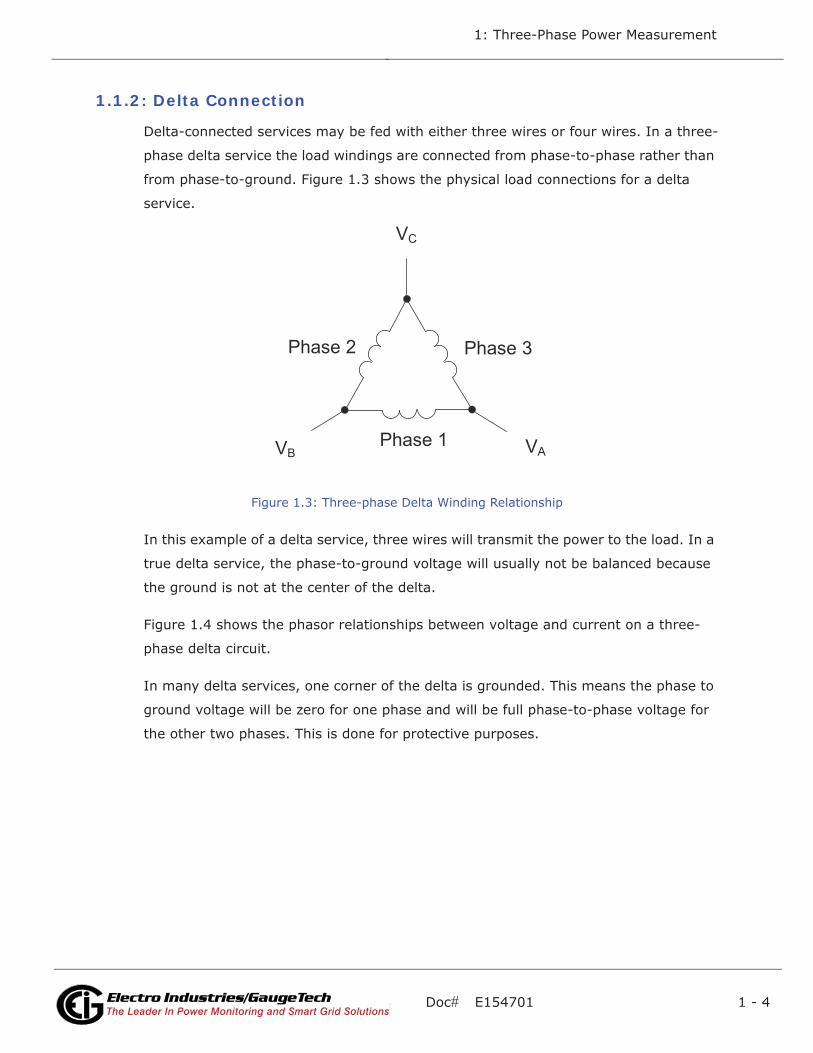
1.1.2: Delta Connection
Delta-connected services may be fed with either three wires or four wires. In a three-
phase delta service the load windings are connected from phase-to-phase rather than
from phase-to-ground. Figure 1.3 shows the physical load connections for a delta
service.
Figure 1.3: Three-phase Delta Winding Relationship
In this example of a delta service, three wires will transmit the power to the load. In a
true delta service, the phase-to-ground voltage will usually not be balanced because
the ground is not at the center of the delta.
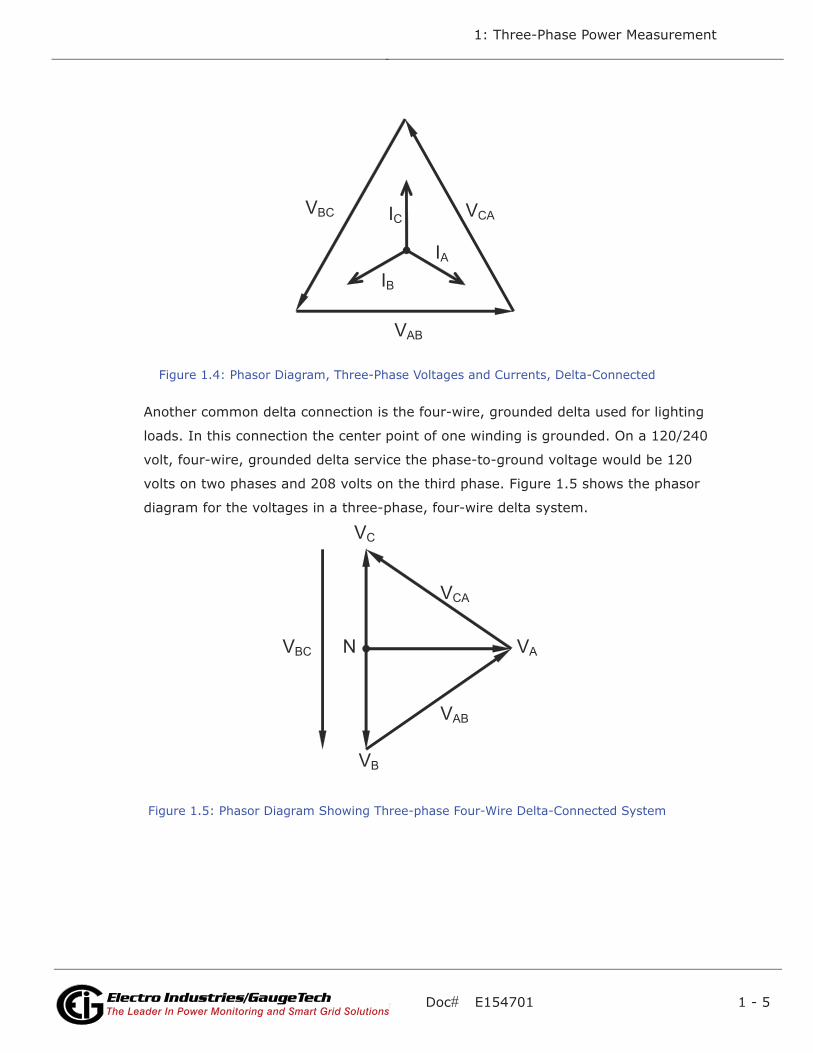
Figure 1.4 shows the phasor relationships between voltage and current on a three-
phase delta circuit.
In many delta services, one corner of the delta is grounded. This means the phase to
ground voltage will be zero for one phase and will be full phase-to-phase voltage for
the other two phases. This is done for protective purposes.
V C
Phase 1
Phase 3 Phase 2
V A V B
Doc# E154701 1 - 5
1: Three-Phase Power Measurement
Electro Industries/GaugeTechThe Leader In Power Monitoring and Smart Grid SolutionsElectro Industries/GaugeTechThe Leader In Power Monitoring and Smart Grid Solutions
Figure 1.4: Phasor Diagram, Three-Phase Voltages and Currents, Delta-Connected
Another common delta connection is the four-wire, grounded delta used for lighting
loads. In this connection the center point of one winding is grounded. On a 120/240
volt, four-wire, grounded delta service the phase-to-ground voltage would be 120
volts on two phases and 208 volts on the third phase. Figure 1.5 shows the phasor
diagram for the voltages in a three-phase, four-wire delta system.
Figure 1.5: Phasor Diagram Showing Three-phase Four-Wire Delta-Connected System
IA
VCA
VAB
VBC IC
IB
VA
VC
VB
VCA
VAB
N VBC
Doc# E154701 1 - 6
1: Three-Phase Power Measurement
Electro Industries/GaugeTechThe Leader In Power Monitoring and Smart Grid SolutionsElectro Industries/GaugeTechThe Leader In Power Monitoring and Smart Grid Solutions
1.1.3: Blondel’s Theorem and Three Phase Measurement
In 1893 an engineer and mathematician named Andre E. Blondel set forth the first
scientific basis for polyphase metering. His theorem states:
If energy is supplied to any system of conductors through N wires, the total power in
the system is given by the algebraic sum of the readings of N wattmeters so arranged
that each of the N wires contains one current coil, the corresponding potential coil
being connected between that wire and some common point. If this common point is
on one of the N wires, the measurement may be made by the use of N-1 Wattmeters.
The theorem may be stated more simply, in modern language:
In a system of N conductors, N-1 meter elements will measure the power or energy
taken provided that all the potential coils have a common tie to the conductor in
which there is no current coil.
Three-phase power measurement is accomplished by measuring the three individual
phases and adding them together to obtain the total three phase value. In older ana-
log meters, this measurement was accomplished using up to three separate elements.
Each element combined the single-phase voltage and current to produce a torque on
the meter disk. All three elements were arranged around the disk so that the disk was
subjected to the combined torque of the three elements. As a result the disk would
turn at a higher speed and register power supplied by each of the three wires.
According to Blondel's Theorem, it was possible to reduce the number of elements
under certain conditions. For example, a three-phase, three-wire delta system could
be correctly measured with two elements (two potential coils and two current coils) if
the potential coils were connected between the three phases with one phase in com-
mon.
In a three-phase, four-wire wye system it is necessary to use three elements. Three
voltage coils are connected between the three phases and the common neutral con-
ductor. A current coil is required in each of the three phases.
In modern digital meters, Blondel's Theorem is still applied to obtain proper metering.
The difference in modern meters is that the digital meter measures each phase volt-
age and current and calculates the single-phase power for each phase. The meter
then sums the three phase powers to a single three-phase reading.
Doc# E154701 1 - 7
1: Three-Phase Power Measurement
Electro Industries/GaugeTechThe Leader In Power Monitoring and Smart Grid SolutionsElectro Industries/GaugeTechThe Leader In Power Monitoring and Smart Grid Solutions
Some digital meters calculate the individual phase power values one phase at a time.
This means the meter samples the voltage and current on one phase and calculates a
power value. Then it samples the second phase and calculates the power for the sec-
ond phase. Finally, it samples the third phase and calculates that phase power. After
sampling all three phases, the meter combines the three readings to create the equiv-
alent three-phase power value. Using mathematical averaging techniques, this
method can derive a quite accurate measurement of three-phase power.
More advanced meters actually sample all three phases of voltage and current
simultaneously and calculate the individual phase and three-phase power values. The
advantage of simultaneous sampling is the reduction of error introduced due to the
difference in time when the samples were taken.
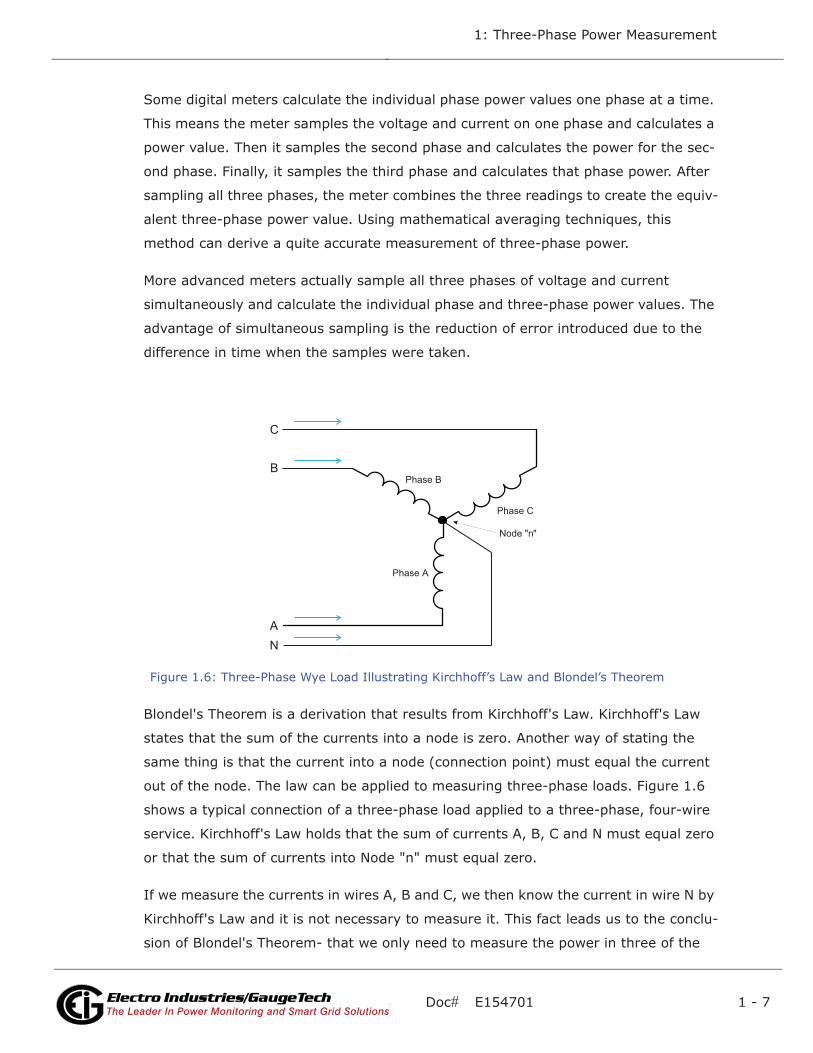
Figure 1.6: Three-Phase Wye Load Illustrating Kirchhoff’s Law and Blondel’s Theorem
Blondel's Theorem is a derivation that results from Kirchhoff's Law. Kirchhoff's Law
states that the sum of the currents into a node is zero. Another way of stating the
same thing is that the current into a node (connection point) must equal the current
out of the node. The law can be applied to measuring three-phase loads. Figure 1.6
shows a typical connection of a three-phase load applied to a three-phase, four-wire
service. Kirchhoff's Law holds that the sum of currents A, B, C and N must equal zero
or that the sum of currents into Node "n" must equal zero.
If we measure the currents in wires A, B and C, we then know the current in wire N by
Kirchhoff's Law and it is not necessary to measure it. This fact leads us to the conclu-
sion of Blondel's Theorem- that we only need to measure the power in three of the
Phase B
Phase C
Phase A
A
B
C
N
Node "n"
Doc# E154701 1 - 8
1: Three-Phase Power Measurement
Electro Industries/GaugeTechThe Leader In Power Monitoring and Smart Grid SolutionsElectro Industries/GaugeTechThe Leader In Power Monitoring and Smart Grid Solutions
four wires if they are connected by a common node. In the circuit of Figure 1.6 we
must measure the power flow in three wires. This will require three voltage coils and
three current coils (a three-element meter). Similar figures and conclusions could be
reached for other circuit configurations involving Delta-connected loads.
1.2: Power, Energy and Demand
It is quite common to exchange power, energy and demand without differentiating
between the three. Because this practice can lead to confusion, the differences
between these three measurements will be discussed.
Power is an instantaneous reading. The power reading provided by a meter is the
present flow of watts. Power is measured immediately just like current. In many digi-
tal meters, the power value is actually measured and calculated over a one second
interval because it takes some amount of time to calculate the RMS values of voltage
and current. But this time interval is kept small to preserve the instantaneous nature
of power.
Energy is always based on some time increment; it is the integration of power over a
defined time increment. Energy is an important value because almost all electric bills
are based, in part, on the amount of energy used.
Typically, electrical energy is measured in units of kilowatt-hours (kWh). A kilowatt-
hour represents a constant load of one thousand watts (one kilowatt) for one hour.
Stated another way, if the power delivered (instantaneous watts) is measured as
1,000 watts and the load was served for a one hour time interval then the load would
have absorbed one kilowatt-hour of energy. A different load may have a constant
power requirement of 4,000 watts. If the load were served for one hour it would
absorb four kWh. If the load were served for 15 minutes it would absorb ¼ of that
total or one kWh.
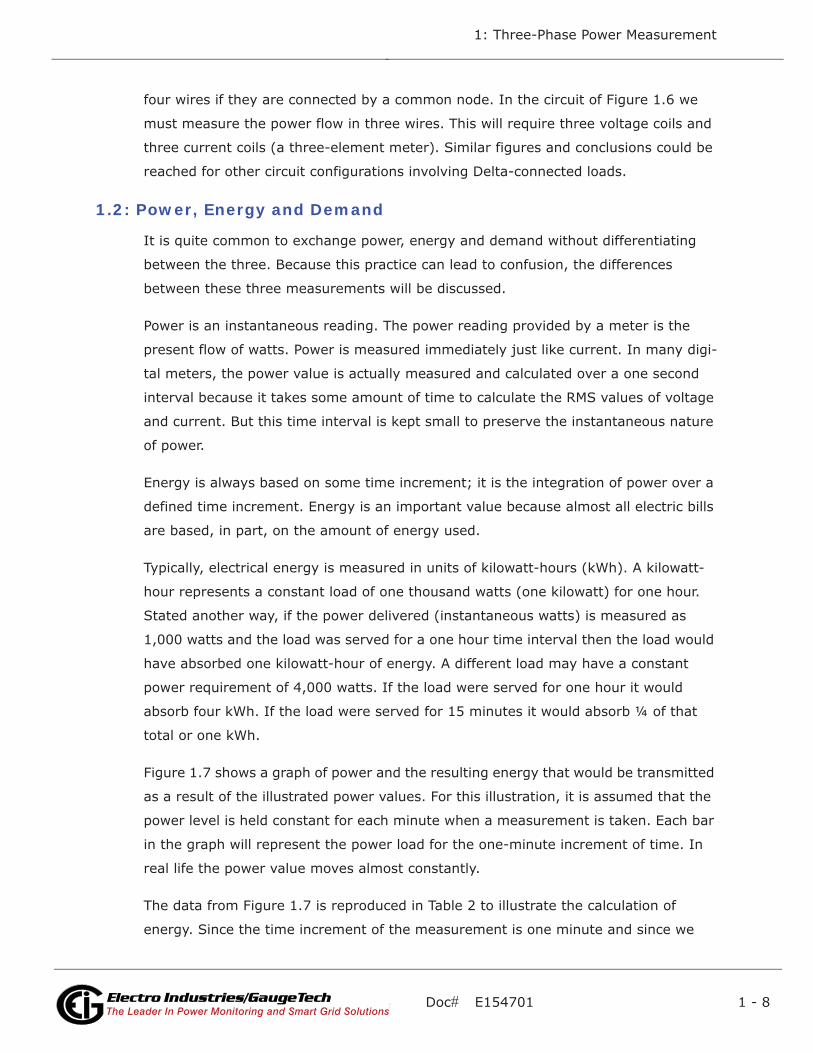
Figure 1.7 shows a graph of power and the resulting energy that would be transmitted
as a result of the illustrated power values. For this illustration, it is assumed that the
power level is held constant for each minute when a measurement is taken. Each bar
in the graph will represent the power load for the one-minute increment of time. In
real life the power value moves almost constantly.
The data from Figure 1.7 is reproduced in Table 2 to illustrate the calculation of
energy. Since the time increment of the measurement is one minute and since we
Doc# E154701 1 - 9
1: Three-Phase Power Measurement
Electro Industries/GaugeTechThe Leader In Power Monitoring and Smart Grid SolutionsElectro Industries/GaugeTechThe Leader In Power Monitoring and Smart Grid Solutions
specified that the load is constant over that minute, we can convert the power reading
to an equivalent consumed energy reading by multiplying the power reading times 1/
60 (converting the time base from minutes to hours).
Figure 1.7: Power Use over Time
0
10
20
30
40
50
60
70
80
1 2 3 4 5 6 7 8 9 10 11 12 13 14 15
Time (minutes)
sttawolik
Doc# E154701 1 - 10
1: Three-Phase Power Measurement
Electro Industries/GaugeTechThe Leader In Power Monitoring and Smart Grid SolutionsElectro Industries/GaugeTechThe Leader In Power Monitoring and Smart Grid Solutions
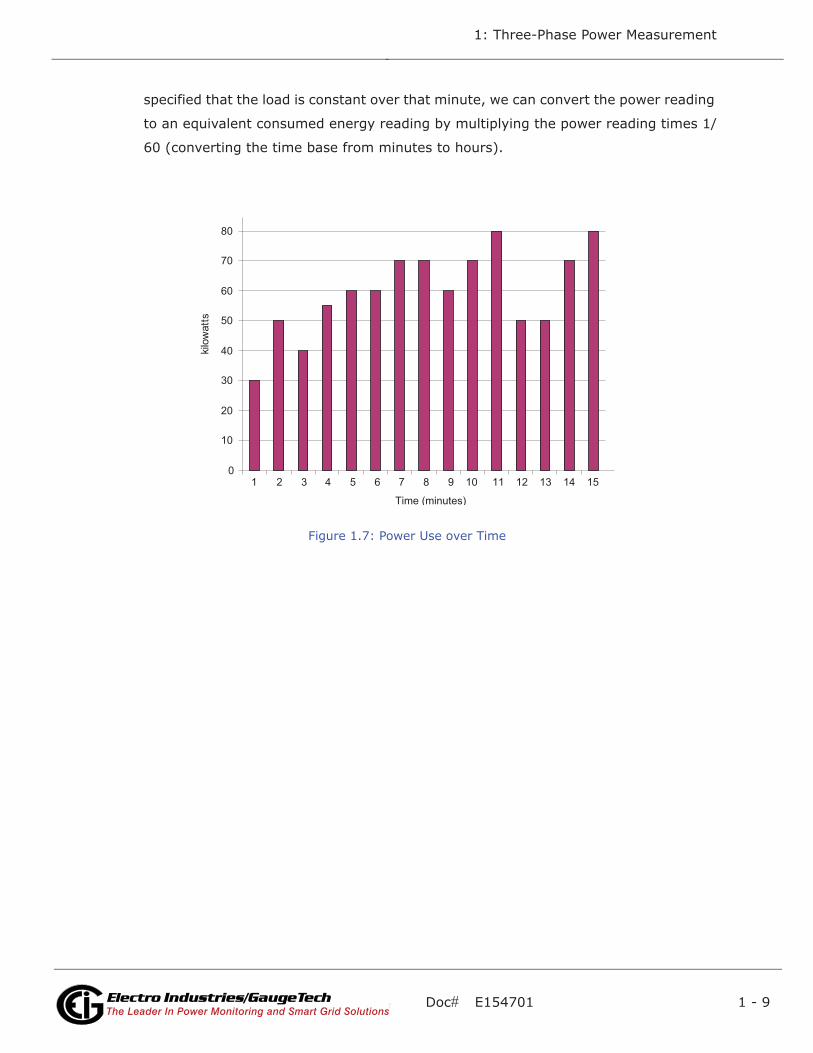
As in Table 1.2, the accumulated energy for the power load profile of Figure 1.7 is
14.92 kWh.
Demand is also a time-based value. The demand is the average rate of energy use
over time. The actual label for demand is kilowatt-hours/hour but this is normally
reduced to kilowatts. This makes it easy to confuse demand with power, but demand
is not an instantaneous value. To calculate demand it is necessary to accumulate the
energy readings (as illustrated in Figure 1.7) and adjust the energy reading to an
hourly value that constitutes the demand.
In the example, the accumulated energy is 14.92 kWh. But this measurement was
made over a 15-minute interval. To convert the reading to a demand value, it must be
normalized to a 60-minute interval. If the pattern were repeated for an additional
three 15-minute intervals the total energy would be four times the measured value or
Time Interval (minute)
Power (kW)
Energy (kWh)
Accumulated Energy (kWh)
1 30 0.50 0.50
2 50 0.83 1.33
3 40 0.67 2.00
4 55 0.92 2.92
5 60 1.00 3.92
6 60 1.00 4.92
7 70 1.17 6.09
8 70 1.17 7.26
9 60 1.00 8.26
10 70 1.17 9.43
11 80 1.33 10.76
12 50 0.83 12.42
13 50 0.83 12.42
14 70 1.17 13.59
15 80 1.33 14.92
Table 1.2: Power and Energy Relationship over Time
Doc# E154701 1 - 11
1: Three-Phase Power Measurement
Electro Industries/GaugeTechThe Leader In Power Monitoring and Smart Grid SolutionsElectro Industries/GaugeTechThe Leader In Power Monitoring and Smart Grid Solutions
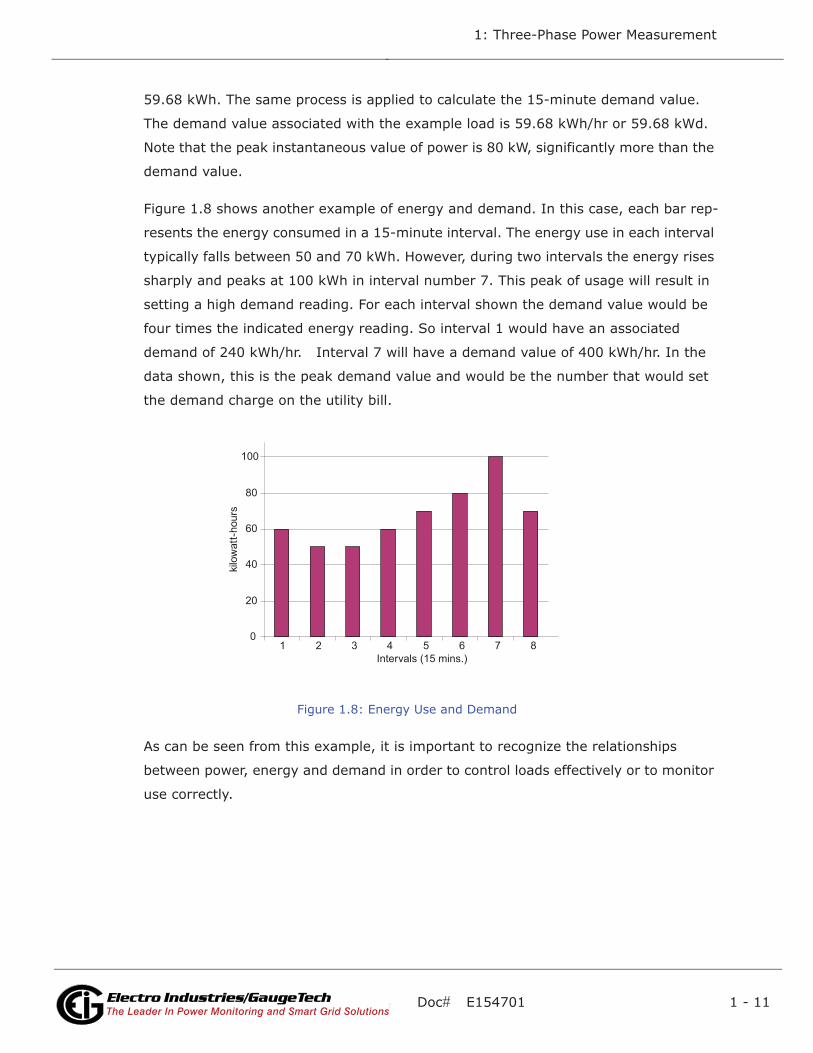
59.68 kWh. The same process is applied to calculate the 15-minute demand value.
The demand value associated with the example load is 59.68 kWh/hr or 59.68 kWd.
Note that the peak instantaneous value of power is 80 kW, significantly more than the
demand value.
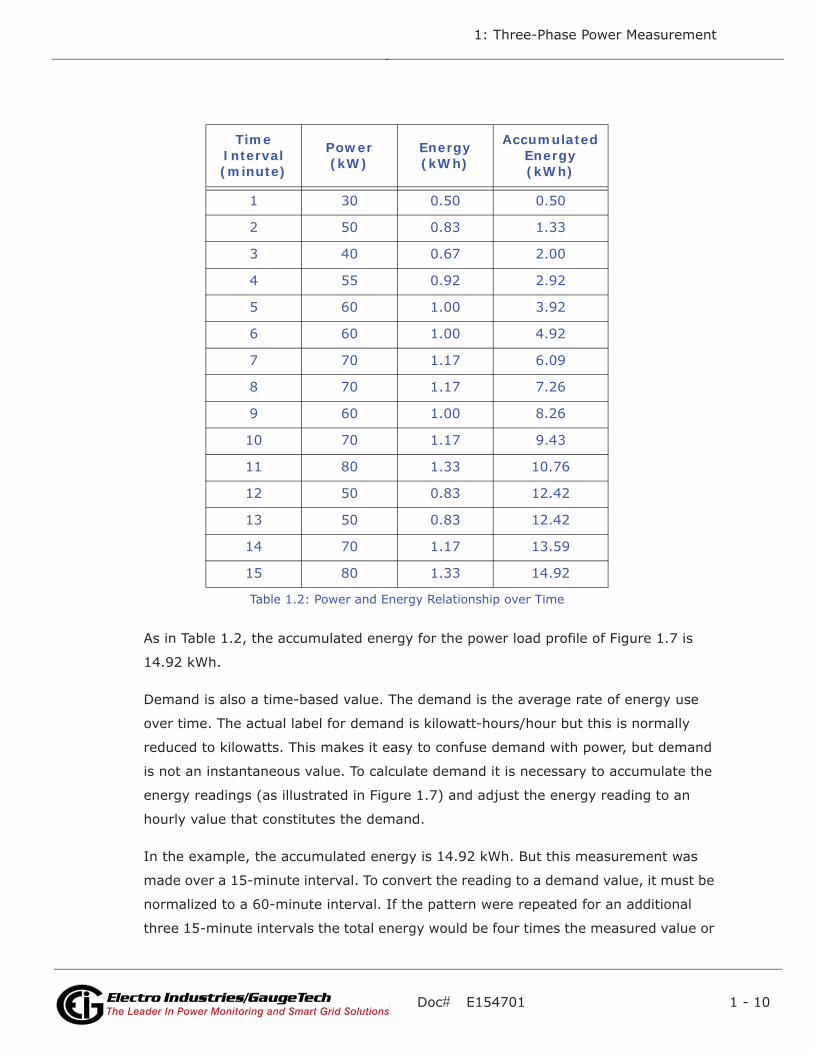
Figure 1.8 shows another example of energy and demand. In this case, each bar rep-
resents the energy consumed in a 15-minute interval. The energy use in each interval
typically falls between 50 and 70 kWh. However, during two intervals the energy rises
sharply and peaks at 100 kWh in interval number 7. This peak of usage will result in
setting a high demand reading. For each interval shown the demand value would be
four times the indicated energy reading. So interval 1 would have an associated
demand of 240 kWh/hr. Interval 7 will have a demand value of 400 kWh/hr. In the
data shown, this is the peak demand value and would be the number that would set
the demand charge on the utility bill.
Figure 1.8: Energy Use and Demand
As can be seen from this example, it is important to recognize the relationships
between power, energy and demand in order to control loads effectively or to monitor
use correctly.
0
20
40
60
80
100
1 2 3 4 5 6 7 8Intervals (15 mins.)
sruoh-ttawolik
Doc# E154701 1 - 12
1: Three-Phase Power Measurement
Electro Industries/GaugeTechThe Leader In Power Monitoring and Smart Grid SolutionsElectro Industries/GaugeTechThe Leader In Power Monitoring and Smart Grid Solutions
1.3: Reactive Energy and Power Factor
The real power and energy measurements discussed in the previous section relate to
the quantities that are most used in electrical systems. But it is often not sufficient to
only measure real power and energy. Reactive power is a critical component of the
total power picture because almost all real-life applications have an impact on
reactive power. Reactive power and power factor concepts relate to both load and
generation applications. However, this discussion will be limited to analysis of reactive
power and power factor as they relate to loads. To simplify the discussion, generation
will not be considered.
Real power (and energy) is the component of power that is the combination of the
voltage and the value of corresponding current that is directly in phase with the
voltage. However, in actual practice the total current is almost never in phase with the
voltage. Since the current is not in phase with the voltage, it is necessary to consider
both the inphase component and the component that is at quadrature (angularly
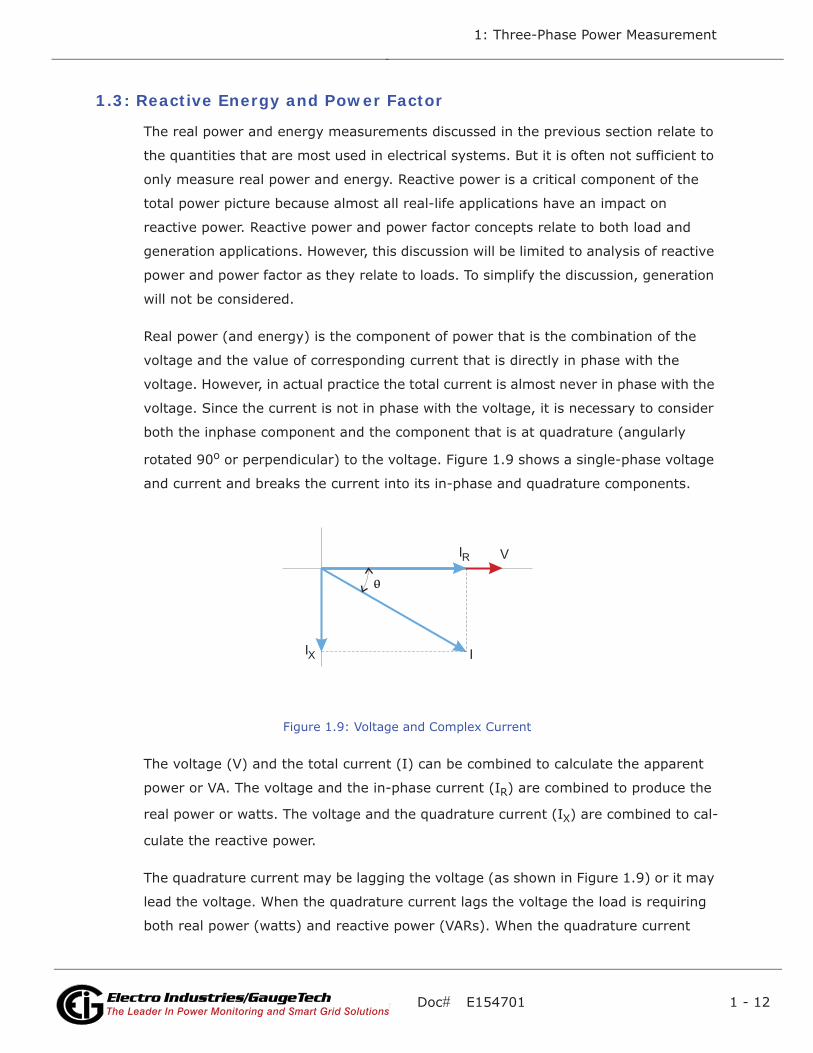
rotated 90o or perpendicular) to the voltage. Figure 1.9 shows a single-phase voltage
and current and breaks the current into its in-phase and quadrature components.
Figure 1.9: Voltage and Complex Current
The voltage (V) and the total current (I) can be combined to calculate the apparent
power or VA. The voltage and the in-phase current (IR) are combined to produce the
real power or watts. The voltage and the quadrature current (IX) are combined to cal-
culate the reactive power.
The quadrature current may be lagging the voltage (as shown in Figure 1.9) or it may
lead the voltage. When the quadrature current lags the voltage the load is requiring
both real power (watts) and reactive power (VARs). When the quadrature current
V
I
I R
I X
0
Doc# E154701 1 - 13
1: Three-Phase Power Measurement
Electro Industries/GaugeTechThe Leader In Power Monitoring and Smart Grid SolutionsElectro Industries/GaugeTechThe Leader In Power Monitoring and Smart Grid Solutions
leads the voltage the load is requiring real power (watts) but is delivering reactive
power (VARs) back into the system; that is VARs are flowing in the opposite direction
of the real power flow.
Reactive power (VARs) is required in all power systems. Any equipment that uses
magnetization to operate requires VARs. Usually the magnitude of VARs is relatively
low compared to the real power quantities. Utilities have an interest in maintaining
VAR requirements at the customer to a low value in order to maximize the return on
plant invested to deliver energy. When lines are carrying VARs, they cannot carry as
many watts. So keeping the VAR content low allows a line to carry its full capacity of
watts. In order to encourage customers to keep VAR requirements low, some utilities
impose a penalty if the VAR content of the load rises above a specified value.
A common method of measuring reactive power requirements is power factor. Power
factor can be defined in two different ways. The more common method of calculating
power factor is the ratio of the real power to the apparent power. This relationship is
expressed in the following formula:
Total PF = real power / apparent power = watts/VA
This formula calculates a power factor quantity known as Total Power Factor. It is
called Total PF because it is based on the ratios of the power delivered. The delivered
power quantities will include the impacts of any existing harmonic content. If the volt-
age or current includes high levels of harmonic distortion the power values will be
affected. By calculating power factor from the power values, the power factor will
include the impact of harmonic distortion. In many cases this is the preferred method
of calculation because the entire impact of the actual voltage and current are
included.
A second type of power factor is Displacement Power Factor. Displacement PF is based
on the angular relationship between the voltage and current. Displacement power fac-
tor does not consider the magnitudes of voltage, current or power. It is solely based
on the phase angle differences. As a result, it does not include the impact of harmonic
distortion. Displacement power factor is calculated using the following equation:
Displacement PF cos=
Doc# E154701 1 - 14
1: Three-Phase Power Measurement
Electro Industries/GaugeTechThe Leader In Power Monitoring and Smart Grid SolutionsElectro Industries/GaugeTechThe Leader In Power Monitoring and Smart Grid Solutions
where is the angle between the voltage and the current (see Fig. 1.9).
In applications where the voltage and current are not distorted, the Total Power Factor
will equal the Displacement Power Factor. But if harmonic distortion is present, the
two power factors will not be equal.
1.4: Harmonic Distortion
Harmonic distortion is primarily the result of high concentrations of non-linear loads.
Devices such as computer power supplies, variable speed drives and fluorescent light
ballasts make current demands that do not match the sinusoidal waveform of AC elec-
tricity. As a result, the current waveform feeding these loads is periodic but not sinu-
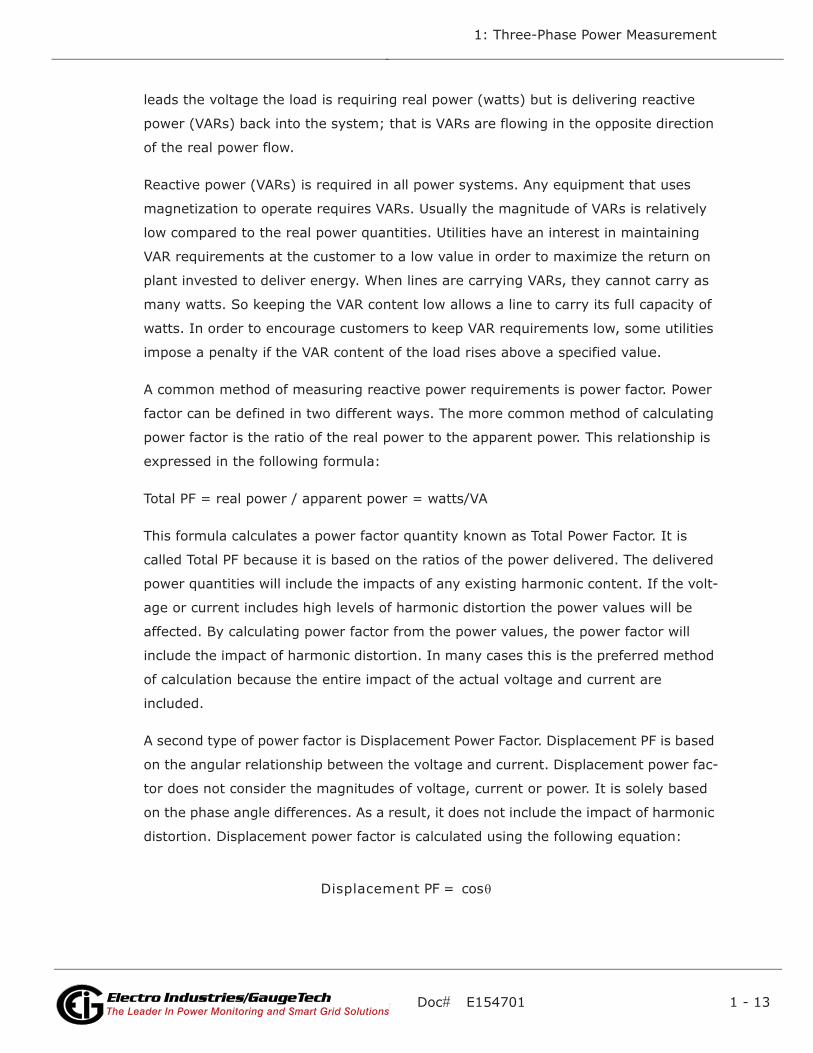
soidal. Figure 1.10 shows a normal, sinusoidal current waveform. This example has
no distortion.
Figure 1.10: Nondistorted Current Waveform
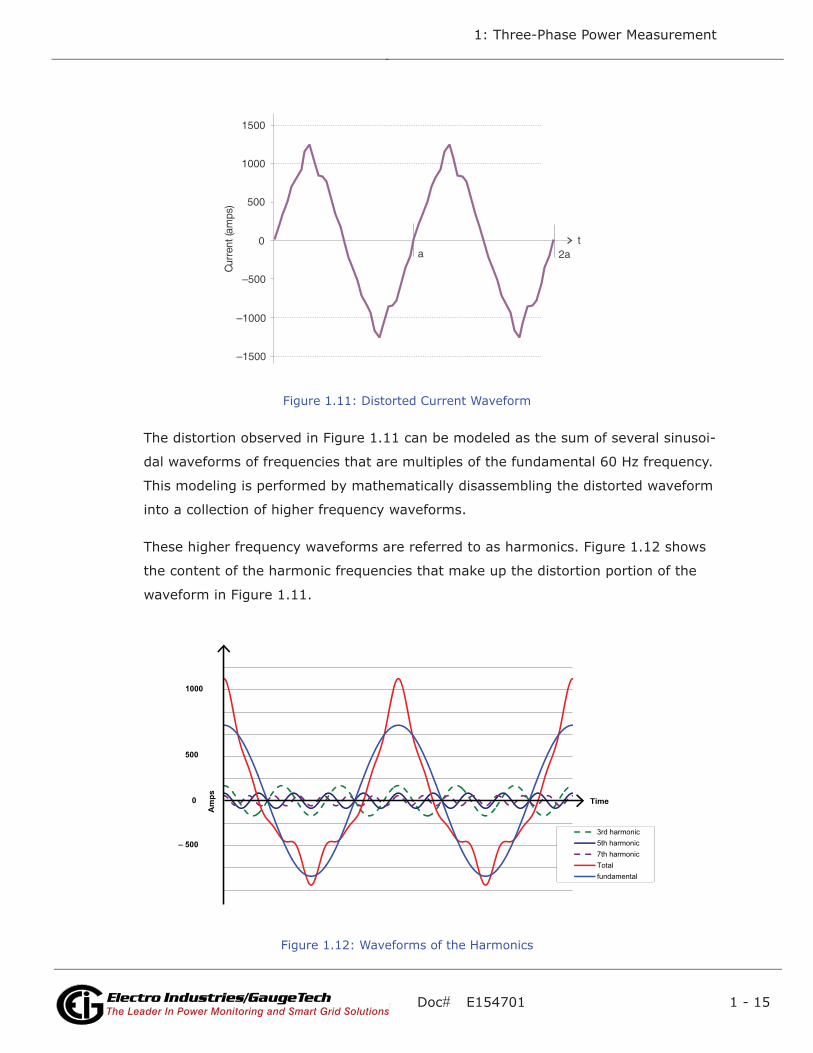
Figure 1.11 shows a current waveform with a slight amount of harmonic distortion.
The waveform is still periodic and is fluctuating at the normal 60 Hz frequency.
However, the waveform is not a smooth sinusoidal form as seen in Figure 1.10.
Time
Am
ps
– 1000
– 500
0
500
1000
Doc# E154701 1 - 15
1: Three-Phase Power Measurement
Electro Industries/GaugeTechThe Leader In Power Monitoring and Smart Grid SolutionsElectro Industries/GaugeTechThe Leader In Power Monitoring and Smart Grid Solutions
Figure 1.11: Distorted Current Waveform
The distortion observed in Figure 1.11 can be modeled as the sum of several sinusoi-
dal waveforms of frequencies that are multiples of the fundamental 60 Hz frequency.
This modeling is performed by mathematically disassembling the distorted waveform
into a collection of higher frequency waveforms.
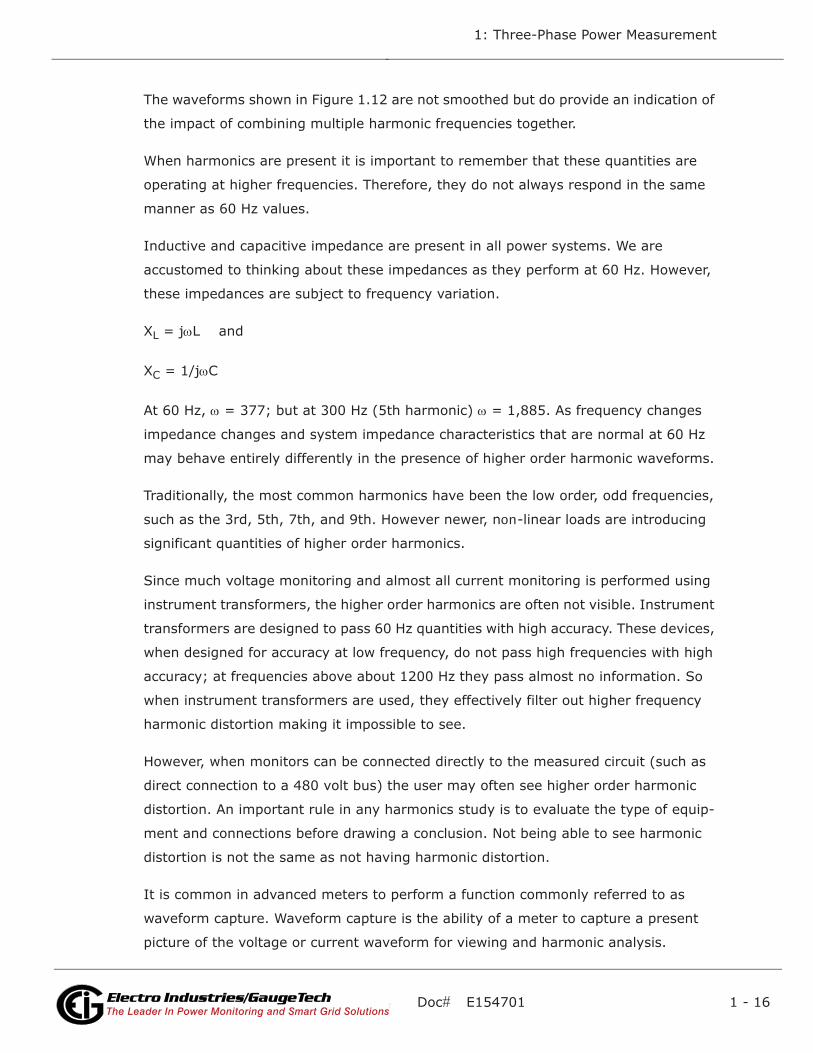
These higher frequency waveforms are referred to as harmonics. Figure 1.12 shows
the content of the harmonic frequencies that make up the distortion portion of the
waveform in Figure 1.11.
Figure 1.12: Waveforms of the Harmonics
–1000
–500
0
500
1000
t)sp
ma( tnerruC
a 2a
–1500
1500
Time
Am
ps
3rd harmonic5th harmonic7th harmonicTotalfundamental
– 500
0
500
1000
Doc# E154701 1 - 16
1: Three-Phase Power Measurement
Electro Industries/GaugeTechThe Leader In Power Monitoring and Smart Grid SolutionsElectro Industries/GaugeTechThe Leader In Power Monitoring and Smart Grid Solutions
The waveforms shown in Figure 1.12 are not smoothed but do provide an indication of
the impact of combining multiple harmonic frequencies together.
When harmonics are present it is important to remember that these quantities are
operating at higher frequencies. Therefore, they do not always respond in the same
manner as 60 Hz values.
Inductive and capacitive impedance are present in all power systems. We are
accustomed to thinking about these impedances as they perform at 60 Hz. However,
these impedances are subject to frequency variation.
XL = j L and
XC = 1/j C
At 60 Hz, = 377; but at 300 Hz (5th harmonic) = 1,885. As frequency changes
impedance changes and system impedance characteristics that are normal at 60 Hz
may behave entirely differently in the presence of higher order harmonic waveforms.
Traditionally, the most common harmonics have been the low order, odd frequencies,
such as the 3rd, 5th, 7th, and 9th. However newer, non-linear loads are introducing
significant quantities of higher order harmonics.
Since much voltage monitoring and almost all current monitoring is performed using
instrument transformers, the higher order harmonics are often not visible. Instrument
transformers are designed to pass 60 Hz quantities with high accuracy. These devices,
when designed for accuracy at low frequency, do not pass high frequencies with high
accuracy; at frequencies above about 1200 Hz they pass almost no information. So
when instrument transformers are used, they effectively filter out higher frequency
harmonic distortion making it impossible to see.
However, when monitors can be connected directly to the measured circuit (such as
direct connection to a 480 volt bus) the user may often see higher order harmonic
distortion. An important rule in any harmonics study is to evaluate the type of equip-
ment and connections before drawing a conclusion. Not being able to see harmonic
distortion is not the same as not having harmonic distortion.
It is common in advanced meters to perform a function commonly referred to as
waveform capture. Waveform capture is the ability of a meter to capture a present
picture of the voltage or current waveform for viewing and harmonic analysis.
Doc# E154701 1 - 17
1: Three-Phase Power Measurement
Electro Industries/GaugeTechThe Leader In Power Monitoring and Smart Grid SolutionsElectro Industries/GaugeTechThe Leader In Power Monitoring and Smart Grid Solutions
Typically a waveform capture will be one or two cycles in duration and can be viewed
as the actual waveform, as a spectral view of the harmonic content, or a tabular view
showing the magnitude and phase shift of each harmonic value. Data collected with
waveform capture is typically not saved to memory. Waveform capture is a real-time
data collection event.
Waveform capture should not be confused with waveform recording that is used to
record multiple cycles of all voltage and current waveforms in response to a transient
condition.
1.5: Power Quality
Power quality can mean several different things. The terms "power quality" and
"power quality problem" have been applied to all types of conditions. A simple defini-
tion of "power quality problem" is any voltage, current or frequency deviation that
results in mis-operation or failure of customer equipment or systems. The causes of
power quality problems vary widely and may originate in the customer equipment, in
an adjacent customer facility or with the utility.
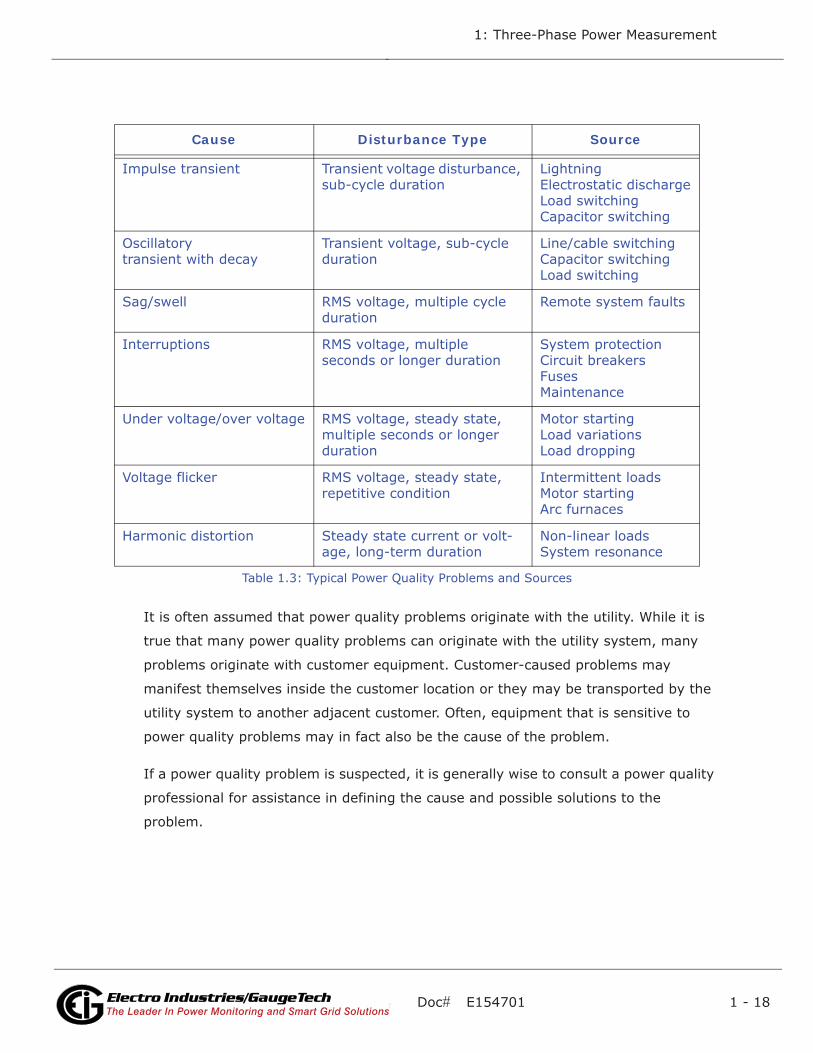
In his book Power Quality Primer, Barry Kennedy provided information on different
types of power quality problems. Some of that information is summarized in Table
1.3.
Doc# E154701 1 - 18
1: Three-Phase Power Measurement
Electro Industries/GaugeTechThe Leader In Power Monitoring and Smart Grid SolutionsElectro Industries/GaugeTechThe Leader In Power Monitoring and Smart Grid Solutions
It is often assumed that power quality problems originate with the utility. While it is
true that many power quality problems can originate with the utility system, many
problems originate with customer equipment. Customer-caused problems may
manifest themselves inside the customer location or they may be transported by the
utility system to another adjacent customer. Often, equipment that is sensitive to
power quality problems may in fact also be the cause of the problem.
If a power quality problem is suspected, it is generally wise to consult a power quality
professional for assistance in defining the cause and possible solutions to the
problem.
Cause Disturbance Type Source
Impulse transient Transient voltage disturbance, sub-cycle duration
LightningElectrostatic dischargeLoad switchingCapacitor switching
Oscillatory transient with decay
Transient voltage, sub-cycle duration
Line/cable switchingCapacitor switchingLoad switching
Sag/swell RMS voltage, multiple cycle duration
Remote system faults
Interruptions RMS voltage, multiple seconds or longer duration
System protectionCircuit breakersFusesMaintenance
Under voltage/over voltage RMS voltage, steady state, multiple seconds or longer duration
Motor startingLoad variationsLoad dropping
Voltage flicker RMS voltage, steady state, repetitive condition
Intermittent loadsMotor startingArc furnaces
Harmonic distortion Steady state current or volt-age, long-term duration
Non-linear loadsSystem resonance
Table 1.3: Typical Power Quality Problems and Sources
Doc# E154701 2 - 1
2: Nexus® 1500 Meter Overview
Electro Industries/GaugeTechThe Leader In Power Monitoring and Smart Grid SolutionsElectro Industries/GaugeTechThe Leader In Power Monitoring and Smart Grid Solutions
2: Nexus® 1500 Meter Overview
2.1: Meter Features
Electro Industries’ Nexus® 1500 meter is the latest in a generation of meters that
combine high-end revenue metering with sophisticated power quality analysis.
Revenue Metering
• Delivers laboratory-grade 0.06% Watt-hour accuracy (at full load Unity PF) in a
field-mounted device
• Auto-calibrates when there is a temperature change of more than 1.5o C
• Meets ANSI C12.20 and IEC 62053-22 accuracy specifications for Class 20 meters
• Adjusts for transformer and line losses, using user-defined compensation factors
• Automatically logs time-of-use for up to eight programmable tariff registers
• Counts pulses and aggregates different loads
Power Quality
• Records up to 1024 samples per cycle on an event on all inputs
• Records sub-cycle transients on voltage or current readings
• Records high-speed voltage transients at a 50MHz sample rate, with accuracy to
10MHz
• Offers inputs for neutral-to-ground voltage measurements
• Synchronizes with IRIG-B clock signal
• Measures Flicker per IEC 61000-4-15 and IEC 61000-4-30 Class A standards;
Flicker analysis is available for Instantaneous, Short-Term, and Long-Term forms.
See Chapter 10 for more details.
Doc# E154701 2 - 2
2: Nexus® 1500 Meter Overview
Electro Industries/GaugeTechThe Leader In Power Monitoring and Smart Grid SolutionsElectro Industries/GaugeTechThe Leader In Power Monitoring and Smart Grid Solutions
RTU Features
• Advanced monitoring capabilities that provide detailed and precise pictures of any
metered point within a distribution network
• Extensive I/O capability that is available in conjunction with all metering functions.
I/O includes:
• Optional Relay Output card with 6 relay contact outputs (up to 2 Relay Output
cards can be installed in the meter)
• Optional Digital Input card with 16 status inputs (up to 2 Digital Input cards can
be installed in the meter)
• Optional External I/O modules consisting of up to 4 Analog Output modules, 1
Digital Dry Contact Relay Output module, up to 4 Digital Solid State Pulse Out-
put modules, and up to 4 Analog Input Modules.
NOTE: See Chapter 11 for detailed information on the I/O options.
• Logging of Modbus slave devices for RTU concentrator functions
Extensive Memory and Communication
• Onboard mass memory (over 1 GigaByte compact Flash) that enables the Nexus®
1500 meter to retrieve and store multiple logs
• Standard 10/100BaseT RJ45 Ethernet that allows you to connect to a PC via
Modbus/TCP, and, with V-SwitchTM keys 2 and 3, offers IEC 61850 protocol; a
second, optional Ethernet connection that can be either RJ45 or Fiber Optic
• A USB Virtual Com Port, compatible with USB1.1/USB2.0, that provides serial
communication
• Optional RS485/Pulse Output card that provides two RS485 ports and 4 pulse out-
puts that are user programmable to reflect VAR-hours, Watt-hours, or VA-hours
• Advanced Power Quality analysis that includes measuring and recording Harmonics
to the 255th order (and Real Time Harmonics to the 128th order)
• Multiple Protocols that include DNP V3.00 (see Section 2.2 for more details)
Doc# E154701 2 - 3
2: Nexus® 1500 Meter Overview
Electro Industries/GaugeTechThe Leader In Power Monitoring and Smart Grid SolutionsElectro Industries/GaugeTechThe Leader In Power Monitoring and Smart Grid Solutions
• 100msec high speed updates that are available for Control applications
• V-Switch™ technology that allows you to upgrade the meter in the field without
removing it from installation
2.2: DNP V3.00 Level 2
The Nexus® 1500 meter supports DNP V3.00 Level 2 over both serial and dual
Ethernet ports.
DNP Level 2 Features
• Up to 136 measurements (64 Binary Inputs, 8 Binary Counters, 64 Analog Inputs)
can be mapped to DNP Static Points (over 3000) in the customizable DNP Point
Map.
• Report-by-Exception Processing (DNP Events) - Deadbands can be set on a
per-point basis.
• Freeze Commands - Available commands are Freeze, Freeze/No-Ack, Freeze with
Time, and Freeze with Time/No-Ack.
• Freeze with Time Commands enable the Nexus® meter to have internal time-
driven Frozen and Frozen Event data. When the Nexus® meter receives the time
and interval, the data is created.
For complete details, download the Nexus® 1252/1262/1272/1500 DNP User manual
from our website:
www.electroind.com/dl_page.html.
2.3: V-Switch™ Technology
The Nexus® 1500 meter is equipped with V-Switch™ technology, a virtual firmware-
based switch that allows you to enable meter features through software communica-
tion. V-Switch™ technology allows the unit to be upgraded after installation without
removing it from service.
Available V-Switch™ key upgrades
V-Switch™ key 1 (V-1) - Standard meter with 128 Megabytes memory/512 samples
per cycle
Doc# E154701 2 - 4
2: Nexus® 1500 Meter Overview
Electro Industries/GaugeTechThe Leader In Power Monitoring and Smart Grid SolutionsElectro Industries/GaugeTechThe Leader In Power Monitoring and Smart Grid Solutions
V-Switch™ key 2 (V-2) - V-1 plus 1 Gigabyte memory/1024 samples per cycle
V-Switch™ key 3 (V-3) - V-2 plus 10MHz transient recording
NOTE: V-SwitchTM keys 2 and 3 also enable the IEC 61850 Protocol server for the
Main Ethernet card. See Appendix C for details.
2.3.1: Upgrading the Meter’s V-Switch™ Key
To upgrade your meter to a higher V-SwitchTM key (e.g., V-2), follow these steps:
1. Obtain a V-SwitchTM upgrade key by contacting EIG’s inside sales staff at
[email protected] or by calling 516-334-0870 (USA). You will be asked for the
following information:
a. Serial number(s) of the meter you are upgrading.
b. Desired V-SwitchTM upgrade.
c. Credit card or Purchase Order number.
2. EIG will issue you the V-SwitchTM upgrade key. To enable the key, follow these
steps:
a. Open Communicator EXT software.
b. Power up your Nexus® meter.
c. Connect to the meter via Communicator EXT. (See the Communicator EXT User
Manual for detailed instructions: you can open the manual online by clicking
Help>Contents from the Communicator EXT Main screen).
d. Click Tools>Change V-SwitchTM from the Title Bar of the Main screen. A screen
opens, requesting the encrypted key.
e. Enter the upgrade key provided by EIG.
f. Click OK. The V-SwitchTM key is enabled and the meter is reset.
Doc# E154701 2 - 5
2: Nexus® 1500 Meter Overview
Electro Industries/GaugeTechThe Leader In Power Monitoring and Smart Grid SolutionsElectro Industries/GaugeTechThe Leader In Power Monitoring and Smart Grid Solutions
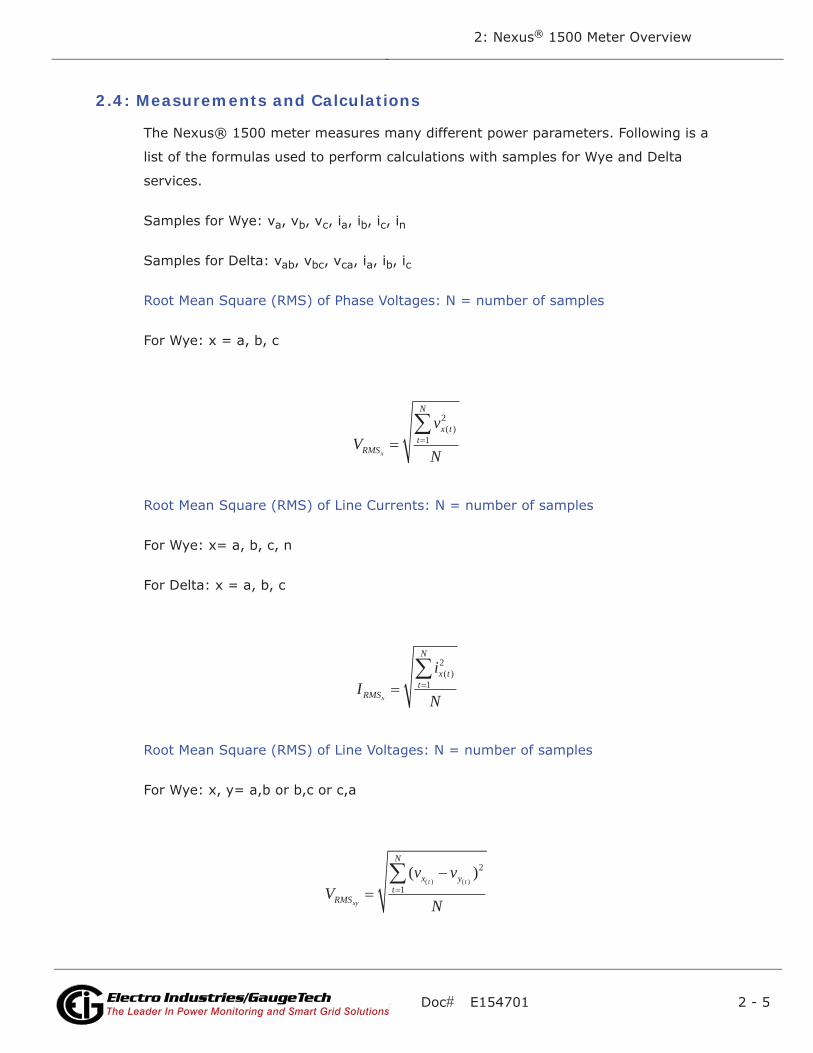
2.4: Measurements and Calculations
The Nexus® 1500 meter measures many different power parameters. Following is a
list of the formulas used to perform calculations with samples for Wye and Delta
services.
Samples for Wye: va, vb, vc, ia, ib, ic, in
Samples for Delta: vab, vbc, vca, ia, ib, ic
Root Mean Square (RMS) of Phase Voltages: N = number of samples
For Wye: x = a, b, c
Root Mean Square (RMS) of Line Currents: N = number of samples
For Wye: x= a, b, c, n
For Delta: x = a, b, c
Root Mean Square (RMS) of Line Voltages: N = number of samples
For Wye: x, y= a,b or b,c or c,a
Vv
NRMS
x tt
N
x
( )2
1
Ii
NRMS
x tt
N
x
( )2
1
Vv v
NRMS
x yt
N
xy
t t( )
( ) ( )
2
1
Doc# E154701 2 - 6
2: Nexus® 1500 Meter Overview
Electro Industries/GaugeTechThe Leader In Power Monitoring and Smart Grid SolutionsElectro Industries/GaugeTechThe Leader In Power Monitoring and Smart Grid Solutions
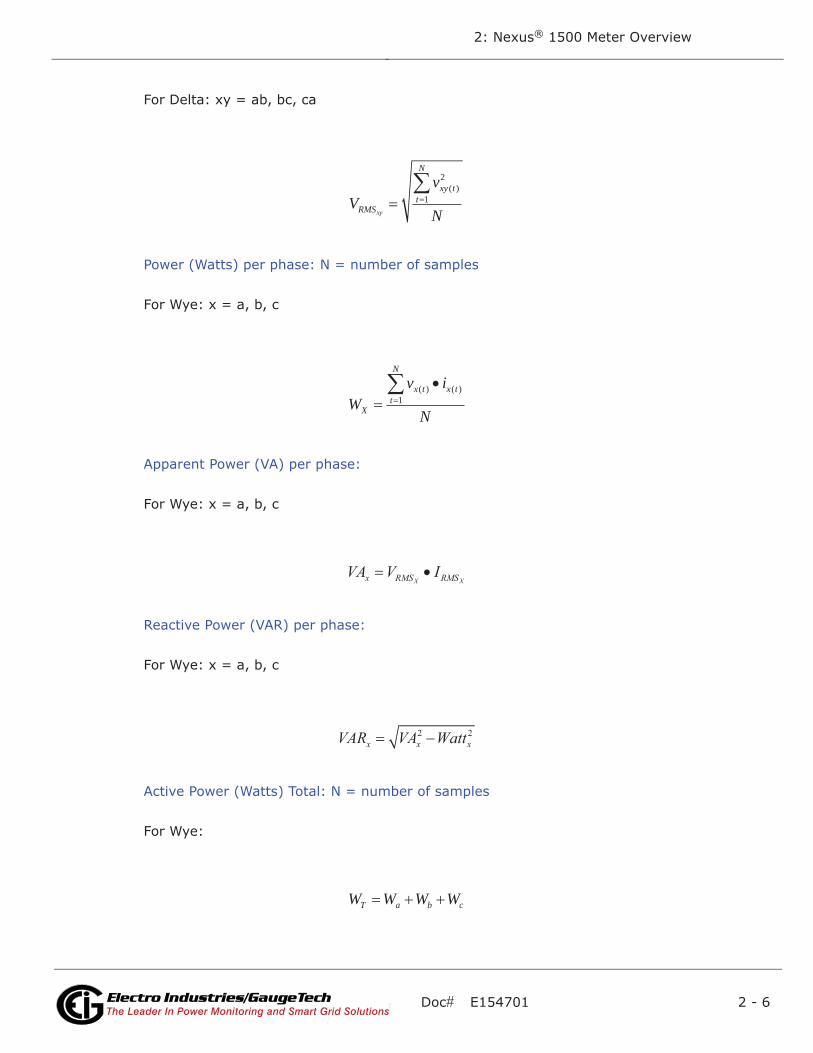
For Delta: xy = ab, bc, ca
Power (Watts) per phase: N = number of samples
For Wye: x = a, b, c
Apparent Power (VA) per phase:
For Wye: x = a, b, c
Reactive Power (VAR) per phase:
For Wye: x = a, b, c
Active Power (Watts) Total: N = number of samples
For Wye:
Vv
NRMS
xy tt
N
xy
( )2
1
Wv i
NX
x t x tt
N
( ) ( )1
X Xx RMS RMSVA V I
2 2x x xVAR VA Watt
W W W WT a b c
Doc# E154701 2 - 7
2: Nexus® 1500 Meter Overview
Electro Industries/GaugeTechThe Leader In Power Monitoring and Smart Grid SolutionsElectro Industries/GaugeTechThe Leader In Power Monitoring and Smart Grid Solutions
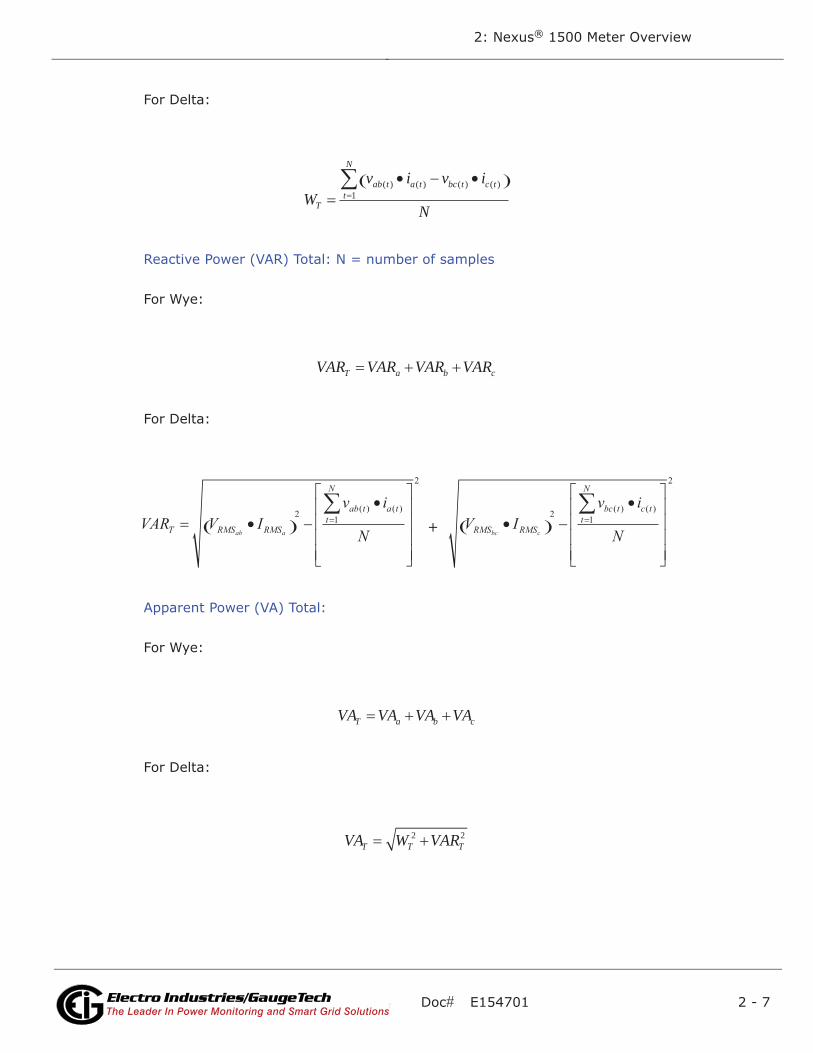
For Delta:
Reactive Power (VAR) Total: N = number of samples
For Wye:
For Delta:
Apparent Power (VA) Total:
For Wye:
For Delta:
Wv i v i
NT
ab t a t bc t c tt
N
( ) ( ) ( ) ( )1
VAR VAR VAR VART a b c
VAR V Iv i
NT RMS RMS
ab t a tt
N
ab a= •( ) −
•⎡
⎣
⎢⎢⎢⎢
⎤
⎦
⎥⎥⎥⎥
=∑2 1
2
( ) ( )
V Iv i
NRMS RMS
bc t c tt
N
bc c•( ) −
•⎡
⎣
⎢⎢⎢⎢
⎤
⎦
⎥⎥⎥⎥
=∑2 1
2
( ) ( )
+
VA VA VA VAT a b c
VA W VART T T2 2
Doc# E154701 2 - 8
2: Nexus® 1500 Meter Overview
Electro Industries/GaugeTechThe Leader In Power Monitoring and Smart Grid SolutionsElectro Industries/GaugeTechThe Leader In Power Monitoring and Smart Grid Solutions
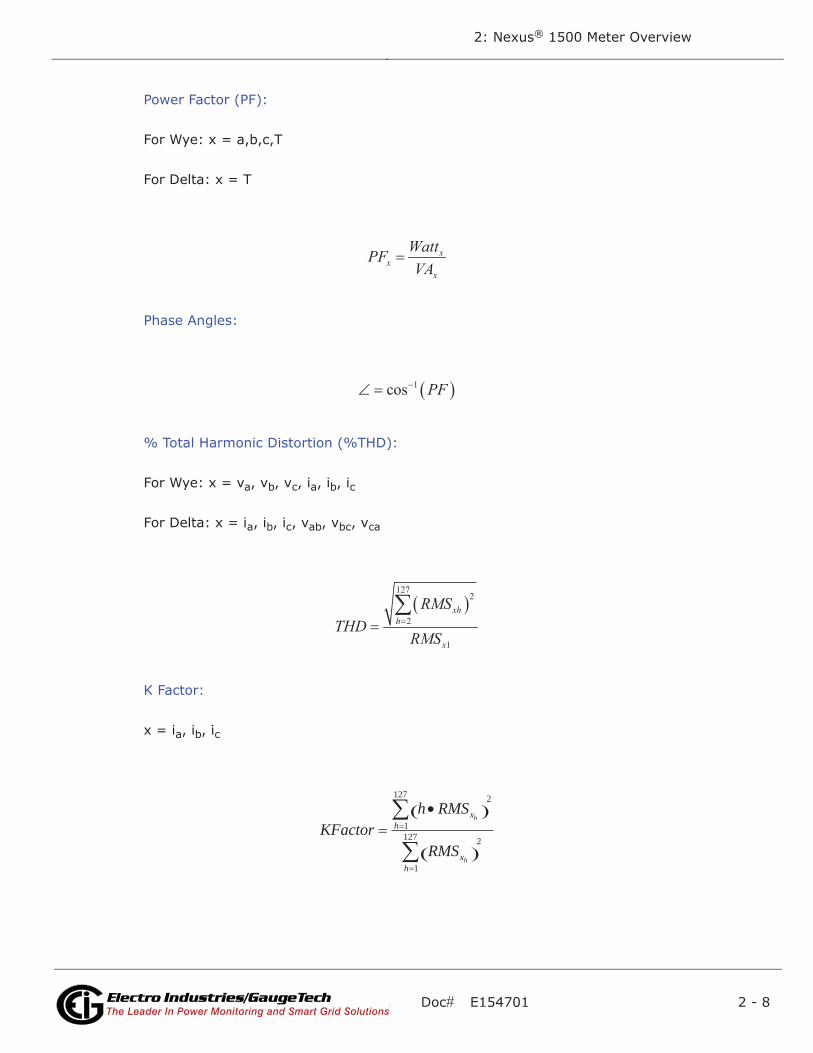
Power Factor (PF):
For Wye: x = a,b,c,T
For Delta: x = T
Phase Angles:
% Total Harmonic Distortion (%THD):
For Wye: x = va, vb, vc, ia, ib, ic
For Delta: x = ia, ib, ic, vab, vbc, vca
K Factor:
x = ia, ib, ic
xx
x
WattPFVA
1cos PF
1272
2
1
xhh
x
RMSTHD
RMS
KFactorh RMS
RMS
xh
xh
h
h
2
1
127
2
1
127
Doc# E154701 2 - 9
2: Nexus® 1500 Meter Overview
Electro Industries/GaugeTechThe Leader In Power Monitoring and Smart Grid SolutionsElectro Industries/GaugeTechThe Leader In Power Monitoring and Smart Grid Solutions
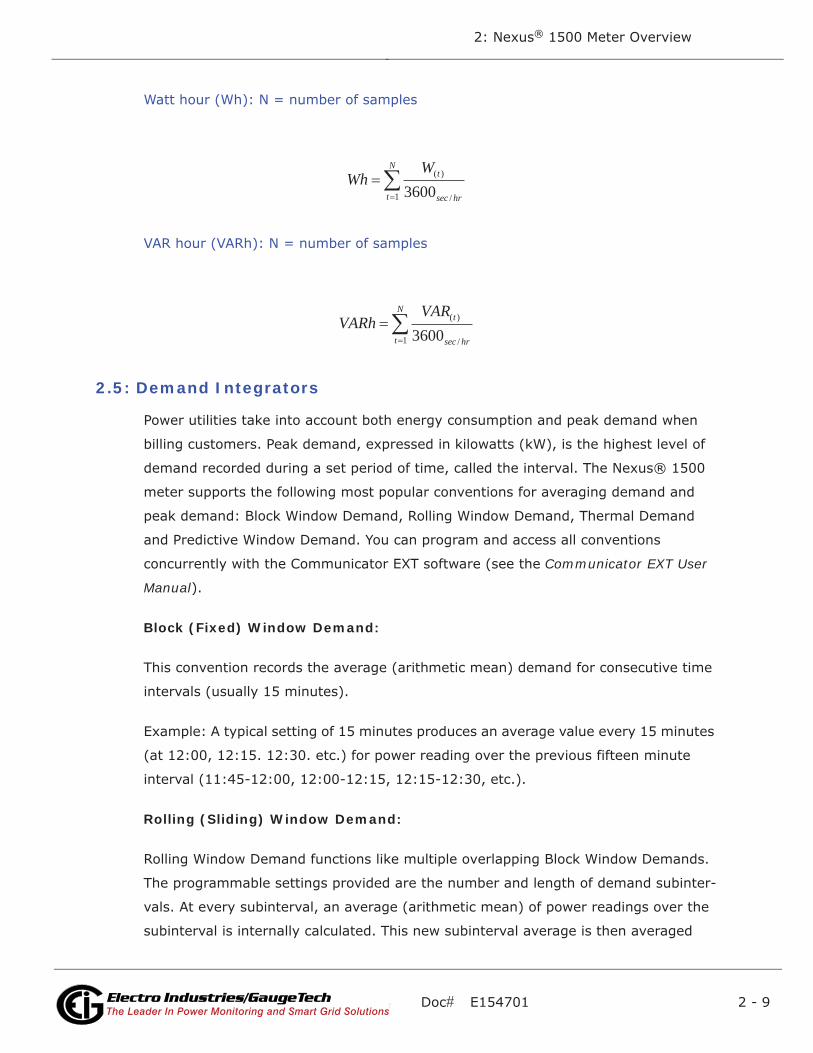
Watt hour (Wh): N = number of samples
VAR hour (VARh): N = number of samples
2.5: Demand Integrators
Power utilities take into account both energy consumption and peak demand when
billing customers. Peak demand, expressed in kilowatts (kW), is the highest level of
demand recorded during a set period of time, called the interval. The Nexus® 1500
meter supports the following most popular conventions for averaging demand and
peak demand: Block Window Demand, Rolling Window Demand, Thermal Demand
and Predictive Window Demand. You can program and access all conventions
concurrently with the Communicator EXT software (see the Communicator EXT User
Manual).
Block (Fixed) Window Demand:
This convention records the average (arithmetic mean) demand for consecutive time
intervals (usually 15 minutes).
Example: A typical setting of 15 minutes produces an average value every 15 minutes
(at 12:00, 12:15. 12:30. etc.) for power reading over the previous fifteen minute
interval (11:45-12:00, 12:00-12:15, 12:15-12:30, etc.).
Rolling (Sliding) Window Demand:
Rolling Window Demand functions like multiple overlapping Block Window Demands.
The programmable settings provided are the number and length of demand subinter-
vals. At every subinterval, an average (arithmetic mean) of power readings over the
subinterval is internally calculated. This new subinterval average is then averaged
WhW t
sec hrt
N( )
/36001
VARhVAR t
sec hrt
N( )
/36001
Doc# E154701 2 - 10
2: Nexus® 1500 Meter Overview
Electro Industries/GaugeTechThe Leader In Power Monitoring and Smart Grid SolutionsElectro Industries/GaugeTechThe Leader In Power Monitoring and Smart Grid Solutions
(arithmetic mean), with as many previous subinterval averages as programmed, to
produce the Rolling Window Demand.
Example: With settings of 3 five-minute subintervals, subinterval averages are
computed every 5 minutes (12:00, 12:05, 12:10, 12:15, etc.) for power readings
over the previous five-minute interval (11:55-12:00, 12:00-12:05, 12:05-12:10,
12:10-12:15, etc.). Further, every 5 minutes, the subinterval averages are averaged
in groups of 3 (12:00. 12:05, 12:10, 12:15. etc.) to produce a fifteen (5x3) minute
average every 5 minutes (rolling (sliding) every 5 minutes) (11:55-12:10, 12:00-
12:15, etc.).
Thermal Demand:
Traditional analog Watt-hour (Wh) meters use heat-sensitive elements to measure
temperature rises produced by an increase in current flowing through the meter. A
pointer moves in proportion to the temperature change, providing a record of
demand. The pointer remains at peak level until a subsequent increase in demand
moves it again, or until it is manually reset. The Nexus® 1500 meter mimics
traditional meters to provide Thermal Demand readings.
Each second, as a new power level is computed, a recurrence relation formula is
applied. This formula recomputes the thermal demand by averaging a small portion of
the new power value with a large portion of the previous thermal demand value. The
proportioning of new to previous is programmable, set by an averaging interval. The
averaging interval represents a 90% change in thermal demand to a step change in
power.
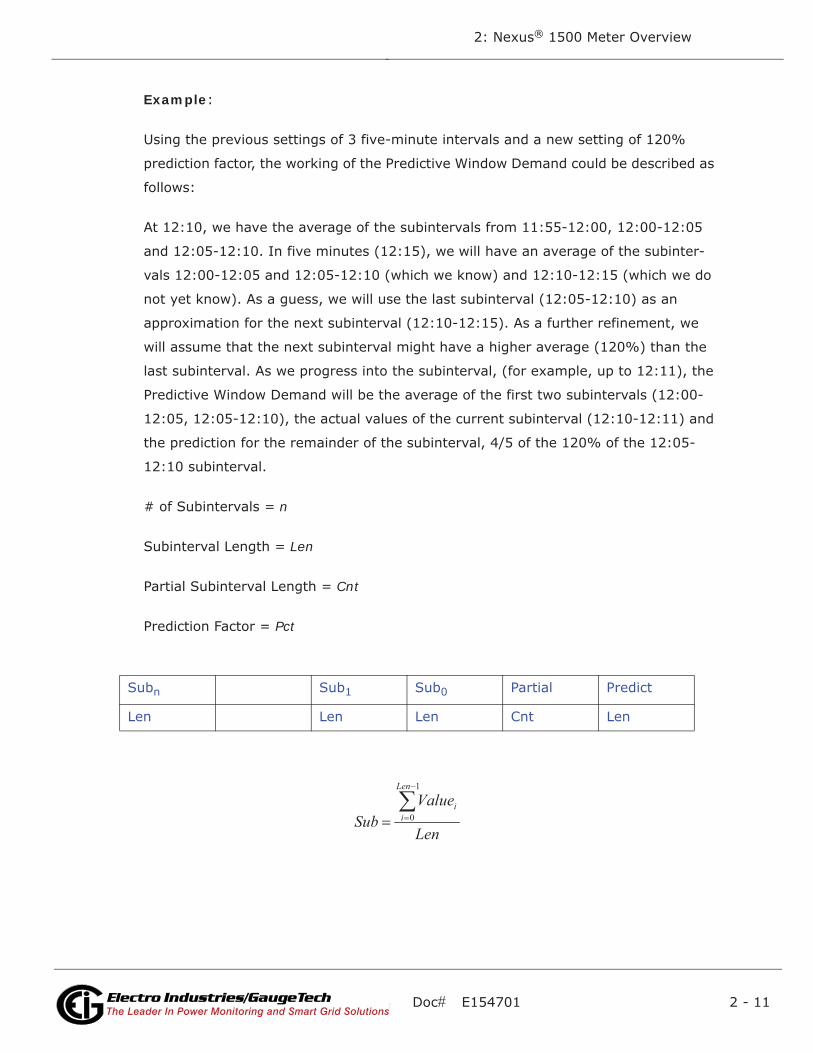
Predictive Window Demand:
Predictive Window Demand enables the user to forecast average demand for future
time intervals. The Nexus® meter uses the delta rate of change of a Rolling Window
Demand interval to predict average demand for an approaching time period. The user
can set a relay or alarm to signal when the Predictive Window reaches a specific level,
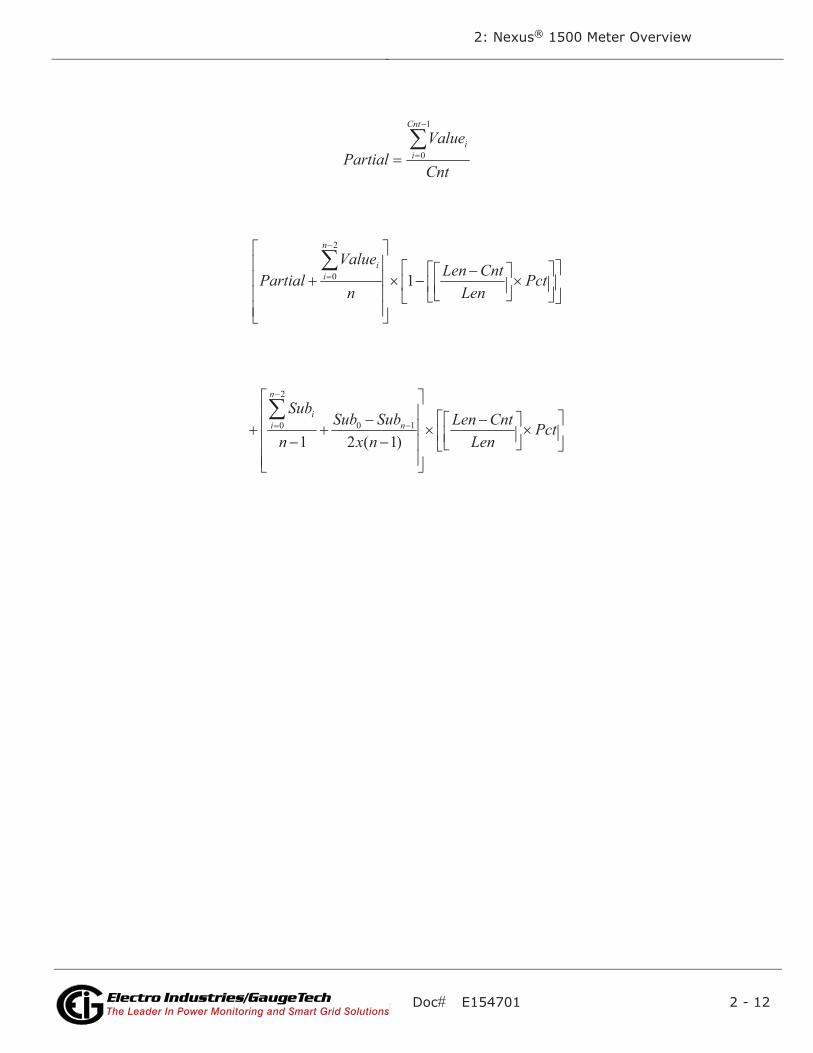
thereby avoiding unacceptable demand levels. The Nexus® 1500 calculates Predictive
Window Demand using the following formula.
Doc# E154701 2 - 11
2: Nexus® 1500 Meter Overview
Electro Industries/GaugeTechThe Leader In Power Monitoring and Smart Grid SolutionsElectro Industries/GaugeTechThe Leader In Power Monitoring and Smart Grid Solutions
Example:
Using the previous settings of 3 five-minute intervals and a new setting of 120%
prediction factor, the working of the Predictive Window Demand could be described as
follows:
At 12:10, we have the average of the subintervals from 11:55-12:00, 12:00-12:05
and 12:05-12:10. In five minutes (12:15), we will have an average of the subinter-
vals 12:00-12:05 and 12:05-12:10 (which we know) and 12:10-12:15 (which we do
not yet know). As a guess, we will use the last subinterval (12:05-12:10) as an
approximation for the next subinterval (12:10-12:15). As a further refinement, we
will assume that the next subinterval might have a higher average (120%) than the
last subinterval. As we progress into the subinterval, (for example, up to 12:11), the
Predictive Window Demand will be the average of the first two subintervals (12:00-
12:05, 12:05-12:10), the actual values of the current subinterval (12:10-12:11) and
the prediction for the remainder of the subinterval, 4/5 of the 120% of the 12:05-
12:10 subinterval.
# of Subintervals = n
Subinterval Length = Len
Partial Subinterval Length = Cnt
Prediction Factor = Pct
Table 1:
Subn Sub1 Sub0 Partial Predict
Len Len Len Cnt Len
Len
ValueSub
Len
ii
1
0
Doc# E154701 2 - 12
2: Nexus® 1500 Meter Overview
Electro Industries/GaugeTechThe Leader In Power Monitoring and Smart Grid SolutionsElectro Industries/GaugeTechThe Leader In Power Monitoring and Smart Grid Solutions
Cnt
ValuePartial
Cnt
ii
1
0
PctLenCntLen
n
ValuePartial
n
ii
1
2
0
PctLenCntLen
nxSubSub
n
Subn
n
ii
)1(2110
2
0
Doc# E154701 2 - 13
2: Nexus® 1500 Meter Overview
Electro Industries/GaugeTechThe Leader In Power Monitoring and Smart Grid SolutionsElectro Industries/GaugeTechThe Leader In Power Monitoring and Smart Grid Solutions
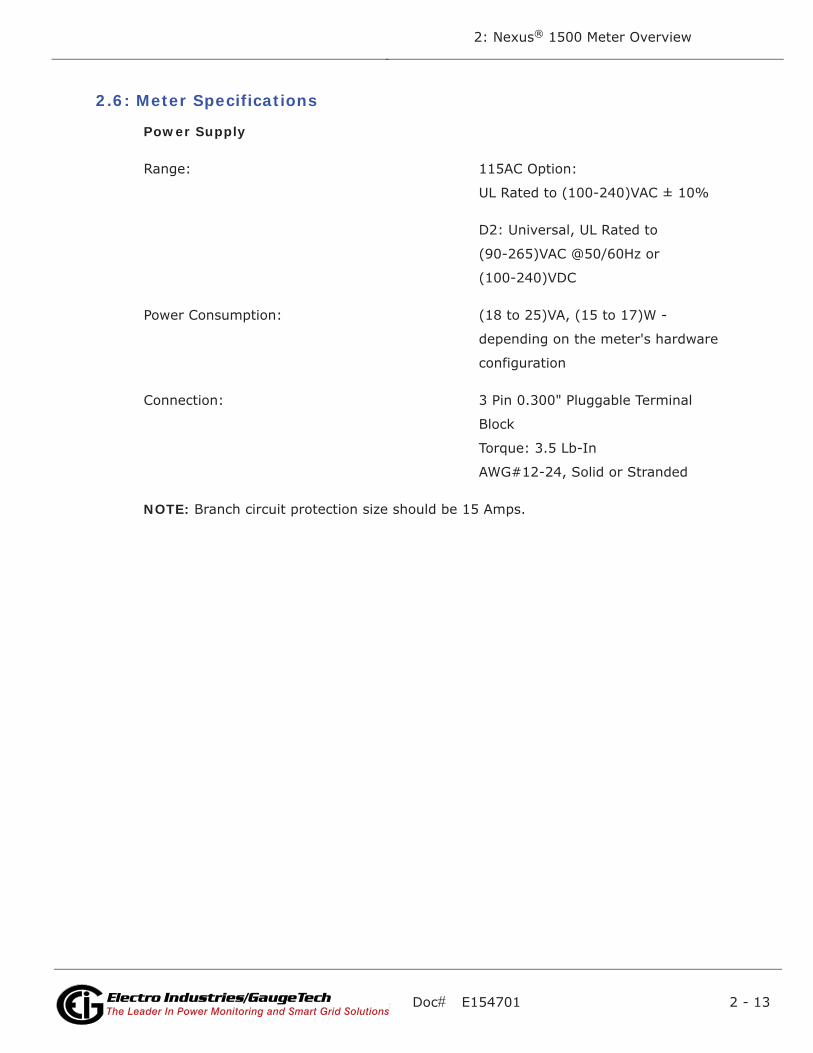
2.6: Meter Specifications
Power Supply
Range: 115AC Option:
UL Rated to (100-240)VAC ± 10%
D2: Universal, UL Rated to
(90-265)VAC @50/60Hz or
(100-240)VDC
Power Consumption: (18 to 25)VA, (15 to 17)W -
depending on the meter's hardware
configuration
Connection: 3 Pin 0.300" Pluggable Terminal
Block
Torque: 3.5 Lb-In
AWG#12-24, Solid or Stranded
NOTE: Branch circuit protection size should be 15 Amps.
Doc# E154701 2 - 14
2: Nexus® 1500 Meter Overview
Electro Industries/GaugeTechThe Leader In Power Monitoring and Smart Grid SolutionsElectro Industries/GaugeTechThe Leader In Power Monitoring and Smart Grid Solutions
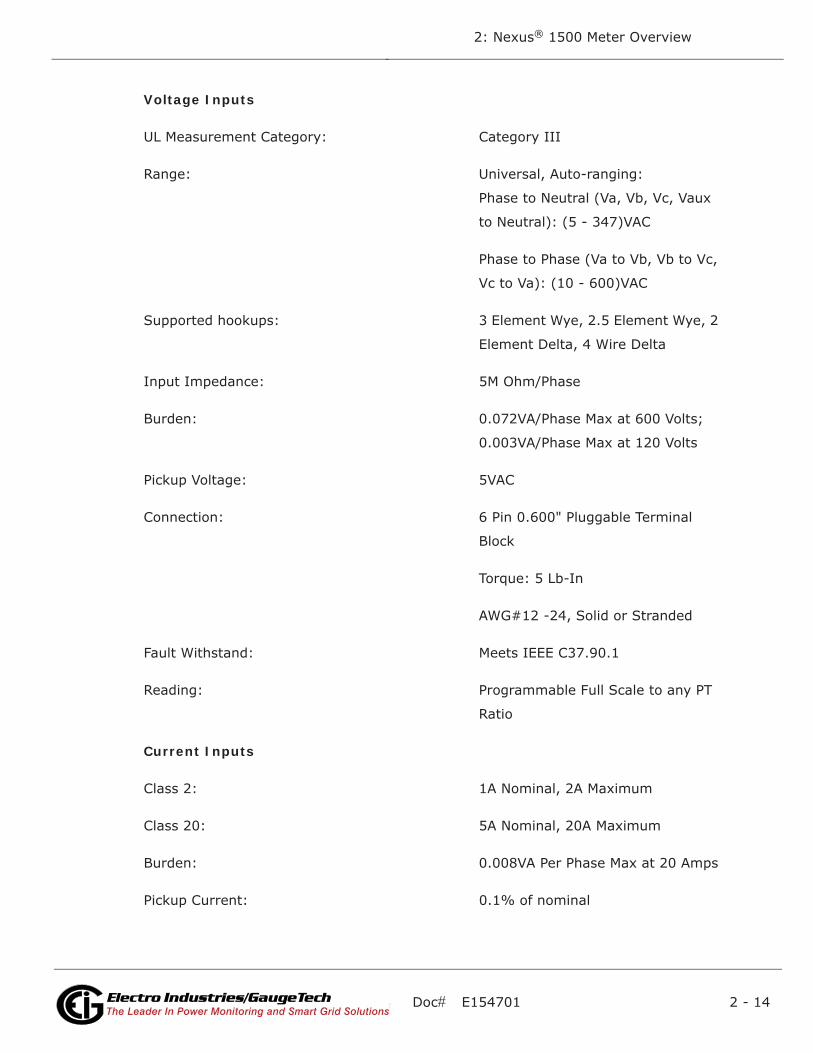
Voltage Inputs
UL Measurement Category: Category III
Range: Universal, Auto-ranging:
Phase to Neutral (Va, Vb, Vc, Vaux
to Neutral): (5 - 347)VAC
Phase to Phase (Va to Vb, Vb to Vc,
Vc to Va): (10 - 600)VAC
Supported hookups: 3 Element Wye, 2.5 Element Wye, 2
Element Delta, 4 Wire Delta
Input Impedance: 5M Ohm/Phase
Burden: 0.072VA/Phase Max at 600 Volts;
0.003VA/Phase Max at 120 Volts
Pickup Voltage: 5VAC
Connection: 6 Pin 0.600" Pluggable Terminal
Block
Torque: 5 Lb-In
AWG#12 -24, Solid or Stranded
Fault Withstand: Meets IEEE C37.90.1
Reading: Programmable Full Scale to any PT
Ratio
Current Inputs
Class 2: 1A Nominal, 2A Maximum
Class 20: 5A Nominal, 20A Maximum
Burden: 0.008VA Per Phase Max at 20 Amps
Pickup Current: 0.1% of nominal
Doc# E154701 2 - 15
2: Nexus® 1500 Meter Overview
Electro Industries/GaugeTechThe Leader In Power Monitoring and Smart Grid SolutionsElectro Industries/GaugeTechThe Leader In Power Monitoring and Smart Grid Solutions
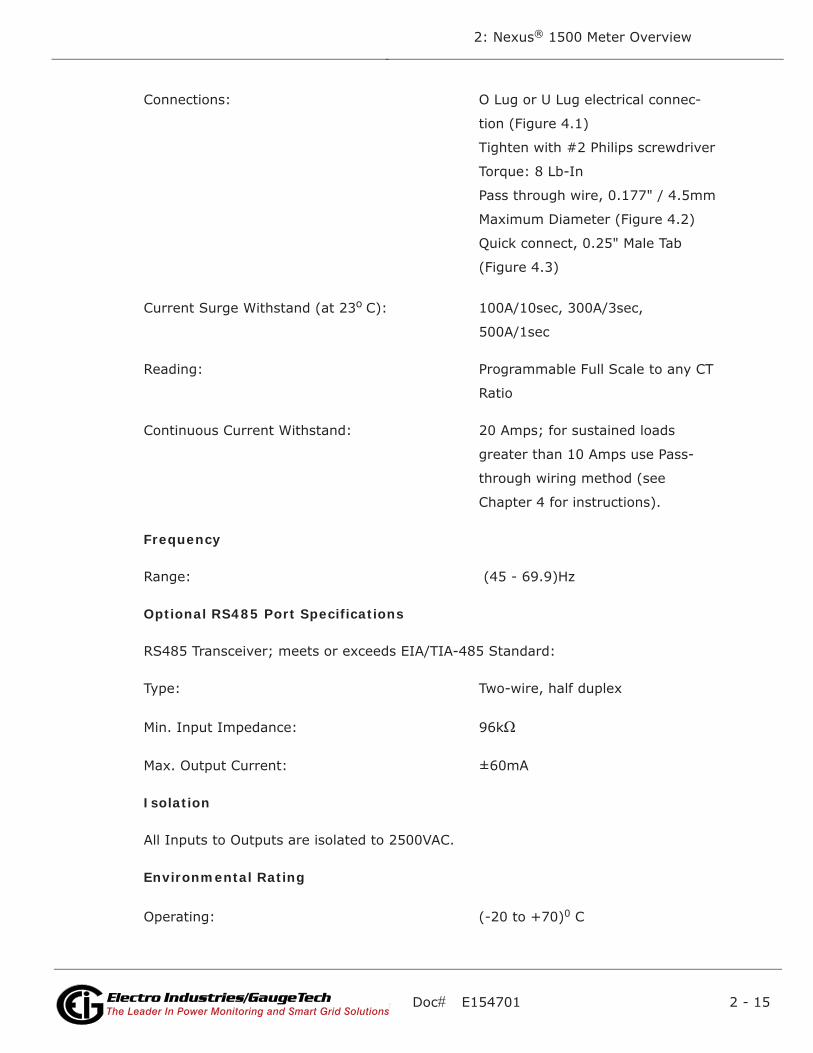
Connections: O Lug or U Lug electrical connec-
tion (Figure 4.1)
Tighten with #2 Philips screwdriver
Torque: 8 Lb-In
Pass through wire, 0.177" / 4.5mm
Maximum Diameter (Figure 4.2)
Quick connect, 0.25" Male Tab
(Figure 4.3)
Current Surge Withstand (at 23o C): 100A/10sec, 300A/3sec,
500A/1sec
Reading: Programmable Full Scale to any CT
Ratio
Continuous Current Withstand: 20 Amps; for sustained loads
greater than 10 Amps use Pass-
through wiring method (see
Chapter 4 for instructions).
Frequency
Range: (45 - 69.9)Hz
Optional RS485 Port Specifications
RS485 Transceiver; meets or exceeds EIA/TIA-485 Standard:
Type: Two-wire, half duplex
Min. Input Impedance: 96k
Max. Output Current: ±60mA
Isolation
All Inputs to Outputs are isolated to 2500VAC.
Environmental Rating
Operating: (-20 to +70)0 C
Doc# E154701 2 - 16
2: Nexus® 1500 Meter Overview
Electro Industries/GaugeTechThe Leader In Power Monitoring and Smart Grid SolutionsElectro Industries/GaugeTechThe Leader In Power Monitoring and Smart Grid Solutions
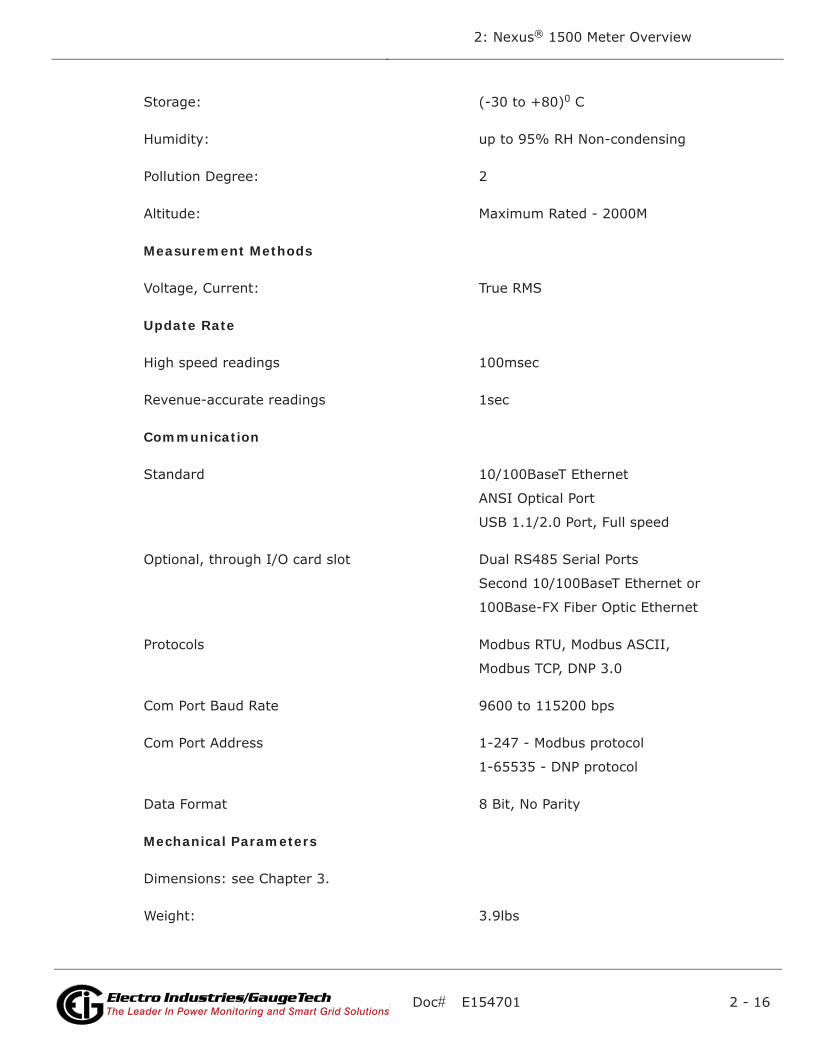
Storage: (-30 to +80)0 C
Humidity: up to 95% RH Non-condensing
Pollution Degree: 2
Altitude: Maximum Rated - 2000M
Measurement Methods
Voltage, Current: True RMS
Update Rate
High speed readings 100msec
Revenue-accurate readings 1sec
Communication
Standard 10/100BaseT Ethernet
ANSI Optical Port
USB 1.1/2.0 Port, Full speed
Optional, through I/O card slot Dual RS485 Serial Ports
Second 10/100BaseT Ethernet or
100Base-FX Fiber Optic Ethernet
Protocols Modbus RTU, Modbus ASCII,
Modbus TCP, DNP 3.0
Com Port Baud Rate 9600 to 115200 bps
Com Port Address 1-247 - Modbus protocol
1-65535 - DNP protocol
Data Format 8 Bit, No Parity
Mechanical Parameters
Dimensions: see Chapter 3.
Weight: 3.9lbs

Doc# E154701 2 - 17
2: Nexus® 1500 Meter Overview
Electro Industries/GaugeTechThe Leader In Power Monitoring and Smart Grid SolutionsElectro Industries/GaugeTechThe Leader In Power Monitoring and Smart Grid Solutions
2.7: Standards Compliance
UL Listing: UL/CUL, File Number E250818
CE Marked (IEC 61326-1)
FCC Part 15, Subpart B, Class A
IEC 62053-22 (0.2% Accuracy)
ANSI C12.20 (0.2% Accuracy)
ANSI (IEEE) C37.90.1 Surge Withstand
ANSI C62.41 (Burst)
IEC 61000-4-2 - ESD
IEC 61000-4-3 - Radiated Immunity
IEC 61000-4-4 - Fast Transient
IEC 61000-4-5 - Surge Immunity
IEC 61000-4-7 - Harmonics
IEC 61000-4-15 - Flicker Meter
IEC 61000-4-30 - Class A

Doc# E154701 2 - 18
2: Nexus® 1500 Meter Overview
Electro Industries/GaugeTechThe Leader In Power Monitoring and Smart Grid SolutionsElectro Industries/GaugeTechThe Leader In Power Monitoring and Smart Grid Solutions
This page intentionally left blank.

Doc# E154701 3 - 1
3: Hardware Installation
Electro Industries/GaugeTechThe Leader In Power Monitoring and Smart Grid SolutionsElectro Industries/GaugeTechThe Leader In Power Monitoring and Smart Grid Solutions
3: Hardware Installation
3.1: Mounting the Nexus® 1500 Meter
The Nexus® 1500 meter is designed to mount in a panel. Refer to Section 3.2 for
meter and panel cut-out dimensions, and Section 3.3 for mounting instructions.
NOTE: The figures shown in this chapter depict horizontal installation, but you can
also mount the meter vertically. You can then rotate the display screens to support
vertical installation (see Chapter 6 for instructions).
To clean the unit, wipe it with a clean, dry cloth.
Maintain the following conditions:
• Operating Temperature: -20°C to +70°C / -4.0°F to +158°F
• Storage Temperature: -30°C to +80°C / -22°F to +176°F
• Relative Humidity: 95% non-condensing
3.2: Meter and Panel Cut-out Dimensions
Figure 3.1: Meter Dimensions (Front)
10.74”[27.28cm]
6.96” [17.68cm]
6.74” [17.12cm]
Doc# E154701 3 - 2
3: Hardware Installation
Electro Industries/GaugeTechThe Leader In Power Monitoring and Smart Grid SolutionsElectro Industries/GaugeTechThe Leader In Power Monitoring and Smart Grid Solutions
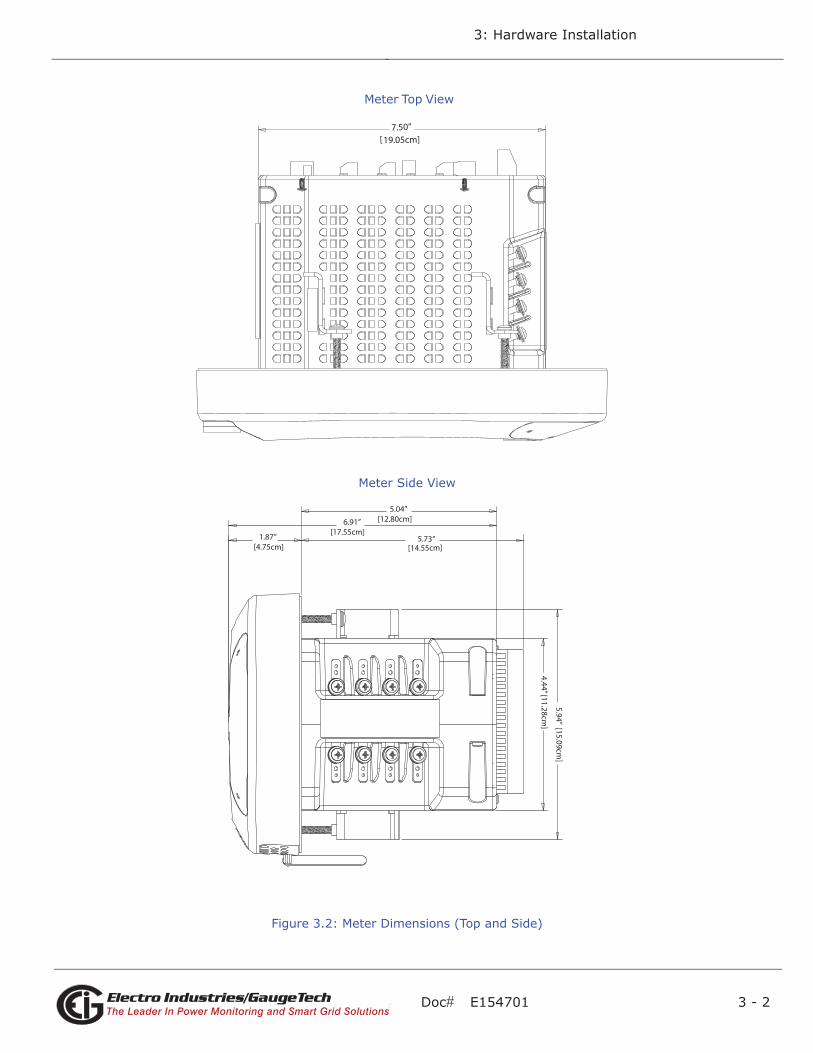
Meter Top View
Meter Side View
Figure 3.2: Meter Dimensions (Top and Side)
7.50”[19.05cm]
5.04”[12.80cm] 6.91”
[17.55cm]5.73”
[14.55cm] 1.87”[4.75cm]
5.94” [15.09cm]
4.44” [11.28cm]
Doc# E154701 3 - 3
3: Hardware Installation
Electro Industries/GaugeTechThe Leader In Power Monitoring and Smart Grid SolutionsElectro Industries/GaugeTechThe Leader In Power Monitoring and Smart Grid Solutions
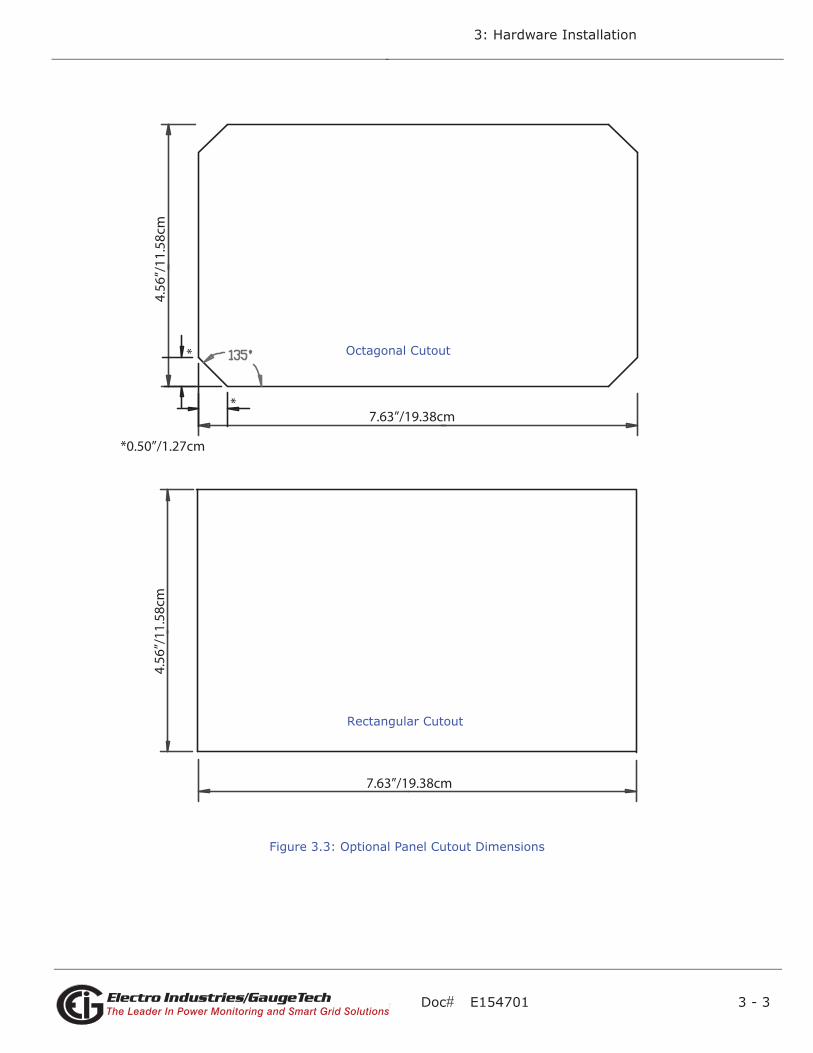
Figure 3.3: Optional Panel Cutout Dimensions
Octagonal Cutout
4.56
”/11
.58c
m
7.63”/19.38cm
*0.50”/1.27cm
*
*
Octagonal Cutout
4.56
”/11
.58c
m
7.63”/19.38cm
Rectangular Cutout

Doc# E154701 3 - 4
3: Hardware Installation
Electro Industries/GaugeTechThe Leader In Power Monitoring and Smart Grid SolutionsElectro Industries/GaugeTechThe Leader In Power Monitoring and Smart Grid Solutions
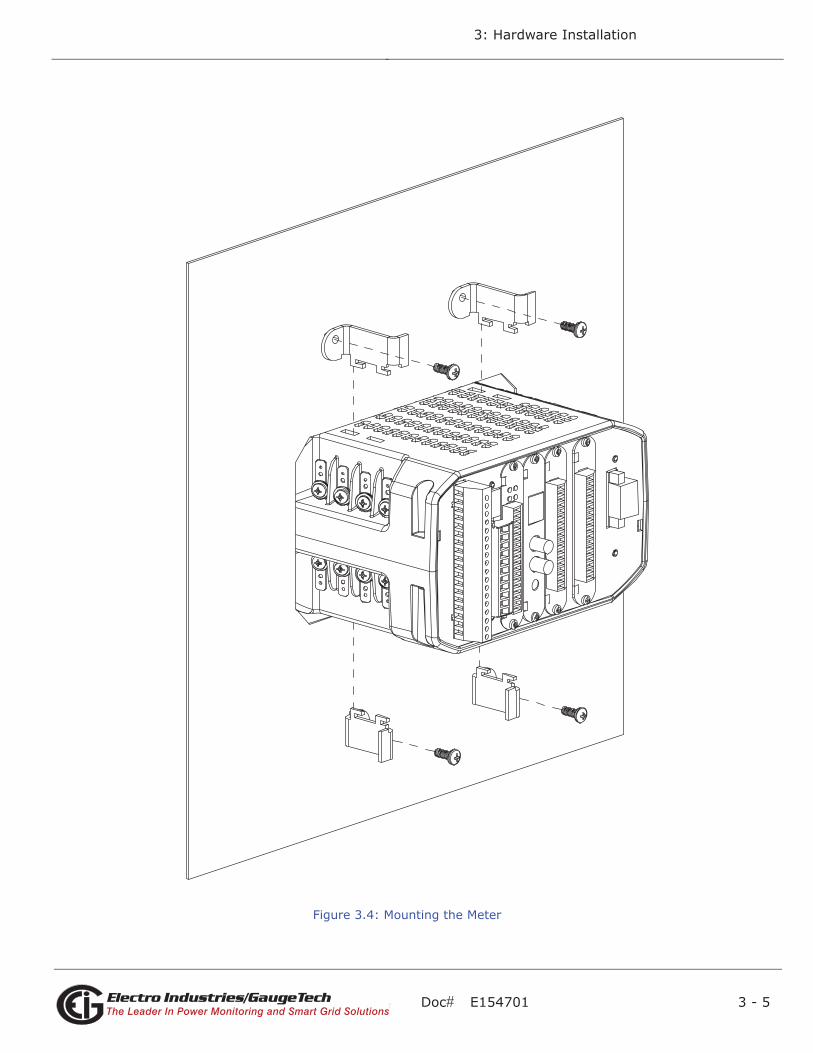
3.3: Mounting Instructions
1. Slide the meter into the panel.
2. From the back of the panel, slide 4 mounting brackets into the grooves on the top
and bottom of the meter housing (2 fit on the top and 2 fit on the bottom).
3. Snap the mounting brackets into place.
4. Secure the meter to the panel with lock washer and a #8 screw in each of the 4
mounting brackets (see Figure 3.4).
5. Tighten the screws with a #2 Phillips screwdriver. Do not over-tighten. Maximum
installation torque is 3.5 Lb-In.
NOTE: If necessary, replacement mounting brackets (Part number E145316) may
be purchased from EIG.
Doc# E154701 3 - 5
3: Hardware Installation
Electro Industries/GaugeTechThe Leader In Power Monitoring and Smart Grid SolutionsElectro Industries/GaugeTechThe Leader In Power Monitoring and Smart Grid Solutions
Figure 3.4: Mounting the Meter
Doc# E154701 3 - 6
3: Hardware Installation
Electro Industries/GaugeTechThe Leader In Power Monitoring and Smart Grid SolutionsElectro Industries/GaugeTechThe Leader In Power Monitoring and Smart Grid Solutions
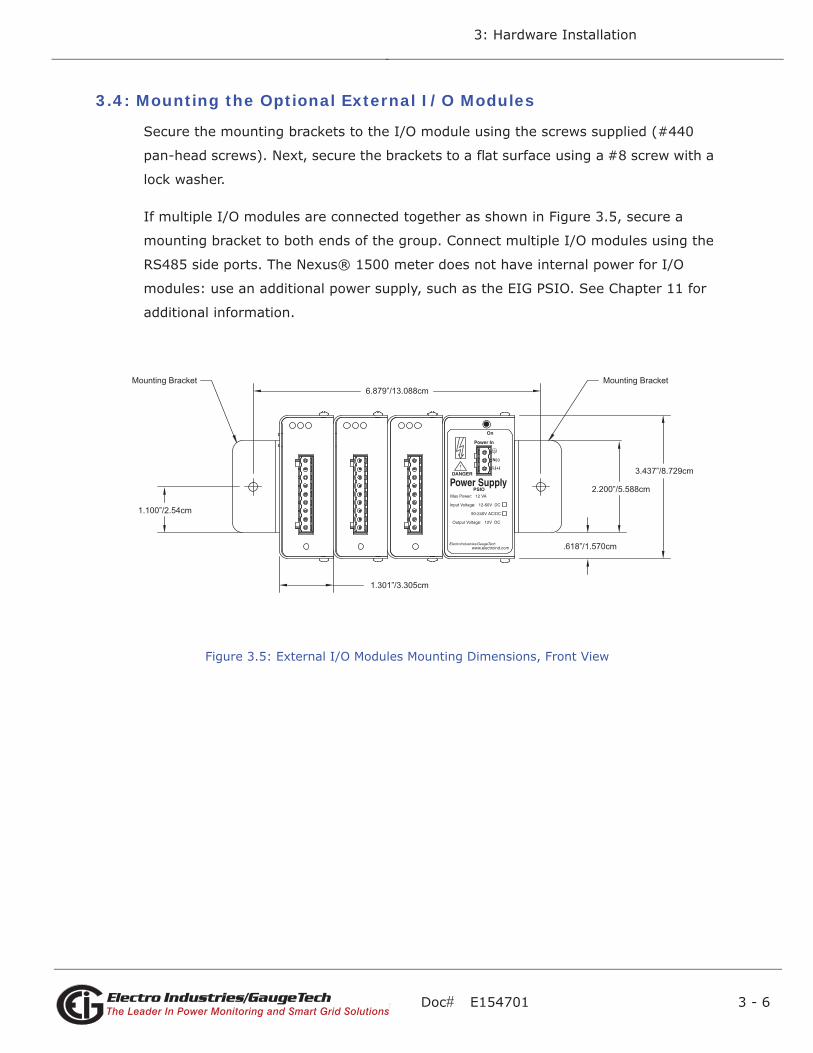
3.4: Mounting the Optional External I/O Modules
Secure the mounting brackets to the I/O module using the screws supplied (#440
pan-head screws). Next, secure the brackets to a flat surface using a #8 screw with a
lock washer.
If multiple I/O modules are connected together as shown in Figure 3.5, secure a
mounting bracket to both ends of the group. Connect multiple I/O modules using the
RS485 side ports. The Nexus® 1500 meter does not have internal power for I/O
modules: use an additional power supply, such as the EIG PSIO. See Chapter 11 for
additional information.
Figure 3.5: External I/O Modules Mounting Dimensions, Front View
Mounting Bracket6.879”/13.088cm
1.100”/2.54cm
1.301”/3.305cm
.618”/1.570cm
2.200”/5.588cm
3.437”/8.729cm
Mounting Bracket
Doc# E154701 3 - 7
3: Hardware Installation
Electro Industries/GaugeTechThe Leader In Power Monitoring and Smart Grid SolutionsElectro Industries/GaugeTechThe Leader In Power Monitoring and Smart Grid Solutions
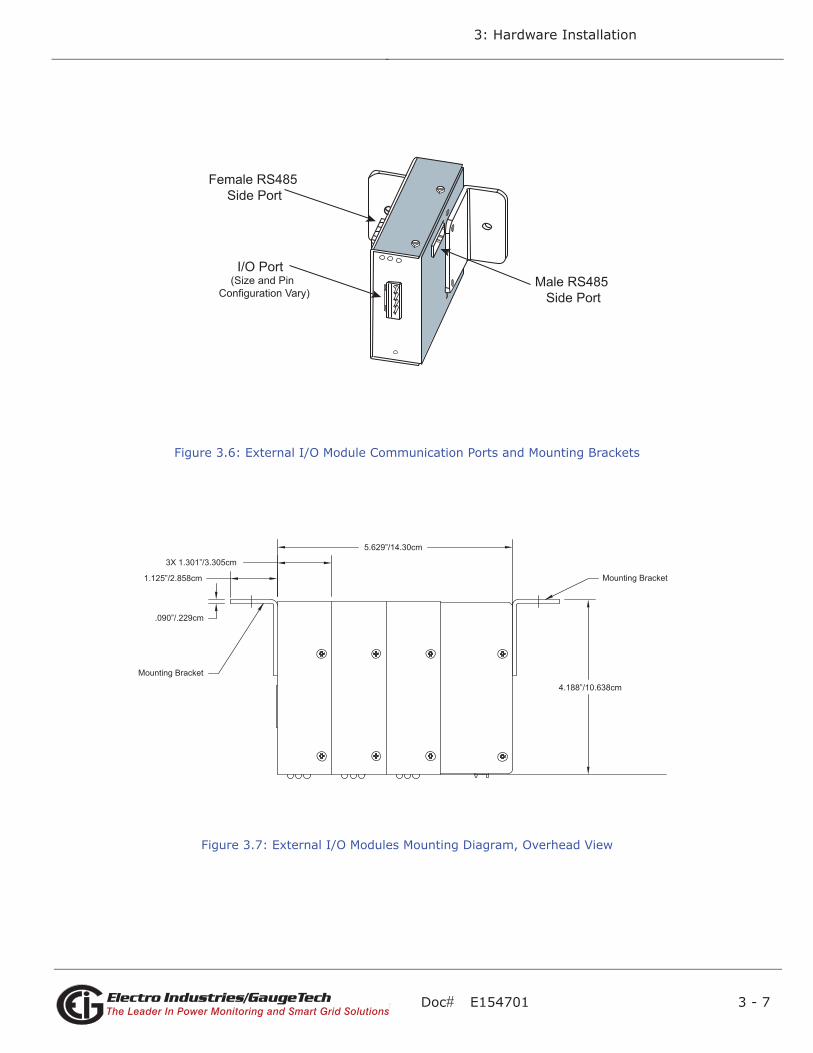
Figure 3.6: External I/O Module Communication Ports and Mounting Brackets
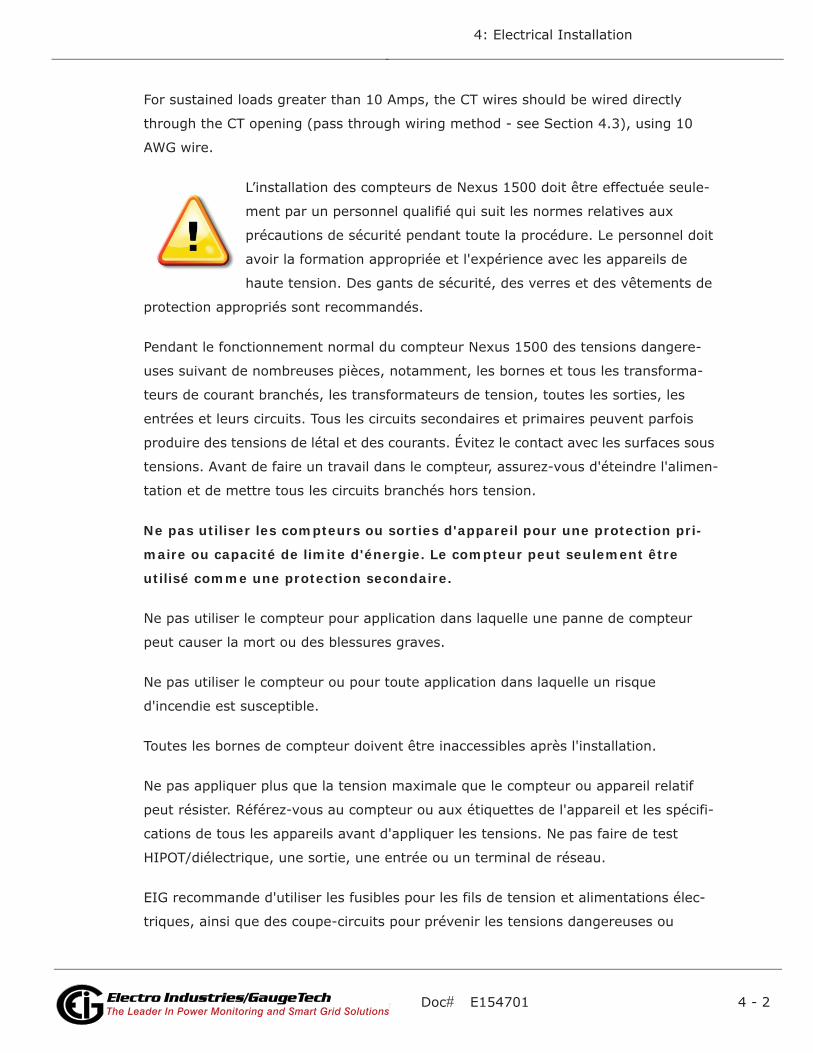
Figure 3.7: External I/O Modules Mounting Diagram, Overhead View
Male RS485 Side Port
Female RS485 Side Port
I/O Port (Size and PinConfiguration Vary)
Mounting Bracket
Mounting Bracket
5.629”/14.30cm
4.188”/10.638cm
.090”/.229cm
3X 1.301”/3.305cm
1.125”/2.858cm

Doc# E154701 3 - 8
3: Hardware Installation
Electro Industries/GaugeTechThe Leader In Power Monitoring and Smart Grid SolutionsElectro Industries/GaugeTechThe Leader In Power Monitoring and Smart Grid Solutions
This page intentionally left blank.

Doc# E154701 4 - 1
4: Electrical Installation
Electro Industries/GaugeTechThe Leader In Power Monitoring and Smart Grid SolutionsElectro Industries/GaugeTechThe Leader In Power Monitoring and Smart Grid Solutions
4: Electrical Installation
4.1: Considerations When Installing Meters
Installation of the Nexus® 1500 meter must be performed only by
qualified personnel who follow standard safety precautions during all
procedures. Those personnel should have appropriate training and
experience with high voltage devices. Appropriate safety gloves, safety
glasses and protective clothing are recommended.
During normal operation of the Nexus® 1500 meter, dangerous voltages flow through
many parts of the meter, including: Terminals and any connected CTs (Current Trans-
formers) and PTs (Potential Transformers), all I/O (Inputs and Outputs) and their
circuits. All Primary and Secondary circuits can, at times, produce lethal voltages and
currents. Avoid contact with any current-carrying surfaces.
Do not use the meter for primary protection or in an energy-limiting capac-
ity. The meter can only be used as secondary protection.
Do not use the meter for applications where failure of the meter may cause harm or
death.
Do not use the meter for any application where there may be a risk of fire.
All meter terminals should be inaccessible after installation.
Do not apply more than the maximum voltage the meter or any attached device can
withstand. Refer to meter and/or device labels and to the Specifications for all devices
before applying voltages.
Do not HIPOT/Dielectric test any Outputs, Inputs or Communications terminals.
EIG recommends the use of Fuses for voltage leads and power supply, and shorting
blocks to prevent hazardous voltage conditions or damage to CTs, if the meter needs
to be removed from service. One side of the CT must be grounded.
NOTE: The current inputs are only to be connected to external current transformers
provided by the installer. The CTs shall be Approved or Certified and rated for the
current of the meter used.
Branch circuit protection size should be 15 Amps.
Doc# E154701 4 - 2
4: Electrical Installation
Electro Industries/GaugeTechThe Leader In Power Monitoring and Smart Grid SolutionsElectro Industries/GaugeTechThe Leader In Power Monitoring and Smart Grid Solutions
For sustained loads greater than 10 Amps, the CT wires should be wired directly
through the CT opening (pass through wiring method - see Section 4.3), using 10
AWG wire.
L’installation des compteurs de Nexus 1500 doit être effectuée seule-
ment par un personnel qualifié qui suit les normes relatives aux
précautions de sécurité pendant toute la procédure. Le personnel doit
avoir la formation appropriée et l'expérience avec les appareils de
haute tension. Des gants de sécurité, des verres et des vêtements de
protection appropriés sont recommandés.
Pendant le fonctionnement normal du compteur Nexus 1500 des tensions dangere-
uses suivant de nombreuses pièces, notamment, les bornes et tous les transforma-
teurs de courant branchés, les transformateurs de tension, toutes les sorties, les
entrées et leurs circuits. Tous les circuits secondaires et primaires peuvent parfois
produire des tensions de létal et des courants. Évitez le contact avec les surfaces sous
tensions. Avant de faire un travail dans le compteur, assurez-vous d'éteindre l'alimen-
tation et de mettre tous les circuits branchés hors tension.
Ne pas utiliser les compteurs ou sorties d'appareil pour une protection pri-
maire ou capacité de limite d'énergie. Le compteur peut seulement être
utilisé comme une protection secondaire.
Ne pas utiliser le compteur pour application dans laquelle une panne de compteur
peut causer la mort ou des blessures graves.
Ne pas utiliser le compteur ou pour toute application dans laquelle un risque
d'incendie est susceptible.
Toutes les bornes de compteur doivent être inaccessibles après l'installation.
Ne pas appliquer plus que la tension maximale que le compteur ou appareil relatif
peut résister. Référez-vous au compteur ou aux étiquettes de l'appareil et les spécifi-
cations de tous les appareils avant d'appliquer les tensions. Ne pas faire de test
HIPOT/diélectrique, une sortie, une entrée ou un terminal de réseau.
EIG recommande d'utiliser les fusibles pour les fils de tension et alimentations élec-
triques, ainsi que des coupe-circuits pour prévenir les tensions dangereuses ou
Doc# E154701 4 - 3
4: Electrical Installation
Electro Industries/GaugeTechThe Leader In Power Monitoring and Smart Grid SolutionsElectro Industries/GaugeTechThe Leader In Power Monitoring and Smart Grid Solutions
endommagements de transformateur de courant si l'unité Nexus 1500 doit être
enlevée du service. Un côté du transformateur de courant doit être mis à terre.
NOTE: Les entrées actuelles doivent seulement être branchées dans le transforma-
teur externe actuel par l'installateur. Le transformateur de courant doit être approuvé
ou certifié et déterminé pour le compteur actuel utilisé.
La taille de la protection de la dérivation doit être de 15 ampères.
Pour les charges continues de plus de 10 ampères, les fils des transformateurs de
courant doivent être câblés directement à travers l'ouverture pour les transformateurs
de courant (la méthode de câblage de passage - voir Section 4.3), à l'aide de fils de
calibre américain des fils de 10.
IF THE EQUIPMENT IS USED IN A MANNER NOT SPECIFIED BY THE
MANUFACTURER, THE PROTECTION PROVIDED BY THE EQUIPMENT
MAY BE IMPAIRED.
THERE IS NO REQUIRED PREVENTIVE MAINTENANCE OR INSPECTION NECESSARY
FOR SAFETY. HOWEVER, ANY REPAIR OR MAINTENANCE SHOULD BE PERFORMED BY
THE FACTORY.
DISCONNECT DEVICE: The following part is considered the equipment
disconnect device. A SWITCH OR CIRCUIT-BREAKER SHALL BE
INCLUDED IN THE END-USE EQUIPMENT OR BUILDING
INSTALLATION. THE SWITCH SHALL BE IN CLOSE PROXIMITY TO THE
EQUIPMENT AND WITHIN EASY REACH OF THE OPERATOR. THE
SWITCH SHALL BE MARKED AS THE DISCONNECTING DEVICE FOR
THE EQUIPMENT.
IMPORTANT! SI L'ÉQUIPEMENT EST UTILISÉ D'UNE FAÇON NON
SPÉCIFIÉE PAR LE FABRICANT, LA PROTECTION FOURNIE PAR L'ÉQUI-
PEMENT PEUT ÊTRE ENDOMMAGÉE.
Doc# E154701 4 - 4
4: Electrical Installation
Electro Industries/GaugeTechThe Leader In Power Monitoring and Smart Grid SolutionsElectro Industries/GaugeTechThe Leader In Power Monitoring and Smart Grid Solutions
Il N'Y A AUCUNE MAINTENANCE REQUISE POUR LA PRÉVENTION OU INSPECTION
NÉCESSAIRE POUR LA SÉCURITÉ. CEPENDANT, TOUTE RÉPARATION OU MAINTE-
NANCE DEVRAIT ÊTRE RÉALISÉE PAR LE FABRICANT.
DÉBRANCHEMENT DE L'APPAREIL : la partie suivante est considérée
l'appareil de débranchement de l'équipement. UN INTERRUPTEUR OU
UN DISJONCTEUR DEVRAIT ÊTRE INCLUS DANS L'UTILISATION
FINALE DE L'ÉQUIPEMENT OU L'INSTALLATION. L'INTERRUPTEUR
DOIT ÊTRE DANS UNE PROXIMITÉ PROCHE DE L'ÉQUIPEMENT ET A LA
PORTÉE DE L'OPÉRATEUR. L'INTERRUPTEUR DOIT AVOIR LA MENTION DÉBRANCHE-
MENT DE L'APPAREIL POUR L'ÉQUIPEMENT.
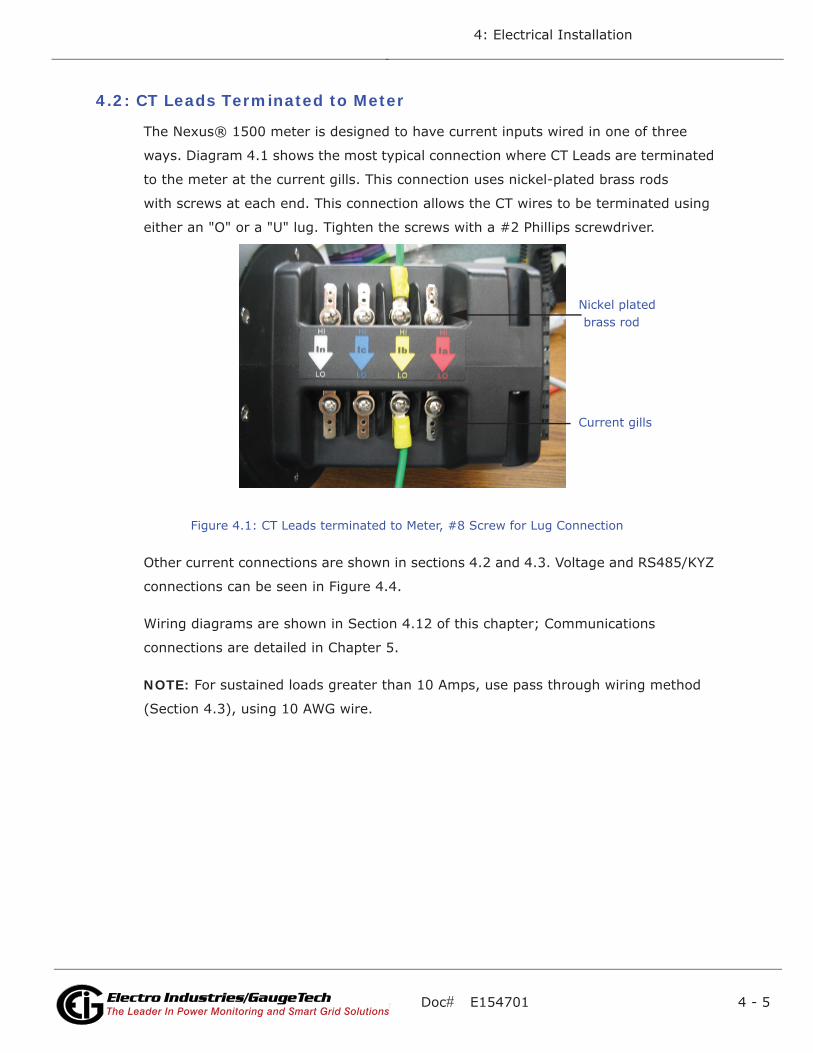
Doc# E154701 4 - 5
4: Electrical Installation
Electro Industries/GaugeTechThe Leader In Power Monitoring and Smart Grid SolutionsElectro Industries/GaugeTechThe Leader In Power Monitoring and Smart Grid Solutions
4.2: CT Leads Terminated to Meter
The Nexus® 1500 meter is designed to have current inputs wired in one of three
ways. Diagram 4.1 shows the most typical connection where CT Leads are terminated
to the meter at the current gills. This connection uses nickel-plated brass rods
with screws at each end. This connection allows the CT wires to be terminated using
either an "O" or a "U" lug. Tighten the screws with a #2 Phillips screwdriver.
Figure 4.1: CT Leads terminated to Meter, #8 Screw for Lug Connection
Other current connections are shown in sections 4.2 and 4.3. Voltage and RS485/KYZ
connections can be seen in Figure 4.4.
Wiring diagrams are shown in Section 4.12 of this chapter; Communications
connections are detailed in Chapter 5.
NOTE: For sustained loads greater than 10 Amps, use pass through wiring method
(Section 4.3), using 10 AWG wire.
Nickel platedbrass rod
Current gills
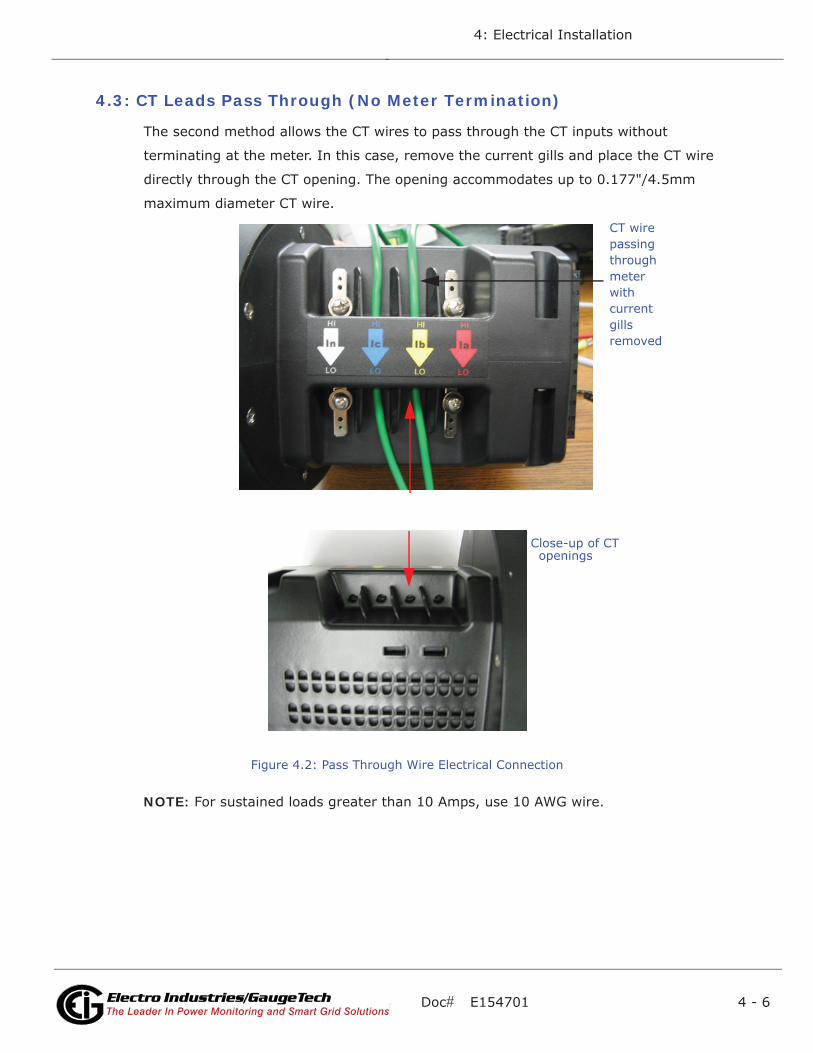
Doc# E154701 4 - 6
4: Electrical Installation
Electro Industries/GaugeTechThe Leader In Power Monitoring and Smart Grid SolutionsElectro Industries/GaugeTechThe Leader In Power Monitoring and Smart Grid Solutions
4.3: CT Leads Pass Through (No Meter Termination)
The second method allows the CT wires to pass through the CT inputs without
terminating at the meter. In this case, remove the current gills and place the CT wire
directly through the CT opening. The opening accommodates up to 0.177"/4.5mm
maximum diameter CT wire.
Figure 4.2: Pass Through Wire Electrical Connection
NOTE: For sustained loads greater than 10 Amps, use 10 AWG wire.
CT wirepassing throughmeterwith current gills removed
Close-up of CTopenings
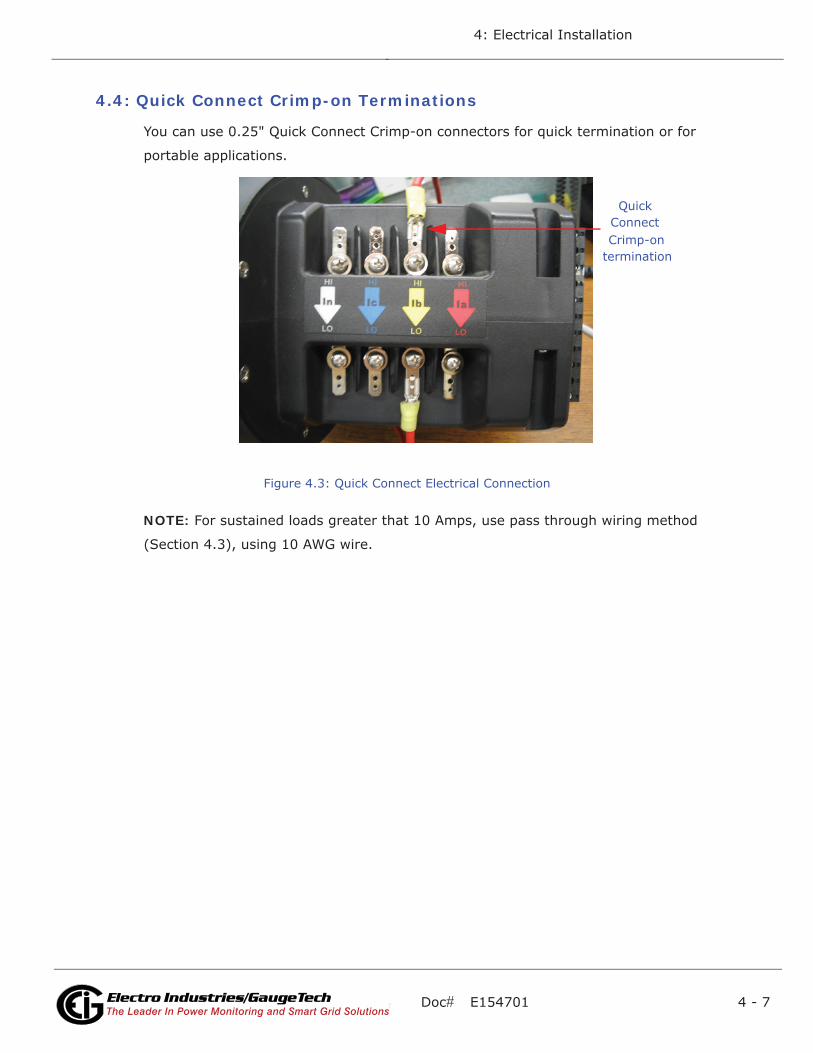
Doc# E154701 4 - 7
4: Electrical Installation
Electro Industries/GaugeTechThe Leader In Power Monitoring and Smart Grid SolutionsElectro Industries/GaugeTechThe Leader In Power Monitoring and Smart Grid Solutions
4.4: Quick Connect Crimp-on Terminations
You can use 0.25" Quick Connect Crimp-on connectors for quick termination or for
portable applications.
Figure 4.3: Quick Connect Electrical Connection
NOTE: For sustained loads greater that 10 Amps, use pass through wiring method
(Section 4.3), using 10 AWG wire.
QuickConnectCrimp-on
termination
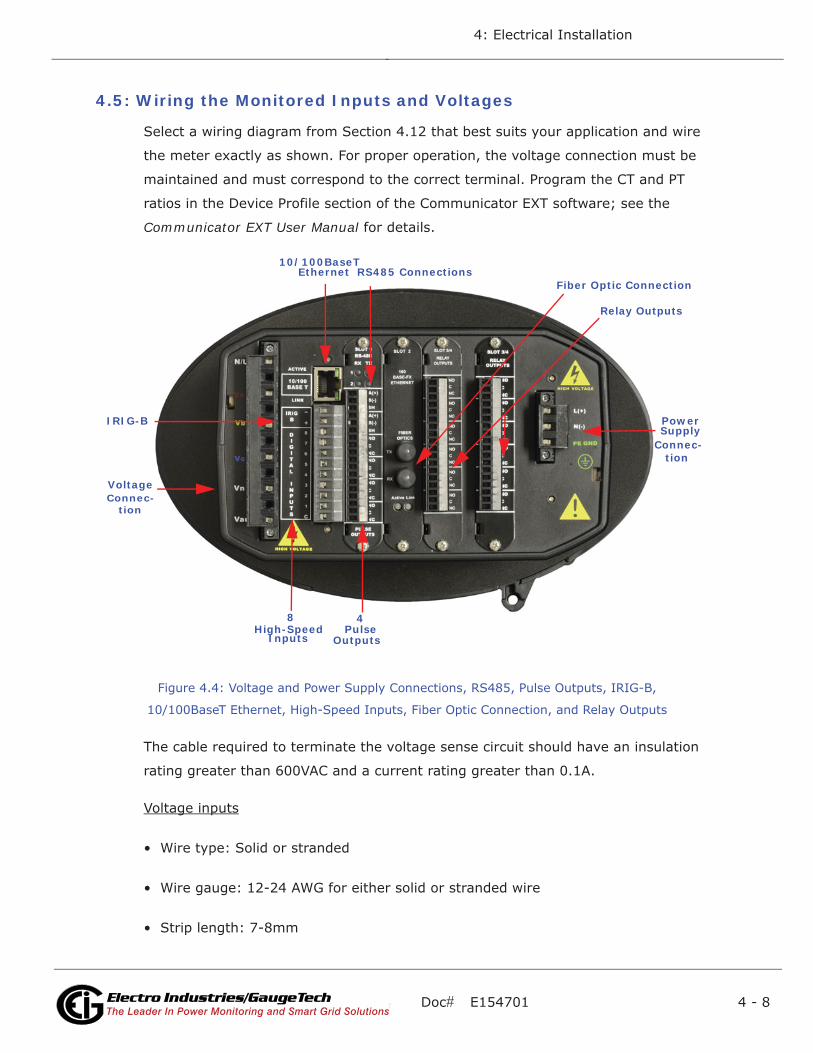
Doc# E154701 4 - 8
4: Electrical Installation
Electro Industries/GaugeTechThe Leader In Power Monitoring and Smart Grid SolutionsElectro Industries/GaugeTechThe Leader In Power Monitoring and Smart Grid Solutions
4.5: Wiring the Monitored Inputs and Voltages
Select a wiring diagram from Section 4.12 that best suits your application and wire
the meter exactly as shown. For proper operation, the voltage connection must be
maintained and must correspond to the correct terminal. Program the CT and PT
ratios in the Device Profile section of the Communicator EXT software; see the
Communicator EXT User Manual for details.
Figure 4.4: Voltage and Power Supply Connections, RS485, Pulse Outputs, IRIG-B,
10/100BaseT Ethernet, High-Speed Inputs, Fiber Optic Connection, and Relay Outputs
The cable required to terminate the voltage sense circuit should have an insulation
rating greater than 600VAC and a current rating greater than 0.1A.
Voltage inputs
• Wire type: Solid or stranded
• Wire gauge: 12-24 AWG for either solid or stranded wire
• Strip length: 7-8mm
10/100BaseT
Fiber Optic Connection
Power Supply
Connec-
Relay Outputs
4 Pulse
Outputs
8 High-Speed
Inputs
VoltageConnec-
IRIG-B
tion
tion
Ethernet RS485 Connections
Doc# E154701 4 - 9
4: Electrical Installation
Electro Industries/GaugeTechThe Leader In Power Monitoring and Smart Grid SolutionsElectro Industries/GaugeTechThe Leader In Power Monitoring and Smart Grid Solutions
• Torque: 5 Lb-In
Power supply connections
• Wire gauge: 12-18 AWG for either solid or stranded wire
• Torque: 3.5 Lb-In
• Branch circuit protection size should be 15A.
4.6: Ground Connections
The meter's PE GND terminal should be connected directly to the installation's protec-
tive earth ground. Use AWG#12/2.5mm2 wire for this connection.
4.7: Fusing the Voltage Connections
For accuracy of the readings and for protection, EIG requires using 0.25-Amp rated
fuses on all voltage inputs.
The Nexus® 1500 meter allows measurement up to a nominal 347VAC phase to
neutral and up to 600VAC phase to phase. Potential Transformers (PTs) are required
for higher voltages to insure proper safety.
Use a 3 Amp Slow-Blow fuse on the power supply for control power.
4.8: Wiring the Monitored Inputs - Vaux
The Voltage Auxiliary (Vaux) connection is an auxiliary voltage input that can be used
for any desired purpose, such as monitoring two different lines on a switch. The VAux
Voltage rating is the same as the metering Voltage input connections.
4.9: Wiring the Monitored Inputs - Current
Mount the current transformers (CTs) as close as possible to the meter. The following
table illustrates the maximum recommended distances for various CT sizes, assuming
the connection is via 14 AWG cable.
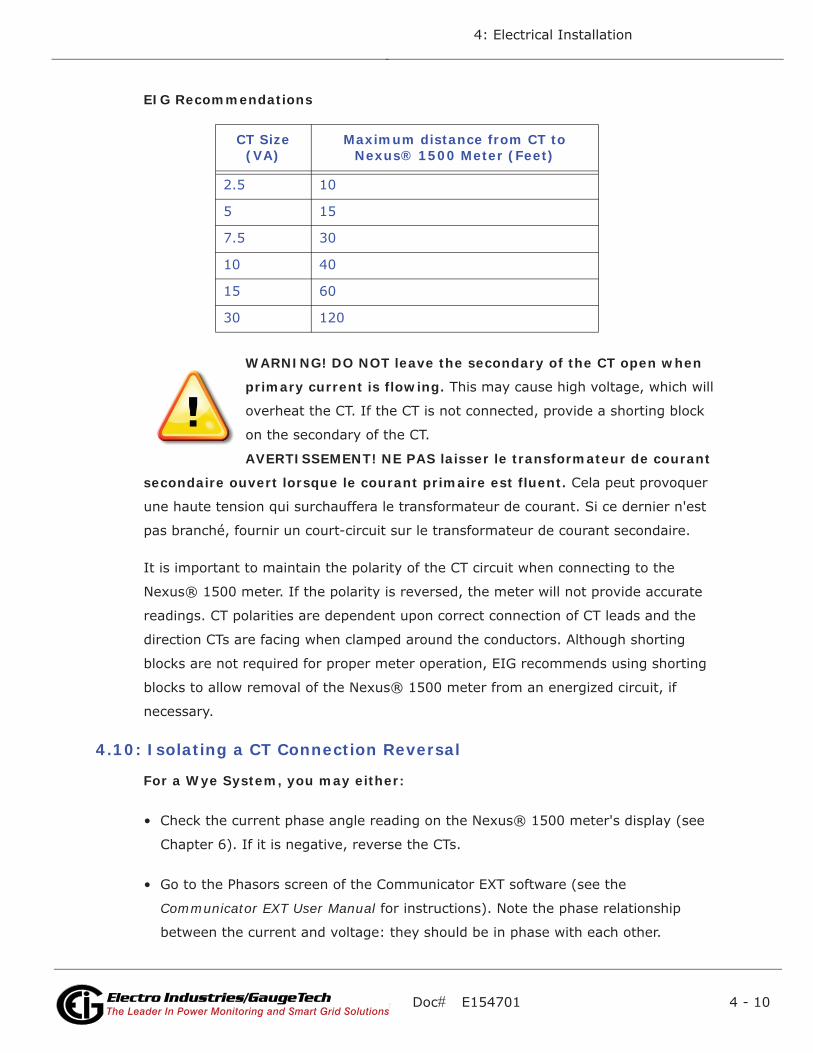
Doc# E154701 4 - 10
4: Electrical Installation
Electro Industries/GaugeTechThe Leader In Power Monitoring and Smart Grid SolutionsElectro Industries/GaugeTechThe Leader In Power Monitoring and Smart Grid Solutions
EIG Recommendations
WARNING! DO NOT leave the secondary of the CT open when
primary current is flowing. This may cause high voltage, which will
overheat the CT. If the CT is not connected, provide a shorting block
on the secondary of the CT.
AVERTISSEMENT! NE PAS laisser le transformateur de courant
secondaire ouvert lorsque le courant primaire est fluent. Cela peut provoquer
une haute tension qui surchauffera le transformateur de courant. Si ce dernier n'est
pas branché, fournir un court-circuit sur le transformateur de courant secondaire.
It is important to maintain the polarity of the CT circuit when connecting to the
Nexus® 1500 meter. If the polarity is reversed, the meter will not provide accurate
readings. CT polarities are dependent upon correct connection of CT leads and the
direction CTs are facing when clamped around the conductors. Although shorting
blocks are not required for proper meter operation, EIG recommends using shorting
blocks to allow removal of the Nexus® 1500 meter from an energized circuit, if
necessary.
4.10: Isolating a CT Connection Reversal
For a Wye System, you may either:
• Check the current phase angle reading on the Nexus® 1500 meter's display (see
Chapter 6). If it is negative, reverse the CTs.
• Go to the Phasors screen of the Communicator EXT software (see the
Communicator EXT User Manual for instructions). Note the phase relationship
between the current and voltage: they should be in phase with each other.
CT Size (VA)
Maximum distance from CT to Nexus® 1500 Meter (Feet)
2.5 10
5 15
7.5 30
10 40
15 60
30 120
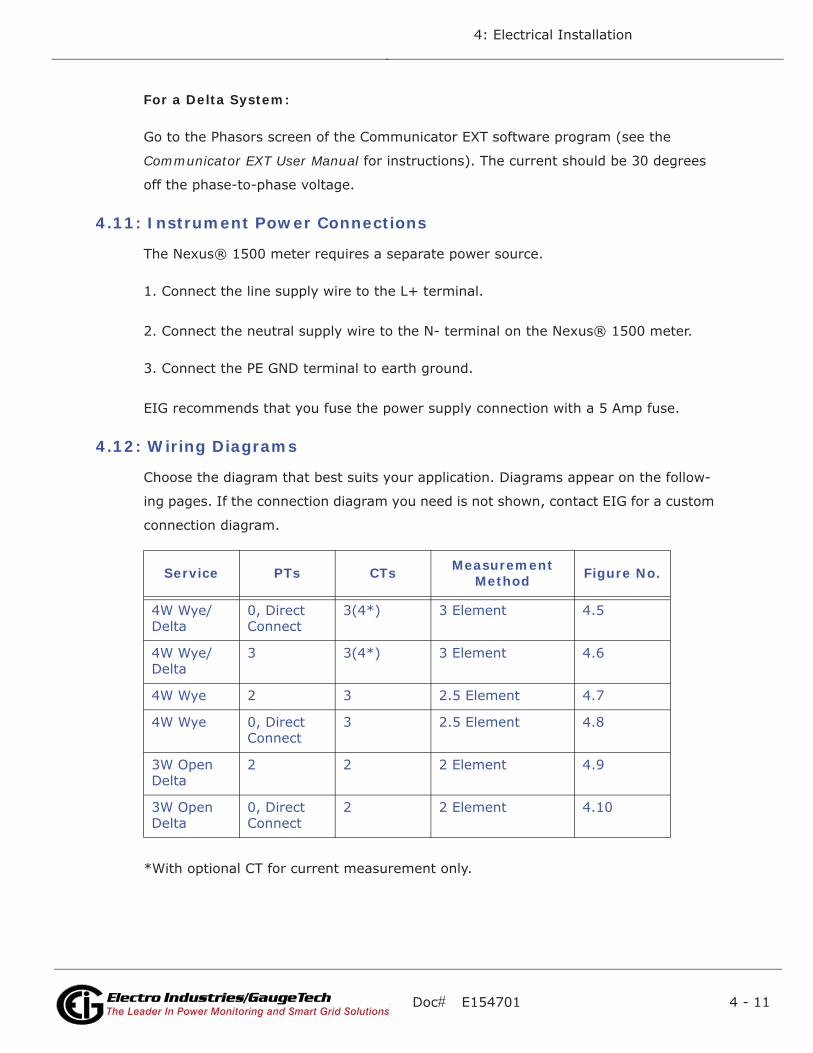
Doc# E154701 4 - 11
4: Electrical Installation
Electro Industries/GaugeTechThe Leader In Power Monitoring and Smart Grid SolutionsElectro Industries/GaugeTechThe Leader In Power Monitoring and Smart Grid Solutions
For a Delta System:
Go to the Phasors screen of the Communicator EXT software program (see the
Communicator EXT User Manual for instructions). The current should be 30 degrees
off the phase-to-phase voltage.
4.11: Instrument Power Connections
The Nexus® 1500 meter requires a separate power source.
1. Connect the line supply wire to the L+ terminal.
2. Connect the neutral supply wire to the N- terminal on the Nexus® 1500 meter.
3. Connect the PE GND terminal to earth ground.
EIG recommends that you fuse the power supply connection with a 5 Amp fuse.
4.12: Wiring Diagrams
Choose the diagram that best suits your application. Diagrams appear on the follow-
ing pages. If the connection diagram you need is not shown, contact EIG for a custom
connection diagram.
*With optional CT for current measurement only.
Service PTs CTs Measurement Method Figure No.
4W Wye/Delta
0, Direct Connect
3(4*) 3 Element 4.5
4W Wye/Delta
3 3(4*) 3 Element 4.6
4W Wye 2 3 2.5 Element 4.7
4W Wye 0, Direct Connect
3 2.5 Element 4.8
3W Open Delta
2 2 2 Element 4.9
3W Open Delta
0, Direct Connect
2 2 Element 4.10
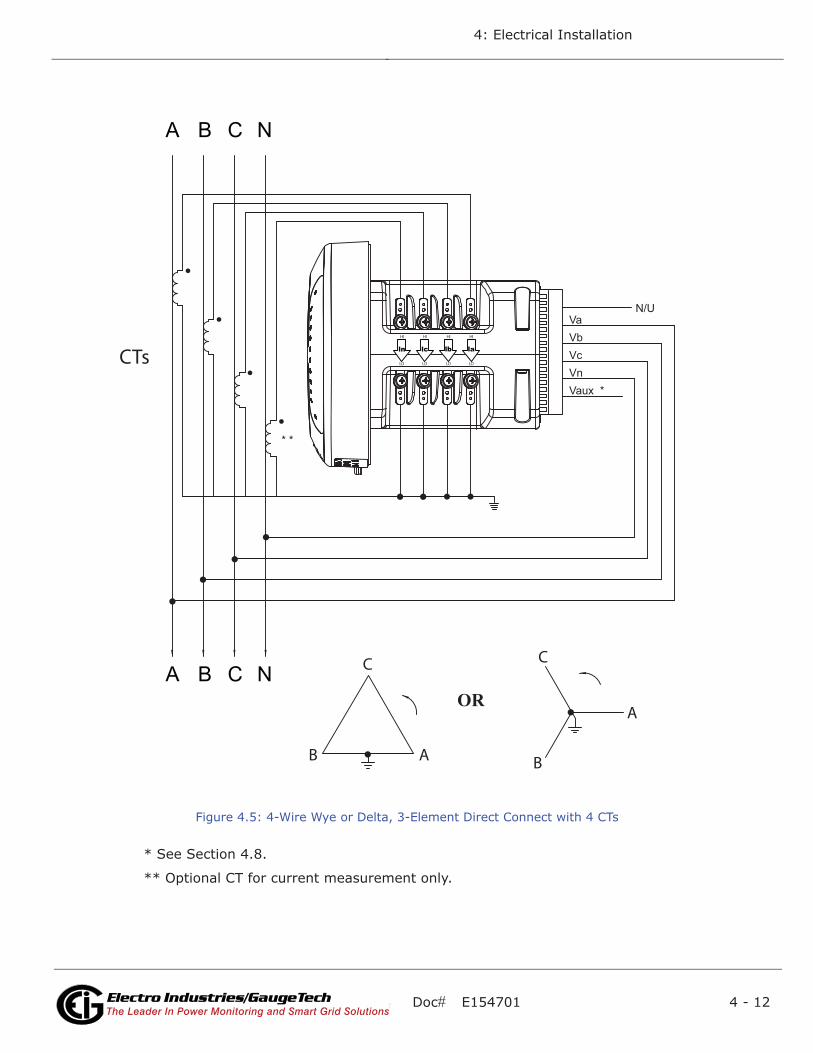
Doc# E154701 4 - 12
4: Electrical Installation
Electro Industries/GaugeTechThe Leader In Power Monitoring and Smart Grid SolutionsElectro Industries/GaugeTechThe Leader In Power Monitoring and Smart Grid Solutions
Figure 4.5: 4-Wire Wye or Delta, 3-Element Direct Connect with 4 CTs
* See Section 4.8.
** Optional CT for current measurement only.
NCBA
NCBA
VaVbVcVnVaux *
CTs
* *
N/U
C
B
A
C
B A
OR
ln
HI
LO
lc
HI
LO
lb
HI
LO
la
HI
LO
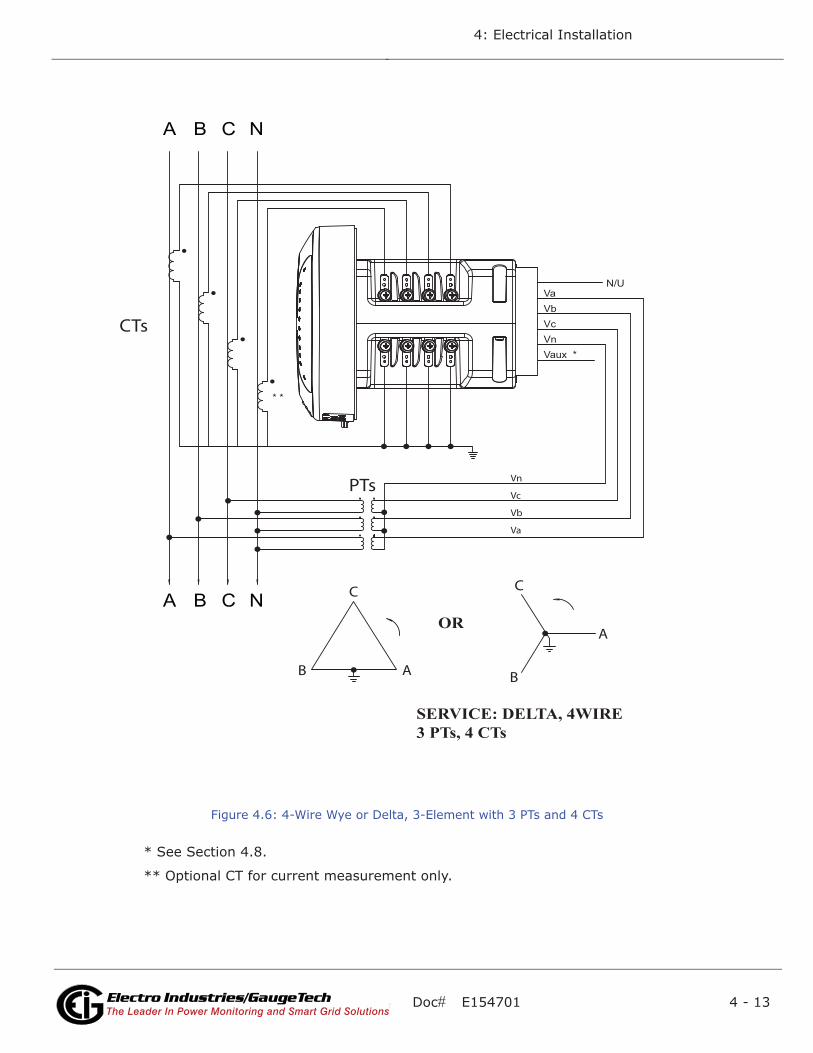
Doc# E154701 4 - 13
4: Electrical Installation
Electro Industries/GaugeTechThe Leader In Power Monitoring and Smart Grid SolutionsElectro Industries/GaugeTechThe Leader In Power Monitoring and Smart Grid Solutions
Figure 4.6: 4-Wire Wye or Delta, 3-Element with 3 PTs and 4 CTs
* See Section 4.8.
** Optional CT for current measurement only.
NCBA
NCBA
VaVbVcVnVaux *
Vn
Vc
Vb
Va
PTs
CTs
* *
N/U
C
B
A
C
B A
OR
SERVICE: DELTA, 4WIRE3 PTs, 4 CTs
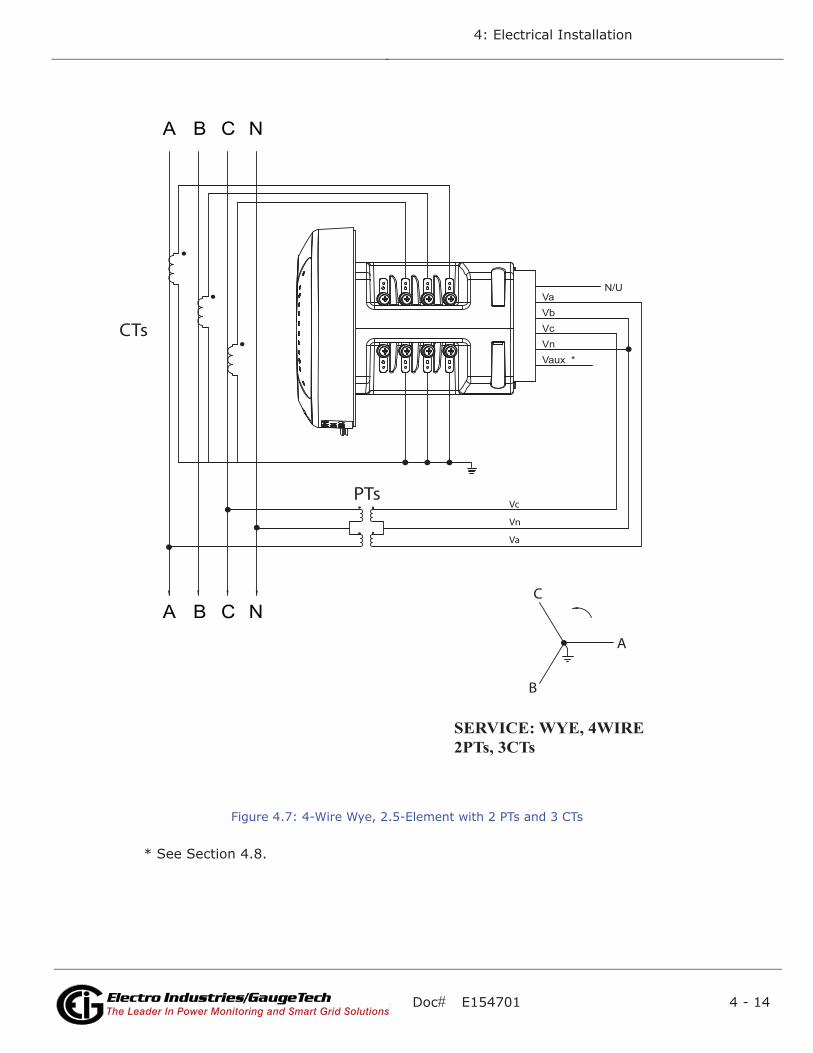
Doc# E154701 4 - 14
4: Electrical Installation
Electro Industries/GaugeTechThe Leader In Power Monitoring and Smart Grid SolutionsElectro Industries/GaugeTechThe Leader In Power Monitoring and Smart Grid Solutions
Figure 4.7: 4-Wire Wye, 2.5-Element with 2 PTs and 3 CTs
* See Section 4.8.
VaVbVcVnVaux *
N/U
CTs
Vc
Vn
Va
PTs
C
B
A
SERVICE: WYE, 4WIRE2PTs, 3CTs
NCBA
NCBA
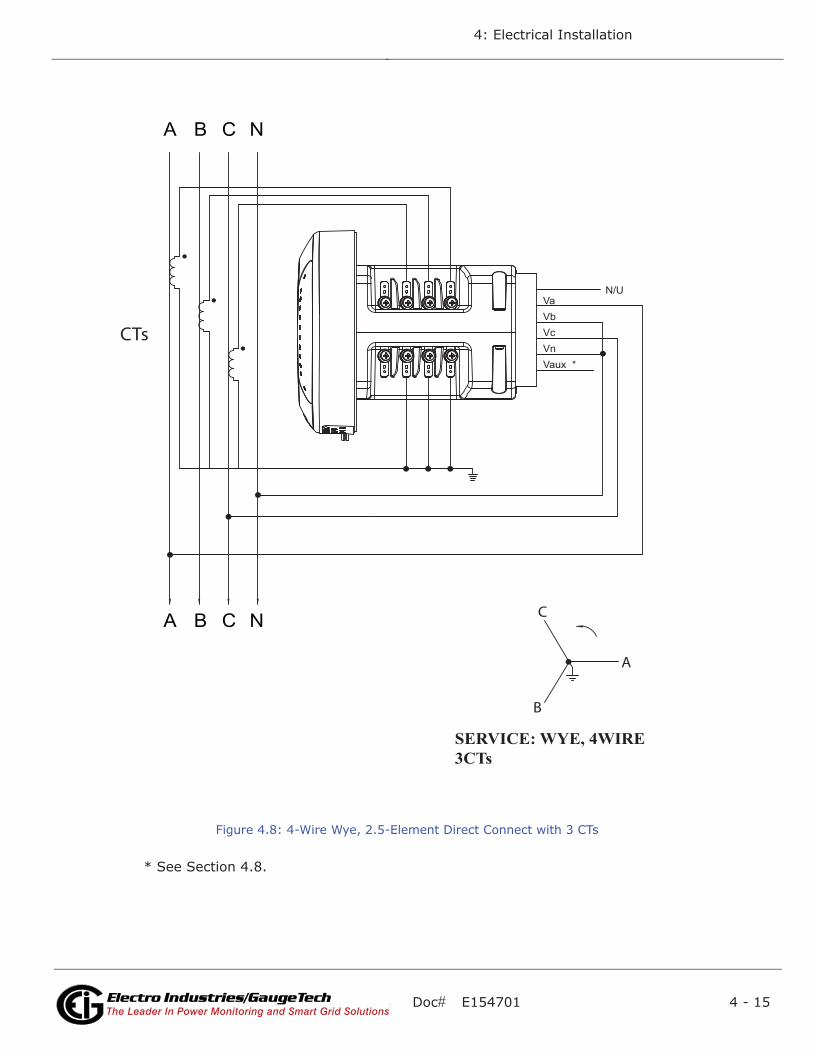
Doc# E154701 4 - 15
4: Electrical Installation
Electro Industries/GaugeTechThe Leader In Power Monitoring and Smart Grid SolutionsElectro Industries/GaugeTechThe Leader In Power Monitoring and Smart Grid Solutions
Figure 4.8: 4-Wire Wye, 2.5-Element Direct Connect with 3 CTs
* See Section 4.8.
NCBA
NCBA C
B
A
SERVICE: WYE, 4WIRE3CTs
VaVbVcVnVaux *
CTs
N/U
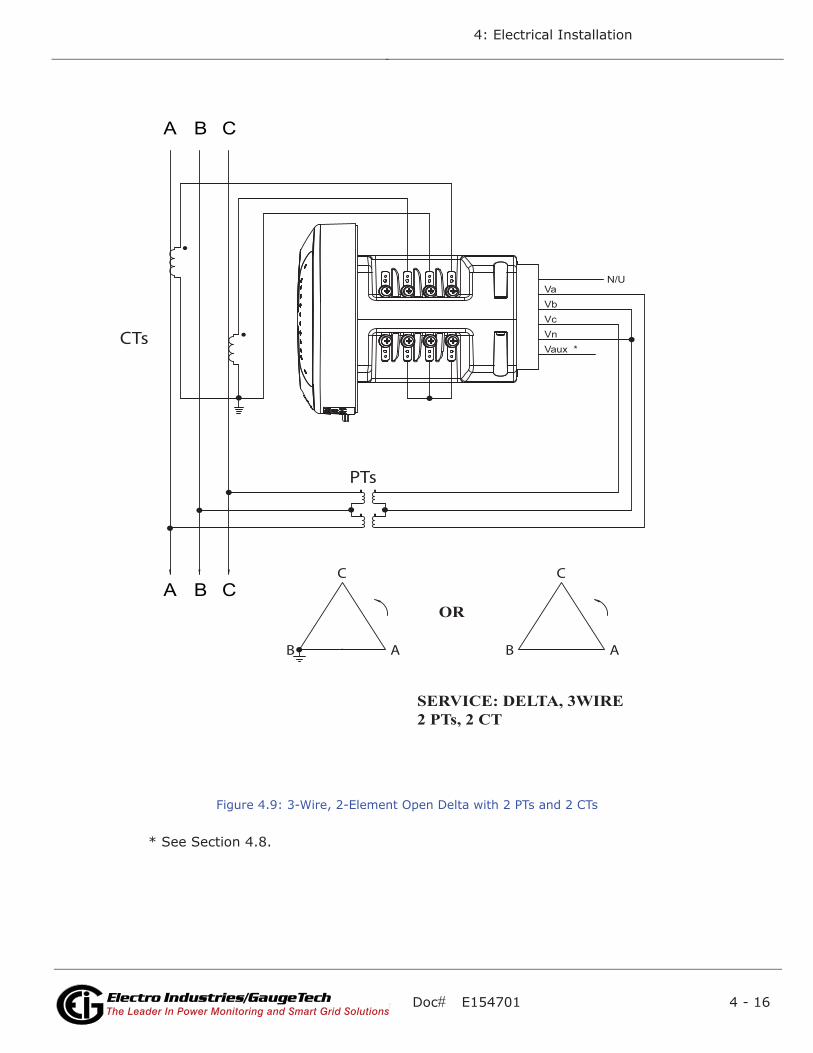
Doc# E154701 4 - 16
4: Electrical Installation
Electro Industries/GaugeTechThe Leader In Power Monitoring and Smart Grid SolutionsElectro Industries/GaugeTechThe Leader In Power Monitoring and Smart Grid Solutions
Figure 4.9: 3-Wire, 2-Element Open Delta with 2 PTs and 2 CTs
* See Section 4.8.
CBA
CBAC
B A
C
B A
OR
SERVICE: DELTA, 3WIRE2 PTs, 2 CT
VaVbVcVnVaux *
PTs
CTs
N/U
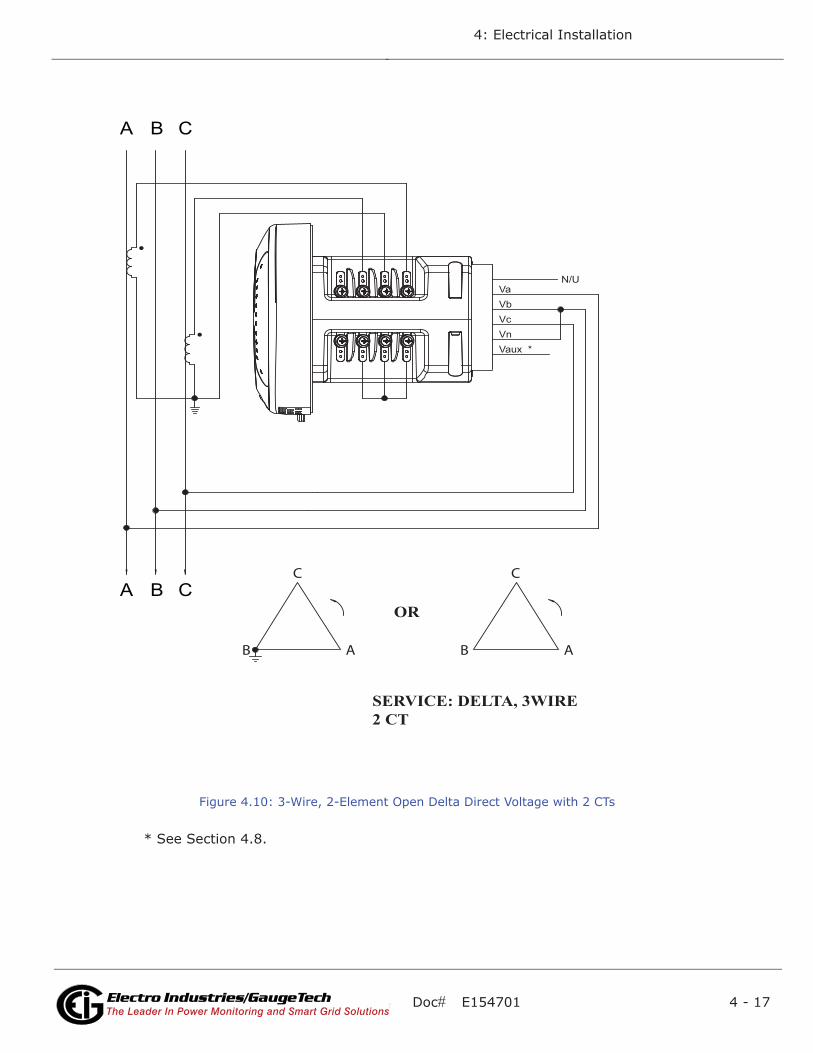
Doc# E154701 4 - 17
4: Electrical Installation
Electro Industries/GaugeTechThe Leader In Power Monitoring and Smart Grid SolutionsElectro Industries/GaugeTechThe Leader In Power Monitoring and Smart Grid Solutions
Figure 4.10: 3-Wire, 2-Element Open Delta Direct Voltage with 2 CTs
* See Section 4.8.
VaVbVcVnVaux *
N/U
C
B A
C
B A
OR
SERVICE: DELTA, 3WIRE2 CT
CBA
CBA

Doc# E154701 4 - 18
4: Electrical Installation
Electro Industries/GaugeTechThe Leader In Power Monitoring and Smart Grid SolutionsElectro Industries/GaugeTechThe Leader In Power Monitoring and Smart Grid Solutions
This page intentionally left blank.
Doc# E154701 5 - 1
5: Communication Wiring
Electro Industries/GaugeTechThe Leader In Power Monitoring and Smart Grid SolutionsElectro Industries/GaugeTechThe Leader In Power Monitoring and Smart Grid Solutions
5: Communication Wiring
5.1: Communication Overview
This chapter contains instructions for using the Nexus® 1500 meter's standard and
optional communication capabilities. The Nexus® 1500 meter offers the following
communication modes:
• RJ45 100BaseT Ethernet connection (standard)
• ANSI Optical port (standard)
• USB 2.0 connection (standard)
• Two RS485 communication ports (optional)
• Second Ethernet connection - either RJ45 or Fiber Optic (optional)
5.2: RJ45 and Fiber Ethernet Connections
The standard RJ45 connection allows a Nexus® 1500 meter to communicate with
multiple PCs simultaneously. The RJ45 jack is located on the back of the meter. The
Nexus® 1500 meter's Ethernet port conforms to the IEEE 802.3, 10BaseT and
100BaseT specifications using unshielded twisted pair (UTP) wiring. EIG recommends
CAT5 for cabling. For details on this connection, see Chapter 9.
The optional second Ethernet connection for the Nexus® 1500 meter consists of
either an RJ45 (NTRJ) or a Fiber Optic (NTFO) Communication card. See Chapter 11
for details.
5.3: ANSI Optical Port
The Optical port lets the Nexus® 1500 meter communicate with one other device,
e.g., a PC. Located on the left side of the meter's face, it provides communication with
the meter through an ANSI C12.13 Type II Magnetic Optical Communications Coupler,
such as either an:
• A7Z Communication Interface connected to the RS232 port of the PC
• A9U Communication Interface connected to the USB port of the PC
NOTE: You can order either of these devices from EIG’s webstore:

Doc# E154701 5 - 2
5: Communication Wiring
Electro Industries/GaugeTechThe Leader In Power Monitoring and Smart Grid SolutionsElectro Industries/GaugeTechThe Leader In Power Monitoring and Smart Grid Solutions
www.electroind.com/store. Select the Communications Products category from the
left side of the webpage.
You can then program the meter through the Optical port using Communicator EXT
software.
Figure 5.1: A7Z (top) and A9U (bottom) Communication Interfaces
A7Z Instructions:
One end of the magnetic interface simply snaps onto the optical port; the magnet
keeps it in place. The other end is an RS232 connection. Insert that end into a 9-pin
serial port on a computer or other device. The A7Z requires no power supply. All
power is received from the host computer serial port using transmitter and receiver
circuits within the probe. The RS232 standard limits the cable length to 50 feet
(15.2m).
A9U Instructions:
You need to download and install the driver for the A9U from EIG’s website:
www.electroind.com/A7Z_A9U.html. Once the driver is installed, attach the A9U’s
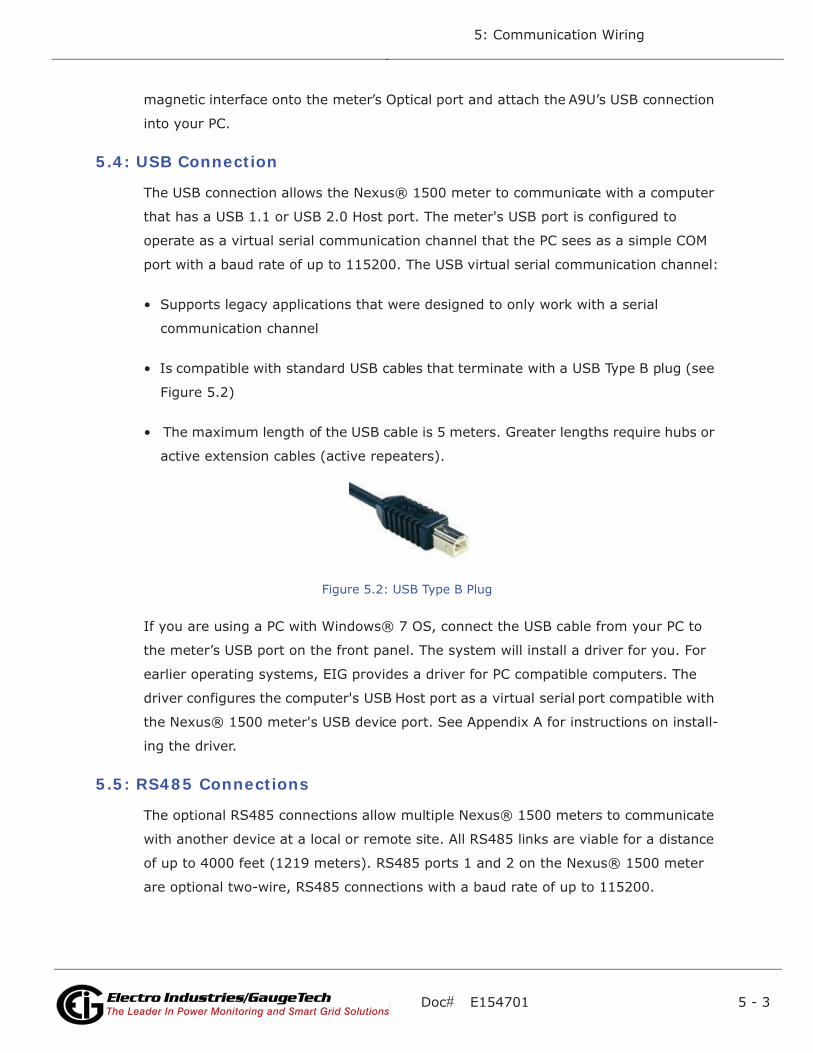
Doc# E154701 5 - 3
5: Communication Wiring
Electro Industries/GaugeTechThe Leader In Power Monitoring and Smart Grid SolutionsElectro Industries/GaugeTechThe Leader In Power Monitoring and Smart Grid Solutions
magnetic interface onto the meter’s Optical port and attach the A9U’s USB connection
into your PC.
5.4: USB Connection
The USB connection allows the Nexus® 1500 meter to communicate with a computer
that has a USB 1.1 or USB 2.0 Host port. The meter's USB port is configured to
operate as a virtual serial communication channel that the PC sees as a simple COM
port with a baud rate of up to 115200. The USB virtual serial communication channel:
• Supports legacy applications that were designed to only work with a serial
communication channel
• Is compatible with standard USB cables that terminate with a USB Type B plug (see
Figure 5.2)
• The maximum length of the USB cable is 5 meters. Greater lengths require hubs or
active extension cables (active repeaters).
Figure 5.2: USB Type B Plug
If you are using a PC with Windows® 7 OS, connect the USB cable from your PC to
the meter’s USB port on the front panel. The system will install a driver for you. For
earlier operating systems, EIG provides a driver for PC compatible computers. The
driver configures the computer's USB Host port as a virtual serial port compatible with
the Nexus® 1500 meter's USB device port. See Appendix A for instructions on install-
ing the driver.
5.5: RS485 Connections
The optional RS485 connections allow multiple Nexus® 1500 meters to communicate
with another device at a local or remote site. All RS485 links are viable for a distance
of up to 4000 feet (1219 meters). RS485 ports 1 and 2 on the Nexus® 1500 meter
are optional two-wire, RS485 connections with a baud rate of up to 115200.
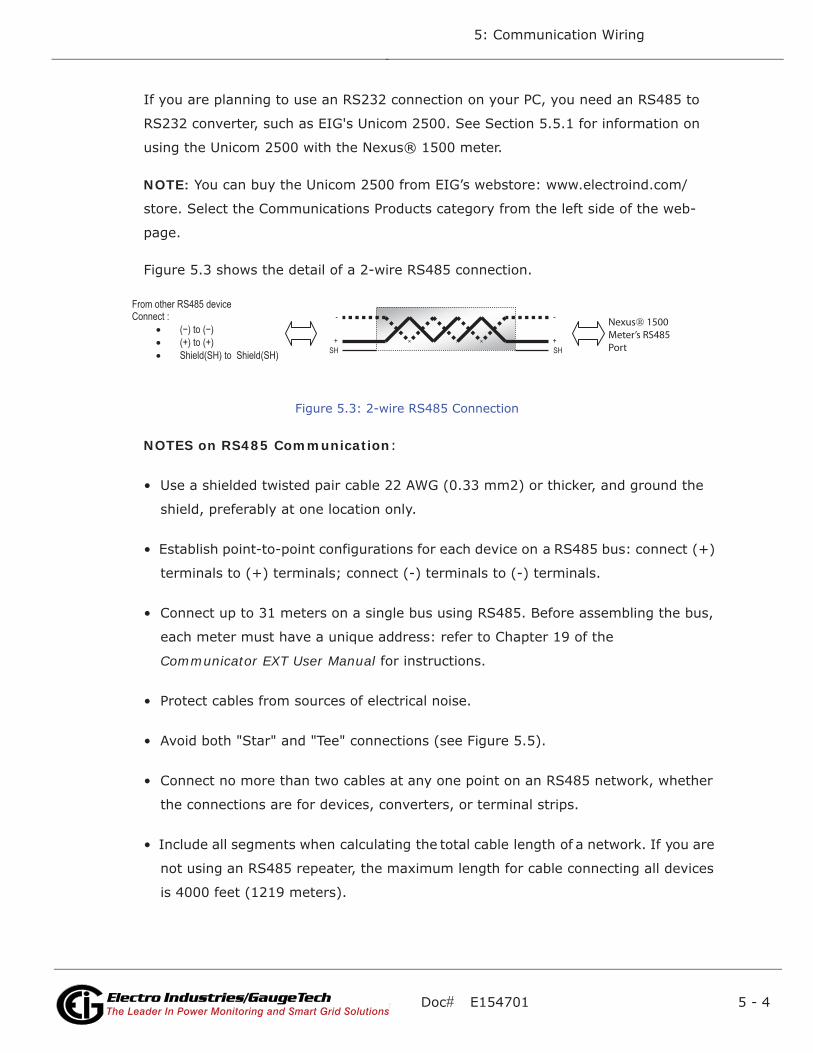
Doc# E154701 5 - 4
5: Communication Wiring
Electro Industries/GaugeTechThe Leader In Power Monitoring and Smart Grid SolutionsElectro Industries/GaugeTechThe Leader In Power Monitoring and Smart Grid Solutions
If you are planning to use an RS232 connection on your PC, you need an RS485 to
RS232 converter, such as EIG's Unicom 2500. See Section 5.5.1 for information on
using the Unicom 2500 with the Nexus® 1500 meter.
NOTE: You can buy the Unicom 2500 from EIG’s webstore: www.electroind.com/
store. Select the Communications Products category from the left side of the web-
page.
Figure 5.3 shows the detail of a 2-wire RS485 connection.
Figure 5.3: 2-wire RS485 Connection
NOTES on RS485 Communication:
• Use a shielded twisted pair cable 22 AWG (0.33 mm2) or thicker, and ground the
shield, preferably at one location only.
• Establish point-to-point configurations for each device on a RS485 bus: connect (+)
terminals to (+) terminals; connect (-) terminals to (-) terminals.
• Connect up to 31 meters on a single bus using RS485. Before assembling the bus,
each meter must have a unique address: refer to Chapter 19 of the
Communicator EXT User Manual for instructions.
• Protect cables from sources of electrical noise.
• Avoid both "Star" and "Tee" connections (see Figure 5.5).
• Connect no more than two cables at any one point on an RS485 network, whether
the connections are for devices, converters, or terminal strips.
• Include all segments when calculating the total cable length of a network. If you are
not using an RS485 repeater, the maximum length for cable connecting all devices
is 4000 feet (1219 meters).
From other RS485 device Connect :
• (−) to (−)• (+) to (+) • Shield(SH) to Shield(SH)
+
-
SH +
-
SH
Nexus® 1500 Meter’s RS485 Port
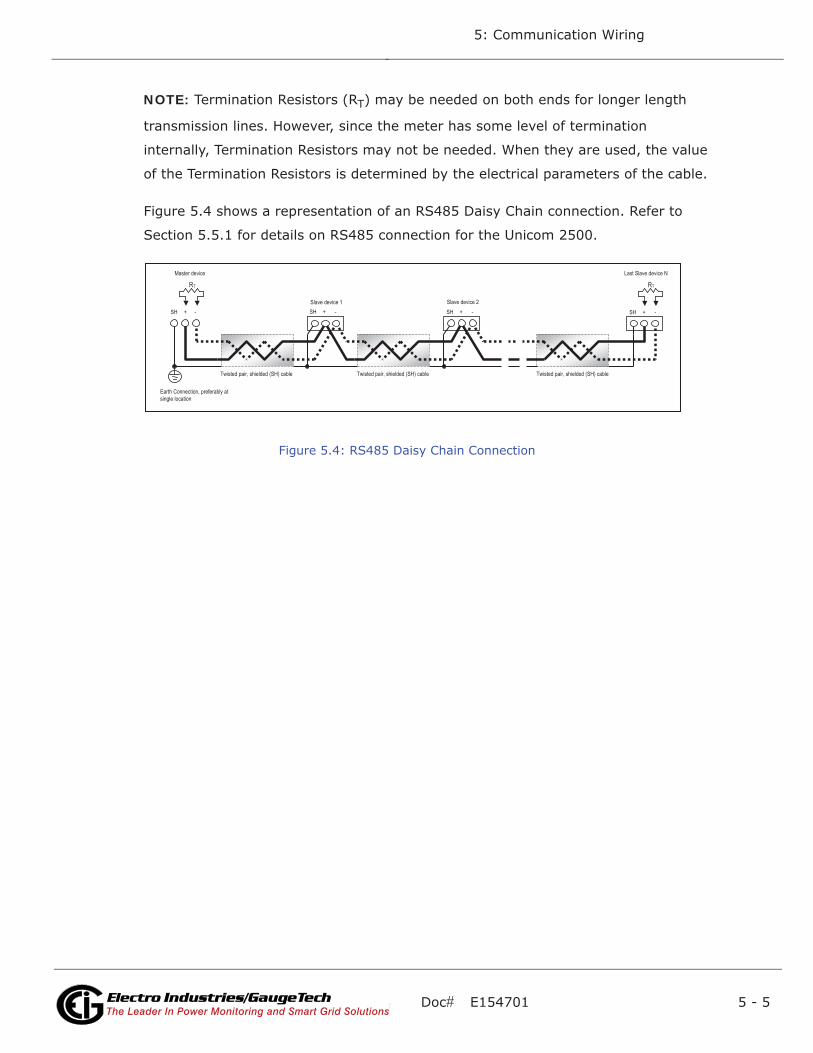
Doc# E154701 5 - 5
5: Communication Wiring
Electro Industries/GaugeTechThe Leader In Power Monitoring and Smart Grid SolutionsElectro Industries/GaugeTechThe Leader In Power Monitoring and Smart Grid Solutions
NOTE: Termination Resistors (RT) may be needed on both ends for longer length
transmission lines. However, since the meter has some level of termination
internally, Termination Resistors may not be needed. When they are used, the value
of the Termination Resistors is determined by the electrical parameters of the cable.
Figure 5.4 shows a representation of an RS485 Daisy Chain connection. Refer to
Section 5.5.1 for details on RS485 connection for the Unicom 2500.
Figure 5.4: RS485 Daisy Chain Connection
Twisted pair, shielded (SH) cable
RT
+ - SH
RT
+ - SH + - SH + - SHSlave device 1 Slave device 2
Last Slave device N Master device
Earth Connection, preferably at single location
Twisted pair, shielded (SH) cable Twisted pair, shielded (SH) cable
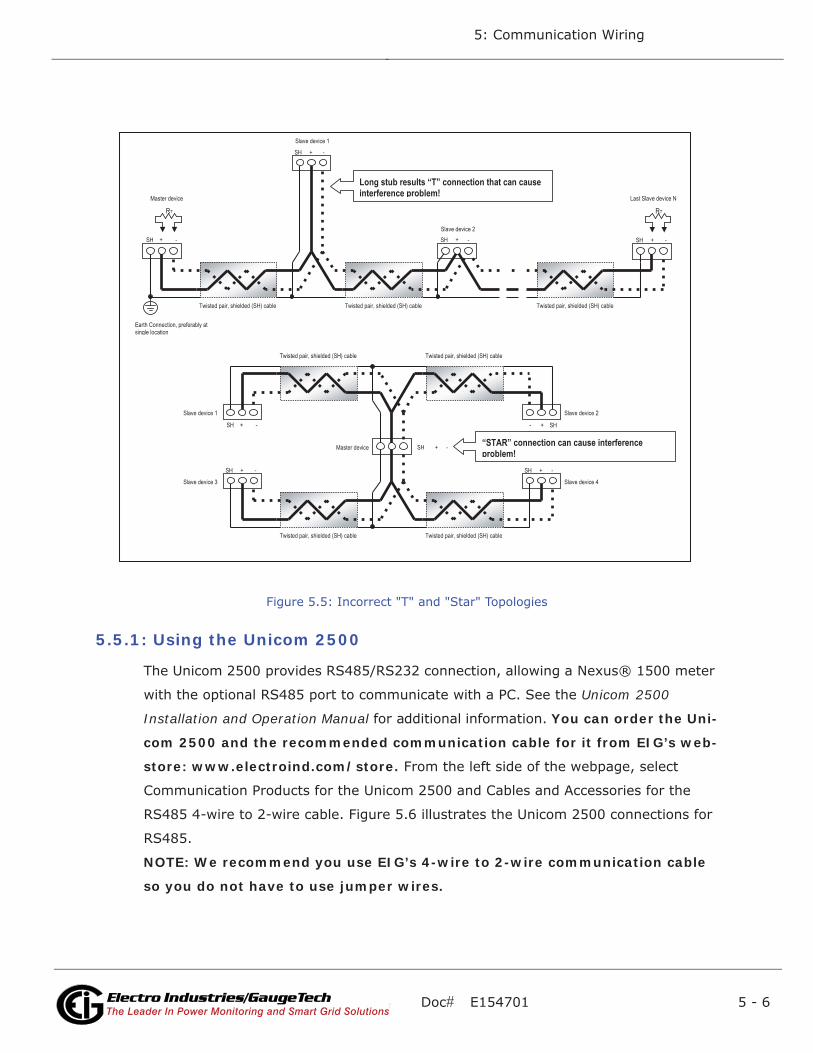
Doc# E154701 5 - 6
5: Communication Wiring
Electro Industries/GaugeTechThe Leader In Power Monitoring and Smart Grid SolutionsElectro Industries/GaugeTechThe Leader In Power Monitoring and Smart Grid Solutions
Figure 5.5: Incorrect "T" and "Star" Topologies
5.5.1: Using the Unicom 2500
The Unicom 2500 provides RS485/RS232 connection, allowing a Nexus® 1500 meter
with the optional RS485 port to communicate with a PC. See the Unicom 2500
Installation and Operation Manual for additional information. You can order the Uni-
com 2500 and the recommended communication cable for it from EIG’s web-
store: www.electroind.com/store. From the left side of the webpage, select
Communication Products for the Unicom 2500 and Cables and Accessories for the
RS485 4-wire to 2-wire cable. Figure 5.6 illustrates the Unicom 2500 connections for
RS485.
NOTE: We recommend you use EIG’s 4-wire to 2-wire communication cable
so you do not have to use jumper wires.
Twisted pair, shielded (SH) cable
+ - SH
+ - SH
+ - SH
Slave device 1
Slave device 2
Last Slave device N Master device
Earth Connection, preferably at single location
Twisted pair, shielded (SH) cable Twisted pair, shielded (SH) cable
Twisted pair, shielded (SH) cable
+ -SH
Twisted pair, shielded (SH) cable
Twisted pair, shielded (SH) cable Twisted pair, shielded (SH) cable
+ - SH +- SH
+ - SH + -SH
Master device
Slave device 1 Slave device 2
Slave device 3 Slave device 4
RT RT
+ - SH
Long stub results “T” connection that can cause interference problem!
“STAR” connection can cause interference problem!
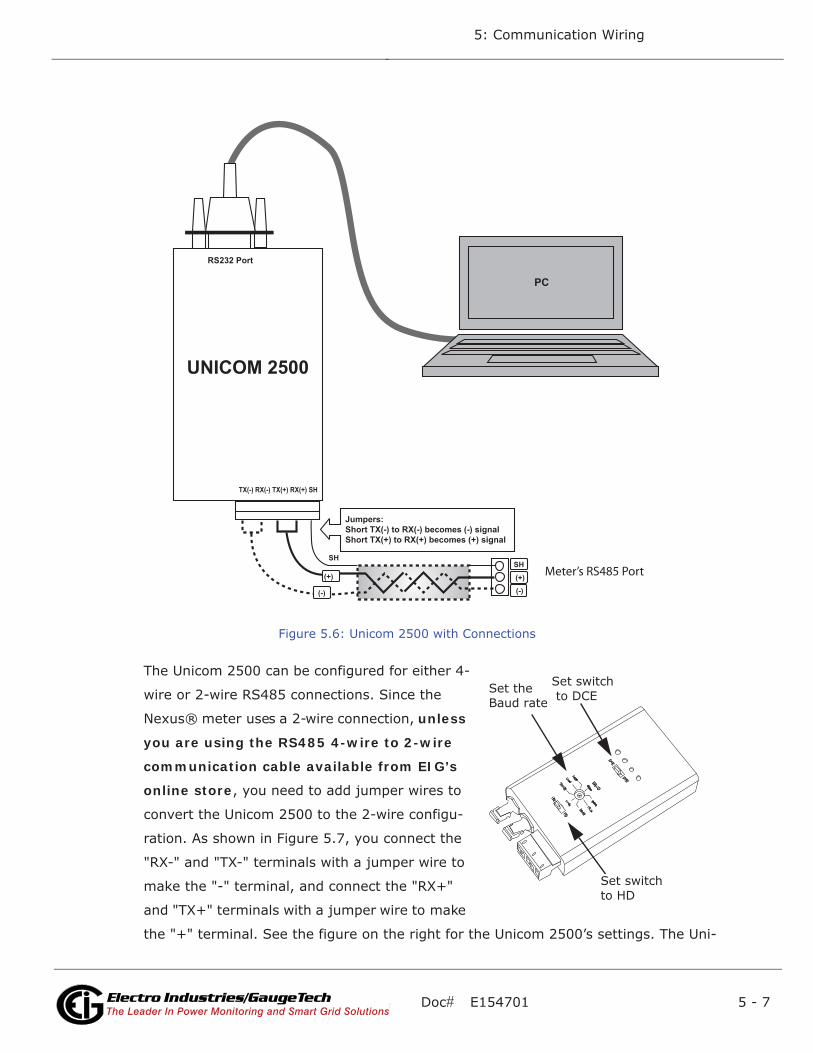
Doc# E154701 5 - 7
5: Communication Wiring
Electro Industries/GaugeTechThe Leader In Power Monitoring and Smart Grid SolutionsElectro Industries/GaugeTechThe Leader In Power Monitoring and Smart Grid Solutions
Figure 5.6: Unicom 2500 with Connections
The Unicom 2500 can be configured for either 4-
wire or 2-wire RS485 connections. Since the
Nexus® meter uses a 2-wire connection, unless
you are using the RS485 4-wire to 2-wire
communication cable available from EIG’s
online store, you need to add jumper wires to
convert the Unicom 2500 to the 2-wire configu-
ration. As shown in Figure 5.7, you connect the
"RX-" and "TX-" terminals with a jumper wire to
make the "-" terminal, and connect the "RX+"
and "TX+" terminals with a jumper wire to make
the "+" terminal. See the figure on the right for the Unicom 2500’s settings. The Uni-
(+)
(-)
SH
(+)
(-)
SH
Jumpers:Short TX(-) to RX(-) becomes (-) signalShort TX(+) to RX(+) becomes (+) signal
TX(-) RX(-) TX(+) RX(+) SH
RS232 Port
UNICOM 2500
PC
Meter’s RS485 Port
v
Set switch to DCESet the
Baud rate
Set switch to HD
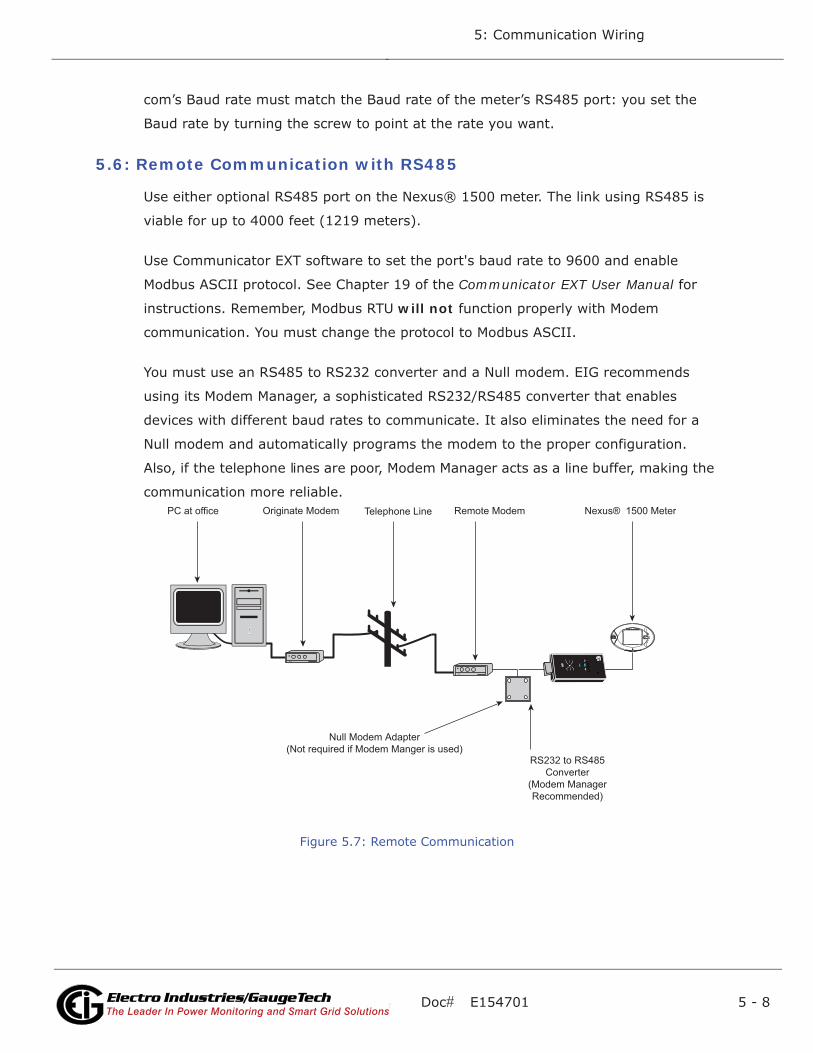
Doc# E154701 5 - 8
5: Communication Wiring
Electro Industries/GaugeTechThe Leader In Power Monitoring and Smart Grid SolutionsElectro Industries/GaugeTechThe Leader In Power Monitoring and Smart Grid Solutions
com’s Baud rate must match the Baud rate of the meter’s RS485 port: you set the
Baud rate by turning the screw to point at the rate you want.
5.6: Remote Communication with RS485
Use either optional RS485 port on the Nexus® 1500 meter. The link using RS485 is
viable for up to 4000 feet (1219 meters).
Use Communicator EXT software to set the port's baud rate to 9600 and enable
Modbus ASCII protocol. See Chapter 19 of the Communicator EXT User Manual for
instructions. Remember, Modbus RTU will not function properly with Modem
communication. You must change the protocol to Modbus ASCII.
You must use an RS485 to RS232 converter and a Null modem. EIG recommends
using its Modem Manager, a sophisticated RS232/RS485 converter that enables
devices with different baud rates to communicate. It also eliminates the need for a
Null modem and automatically programs the modem to the proper configuration.
Also, if the telephone lines are poor, Modem Manager acts as a line buffer, making the
communication more reliable.
Figure 5.7: Remote Communication
RS232 to RS485Converter
(Modem ManagerRecommended)
Nexus® 1500 MeterTelephone LinePC at office Remote ModemOriginate Modem
Null Modem Adapter(Not required if Modem Manger is used)
Doc# E154701 5 - 9
5: Communication Wiring
Electro Industries/GaugeTechThe Leader In Power Monitoring and Smart Grid SolutionsElectro Industries/GaugeTechThe Leader In Power Monitoring and Smart Grid Solutions
5.7: Programming Modems for Remote Communication
You must program a modem before it can communicate properly with most RS485 or
RS232-based devices. This task is often quite complicated because modems can be
unpredictable when communicating with remote devices.
If you are not using the EIG Modem Manager device, you must set the following
strings to communicate with the remote Nexus® meter(s). Consult your modem’s
User manual for the proper string settings or see Section 5.8 for a list of selected
modem strings.
Modem Connected to a Computer (the Originate Modem)
• Restore modem to factory settings. This erases all previously programmed settings.
• Set modem to display Result Codes. The computer will use the result codes.
• Set modem to Verbal Result Codes. The computer will use the verbal result codes.
• Set modem to use DTR Signal. This is necessary for the computer to insure connec-
tion with the originate modem.
• Set modem to enable Flow Control. This is necessary to communicate with remote
modem connected to the Nexus® meter.
• Instruct modem to write the new settings to activate profile. This places these
settings into nonvolatile memory; the setting will take effect after the modem
powers up.
Modem Connected to the Nexus® Meter (the Remote Modem)
• Restore modem to factory settings. This erases all previously programmed settings.
• Set modem to auto answer on n rings. This sets the remote modem to answer the
call after n rings.
• Set modem to ignore DTR Signal. This is necessary for the Nexus® meter, to insure
connection with originate modem.
• Set modem to disable Flow Control. The Nexus® meter’s RS232 communication
does not support this feature.
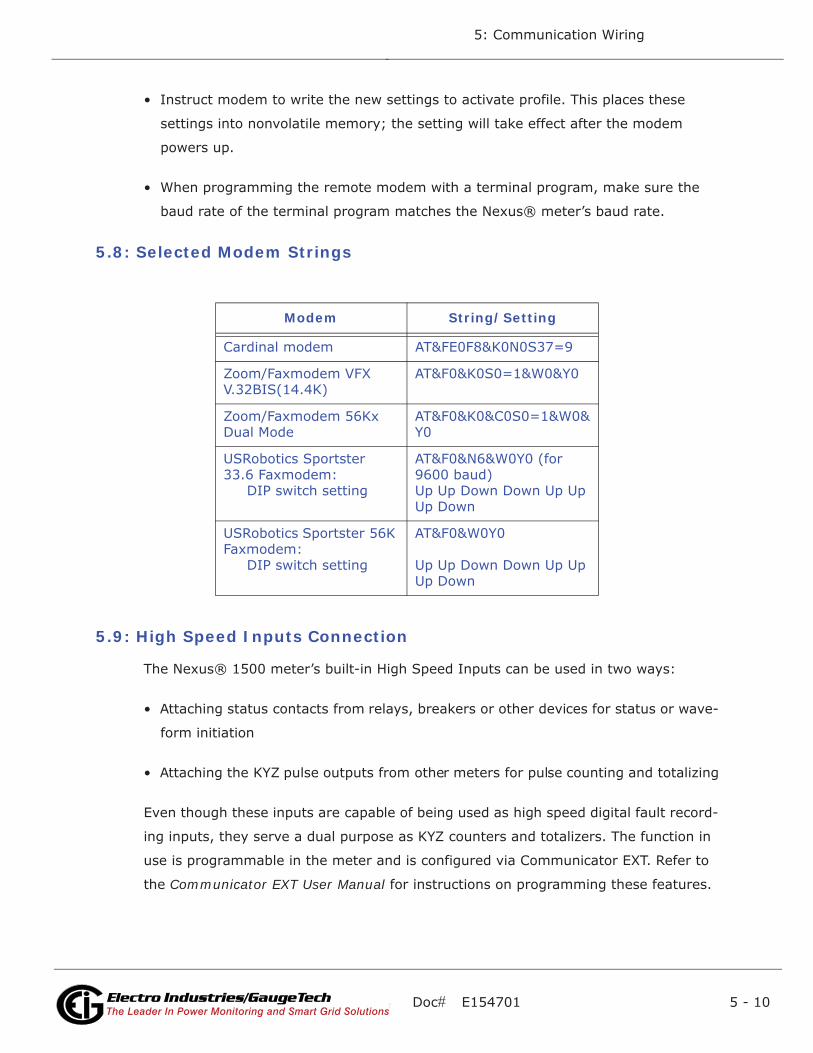
Doc# E154701 5 - 10
5: Communication Wiring
Electro Industries/GaugeTechThe Leader In Power Monitoring and Smart Grid SolutionsElectro Industries/GaugeTechThe Leader In Power Monitoring and Smart Grid Solutions
• Instruct modem to write the new settings to activate profile. This places these
settings into nonvolatile memory; the setting will take effect after the modem
powers up.
• When programming the remote modem with a terminal program, make sure the
baud rate of the terminal program matches the Nexus® meter’s baud rate.
5.8: Selected Modem Strings
5.9: High Speed Inputs Connection
The Nexus® 1500 meter’s built-in High Speed Inputs can be used in two ways:
• Attaching status contacts from relays, breakers or other devices for status or wave-
form initiation
• Attaching the KYZ pulse outputs from other meters for pulse counting and totalizing
Even though these inputs are capable of being used as high speed digital fault record-
ing inputs, they serve a dual purpose as KYZ counters and totalizers. The function in
use is programmable in the meter and is configured via Communicator EXT. Refer to
the Communicator EXT User Manual for instructions on programming these features.
Table 1:
Modem String/Setting
Cardinal modem AT&FE0F8&K0N0S37=9
Zoom/Faxmodem VFX V.32BIS(14.4K)
AT&F0&K0S0=1&W0&Y0
Zoom/Faxmodem 56Kx Dual Mode
AT&F0&K0&C0S0=1&W0&Y0
USRobotics Sportster 33.6 Faxmodem: DIP switch setting
AT&F0&N6&W0Y0 (for 9600 baud)Up Up Down Down Up Up Up Down
USRobotics Sportster 56K Faxmodem: DIP switch setting
AT&F0&W0Y0
Up Up Down Down Up Up Up Down
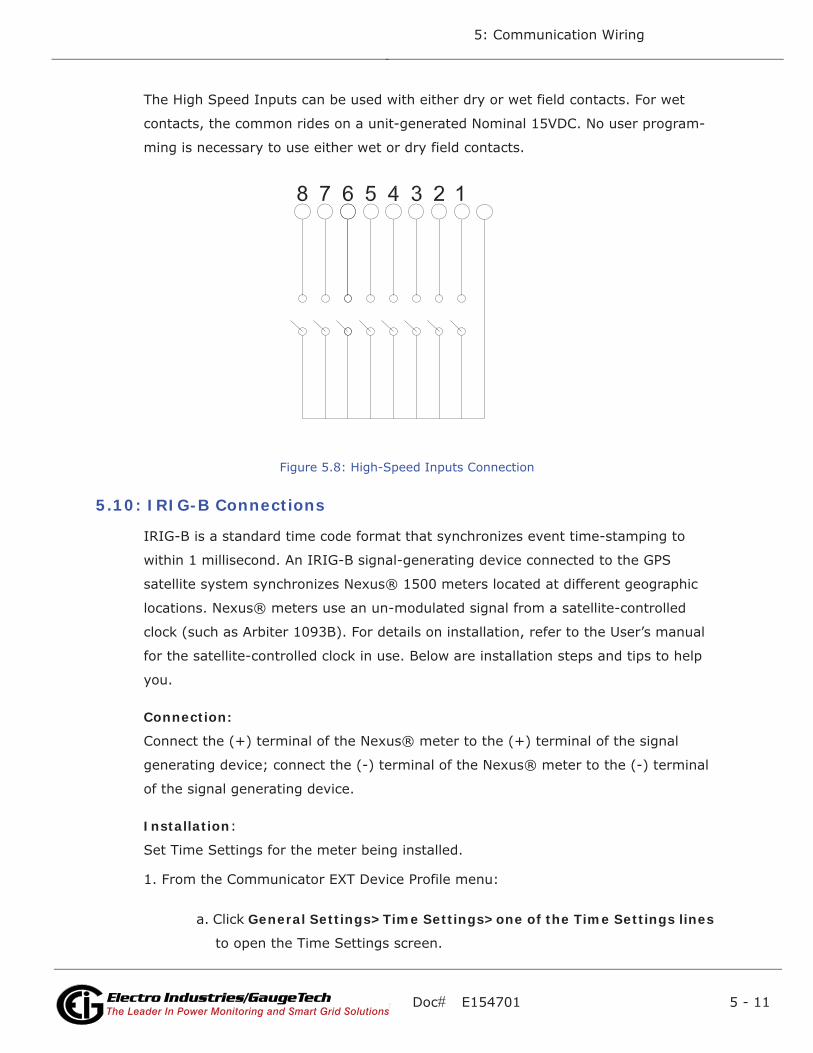
Doc# E154701 5 - 11
5: Communication Wiring
Electro Industries/GaugeTechThe Leader In Power Monitoring and Smart Grid SolutionsElectro Industries/GaugeTechThe Leader In Power Monitoring and Smart Grid Solutions
The High Speed Inputs can be used with either dry or wet field contacts. For wet
contacts, the common rides on a unit-generated Nominal 15VDC. No user program-
ming is necessary to use either wet or dry field contacts.
Figure 5.8: High-Speed Inputs Connection
5.10: IRIG-B Connections
IRIG-B is a standard time code format that synchronizes event time-stamping to
within 1 millisecond. An IRIG-B signal-generating device connected to the GPS
satellite system synchronizes Nexus® 1500 meters located at different geographic
locations. Nexus® meters use an un-modulated signal from a satellite-controlled
clock (such as Arbiter 1093B). For details on installation, refer to the User’s manual
for the satellite-controlled clock in use. Below are installation steps and tips to help
you.
Connection:
Connect the (+) terminal of the Nexus® meter to the (+) terminal of the signal
generating device; connect the (-) terminal of the Nexus® meter to the (-) terminal
of the signal generating device.
Installation:
Set Time Settings for the meter being installed.
1. From the Communicator EXT Device Profile menu:
a. Click General Settings>Time Settings>one of the Time Settings lines
to open the Time Settings screen.
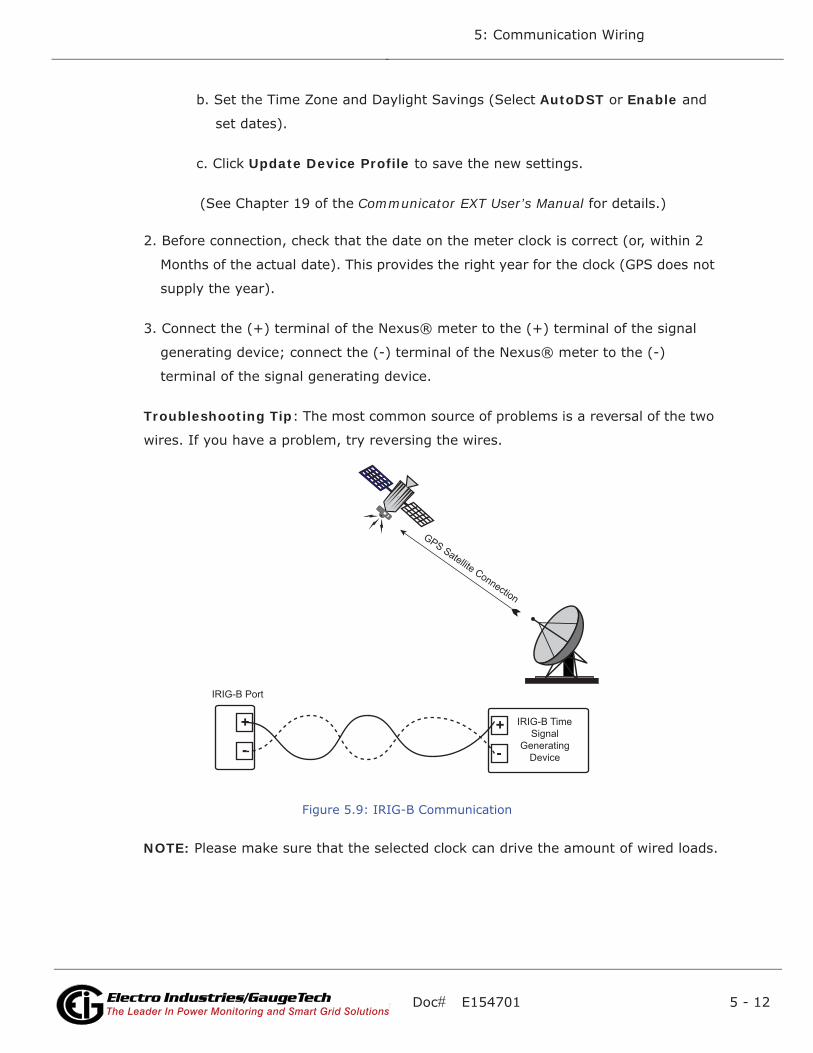
Doc# E154701 5 - 12
5: Communication Wiring
Electro Industries/GaugeTechThe Leader In Power Monitoring and Smart Grid SolutionsElectro Industries/GaugeTechThe Leader In Power Monitoring and Smart Grid Solutions
b. Set the Time Zone and Daylight Savings (Select AutoDST or Enable and
set dates).
c. Click Update Device Profile to save the new settings.
(See Chapter 19 of the Communicator EXT User’s Manual for details.)
2. Before connection, check that the date on the meter clock is correct (or, within 2
Months of the actual date). This provides the right year for the clock (GPS does not
supply the year).
3. Connect the (+) terminal of the Nexus® meter to the (+) terminal of the signal
generating device; connect the (-) terminal of the Nexus® meter to the (-)
terminal of the signal generating device.
Troubleshooting Tip: The most common source of problems is a reversal of the two
wires. If you have a problem, try reversing the wires.
Figure 5.9: IRIG-B Communication
NOTE: Please make sure that the selected clock can drive the amount of wired loads.
+
- +
-
IRIG-B Port
IRIG-B Time Signal
Generating Device
GPS Satellite Connection
Doc# E154701 5 - 13
5: Communication Wiring
Electro Industries/GaugeTechThe Leader In Power Monitoring and Smart Grid SolutionsElectro Industries/GaugeTechThe Leader In Power Monitoring and Smart Grid Solutions
5.11: Time Synchronization Alternatives
(See the Communicator EXT User Manual for details.)
IRIG-B
• All Nexus® 1500 meters are equipped to use IRIG-B for time synchronization.
• If IRIG-B is connected, this form of time synchronization takes precedence over the
internal clock. If the GPS Signal is lost, the internal clock takes over time keeping
at the precise moment the signal is lost.
Line Frequency Clock Synchronization
• All Nexus® meters are equipped with Line Frequency Clock Synchronization, which
may be enabled or disabled for use instead of IRIG-B. If Line Frequency Clock
Synchronization is enabled and power is lost, the internal clock takes over at the
precise moment power is lost.
Internal Clock Crystal
• All Nexus® meters are equipped with internal clocks crystals which are accurate to
20ppm, and which can be used if IRIG-B is not connected and/or Line Frequency
Clock Synchronization is not enabled.
DNP Time Synchronization
• Using Communicator EXT, you can set the meter to request time synchronization
from the DNP Master. Requests can be made from once per minute to once per day.
See the Nexus® 1252/1262/1272/1500 DNP User Manual for instructions. You can
download the manual from EIG’s website:
www.electroind.com/dl_page.html.
Other Time Setting Tools
• Tools>Set Device Time: for manual or PC Time Setting
• Script & Scheduler: time Stamps Retrieved Logs and Data
• MV90: can synchronize time on retrievals in the form of a time stamp; refer to the
Communicator EXT User Manual (HHF Converter) for more MV-90 details.

Doc# E154701 5 - 14
5: Communication Wiring
Electro Industries/GaugeTechThe Leader In Power Monitoring and Smart Grid SolutionsElectro Industries/GaugeTechThe Leader In Power Monitoring and Smart Grid Solutions
This page intentionally left blank.
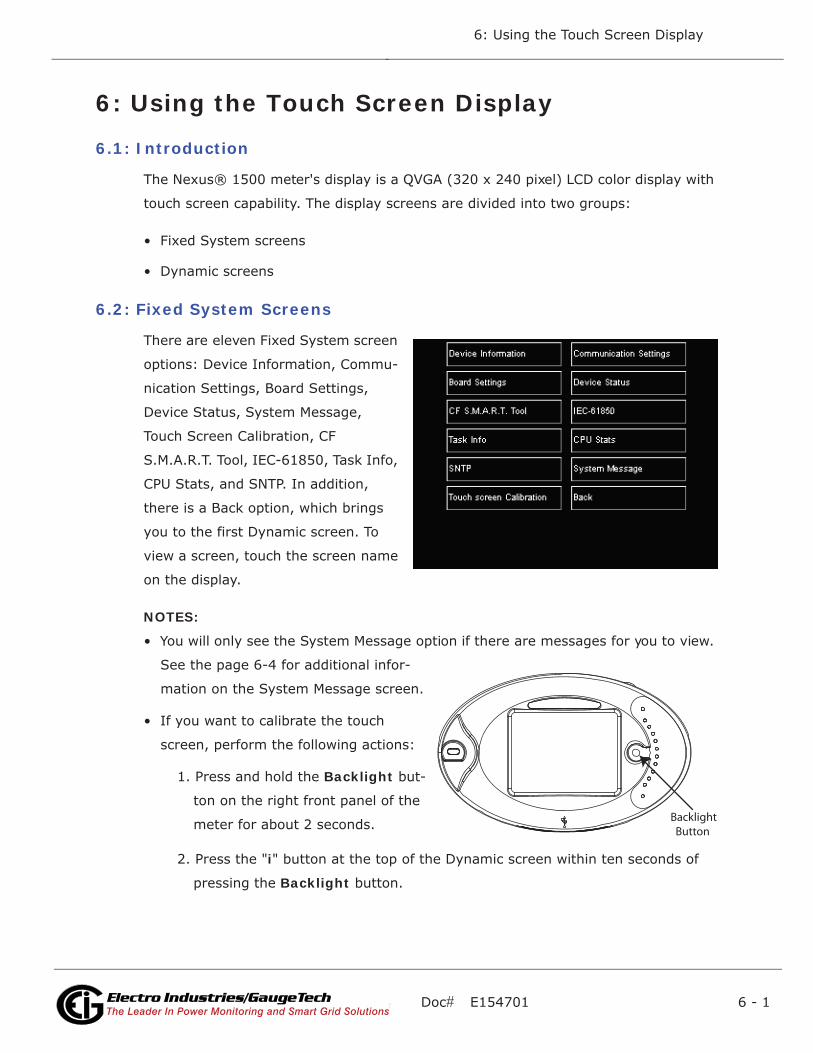
Doc# E154701 6 - 1
6: Using the Touch Screen Display
Electro Industries/GaugeTechThe Leader In Power Monitoring and Smart Grid SolutionsElectro Industries/GaugeTechThe Leader In Power Monitoring and Smart Grid Solutions
6: Using the Touch Screen Display
6.1: Introduction
The Nexus® 1500 meter's display is a QVGA (320 x 240 pixel) LCD color display with
touch screen capability. The display screens are divided into two groups:
• Fixed System screens
• Dynamic screens
6.2: Fixed System Screens
There are eleven Fixed System screen
options: Device Information, Commu-
nication Settings, Board Settings,
Device Status, System Message,
Touch Screen Calibration, CF
S.M.A.R.T. Tool, IEC-61850, Task Info,
CPU Stats, and SNTP. In addition,
there is a Back option, which brings
you to the first Dynamic screen. To
view a screen, touch the screen name
on the display.
NOTES:
• You will only see the System Message option if there are messages for you to view.
See the page 6-4 for additional infor-
mation on the System Message screen.
• If you want to calibrate the touch
screen, perform the following actions:
1. Press and hold the Backlight but-
ton on the right front panel of the
meter for about 2 seconds.
2. Press the "i" button at the top of the Dynamic screen within ten seconds of
pressing the Backlight button.
Backlight Button
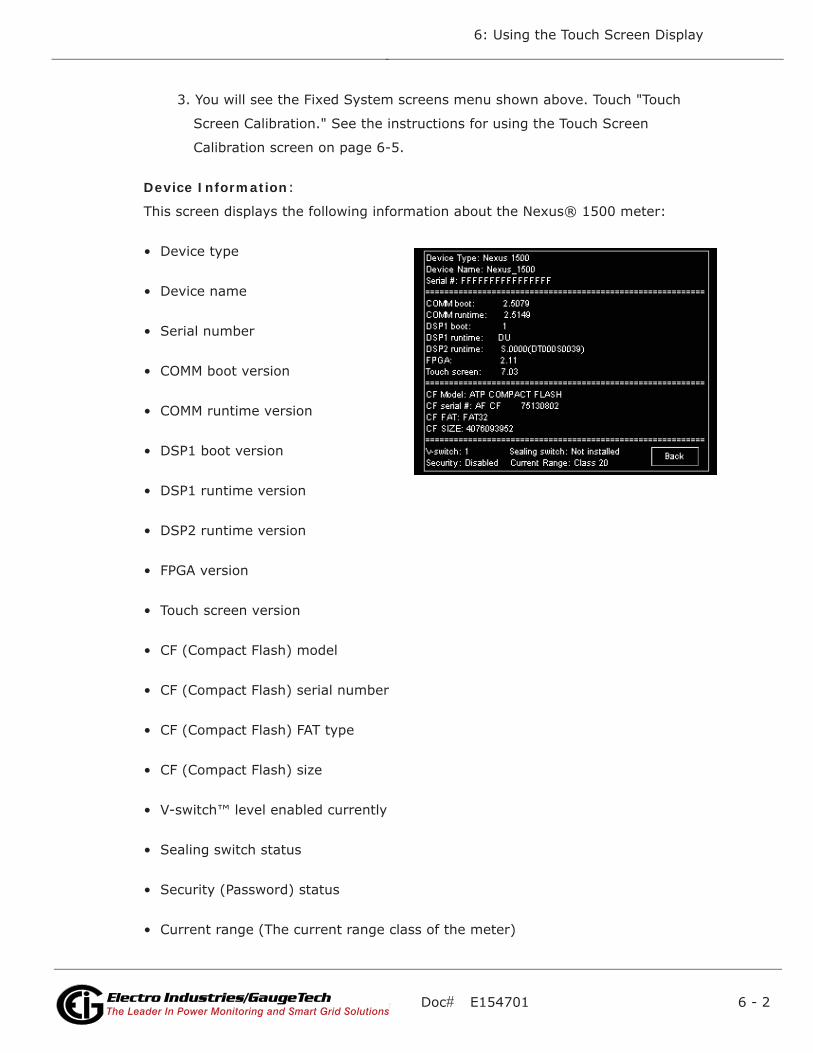
Doc# E154701 6 - 2
6: Using the Touch Screen Display
Electro Industries/GaugeTechThe Leader In Power Monitoring and Smart Grid SolutionsElectro Industries/GaugeTechThe Leader In Power Monitoring and Smart Grid Solutions
3. You will see the Fixed System screens menu shown above. Touch "Touch
Screen Calibration." See the instructions for using the Touch Screen
Calibration screen on page 6-5.
Device Information:
This screen displays the following information about the Nexus® 1500 meter:
• Device type
• Device name
• Serial number
• COMM boot version
• COMM runtime version
• DSP1 boot version
• DSP1 runtime version
• DSP2 runtime version
• FPGA version
• Touch screen version
• CF (Compact Flash) model
• CF (Compact Flash) serial number
• CF (Compact Flash) FAT type
• CF (Compact Flash) size
• V-switch™ level enabled currently
• Sealing switch status
• Security (Password) status
• Current range (The current range class of the meter)
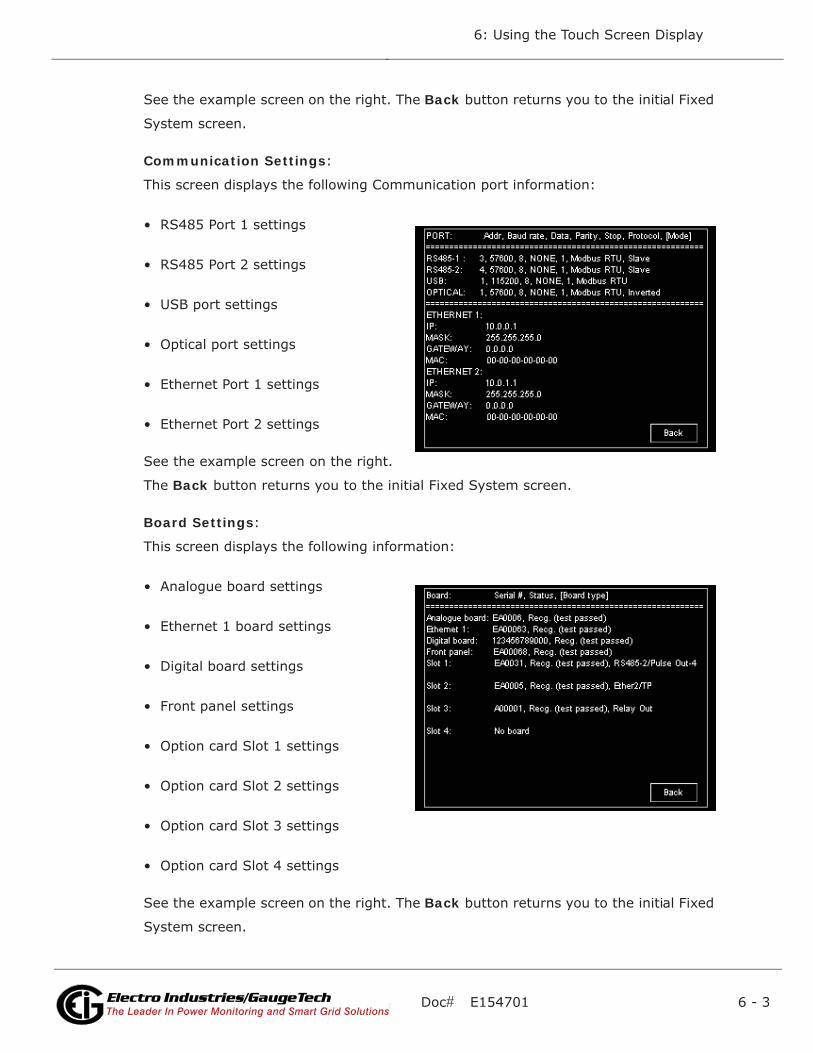
Doc# E154701 6 - 3
6: Using the Touch Screen Display
Electro Industries/GaugeTechThe Leader In Power Monitoring and Smart Grid SolutionsElectro Industries/GaugeTechThe Leader In Power Monitoring and Smart Grid Solutions
See the example screen on the right. The Back button returns you to the initial Fixed
System screen.
Communication Settings:
This screen displays the following Communication port information:
• RS485 Port 1 settings
• RS485 Port 2 settings
• USB port settings
• Optical port settings
• Ethernet Port 1 settings
• Ethernet Port 2 settings
See the example screen on the right.
The Back button returns you to the initial Fixed System screen.
Board Settings:
This screen displays the following information:
• Analogue board settings
• Ethernet 1 board settings
• Digital board settings
• Front panel settings
• Option card Slot 1 settings
• Option card Slot 2 settings
• Option card Slot 3 settings
• Option card Slot 4 settings
See the example screen on the right. The Back button returns you to the initial Fixed
System screen.
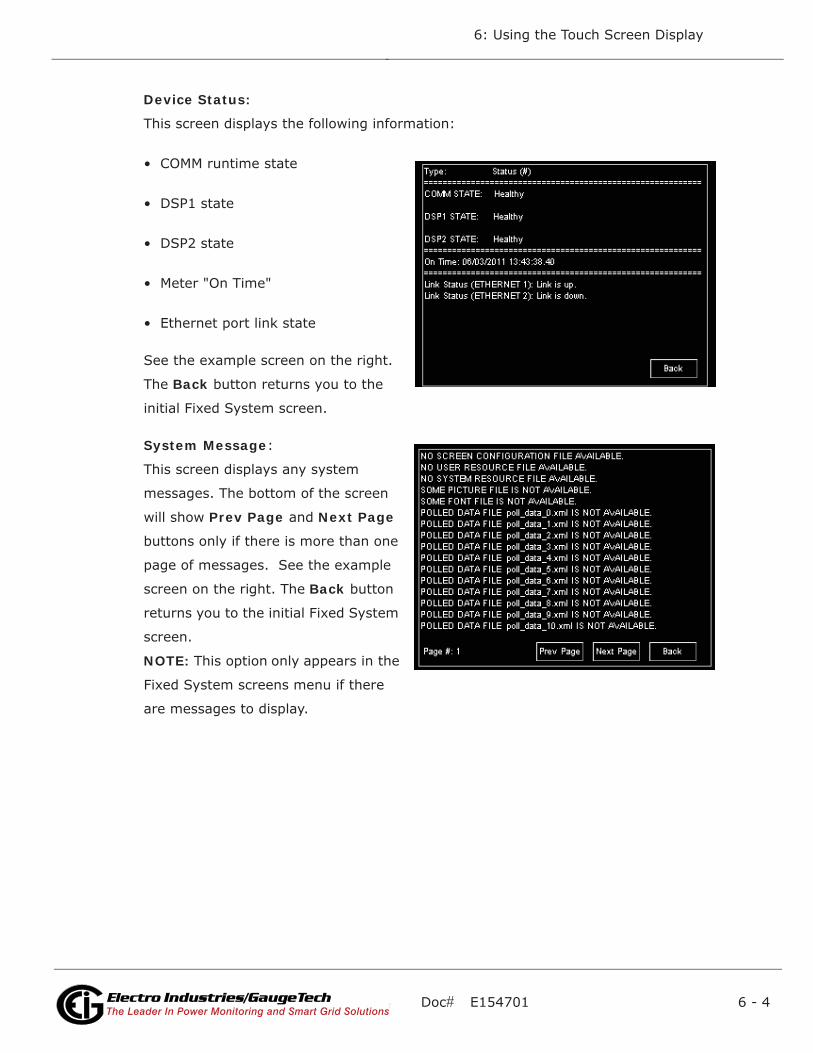
Doc# E154701 6 - 4
6: Using the Touch Screen Display
Electro Industries/GaugeTechThe Leader In Power Monitoring and Smart Grid SolutionsElectro Industries/GaugeTechThe Leader In Power Monitoring and Smart Grid Solutions
Device Status:
This screen displays the following information:
• COMM runtime state
• DSP1 state
• DSP2 state
• Meter "On Time"
• Ethernet port link state
See the example screen on the right.
The Back button returns you to the
initial Fixed System screen.
System Message:
This screen displays any system
messages. The bottom of the screen
will show Prev Page and Next Page
buttons only if there is more than one
page of messages. See the example
screen on the right. The Back button
returns you to the initial Fixed System
screen.
NOTE: This option only appears in the
Fixed System screens menu if there
are messages to display.
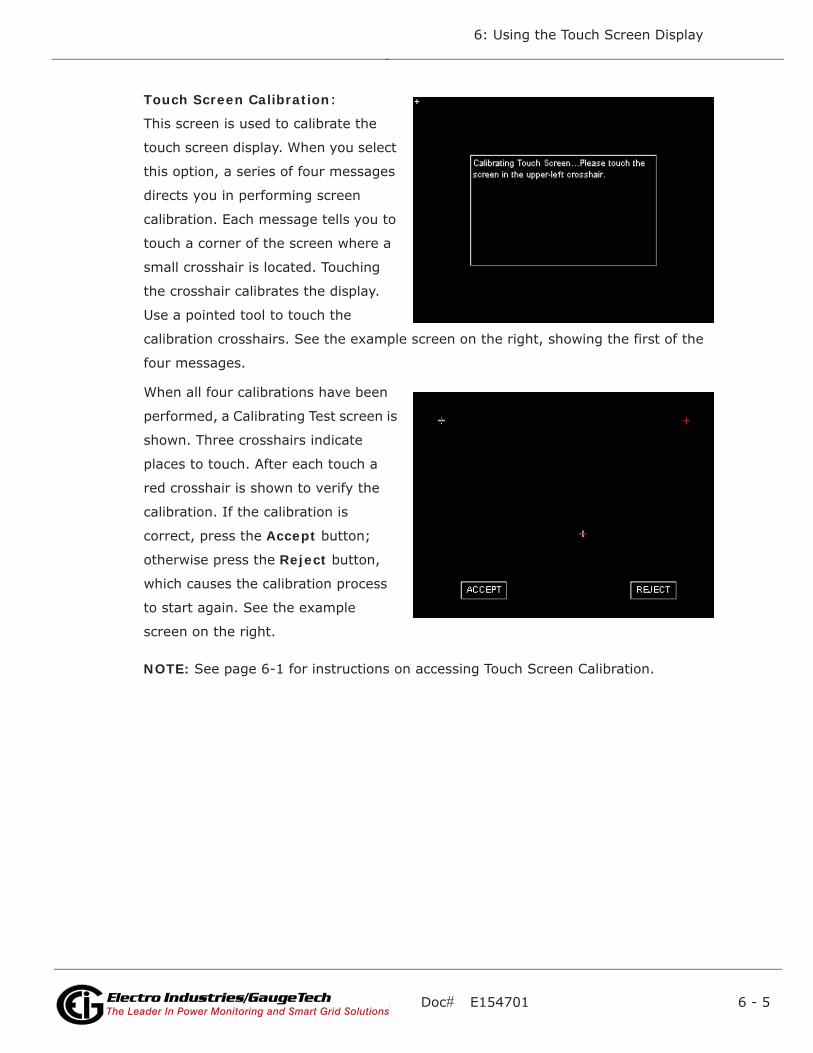
Doc# E154701 6 - 5
6: Using the Touch Screen Display
Electro Industries/GaugeTechThe Leader In Power Monitoring and Smart Grid SolutionsElectro Industries/GaugeTechThe Leader In Power Monitoring and Smart Grid Solutions
Touch Screen Calibration:
This screen is used to calibrate the
touch screen display. When you select
this option, a series of four messages
directs you in performing screen
calibration. Each message tells you to
touch a corner of the screen where a
small crosshair is located. Touching
the crosshair calibrates the display.
Use a pointed tool to touch the
calibration crosshairs. See the example screen on the right, showing the first of the
four messages.
When all four calibrations have been
performed, a Calibrating Test screen is
shown. Three crosshairs indicate
places to touch. After each touch a
red crosshair is shown to verify the
calibration. If the calibration is
correct, press the Accept button;
otherwise press the Reject button,
which causes the calibration process
to start again. See the example
screen on the right.
NOTE: See page 6-1 for instructions on accessing Touch Screen Calibration.
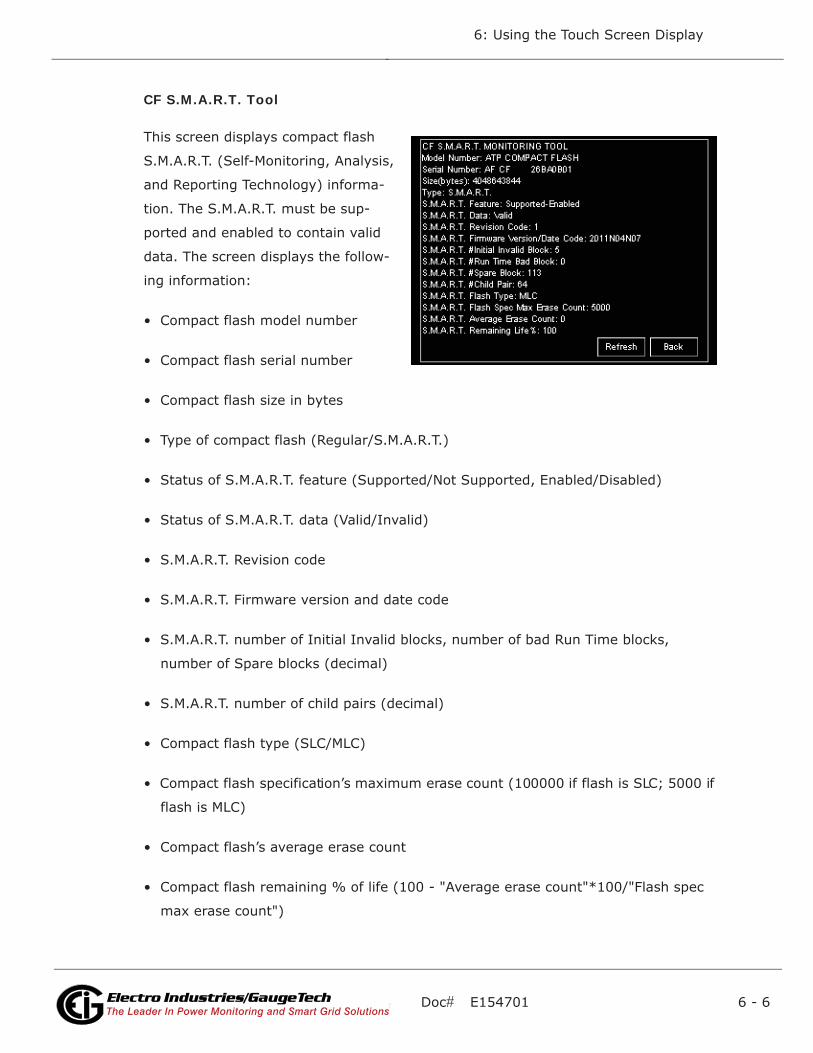
Doc# E154701 6 - 6
6: Using the Touch Screen Display
Electro Industries/GaugeTechThe Leader In Power Monitoring and Smart Grid SolutionsElectro Industries/GaugeTechThe Leader In Power Monitoring and Smart Grid Solutions
CF S.M.A.R.T. Tool
This screen displays compact flash
S.M.A.R.T. (Self-Monitoring, Analysis,
and Reporting Technology) informa-
tion. The S.M.A.R.T. must be sup-
ported and enabled to contain valid
data. The screen displays the follow-
ing information:
• Compact flash model number
• Compact flash serial number
• Compact flash size in bytes
• Type of compact flash (Regular/S.M.A.R.T.)
• Status of S.M.A.R.T. feature (Supported/Not Supported, Enabled/Disabled)
• Status of S.M.A.R.T. data (Valid/Invalid)
• S.M.A.R.T. Revision code
• S.M.A.R.T. Firmware version and date code
• S.M.A.R.T. number of Initial Invalid blocks, number of bad Run Time blocks,
number of Spare blocks (decimal)
• S.M.A.R.T. number of child pairs (decimal)
• Compact flash type (SLC/MLC)
• Compact flash specification’s maximum erase count (100000 if flash is SLC; 5000 if
flash is MLC)
• Compact flash’s average erase count
• Compact flash remaining % of life (100 - "Average erase count"*100/"Flash spec
max erase count")
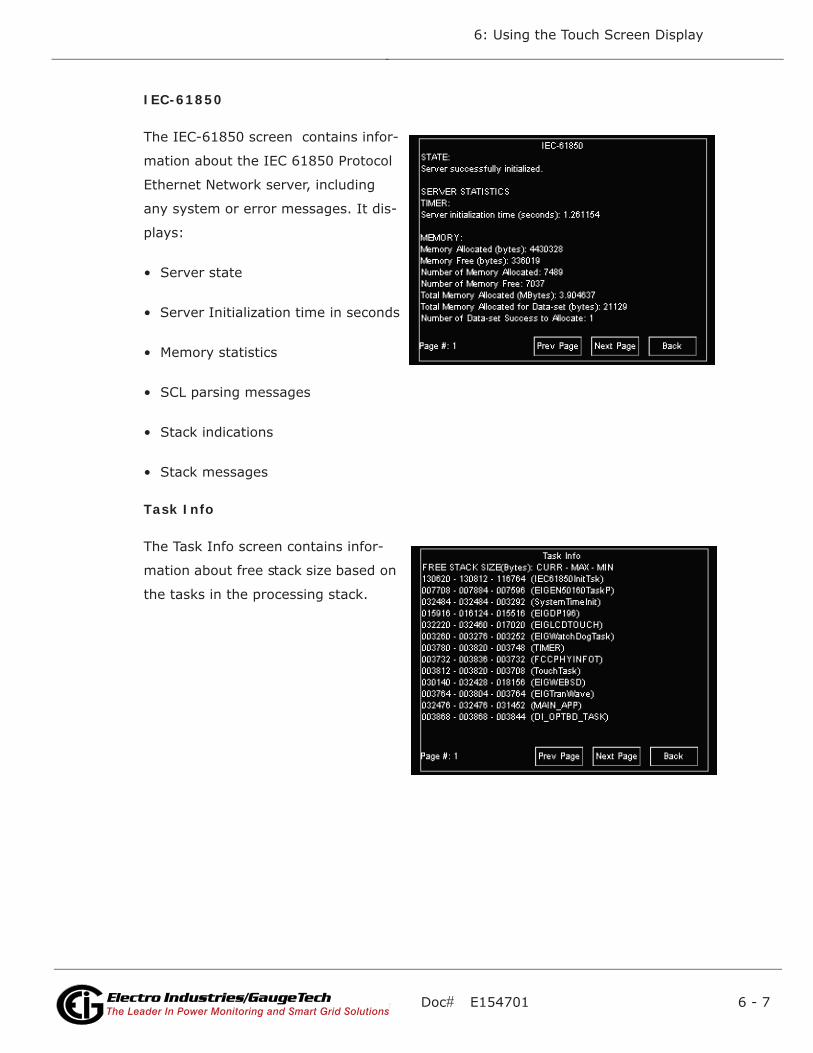
Doc# E154701 6 - 7
6: Using the Touch Screen Display
Electro Industries/GaugeTechThe Leader In Power Monitoring and Smart Grid SolutionsElectro Industries/GaugeTechThe Leader In Power Monitoring and Smart Grid Solutions
IEC-61850
The IEC-61850 screen contains infor-
mation about the IEC 61850 Protocol
Ethernet Network server, including
any system or error messages. It dis-
plays:
• Server state
• Server Initialization time in seconds
• Memory statistics
• SCL parsing messages
• Stack indications
• Stack messages
Task Info
The Task Info screen contains infor-
mation about free stack size based on
the tasks in the processing stack.
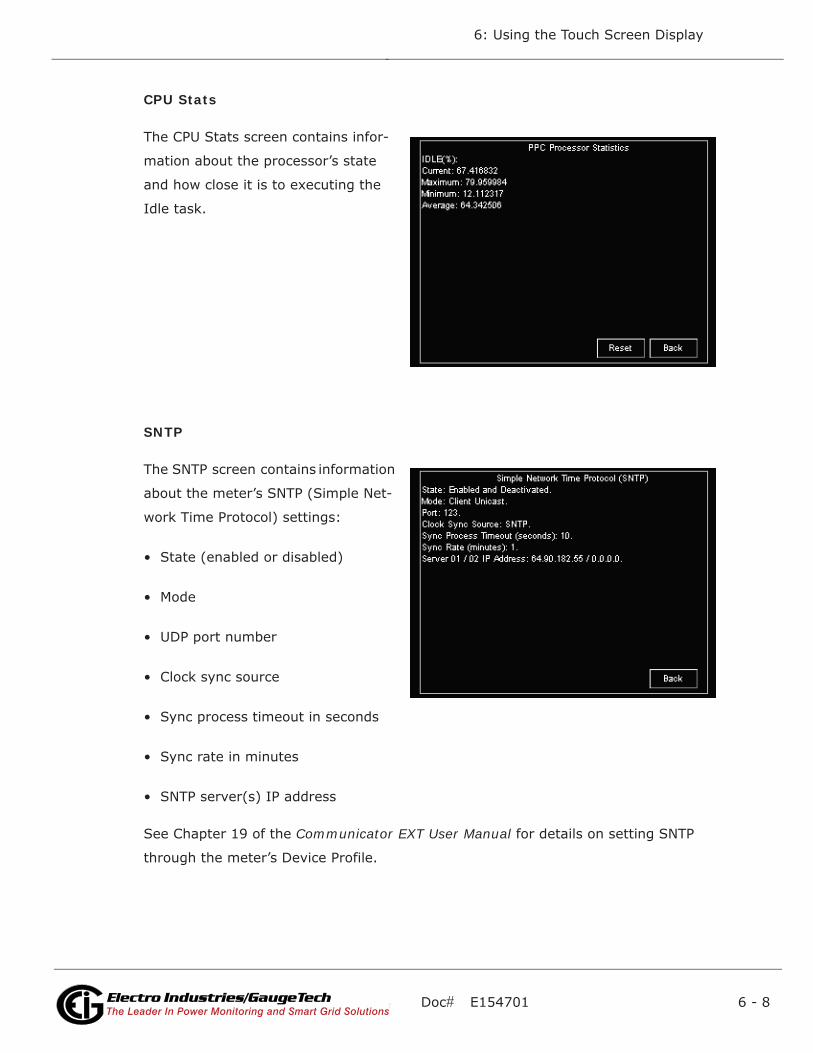
Doc# E154701 6 - 8
6: Using the Touch Screen Display
Electro Industries/GaugeTechThe Leader In Power Monitoring and Smart Grid SolutionsElectro Industries/GaugeTechThe Leader In Power Monitoring and Smart Grid Solutions
CPU Stats
The CPU Stats screen contains infor-
mation about the processor’s state
and how close it is to executing the
Idle task.
SNTP
The SNTP screen contains information
about the meter’s SNTP (Simple Net-
work Time Protocol) settings:
• State (enabled or disabled)
• Mode
• UDP port number
• Clock sync source
• Sync process timeout in seconds
• Sync rate in minutes
• SNTP server(s) IP address
See Chapter 19 of the Communicator EXT User Manual for details on setting SNTP
through the meter’s Device Profile.
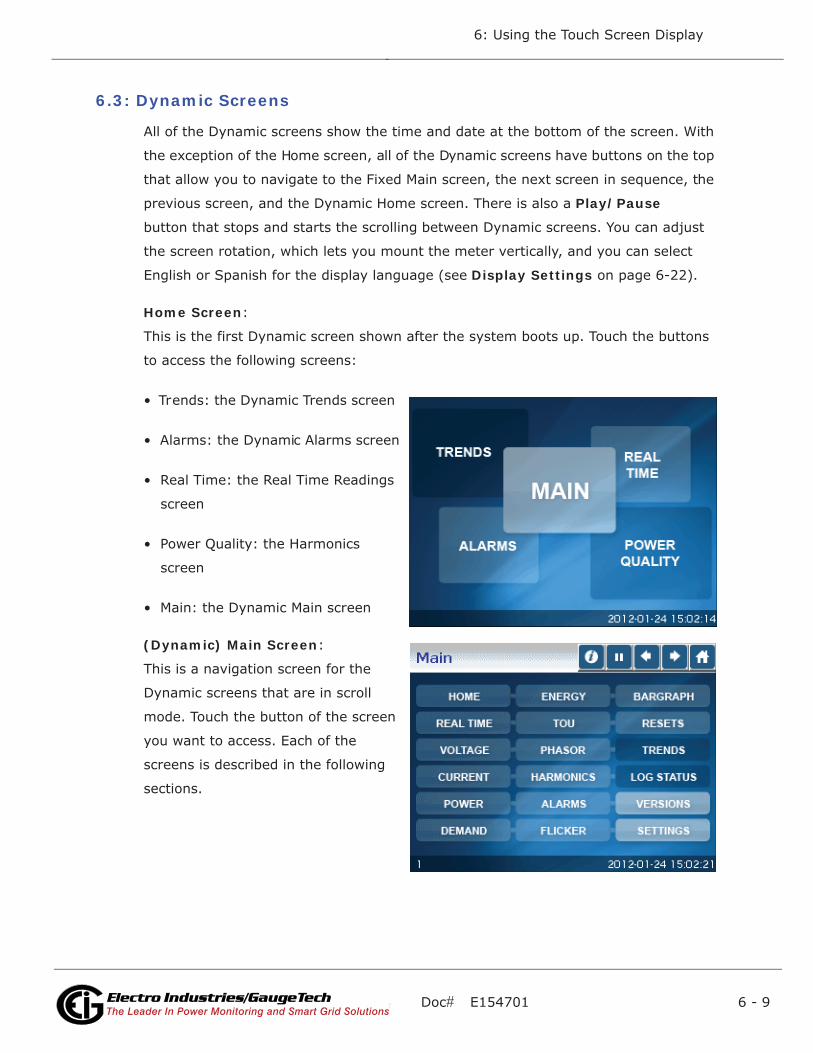
Doc# E154701 6 - 9
6: Using the Touch Screen Display
Electro Industries/GaugeTechThe Leader In Power Monitoring and Smart Grid SolutionsElectro Industries/GaugeTechThe Leader In Power Monitoring and Smart Grid Solutions
6.3: Dynamic Screens
All of the Dynamic screens show the time and date at the bottom of the screen. With
the exception of the Home screen, all of the Dynamic screens have buttons on the top
that allow you to navigate to the Fixed Main screen, the next screen in sequence, the
previous screen, and the Dynamic Home screen. There is also a Play/Pause
button that stops and starts the scrolling between Dynamic screens. You can adjust
the screen rotation, which lets you mount the meter vertically, and you can select
English or Spanish for the display language (see Display Settings on page 6-22).
Home Screen:
This is the first Dynamic screen shown after the system boots up. Touch the buttons
to access the following screens:
• Trends: the Dynamic Trends screen
• Alarms: the Dynamic Alarms screen
• Real Time: the Real Time Readings
screen
• Power Quality: the Harmonics
screen
• Main: the Dynamic Main screen
(Dynamic) Main Screen:
This is a navigation screen for the
Dynamic screens that are in scroll
mode. Touch the button of the screen
you want to access. Each of the
screens is described in the following
sections.
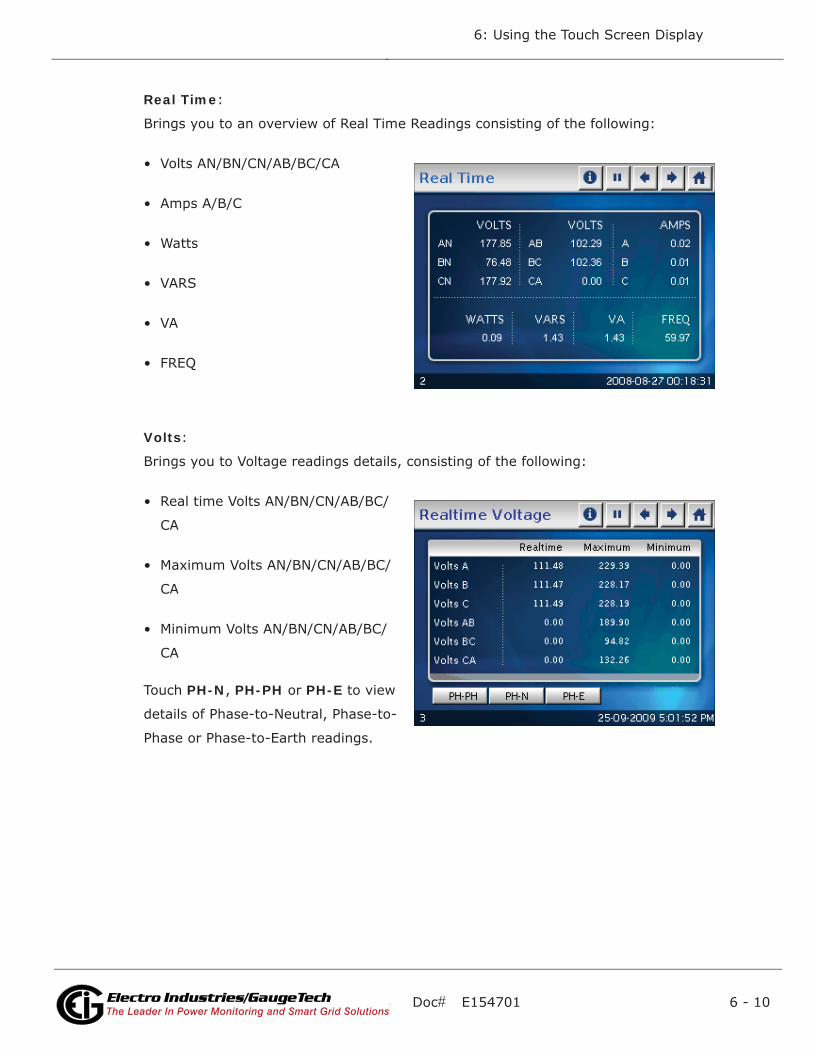
Doc# E154701 6 - 10
6: Using the Touch Screen Display
Electro Industries/GaugeTechThe Leader In Power Monitoring and Smart Grid SolutionsElectro Industries/GaugeTechThe Leader In Power Monitoring and Smart Grid Solutions
Real Time:
Brings you to an overview of Real Time Readings consisting of the following:
• Volts AN/BN/CN/AB/BC/CA
• Amps A/B/C
• Watts
• VARS
• VA
• FREQ
Volts:
Brings you to Voltage readings details, consisting of the following:
• Real time Volts AN/BN/CN/AB/BC/
CA
• Maximum Volts AN/BN/CN/AB/BC/
CA
• Minimum Volts AN/BN/CN/AB/BC/
CA
Touch PH-N, PH-PH or PH-E to view
details of Phase-to-Neutral, Phase-to-
Phase or Phase-to-Earth readings.
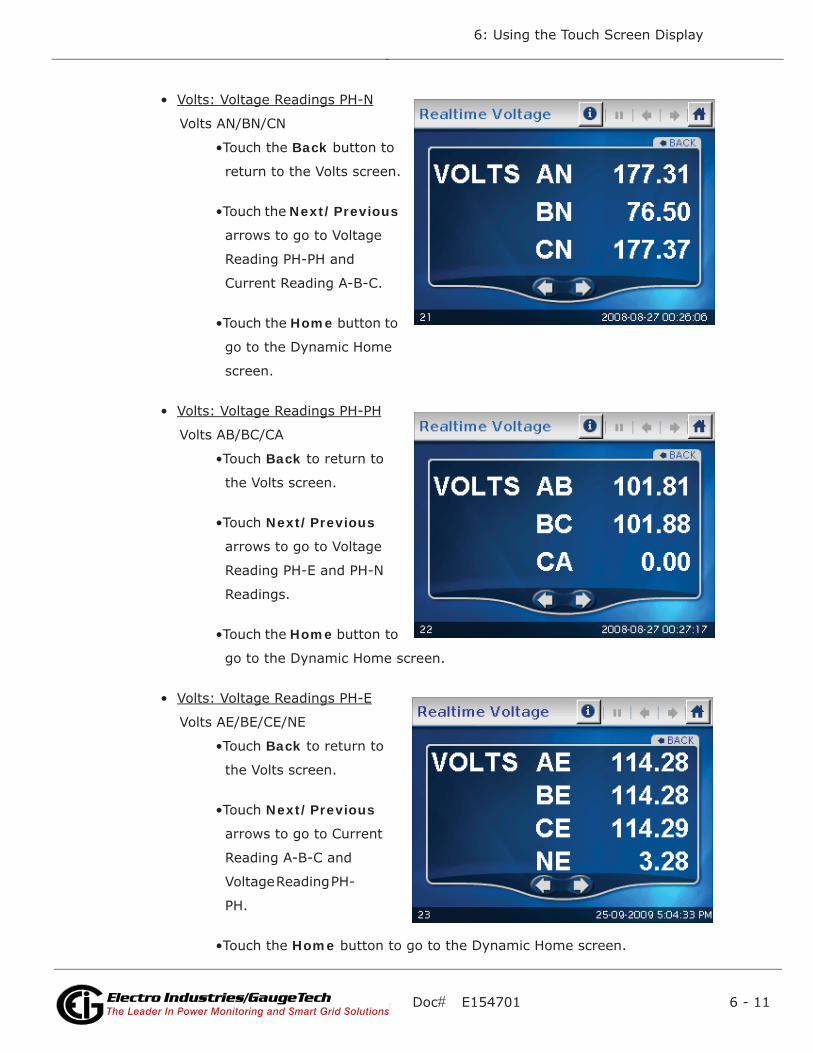
Doc# E154701 6 - 11
6: Using the Touch Screen Display
Electro Industries/GaugeTechThe Leader In Power Monitoring and Smart Grid SolutionsElectro Industries/GaugeTechThe Leader In Power Monitoring and Smart Grid Solutions
• Volts: Voltage Readings PH-N
Volts AN/BN/CN
•Touch the Back button to
return to the Volts screen.
•Touch the Next/Previous
arrows to go to Voltage
Reading PH-PH and
Current Reading A-B-C.
•Touch the Home button to
go to the Dynamic Home
screen.
• Volts: Voltage Readings PH-PH
Volts AB/BC/CA
•Touch Back to return to
the Volts screen.
•Touch Next/Previous
arrows to go to Voltage
Reading PH-E and PH-N
Readings.
•Touch the Home button to
go to the Dynamic Home screen.
• Volts: Voltage Readings PH-E
Volts AE/BE/CE/NE
•Touch Back to return to
the Volts screen.
•Touch Next/Previous
arrows to go to Current
Reading A-B-C and
Voltage Reading PH-
PH.
•Touch the Home button to go to the Dynamic Home screen.
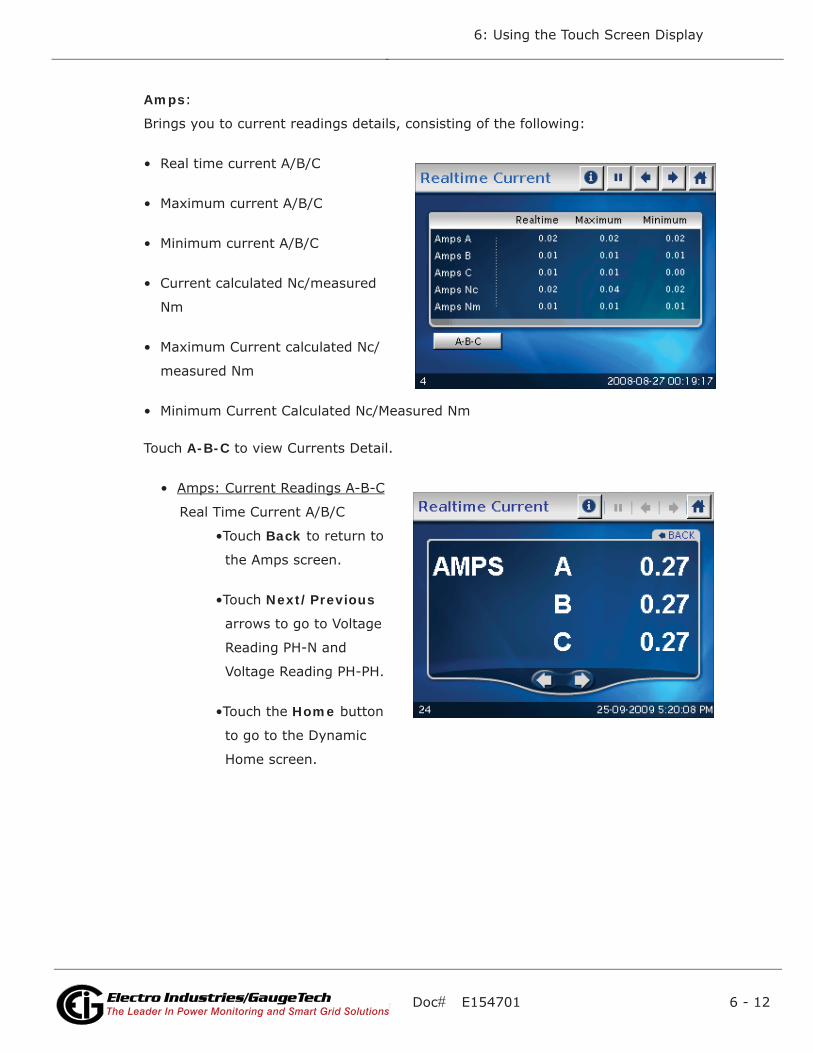
Doc# E154701 6 - 12
6: Using the Touch Screen Display
Electro Industries/GaugeTechThe Leader In Power Monitoring and Smart Grid SolutionsElectro Industries/GaugeTechThe Leader In Power Monitoring and Smart Grid Solutions
Amps:
Brings you to current readings details, consisting of the following:
• Real time current A/B/C
• Maximum current A/B/C
• Minimum current A/B/C
• Current calculated Nc/measured
Nm
• Maximum Current calculated Nc/
measured Nm
• Minimum Current Calculated Nc/Measured Nm
Touch A-B-C to view Currents Detail.
• Amps: Current Readings A-B-C
Real Time Current A/B/C
•Touch Back to return to
the Amps screen.
•Touch Next/Previous
arrows to go to Voltage
Reading PH-N and
Voltage Reading PH-PH.
•Touch the Home button
to go to the Dynamic
Home screen.
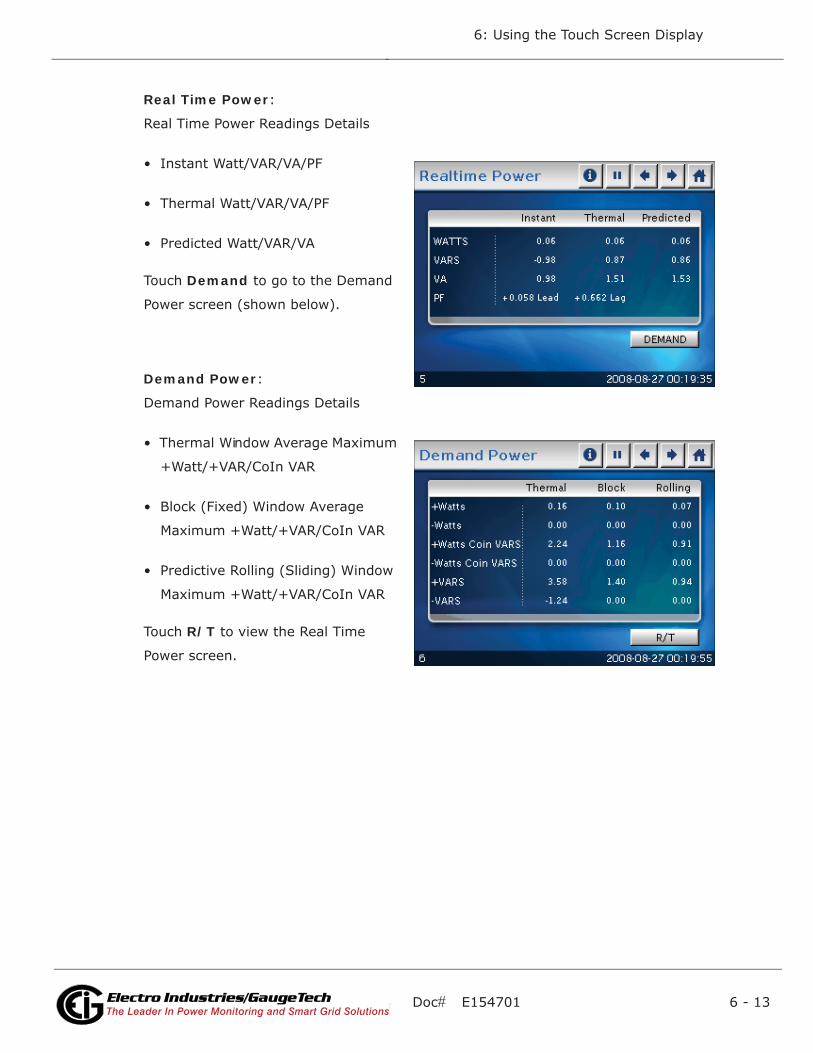
Doc# E154701 6 - 13
6: Using the Touch Screen Display
Electro Industries/GaugeTechThe Leader In Power Monitoring and Smart Grid SolutionsElectro Industries/GaugeTechThe Leader In Power Monitoring and Smart Grid Solutions
Real Time Power:
Real Time Power Readings Details
• Instant Watt/VAR/VA/PF
• Thermal Watt/VAR/VA/PF
• Predicted Watt/VAR/VA
Touch Demand to go to the Demand
Power screen (shown below).
Demand Power:
Demand Power Readings Details
• Thermal Window Average Maximum
+Watt/+VAR/CoIn VAR
• Block (Fixed) Window Average
Maximum +Watt/+VAR/CoIn VAR
• Predictive Rolling (Sliding) Window
Maximum +Watt/+VAR/CoIn VAR
Touch R/T to view the Real Time
Power screen.
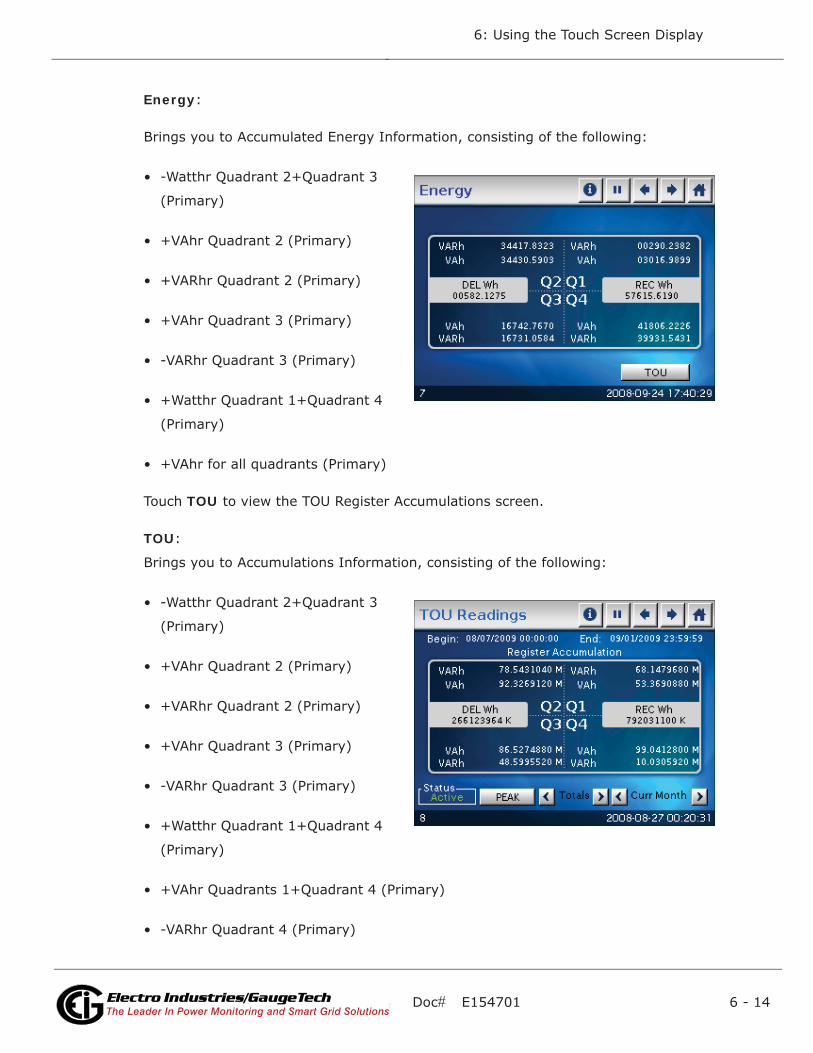
Doc# E154701 6 - 14
6: Using the Touch Screen Display
Electro Industries/GaugeTechThe Leader In Power Monitoring and Smart Grid SolutionsElectro Industries/GaugeTechThe Leader In Power Monitoring and Smart Grid Solutions
Energy:
Brings you to Accumulated Energy Information, consisting of the following:
• -Watthr Quadrant 2+Quadrant 3
(Primary)
• +VAhr Quadrant 2 (Primary)
• +VARhr Quadrant 2 (Primary)
• +VAhr Quadrant 3 (Primary)
• -VARhr Quadrant 3 (Primary)
• +Watthr Quadrant 1+Quadrant 4
(Primary)
• +VAhr for all quadrants (Primary)
Touch TOU to view the TOU Register Accumulations screen.
TOU:
Brings you to Accumulations Information, consisting of the following:
• -Watthr Quadrant 2+Quadrant 3
(Primary)
• +VAhr Quadrant 2 (Primary)
• +VARhr Quadrant 2 (Primary)
• +VAhr Quadrant 3 (Primary)
• -VARhr Quadrant 3 (Primary)
• +Watthr Quadrant 1+Quadrant 4
(Primary)
• +VAhr Quadrants 1+Quadrant 4 (Primary)
• -VARhr Quadrant 4 (Primary)
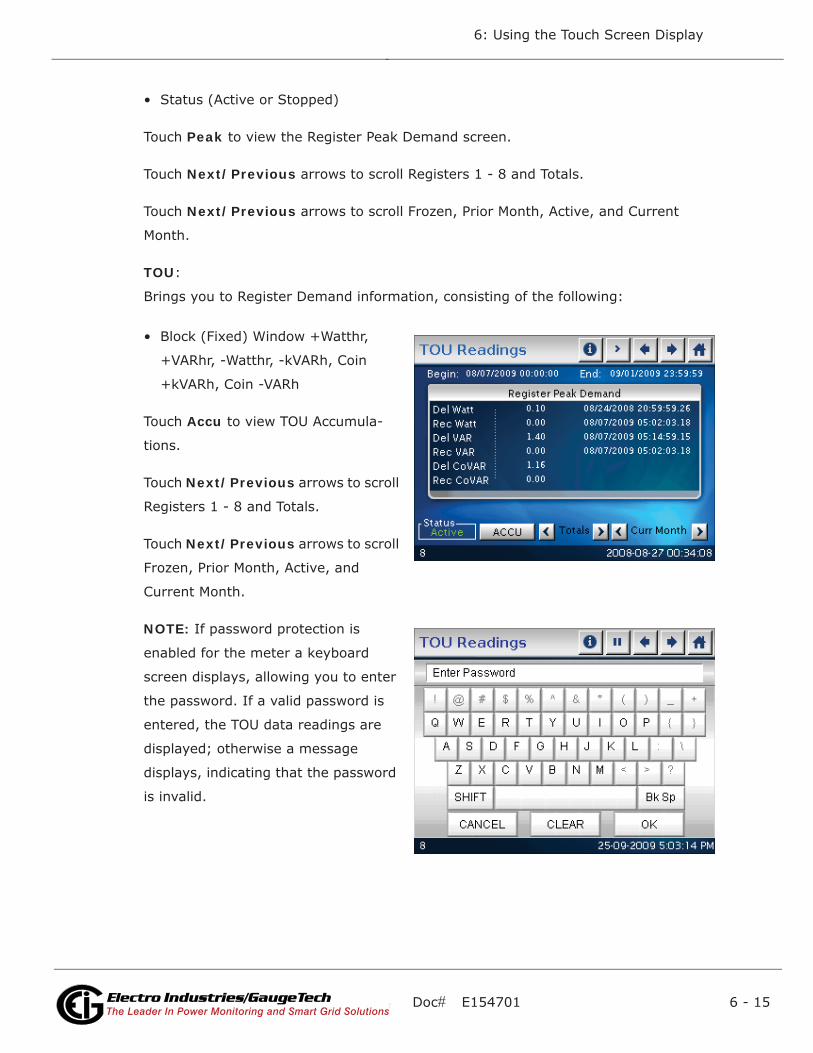
Doc# E154701 6 - 15
6: Using the Touch Screen Display
Electro Industries/GaugeTechThe Leader In Power Monitoring and Smart Grid SolutionsElectro Industries/GaugeTechThe Leader In Power Monitoring and Smart Grid Solutions
• Status (Active or Stopped)
Touch Peak to view the Register Peak Demand screen.
Touch Next/Previous arrows to scroll Registers 1 - 8 and Totals.
Touch Next/Previous arrows to scroll Frozen, Prior Month, Active, and Current
Month.
TOU:
Brings you to Register Demand information, consisting of the following:
• Block (Fixed) Window +Watthr,
+VARhr, -Watthr, -kVARh, Coin
+kVARh, Coin -VARh
Touch Accu to view TOU Accumula-
tions.
Touch Next/Previous arrows to scroll
Registers 1 - 8 and Totals.
Touch Next/Previous arrows to scroll
Frozen, Prior Month, Active, and
Current Month.
NOTE: If password protection is
enabled for the meter a keyboard
screen displays, allowing you to enter
the password. If a valid password is
entered, the TOU data readings are
displayed; otherwise a message
displays, indicating that the password
is invalid.
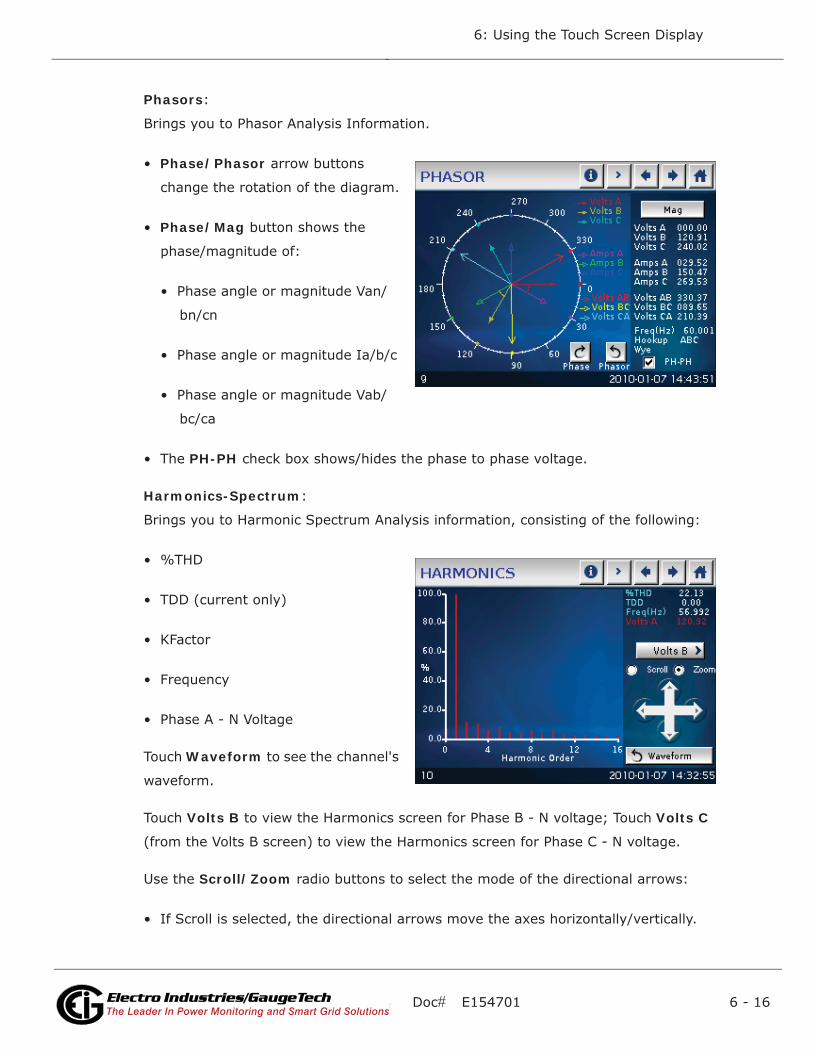
Doc# E154701 6 - 16
6: Using the Touch Screen Display
Electro Industries/GaugeTechThe Leader In Power Monitoring and Smart Grid SolutionsElectro Industries/GaugeTechThe Leader In Power Monitoring and Smart Grid Solutions
Phasors:
Brings you to Phasor Analysis Information.
• Phase/Phasor arrow buttons
change the rotation of the diagram.
• Phase/Mag button shows the
phase/magnitude of:
• Phase angle or magnitude Van/
bn/cn
• Phase angle or magnitude Ia/b/c
• Phase angle or magnitude Vab/
bc/ca
• The PH-PH check box shows/hides the phase to phase voltage.
Harmonics-Spectrum:
Brings you to Harmonic Spectrum Analysis information, consisting of the following:
• %THD
• TDD (current only)
• KFactor
• Frequency
• Phase A - N Voltage
Touch Waveform to see the channel's
waveform.
Touch Volts B to view the Harmonics screen for Phase B - N voltage; Touch Volts C
(from the Volts B screen) to view the Harmonics screen for Phase C - N voltage.
Use the Scroll/Zoom radio buttons to select the mode of the directional arrows:
• If Scroll is selected, the directional arrows move the axes horizontally/vertically.
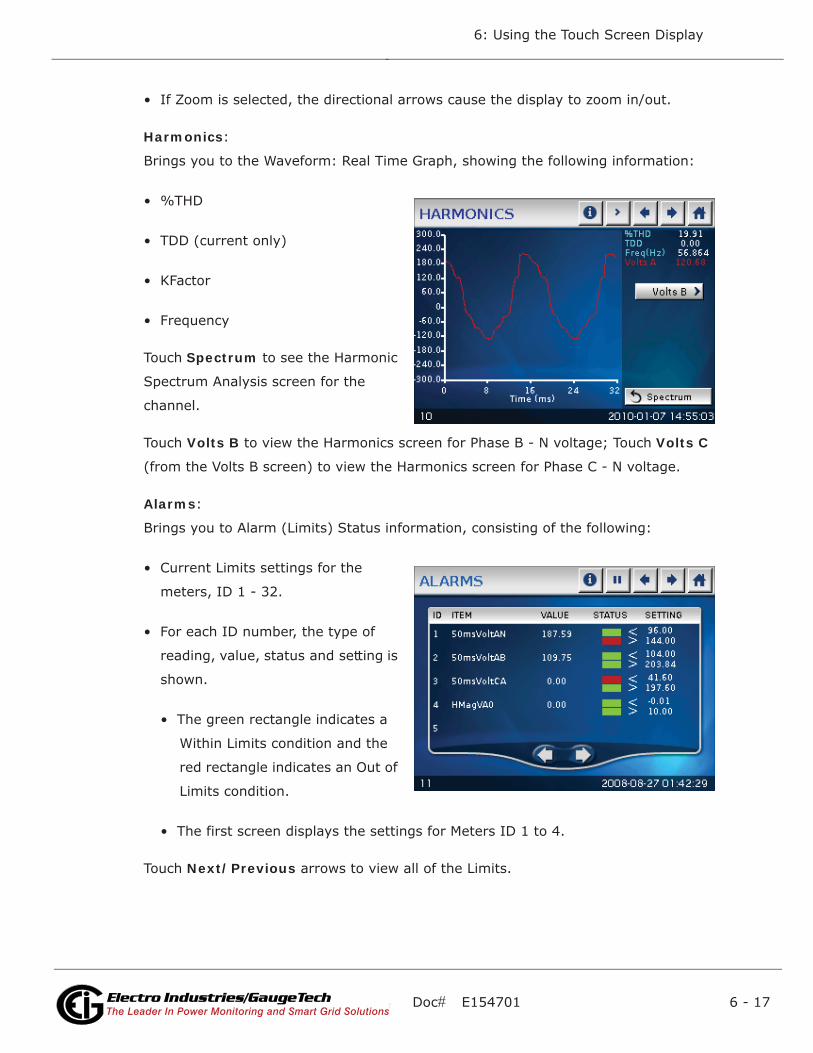
Doc# E154701 6 - 17
6: Using the Touch Screen Display
Electro Industries/GaugeTechThe Leader In Power Monitoring and Smart Grid SolutionsElectro Industries/GaugeTechThe Leader In Power Monitoring and Smart Grid Solutions
• If Zoom is selected, the directional arrows cause the display to zoom in/out.
Harmonics:
Brings you to the Waveform: Real Time Graph, showing the following information:
• %THD
• TDD (current only)
• KFactor
• Frequency
Touch Spectrum to see the Harmonic
Spectrum Analysis screen for the
channel.
Touch Volts B to view the Harmonics screen for Phase B - N voltage; Touch Volts C
(from the Volts B screen) to view the Harmonics screen for Phase C - N voltage.
Alarms:
Brings you to Alarm (Limits) Status information, consisting of the following:
• Current Limits settings for the
meters, ID 1 - 32.
• For each ID number, the type of
reading, value, status and setting is
shown.
• The green rectangle indicates a
Within Limits condition and the
red rectangle indicates an Out of
Limits condition.
• The first screen displays the settings for Meters ID 1 to 4.
Touch Next/Previous arrows to view all of the Limits.
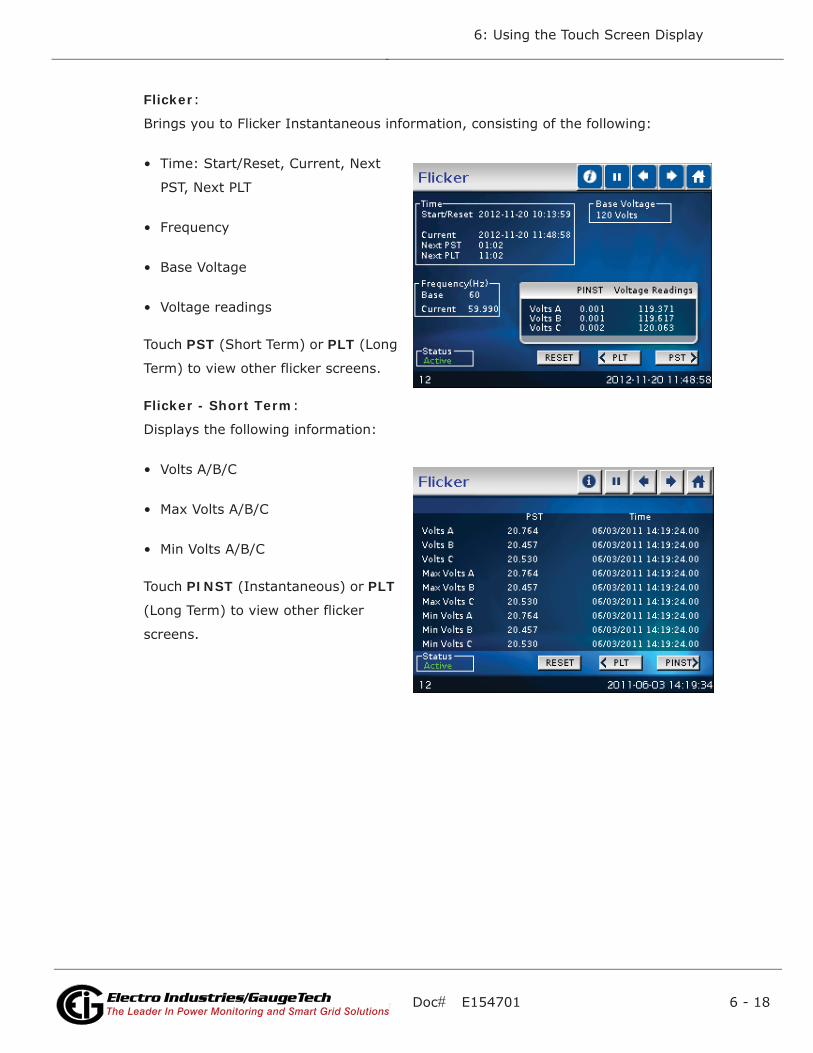
Doc# E154701 6 - 18
6: Using the Touch Screen Display
Electro Industries/GaugeTechThe Leader In Power Monitoring and Smart Grid SolutionsElectro Industries/GaugeTechThe Leader In Power Monitoring and Smart Grid Solutions
Flicker:
Brings you to Flicker Instantaneous information, consisting of the following:
• Time: Start/Reset, Current, Next
PST, Next PLT
• Frequency
• Base Voltage
• Voltage readings
Touch PST (Short Term) or PLT (Long
Term) to view other flicker screens.
Flicker - Short Term:
Displays the following information:
• Volts A/B/C
• Max Volts A/B/C
• Min Volts A/B/C
Touch PINST (Instantaneous) or PLT
(Long Term) to view other flicker
screens.
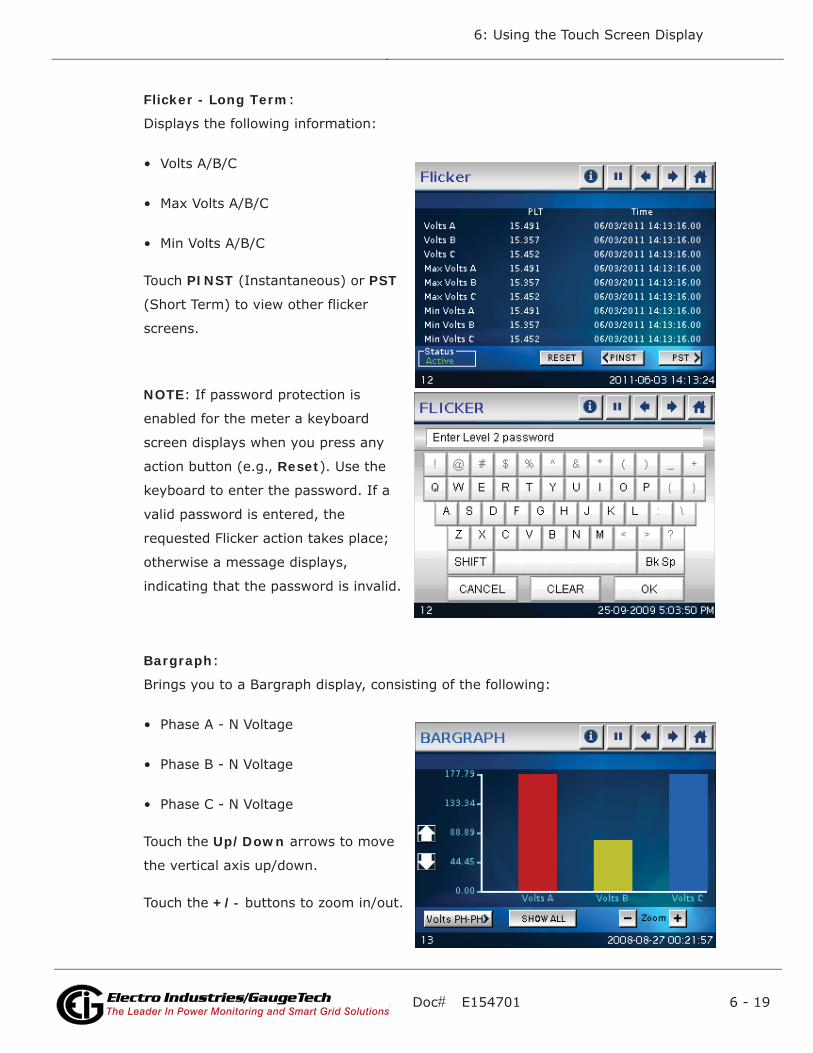
Doc# E154701 6 - 19
6: Using the Touch Screen Display
Electro Industries/GaugeTechThe Leader In Power Monitoring and Smart Grid SolutionsElectro Industries/GaugeTechThe Leader In Power Monitoring and Smart Grid Solutions
Flicker - Long Term:
Displays the following information:
• Volts A/B/C
• Max Volts A/B/C
• Min Volts A/B/C
Touch PINST (Instantaneous) or PST
(Short Term) to view other flicker
screens.
NOTE: If password protection is
enabled for the meter a keyboard
screen displays when you press any
action button (e.g., Reset). Use the
keyboard to enter the password. If a
valid password is entered, the
requested Flicker action takes place;
otherwise a message displays,
indicating that the password is invalid.
Bargraph:
Brings you to a Bargraph display, consisting of the following:
• Phase A - N Voltage
• Phase B - N Voltage
• Phase C - N Voltage
Touch the Up/Down arrows to move
the vertical axis up/down.
Touch the +/- buttons to zoom in/out.
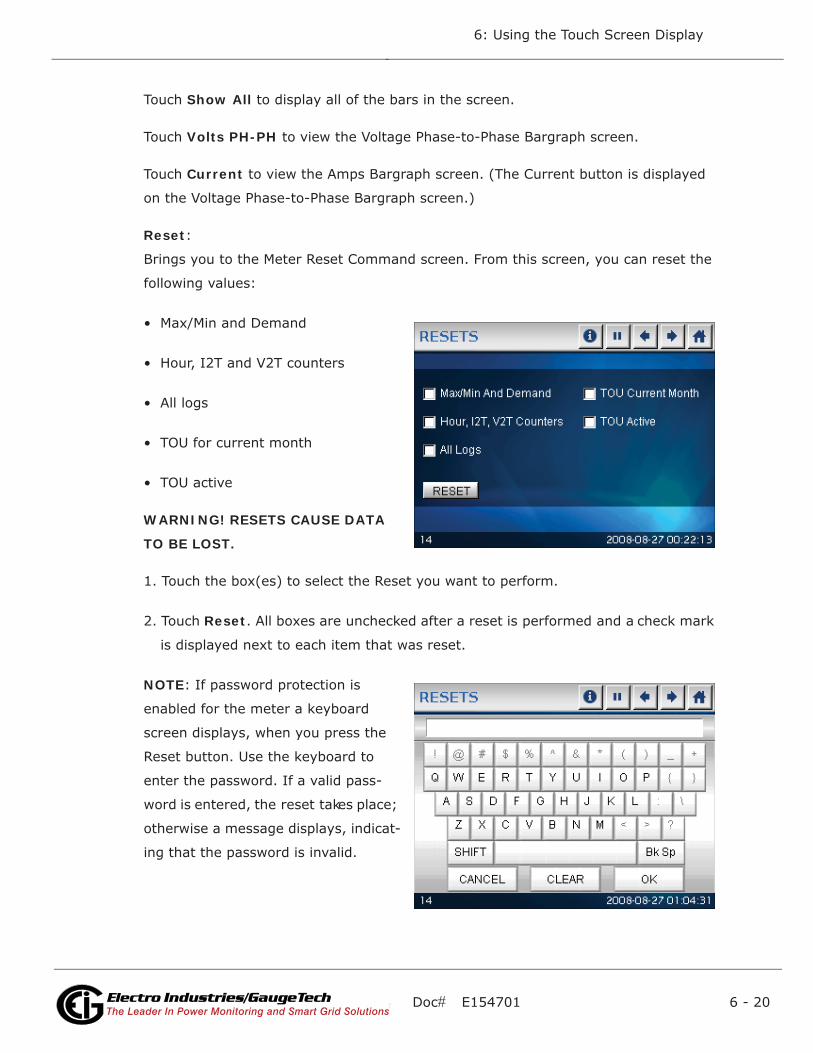
Doc# E154701 6 - 20
6: Using the Touch Screen Display
Electro Industries/GaugeTechThe Leader In Power Monitoring and Smart Grid SolutionsElectro Industries/GaugeTechThe Leader In Power Monitoring and Smart Grid Solutions
Touch Show All to display all of the bars in the screen.
Touch Volts PH-PH to view the Voltage Phase-to-Phase Bargraph screen.
Touch Current to view the Amps Bargraph screen. (The Current button is displayed
on the Voltage Phase-to-Phase Bargraph screen.)
Reset:
Brings you to the Meter Reset Command screen. From this screen, you can reset the
following values:
• Max/Min and Demand
• Hour, I2T and V2T counters
• All logs
• TOU for current month
• TOU active
WARNING! RESETS CAUSE DATA
TO BE LOST.
1. Touch the box(es) to select the Reset you want to perform.
2. Touch Reset. All boxes are unchecked after a reset is performed and a check mark
is displayed next to each item that was reset.
NOTE: If password protection is
enabled for the meter a keyboard
screen displays, when you press the
Reset button. Use the keyboard to
enter the password. If a valid pass-
word is entered, the reset takes place;
otherwise a message displays, indicat-
ing that the password is invalid.
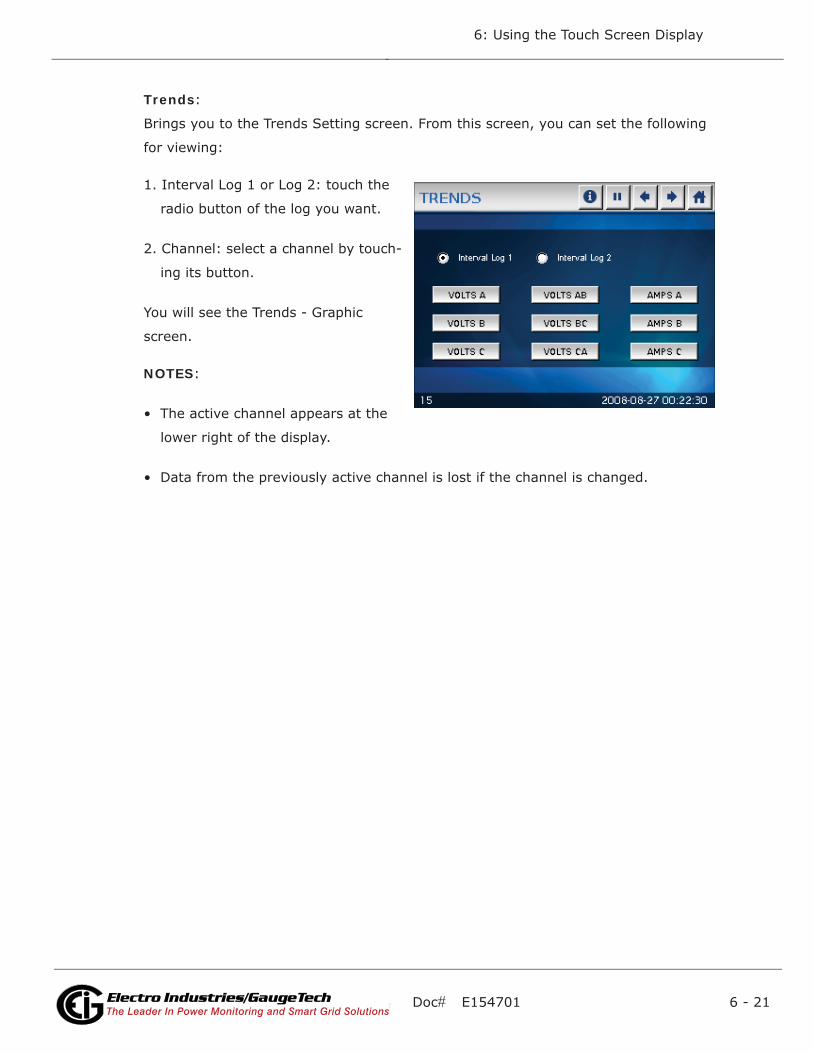
Doc# E154701 6 - 21
6: Using the Touch Screen Display
Electro Industries/GaugeTechThe Leader In Power Monitoring and Smart Grid SolutionsElectro Industries/GaugeTechThe Leader In Power Monitoring and Smart Grid Solutions
Trends:
Brings you to the Trends Setting screen. From this screen, you can set the following
for viewing:
1. Interval Log 1 or Log 2: touch the
radio button of the log you want.
2. Channel: select a channel by touch-
ing its button.
You will see the Trends - Graphic
screen.
NOTES:
• The active channel appears at the
lower right of the display.
• Data from the previously active channel is lost if the channel is changed.
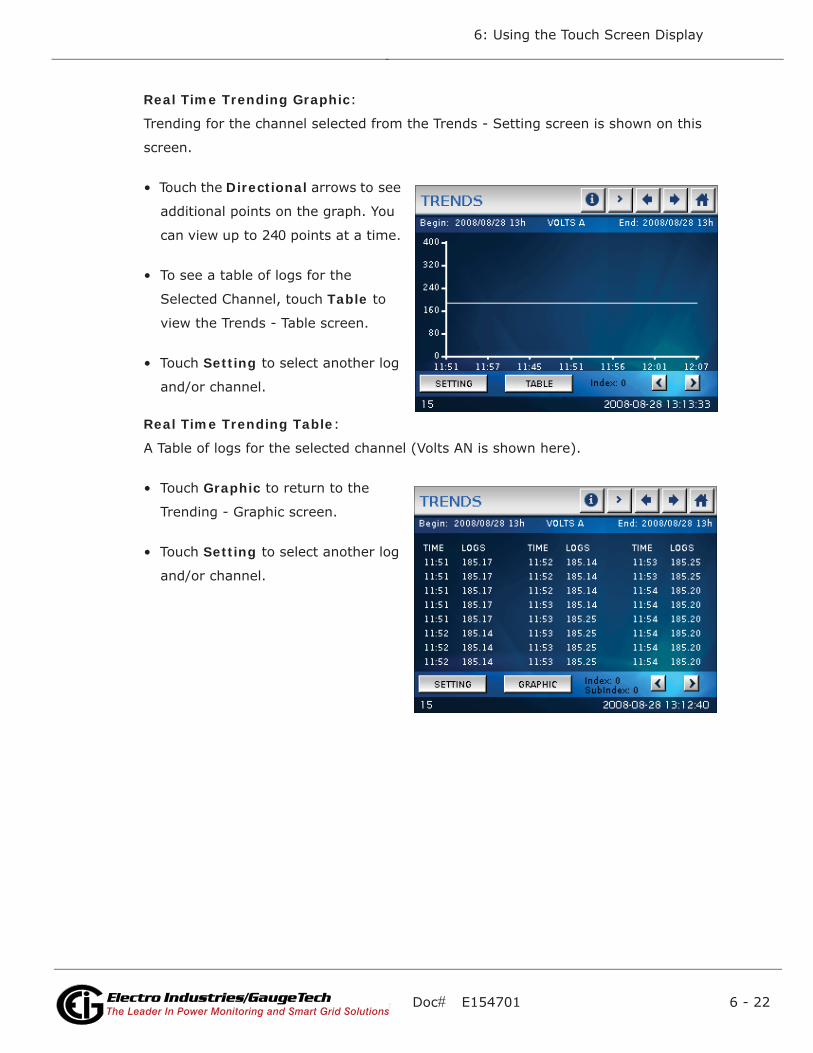
Doc# E154701 6 - 22
6: Using the Touch Screen Display
Electro Industries/GaugeTechThe Leader In Power Monitoring and Smart Grid SolutionsElectro Industries/GaugeTechThe Leader In Power Monitoring and Smart Grid Solutions
Real Time Trending Graphic:
Trending for the channel selected from the Trends - Setting screen is shown on this
screen.
• Touch the Directional arrows to see
additional points on the graph. You
can view up to 240 points at a time.
• To see a table of logs for the
Selected Channel, touch Table to
view the Trends - Table screen.
• Touch Setting to select another log
and/or channel.
Real Time Trending Table:
A Table of logs for the selected channel (Volts AN is shown here).
• Touch Graphic to return to the
Trending - Graphic screen.
• Touch Setting to select another log
and/or channel.
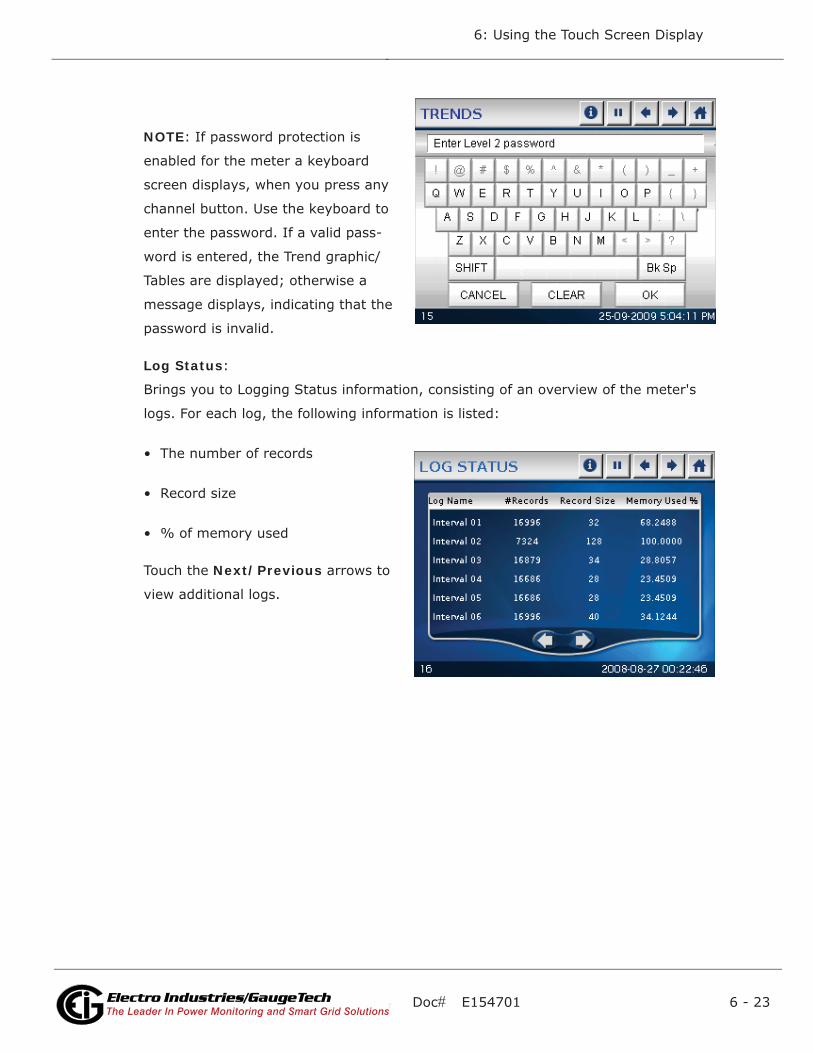
Doc# E154701 6 - 23
6: Using the Touch Screen Display
Electro Industries/GaugeTechThe Leader In Power Monitoring and Smart Grid SolutionsElectro Industries/GaugeTechThe Leader In Power Monitoring and Smart Grid Solutions
NOTE: If password protection is
enabled for the meter a keyboard
screen displays, when you press any
channel button. Use the keyboard to
enter the password. If a valid pass-
word is entered, the Trend graphic/
Tables are displayed; otherwise a
message displays, indicating that the
password is invalid.
Log Status:
Brings you to Logging Status information, consisting of an overview of the meter's
logs. For each log, the following information is listed:
• The number of records
• Record size
• % of memory used
Touch the Next/Previous arrows to
view additional logs.
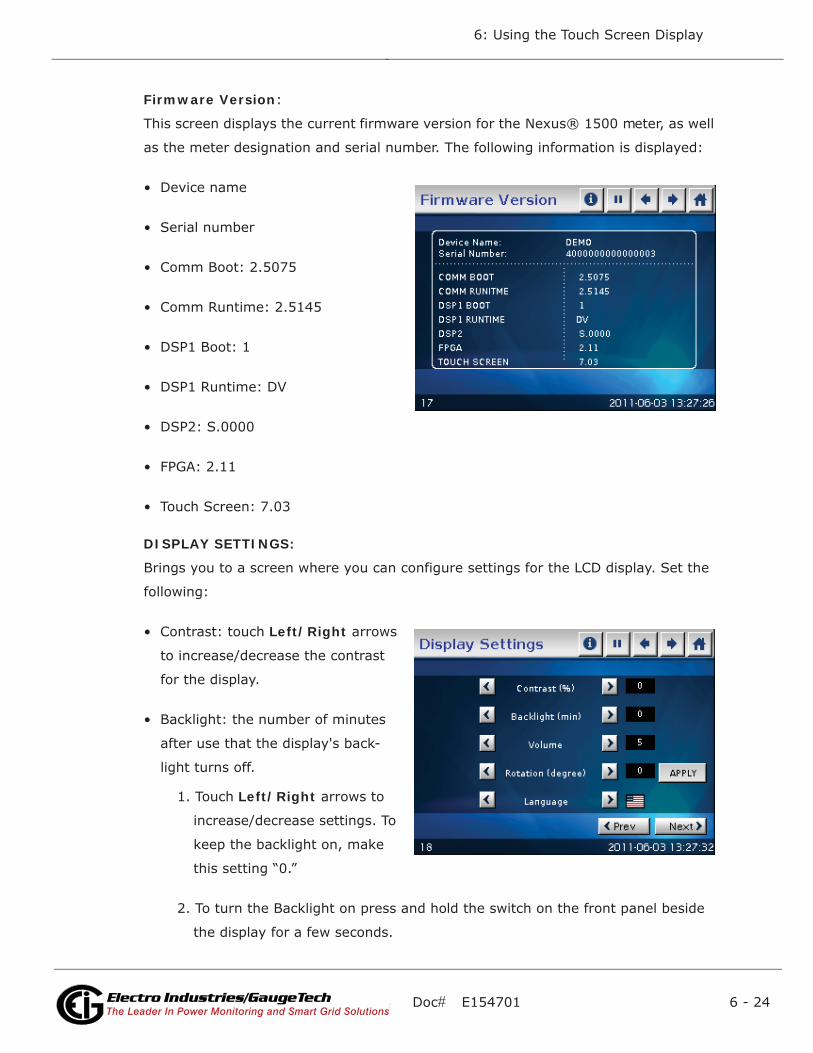
Doc# E154701 6 - 24
6: Using the Touch Screen Display
Electro Industries/GaugeTechThe Leader In Power Monitoring and Smart Grid SolutionsElectro Industries/GaugeTechThe Leader In Power Monitoring and Smart Grid Solutions
Firmware Version:
This screen displays the current firmware version for the Nexus® 1500 meter, as well
as the meter designation and serial number. The following information is displayed:
• Device name
• Serial number
• Comm Boot: 2.5075
• Comm Runtime: 2.5145
• DSP1 Boot: 1
• DSP1 Runtime: DV
• DSP2: S.0000
• FPGA: 2.11
• Touch Screen: 7.03
DISPLAY SETTINGS:
Brings you to a screen where you can configure settings for the LCD display. Set the
following:
• Contrast: touch Left/Right arrows
to increase/decrease the contrast
for the display.
• Backlight: the number of minutes
after use that the display's back-
light turns off.
1. Touch Left/Right arrows to
increase/decrease settings. To
keep the backlight on, make
this setting “0.”
2. To turn the Backlight on press and hold the switch on the front panel beside
the display for a few seconds.
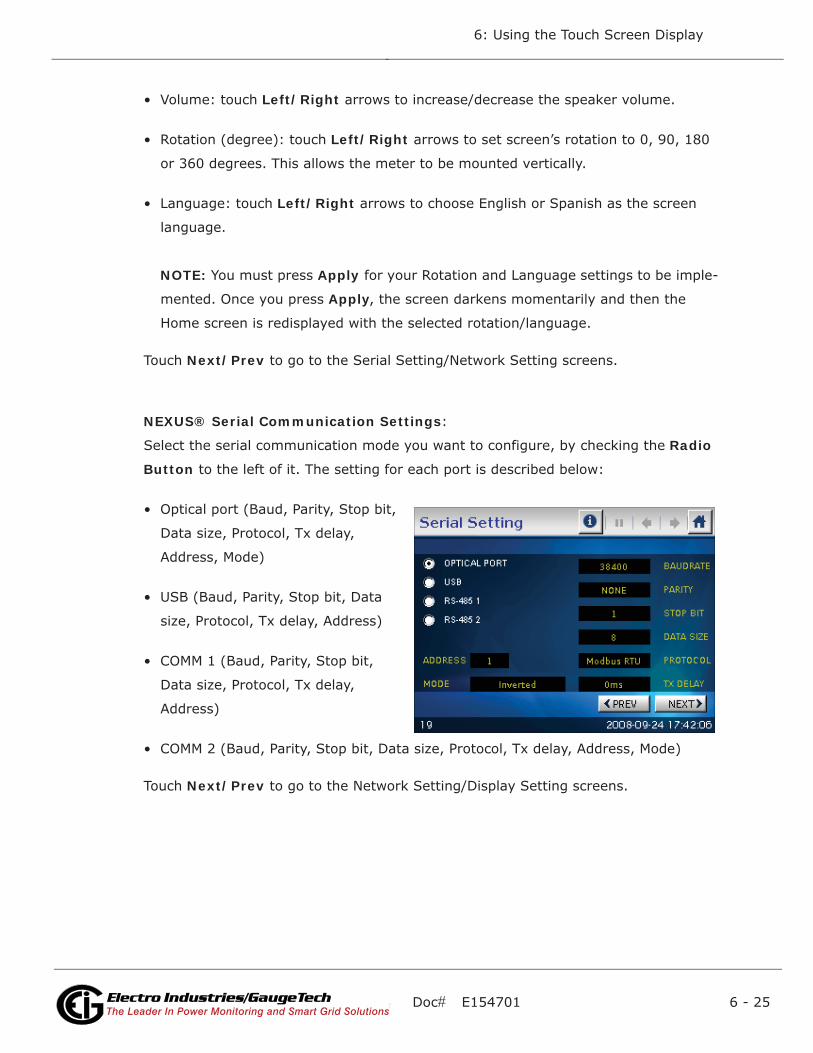
Doc# E154701 6 - 25
6: Using the Touch Screen Display
Electro Industries/GaugeTechThe Leader In Power Monitoring and Smart Grid SolutionsElectro Industries/GaugeTechThe Leader In Power Monitoring and Smart Grid Solutions
• Volume: touch Left/Right arrows to increase/decrease the speaker volume.
• Rotation (degree): touch Left/Right arrows to set screen’s rotation to 0, 90, 180
or 360 degrees. This allows the meter to be mounted vertically.
• Language: touch Left/Right arrows to choose English or Spanish as the screen
language.
NOTE: You must press Apply for your Rotation and Language settings to be imple-
mented. Once you press Apply, the screen darkens momentarily and then the
Home screen is redisplayed with the selected rotation/language.
Touch Next/Prev to go to the Serial Setting/Network Setting screens.
NEXUS® Serial Communication Settings:
Select the serial communication mode you want to configure, by checking the Radio
Button to the left of it. The setting for each port is described below:
• Optical port (Baud, Parity, Stop bit,
Data size, Protocol, Tx delay,
Address, Mode)
• USB (Baud, Parity, Stop bit, Data
size, Protocol, Tx delay, Address)
• COMM 1 (Baud, Parity, Stop bit,
Data size, Protocol, Tx delay,
Address)
• COMM 2 (Baud, Parity, Stop bit, Data size, Protocol, Tx delay, Address, Mode)
Touch Next/Prev to go to the Network Setting/Display Setting screens.
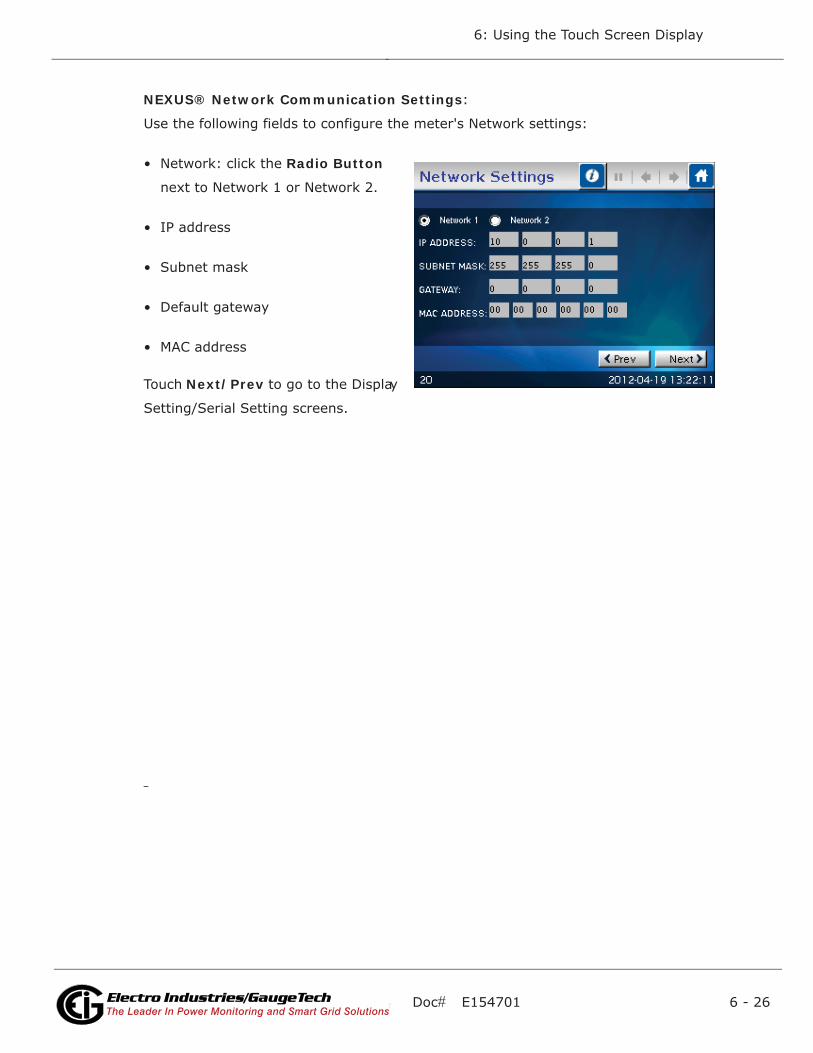
Doc# E154701 6 - 26
6: Using the Touch Screen Display
Electro Industries/GaugeTechThe Leader In Power Monitoring and Smart Grid SolutionsElectro Industries/GaugeTechThe Leader In Power Monitoring and Smart Grid Solutions
NEXUS® Network Communication Settings:
Use the following fields to configure the meter's Network settings:
• Network: click the Radio Button
next to Network 1 or Network 2.
• IP address
• Subnet mask
• Default gateway
• MAC address
Touch Next/Prev to go to the Display
Setting/Serial Setting screens.
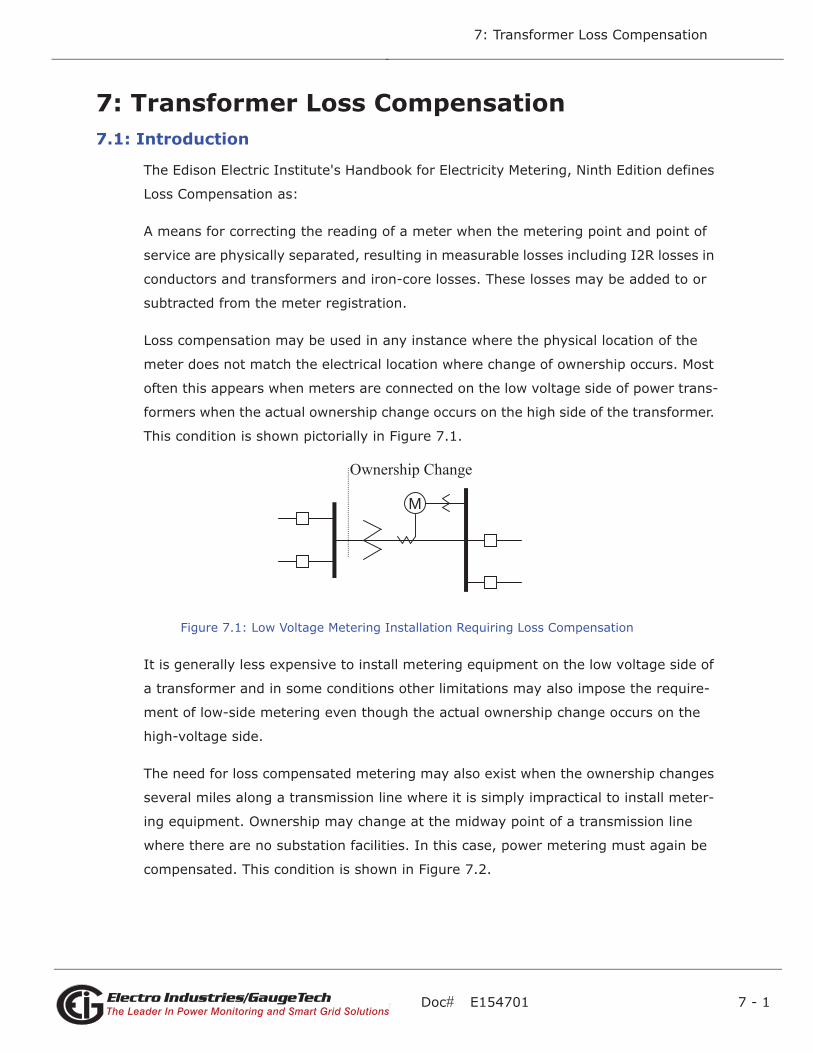
Doc# E154701 7 - 1
7: Transformer Loss Compensation
Electro Industries/GaugeTechThe Leader In Power Monitoring and Smart Grid SolutionsElectro Industries/GaugeTechThe Leader In Power Monitoring and Smart Grid Solutions
7: Transformer Loss Compensation7.1: Introduction
The Edison Electric Institute's Handbook for Electricity Metering, Ninth Edition defines
Loss Compensation as:
A means for correcting the reading of a meter when the metering point and point of
service are physically separated, resulting in measurable losses including I2R losses in
conductors and transformers and iron-core losses. These losses may be added to or
subtracted from the meter registration.
Loss compensation may be used in any instance where the physical location of the
meter does not match the electrical location where change of ownership occurs. Most
often this appears when meters are connected on the low voltage side of power trans-
formers when the actual ownership change occurs on the high side of the transformer.
This condition is shown pictorially in Figure 7.1.
Figure 7.1: Low Voltage Metering Installation Requiring Loss Compensation
It is generally less expensive to install metering equipment on the low voltage side of
a transformer and in some conditions other limitations may also impose the require-
ment of low-side metering even though the actual ownership change occurs on the
high-voltage side.
The need for loss compensated metering may also exist when the ownership changes
several miles along a transmission line where it is simply impractical to install meter-
ing equipment. Ownership may change at the midway point of a transmission line
where there are no substation facilities. In this case, power metering must again be
compensated. This condition is shown in Figure 7.2.
M
Ownership Change
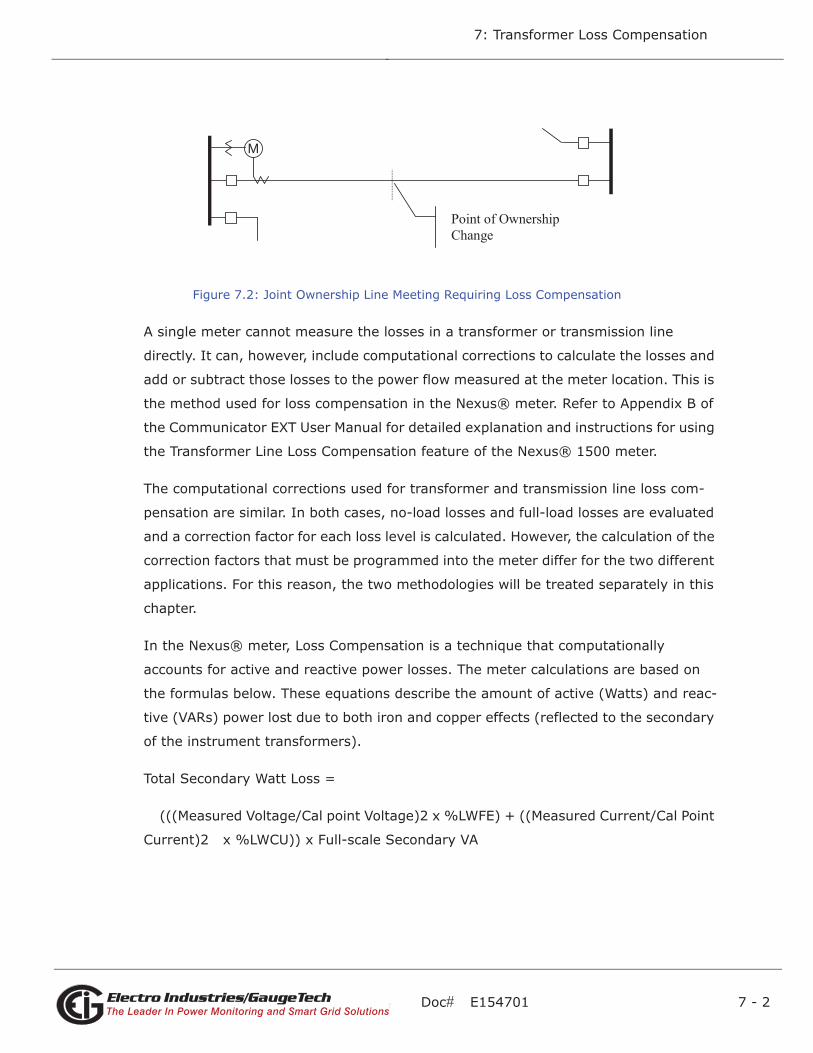
Doc# E154701 7 - 2
7: Transformer Loss Compensation
Electro Industries/GaugeTechThe Leader In Power Monitoring and Smart Grid SolutionsElectro Industries/GaugeTechThe Leader In Power Monitoring and Smart Grid Solutions
Figure 7.2: Joint Ownership Line Meeting Requiring Loss Compensation
A single meter cannot measure the losses in a transformer or transmission line
directly. It can, however, include computational corrections to calculate the losses and
add or subtract those losses to the power flow measured at the meter location. This is
the method used for loss compensation in the Nexus® meter. Refer to Appendix B of
the Communicator EXT User Manual for detailed explanation and instructions for using
the Transformer Line Loss Compensation feature of the Nexus® 1500 meter.
The computational corrections used for transformer and transmission line loss com-
pensation are similar. In both cases, no-load losses and full-load losses are evaluated
and a correction factor for each loss level is calculated. However, the calculation of the
correction factors that must be programmed into the meter differ for the two different
applications. For this reason, the two methodologies will be treated separately in this
chapter.
In the Nexus® meter, Loss Compensation is a technique that computationally
accounts for active and reactive power losses. The meter calculations are based on
the formulas below. These equations describe the amount of active (Watts) and reac-
tive (VARs) power lost due to both iron and copper effects (reflected to the secondary
of the instrument transformers).
Total Secondary Watt Loss =
(((Measured Voltage/Cal point Voltage)2 x %LWFE) + ((Measured Current/Cal Point
Current)2 x %LWCU)) x Full-scale Secondary VA
M
Point of Ownership Change
Doc# E154701 7 - 3
7: Transformer Loss Compensation
Electro Industries/GaugeTechThe Leader In Power Monitoring and Smart Grid SolutionsElectro Industries/GaugeTechThe Leader In Power Monitoring and Smart Grid Solutions
Total Secondary VAR Loss =
(((Measured Voltage/Cal point Voltage)4 x %LVFE) + ((Measured Current/Cal
Point Current)2 x %LVCU)) x Full-scale Secondary VA
The Values for %LWFE, %LWCU, %LVFE, and %LVCU are derived from the trans-
former and meter information, as demonstrated in the following sections.
The calculated loss compensation values are added to or subtracted from the mea-
sured Watts and VARs. The selection of adding or subtracting losses is made through
the meter's profile when programming the meter (see the following section for
instructions). The meter uses the combination of the add/subtract setting and the
directional definition of power flow (also in the profile) to determine how to handle the
losses. Losses will be "added to" or "subtracted from" (depending on whether add or
subtract is selected) the Received Power flow. For example, if losses are set to "Add
to" and received power equals 2000 kW and losses are equal to 20kW then the total
metered value with loss compensation would be 2020 kW; for these same settings if
the meter measured 2000 kW of delivered power the total metered value with loss
compensation would be 1980 kW.
Since transformer loss compensation is the more common loss compensation method,
the meter has been designed for this application. Line loss compensation is calculated
in the meter using the same terms but the percent values are calculated by a different
methodology.
Nexus® Meter Transformer Loss Compensation:
• Performs calculations on each phase of the meter for every measurement taken;
unbalanced loads are accurately handled.
• Calculates numerically, eliminating the environmental effects that cause inaccura-
cies in electromechanical compensators
• Performs Bidirectional Loss Compensation
• Requires no additional wiring; the compensation occurs internally.
• Imposes no additional electrical burden when performing Loss Compensation
Doc# E154701 7 - 4
7: Transformer Loss Compensation
Electro Industries/GaugeTechThe Leader In Power Monitoring and Smart Grid SolutionsElectro Industries/GaugeTechThe Leader In Power Monitoring and Smart Grid Solutions
Loss Compensation is applied to 1 second per phase Watt/VAR readings and, because
of that, affects all subsequent readings based on 1 second per phase Watt/VAR
readings. This method results in loss compensation being applied to the following
quantities:
• Total Power
• Demands, per phase and total (Thermal, Block (Fixed) Window, Rolling (Sliding)
Window and Predictive Window)
• Maximum and minimum Demand
• Energy accumulations
• KYZ output of Energy accumulations
7.2: Nexus® 1500 Meter's Transformer Loss Compensation
The Nexus® meter provides compensation for active and reactive power quantities by
performing numerical calculations. The factors used in these calculations are derived
either:
• By clicking the TLC Calculator button on the Transformer Loss screen of the
Device Profile, to open the EIG Loss Compensation Calculator in Microsoft Excel
• By figuring the values from the worksheet shown here and in Appendix B of the
Communicator EXT User Manual
Either way, you enter the derived values into the Communicator EXT software through
the Device Profile Transformer and Line Loss Compensation screen.
The Communicator EXT software allows you to enable Transformer Loss Compensa-
tion for Losses due to Copper and Iron, individually or simultaneously. Losses can
either be added to or subtracted from measured readings. Refer to Appendix B in the
Communicator EXT User Manual for instructions.
Loss compensation values must be calculated based on the meter installation. As a
result, transformer loss values must be normalized to the meter by converting the
base voltage and current and taking into account the number of elements used in the
Doc# E154701 7 - 5
7: Transformer Loss Compensation
Electro Industries/GaugeTechThe Leader In Power Monitoring and Smart Grid SolutionsElectro Industries/GaugeTechThe Leader In Power Monitoring and Smart Grid Solutions
metering installation. For three-element meters, the installation must be normalized
to the phase-to-neutral voltage and the phase current; in two-element meters the
installation must be normalized to the phase-to-phase voltage and the phase current.
This process is described in the following sections.
7.2.1: Loss Compensation in Three Element Installations
Loss compensation is based on the loss and impedance values provided on the trans-
former manufacturer's test report. A typical test report will include at least the follow-
ing information:
• Manufacturer
• Unit serial number
• Transformer MVA rating (Self-Cooled)
• Test Voltage
• No Load Loss Watts
• Load Loss Watts (or Full Load Loss Watts)
• % Exciting Current @ 100% voltage
• % Impedance
The transformer MVA rating is generally the lowest MVA rating (the self-cooled or OA
rating) of the transformer winding. The test voltage is generally the nominal voltage
of the secondary or low voltage winding. For three-phase transformers these values
will typically be the three-phase rating and the phase-to-phase voltage. All of the test
measurements are based on these two numbers. Part of the process of calculating the
loss compensation percentages is converting the transformer loss values based on the
transformer ratings to the base used by the meter.
Correct calculation of loss compensation also requires knowledge of the meter instal-
lation. In order to calculate the loss compensation settings you will need the following
information regarding the meter and the installation:
• Number of meter elements
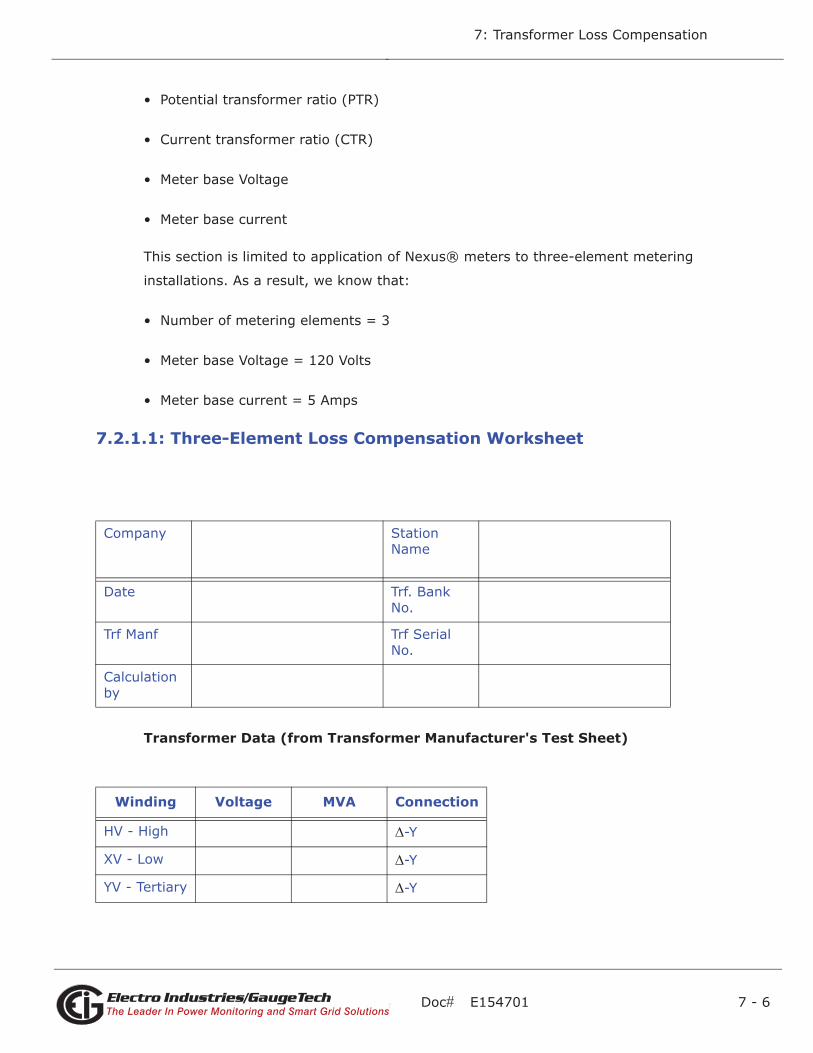
Doc# E154701 7 - 6
7: Transformer Loss Compensation
Electro Industries/GaugeTechThe Leader In Power Monitoring and Smart Grid SolutionsElectro Industries/GaugeTechThe Leader In Power Monitoring and Smart Grid Solutions
• Potential transformer ratio (PTR)
• Current transformer ratio (CTR)
• Meter base Voltage
• Meter base current
This section is limited to application of Nexus® meters to three-element metering
installations. As a result, we know that:
• Number of metering elements = 3
• Meter base Voltage = 120 Volts
• Meter base current = 5 Amps
7.2.1.1: Three-Element Loss Compensation Worksheet
Transformer Data (from Transformer Manufacturer's Test Sheet)
Table 1:
Company Station Name
Date Trf. Bank No.
Trf Manf Trf Serial No.
Calculation by
Table 2:
Winding Voltage MVA Connection
HV - High -Y
XV - Low -Y
YV - Tertiary -Y
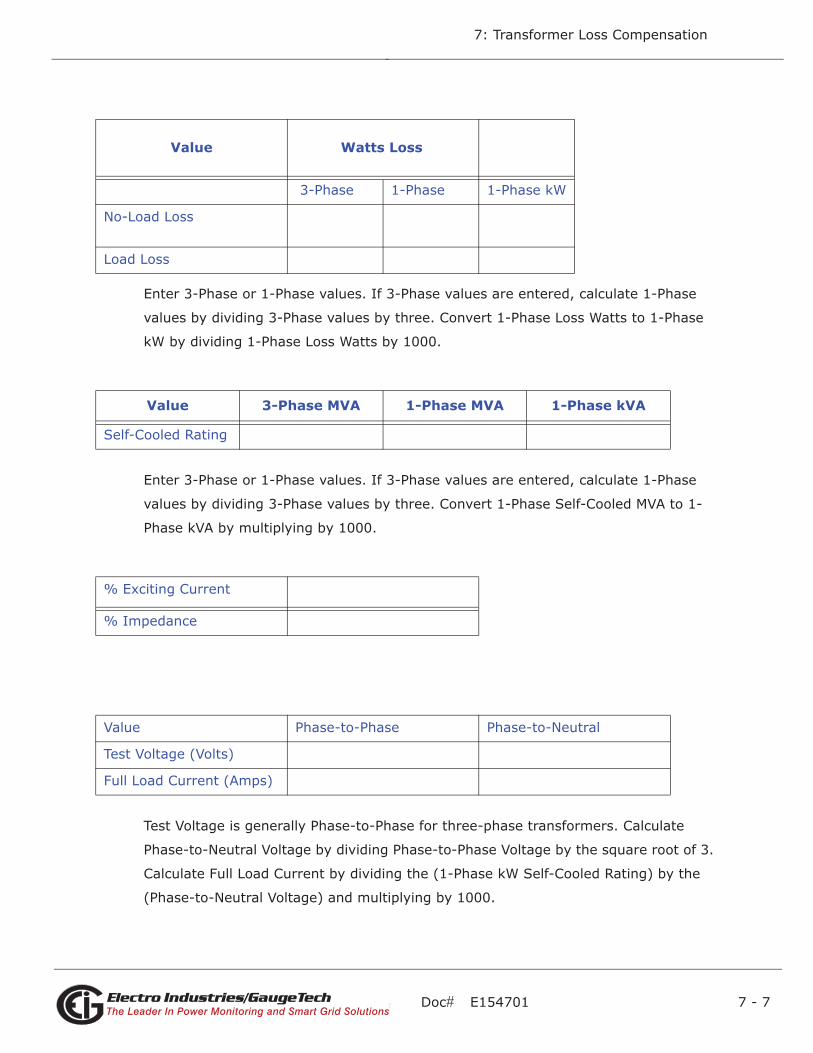
Doc# E154701 7 - 7
7: Transformer Loss Compensation
Electro Industries/GaugeTechThe Leader In Power Monitoring and Smart Grid SolutionsElectro Industries/GaugeTechThe Leader In Power Monitoring and Smart Grid Solutions
Enter 3-Phase or 1-Phase values. If 3-Phase values are entered, calculate 1-Phase
values by dividing 3-Phase values by three. Convert 1-Phase Loss Watts to 1-Phase
kW by dividing 1-Phase Loss Watts by 1000.
Enter 3-Phase or 1-Phase values. If 3-Phase values are entered, calculate 1-Phase
values by dividing 3-Phase values by three. Convert 1-Phase Self-Cooled MVA to 1-
Phase kVA by multiplying by 1000.
Test Voltage is generally Phase-to-Phase for three-phase transformers. Calculate
Phase-to-Neutral Voltage by dividing Phase-to-Phase Voltage by the square root of 3.
Calculate Full Load Current by dividing the (1-Phase kW Self-Cooled Rating) by the
(Phase-to-Neutral Voltage) and multiplying by 1000.
Table 3:
Value Watts Loss
3-Phase 1-Phase 1-Phase kW
No-Load Loss
Load Loss
Table 4:
Value 3-Phase MVA 1-Phase MVA 1-Phase kVA
Self-Cooled Rating
Table 5:
% Exciting Current
% Impedance
Table 6:
Value Phase-to-Phase Phase-to-Neutral
Test Voltage (Volts)
Full Load Current (Amps)
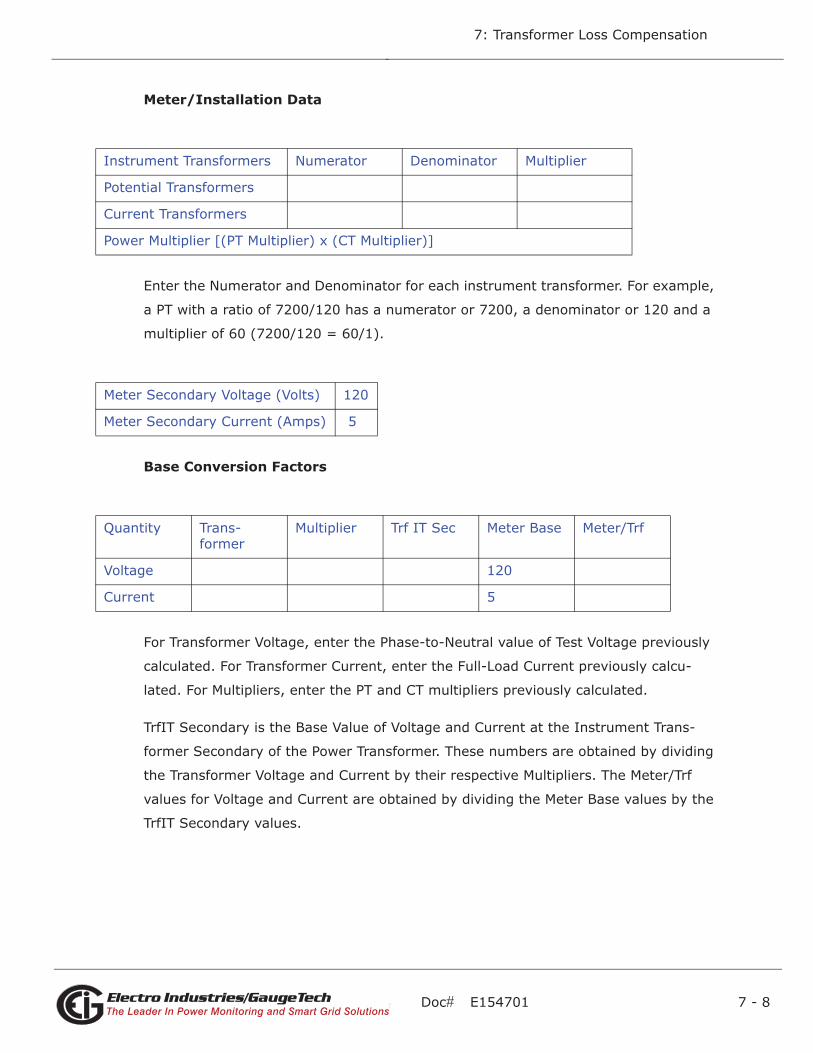
Doc# E154701 7 - 8
7: Transformer Loss Compensation
Electro Industries/GaugeTechThe Leader In Power Monitoring and Smart Grid SolutionsElectro Industries/GaugeTechThe Leader In Power Monitoring and Smart Grid Solutions
Meter/Installation Data
Enter the Numerator and Denominator for each instrument transformer. For example,
a PT with a ratio of 7200/120 has a numerator or 7200, a denominator or 120 and a
multiplier of 60 (7200/120 = 60/1).
Base Conversion Factors
For Transformer Voltage, enter the Phase-to-Neutral value of Test Voltage previously
calculated. For Transformer Current, enter the Full-Load Current previously calcu-
lated. For Multipliers, enter the PT and CT multipliers previously calculated.
TrfIT Secondary is the Base Value of Voltage and Current at the Instrument Trans-
former Secondary of the Power Transformer. These numbers are obtained by dividing
the Transformer Voltage and Current by their respective Multipliers. The Meter/Trf
values for Voltage and Current are obtained by dividing the Meter Base values by the
TrfIT Secondary values.
Table 7:
Instrument Transformers Numerator Denominator Multiplier
Potential Transformers
Current Transformers
Power Multiplier [(PT Multiplier) x (CT Multiplier)]
Table 8:
Meter Secondary Voltage (Volts) 120
Meter Secondary Current (Amps) 5
Table 9:
Quantity Trans-former
Multiplier Trf IT Sec Meter Base Meter/Trf
Voltage 120
Current 5
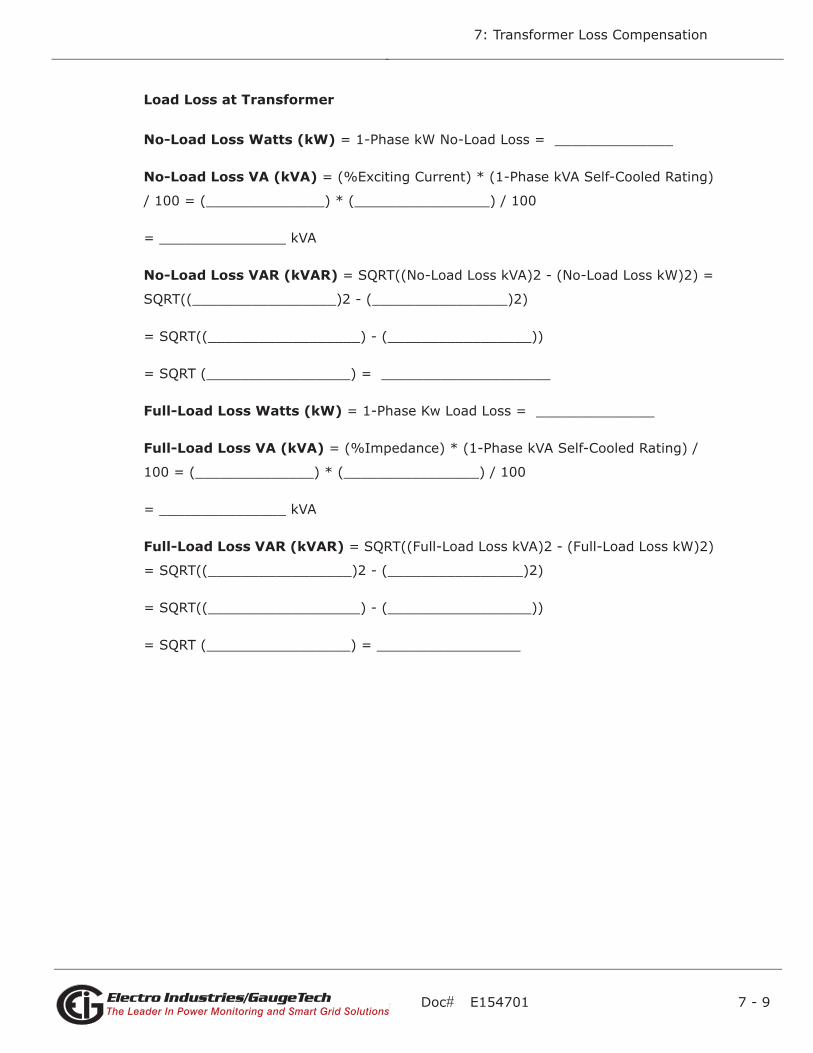
Doc# E154701 7 - 9
7: Transformer Loss Compensation
Electro Industries/GaugeTechThe Leader In Power Monitoring and Smart Grid SolutionsElectro Industries/GaugeTechThe Leader In Power Monitoring and Smart Grid Solutions
Load Loss at Transformer
No-Load Loss Watts (kW) = 1-Phase kW No-Load Loss = ______________
No-Load Loss VA (kVA) = (%Exciting Current) * (1-Phase kVA Self-Cooled Rating)
/ 100 = (______________) * (________________) / 100
= _______________ kVA
No-Load Loss VAR (kVAR) = SQRT((No-Load Loss kVA)2 - (No-Load Loss kW)2) =
SQRT((_________________)2 - (________________)2)
= SQRT((__________________) - (_________________))
= SQRT (_________________) = ____________________
Full-Load Loss Watts (kW) = 1-Phase Kw Load Loss = ______________
Full-Load Loss VA (kVA) = (%Impedance) * (1-Phase kVA Self-Cooled Rating) /
100 = (______________) * (________________) / 100
= _______________ kVA
Full-Load Loss VAR (kVAR) = SQRT((Full-Load Loss kVA)2 - (Full-Load Loss kW)2)
= SQRT((_________________)2 - (________________)2)
= SQRT((__________________) - (_________________))
= SQRT (_________________) = _________________
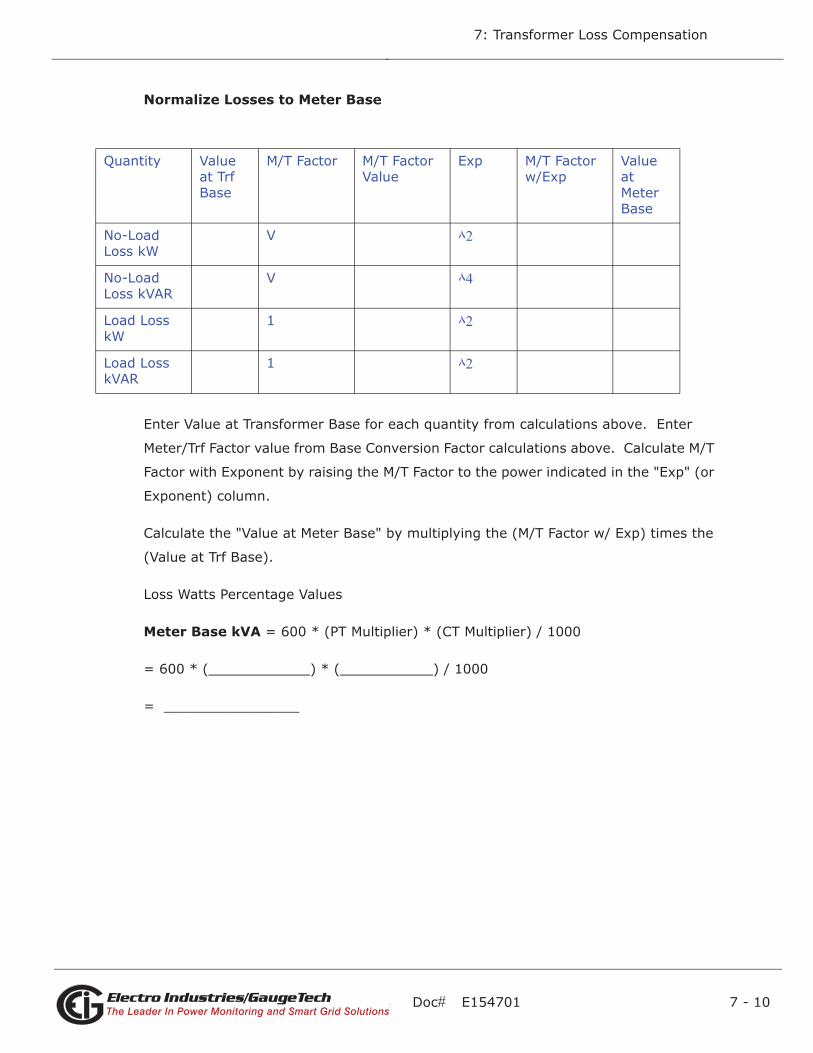
Doc# E154701 7 - 10
7: Transformer Loss Compensation
Electro Industries/GaugeTechThe Leader In Power Monitoring and Smart Grid SolutionsElectro Industries/GaugeTechThe Leader In Power Monitoring and Smart Grid Solutions
Normalize Losses to Meter Base
Enter Value at Transformer Base for each quantity from calculations above. Enter
Meter/Trf Factor value from Base Conversion Factor calculations above. Calculate M/T
Factor with Exponent by raising the M/T Factor to the power indicated in the "Exp" (or
Exponent) column.
Calculate the "Value at Meter Base" by multiplying the (M/T Factor w/ Exp) times the
(Value at Trf Base).
Loss Watts Percentage Values
Meter Base kVA = 600 * (PT Multiplier) * (CT Multiplier) / 1000
= 600 * (____________) * (___________) / 1000
= ________________
Table 10:
Quantity Value at Trf Base
M/T Factor M/T Factor Value
Exp M/T Factor w/Exp
Value atMeter Base
No-Load Loss kW
V 2
No-Load Loss kVAR
V 4
Load Loss kW
1 2
Load Loss kVAR
1 2
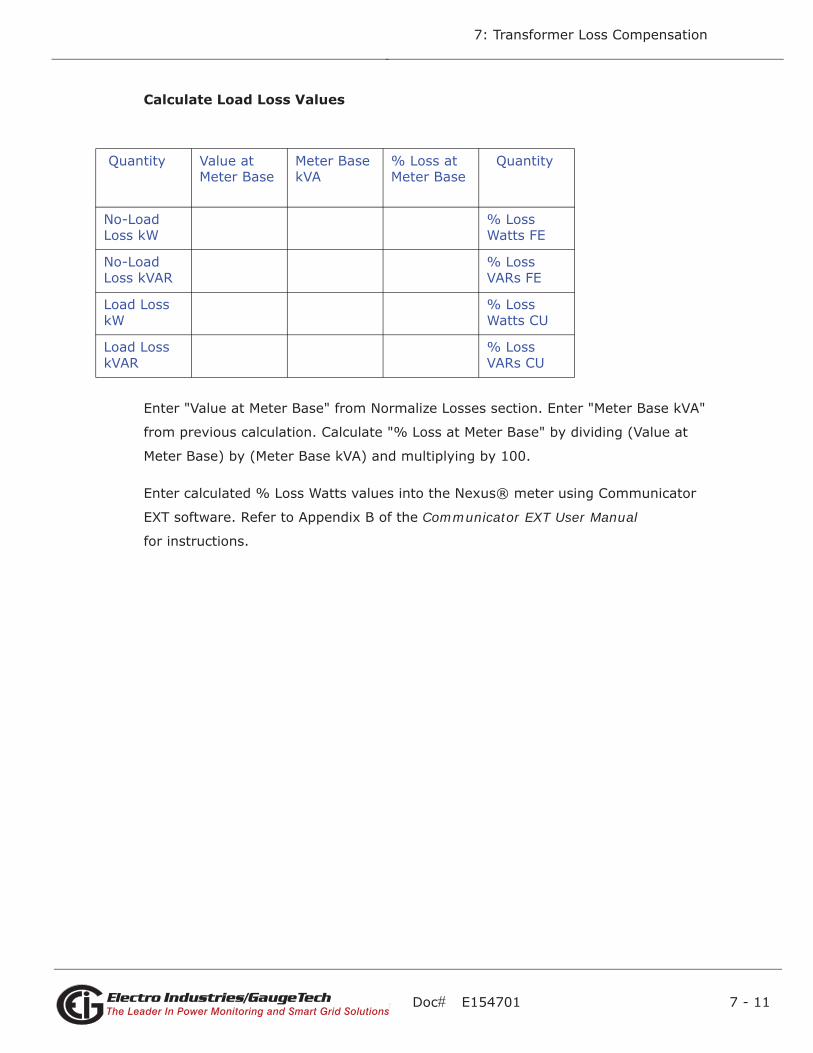
Doc# E154701 7 - 11
7: Transformer Loss Compensation
Electro Industries/GaugeTechThe Leader In Power Monitoring and Smart Grid SolutionsElectro Industries/GaugeTechThe Leader In Power Monitoring and Smart Grid Solutions
Calculate Load Loss Values
Enter "Value at Meter Base" from Normalize Losses section. Enter "Meter Base kVA"
from previous calculation. Calculate "% Loss at Meter Base" by dividing (Value at
Meter Base) by (Meter Base kVA) and multiplying by 100.
Enter calculated % Loss Watts values into the Nexus® meter using Communicator
EXT software. Refer to Appendix B of the Communicator EXT User Manual
for instructions.
Table 11:
Quantity Value at Meter Base
Meter BasekVA
% Loss at Meter Base
Quantity
No-Load Loss kW
% Loss Watts FE
No-Load Loss kVAR
% Loss VARs FE
Load Loss kW
% Loss Watts CU
Load Loss kVAR
% Loss VARs CU

Doc# E154701 7 - 12
7: Transformer Loss Compensation
Electro Industries/GaugeTechThe Leader In Power Monitoring and Smart Grid SolutionsElectro Industries/GaugeTechThe Leader In Power Monitoring and Smart Grid Solutions
This page intentionally left blank.
Doc# E154701 8 - 1
8: Time-of-Use Function
Electro Industries/GaugeTechThe Leader In Power Monitoring and Smart Grid SolutionsElectro Industries/GaugeTechThe Leader In Power Monitoring and Smart Grid Solutions
8: Time-of-Use Function
8.1: Introduction
A Time-of-Use (TOU) usage structure takes into account the quantity of energy used
and the time at which it was consumed. The Nexus® 1500 meter's TOU function,
available with the Communicator EXT software, is designed to accommodate a variety
of programmable rate structures. The Nexus® meter's TOU function accumulates
data based on the time-scheme programmed into the meter.
See Chapter 10 of the Communicator EXT User Manual for details on programming
the Nexus® 1500 meter's 20-year TOU calendar and retrieving TOU data.
8.2: The Nexus® Meter's TOU Calendar
A Nexus® TOU calendar sets the parameters for TOU data accumulation. You may
store up to twenty calendars in the Nexus® 1500 meter and an unlimited amount of
calendar files on your computer.
The Nexus® TOU calendar profile allows you to assign a programmable usage sched-
ule - e.g., "Weekday," "Weekend," or "Holiday"- to each day of the calendar year. You
may create up to 16 different TOU schedules.
Each TOU schedule divides the 24-hour day into fifteen-minute intervals from
00:00:00 to 23:59:59. You may apply one of eight different programmable registers -
e.g., "Peak," "Off Peak," or "Shoulder Peak," to each fifteen-minute interval.
The Nexus® 1500 meter stores:
• Accumulations on a seasonal (up to four seasons per year) weekly, daily or hourly
basis (active/frozen registers)
• Accumulations on a monthly basis
Seasonal and monthly accumulations may span from one year into the next. Each
season and month is defined by a programmable start/billing date, which is also the
end-date of the prior season or month.
A season ends at midnight of the day before the start of the next season.
A month ends at midnight of the month's billing day.
Doc# E154701 8 - 2
8: Time-of-Use Function
Electro Industries/GaugeTechThe Leader In Power Monitoring and Smart Grid SolutionsElectro Industries/GaugeTechThe Leader In Power Monitoring and Smart Grid Solutions
If the year ends and there is no new calendar, TOU accumulations stop. The last
accumulation for the year ends on 12:31:23:59:59.
If a calendar is present for the following year, TOU accumulations continue until the
next monthly bill date or next start-of-season is reached. Accumulation can span into
the following year.
8.3: TOU Prior Season and Month
The Nexus® 1500 meter stores accumulations for the prior season and the prior
month. When the end of a billing period is reached, the current season or month is
stored as the prior data. The registers are then cleared and accumulations resume,
using the next set of TOU schedules and register assignments from the stored
calendar.
Prior and current accumulations to date are always available.
8.4: Updating, Retrieving and Replacing TOU Calendars
Communicator EXT software retrieves TOU calendars from the Nexus® meter or from
the computer's hard drive for review and edit.
Up to a maximum of twenty yearly calendars can be stored in the Nexus® meter at
any given time. You may retrieve them one at a time; a new calendar can be stored
while a current calendar is in use.
Accumulations do not stop during calendar updates. If a calendar is replaced while in
use, the accumulations for the current period will continue until the set end date. At
that point, the current time will become the new start time and the settings of the
new calendar will be used.
Reset the current accumulations, if you replace a calendar in use. A reset clears only
the current accumulation registers. This causes the current accumulations to use the
present date as the start and accumulate to the next new end date, which will be
taken from the new calendar. Once stored, prior accumulations are always available
and cannot be reset. See Chapter 19 of the Communicator EXT User Manual for
instructions on resetting TOU accumulations.
At the end of a defined period, current accumulations are stored, the registers are
cleared and accumulations for the next period begin. When the year boundary is

Doc# E154701 8 - 3
8: Time-of-Use Function
Electro Industries/GaugeTechThe Leader In Power Monitoring and Smart Grid SolutionsElectro Industries/GaugeTechThe Leader In Power Monitoring and Smart Grid Solutions
crossed, the second calendar, if present, is used. To retain continuity, you have up to
one year to replace the old calendar with one for the following year.
8.5: Daylight Savings and Demand
To enable Daylight Savings Time for the meter: from the Device Profile menu click
General Settings>Time Settings. In the Time Settings screen, click Auto DST,
which sets Daylight Savings Time automatically (for the United States only). You can
also select User Defined and enter the desired dates for Daylight Savings Time. See
Chapter 19 of the Communicator EXT User Manual for instructions.
To set Demand intervals: from the Device Profile menu click Revenue and Energy
Settings>Demand Integration Intervals and set the desired intervals. See
Chapter 19 of the Communicator EXT User Manual for instructions.
To set Cumulative Demand Type, from the Device Profile menu click Revenue and
Energy Settings>Cumulative Demand Type and select Block or Rolling Window
Average. See Chapter 19 of the Communicator EXT User Manual for instructions.

Doc# E154701 8 - 4
8: Time-of-Use Function
Electro Industries/GaugeTechThe Leader In Power Monitoring and Smart Grid SolutionsElectro Industries/GaugeTechThe Leader In Power Monitoring and Smart Grid Solutions
This page intentionally left blank.
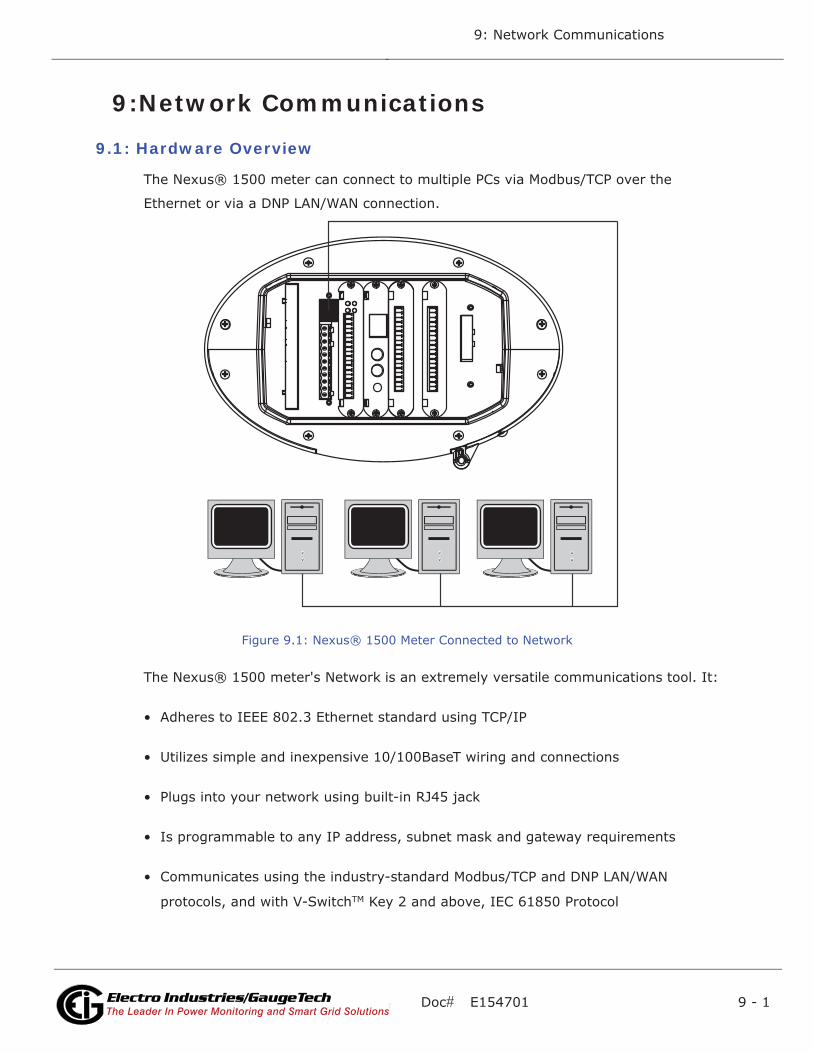
Doc# E154701 9 - 1
9: Network Communications
Electro Industries/GaugeTechThe Leader In Power Monitoring and Smart Grid SolutionsElectro Industries/GaugeTechThe Leader In Power Monitoring and Smart Grid Solutions
9:Network Communications
9.1: Hardware Overview
The Nexus® 1500 meter can connect to multiple PCs via Modbus/TCP over the
Ethernet or via a DNP LAN/WAN connection.
Figure 9.1: Nexus® 1500 Meter Connected to Network
The Nexus® 1500 meter's Network is an extremely versatile communications tool. It:
• Adheres to IEEE 802.3 Ethernet standard using TCP/IP
• Utilizes simple and inexpensive 10/100BaseT wiring and connections
• Plugs into your network using built-in RJ45 jack
• Is programmable to any IP address, subnet mask and gateway requirements
• Communicates using the industry-standard Modbus/TCP and DNP LAN/WAN
protocols, and with V-SwitchTM Key 2 and above, IEC 61850 Protocol
Doc# E154701 9 - 2
9: Network Communications
Electro Industries/GaugeTechThe Leader In Power Monitoring and Smart Grid SolutionsElectro Industries/GaugeTechThe Leader In Power Monitoring and Smart Grid Solutions
Multiple simultaneous connections (via LAN) can be made to the Nexus® meter. You
can access the Nexus® meter with SCADA, MV90 and RTU simultaneously.
Multiple users can run Communicator EXT software to access the meter concurrently.
9.2: Specifications
The Nexus® 1500 meter's main Network card (standard) has the following
specifications at 25o C:
Number of Ports: 1
Operating Mode: 10/100BaseT
Connection type: RJ45 modular (Auto-detecting
transmit and receive)
Diagnostic feature: Status LEDs for LINK and ACTIVE
Number of simultaneous Modbus TCP
connections to the meter: 8 (8 total connections over both the
main Network card and optional
Network card 2)
Number of simultaneous DNP LAN/WAN
connections to the meter: 2 TCP and 1 UDP per
Network card
NOTE: For details on the main Network cards’ IEC 61850 Protocol Ethernet
Network server, see Appendix C.
9.3: Network Connection
Use standard CAT5E network cables to connect with the Nexus® meter. The RJ45 line
is inserted into the RJ45 port on the back of the meter (see Figure 9.1).
Set the IP Address using the following steps:
(Refer to the Communicator EXT User Manual for more detailed instructions.)
1. From the Device Profile screen, double-click General Settings> Communica-
tions, then double-click on any of the ports. The Communications Settings screen
opens.
Doc# E154701 9 - 3
9: Network Communications
Electro Industries/GaugeTechThe Leader In Power Monitoring and Smart Grid SolutionsElectro Industries/GaugeTechThe Leader In Power Monitoring and Smart Grid Solutions
2. In the Network Settings section enter the following data.
NOTE: The settings shown below are the default settings of the main Network
card. See Chapter 11 for the default settings of optional Network card 2.
• IP Address: 10.0.0.1
• Subnet Mask: 255.255.255.0
• Default Gateway: 0.0.0.0
NOTES:
•You can use different settings for the main Network card (check with your
Network Administrator for the correct settings).
•We recommend that the main Network card and Network card 2 be in
different subnets, though this is not a necessity.
3. Once the above parameters have been set, Communicator EXT connects via the
network using a Device Address of "1" and the assigned IP Address when you
follow these steps:
a. Open Communicator EXT.
b. Click the Connect icon in the icon tool bar. The Connect screen opens.
c. Click the Network button at the top of the screen. Enter the following informa-
tion:
Device Address: 1
Host: The Network card’s IP Address
Network Port: 502
Protocol: Modbus TCP
d. Click the Connect button at the bottom of the screen. Communicator EXT
connects to the meter via the network.
Network Information Through Display
You can see the Network settings through the meter's Touch Screen display:
1. From the Main screen, select Setting.
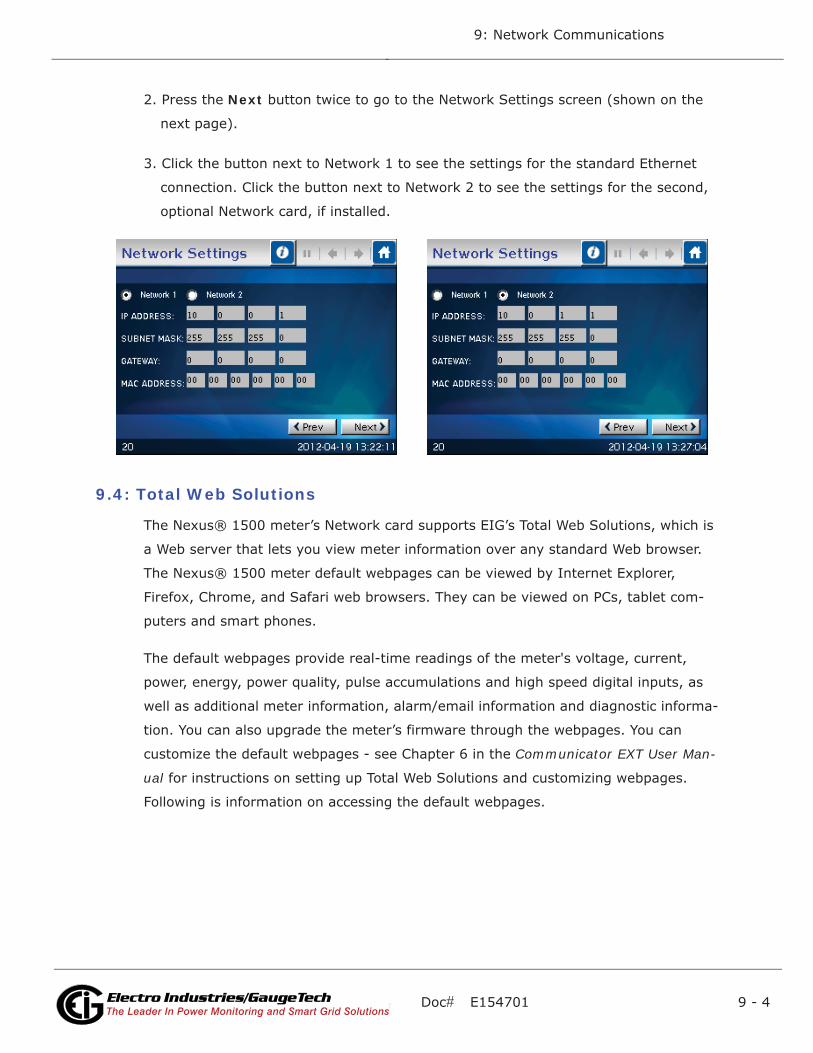
Doc# E154701 9 - 4
9: Network Communications
Electro Industries/GaugeTechThe Leader In Power Monitoring and Smart Grid SolutionsElectro Industries/GaugeTechThe Leader In Power Monitoring and Smart Grid Solutions
2. Press the Next button twice to go to the Network Settings screen (shown on the
next page).
3. Click the button next to Network 1 to see the settings for the standard Ethernet
connection. Click the button next to Network 2 to see the settings for the second,
optional Network card, if installed.
9.4: Total Web Solutions
The Nexus® 1500 meter’s Network card supports EIG’s Total Web Solutions, which is
a Web server that lets you view meter information over any standard Web browser.
The Nexus® 1500 meter default webpages can be viewed by Internet Explorer,
Firefox, Chrome, and Safari web browsers. They can be viewed on PCs, tablet com-
puters and smart phones.
The default webpages provide real-time readings of the meter's voltage, current,
power, energy, power quality, pulse accumulations and high speed digital inputs, as
well as additional meter information, alarm/email information and diagnostic informa-
tion. You can also upgrade the meter’s firmware through the webpages. You can
customize the default webpages - see Chapter 6 in the Communicator EXT User Man-
ual for instructions on setting up Total Web Solutions and customizing webpages.
Following is information on accessing the default webpages.
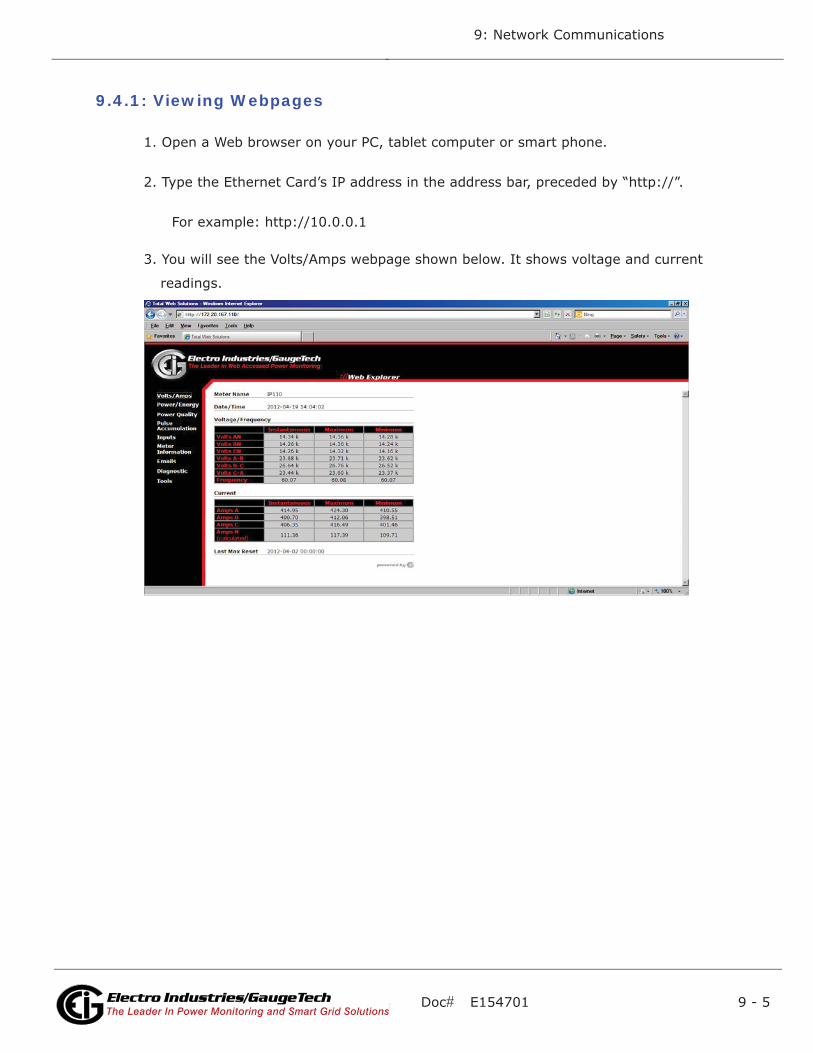
Doc# E154701 9 - 5
9: Network Communications
Electro Industries/GaugeTechThe Leader In Power Monitoring and Smart Grid SolutionsElectro Industries/GaugeTechThe Leader In Power Monitoring and Smart Grid Solutions
9.4.1: Viewing Webpages
1. Open a Web browser on your PC, tablet computer or smart phone.
2. Type the Ethernet Card’s IP address in the address bar, preceded by “http://”.
For example: http://10.0.0.1
3. You will see the Volts/Amps webpage shown below. It shows voltage and current
readings.
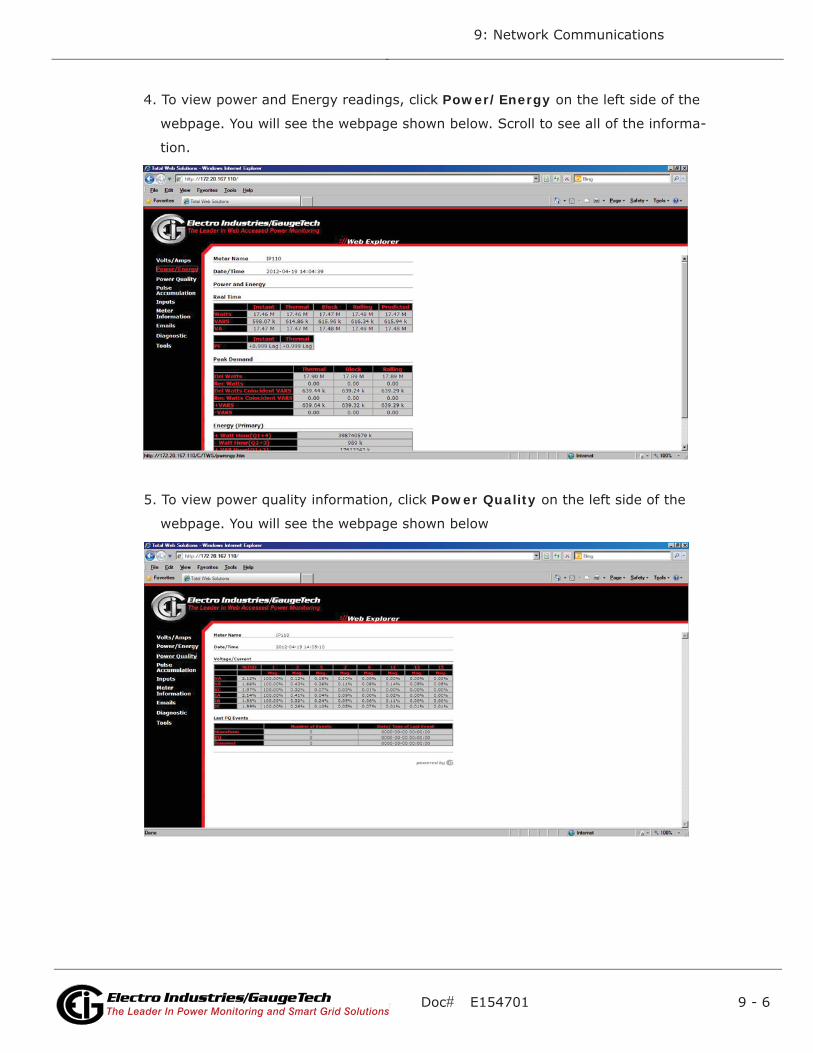
Doc# E154701 9 - 6
9: Network Communications
Electro Industries/GaugeTechThe Leader In Power Monitoring and Smart Grid SolutionsElectro Industries/GaugeTechThe Leader In Power Monitoring and Smart Grid Solutions
4. To view power and Energy readings, click Power/Energy on the left side of the
webpage. You will see the webpage shown below. Scroll to see all of the informa-
tion.
5. To view power quality information, click Power Quality on the left side of the
webpage. You will see the webpage shown below
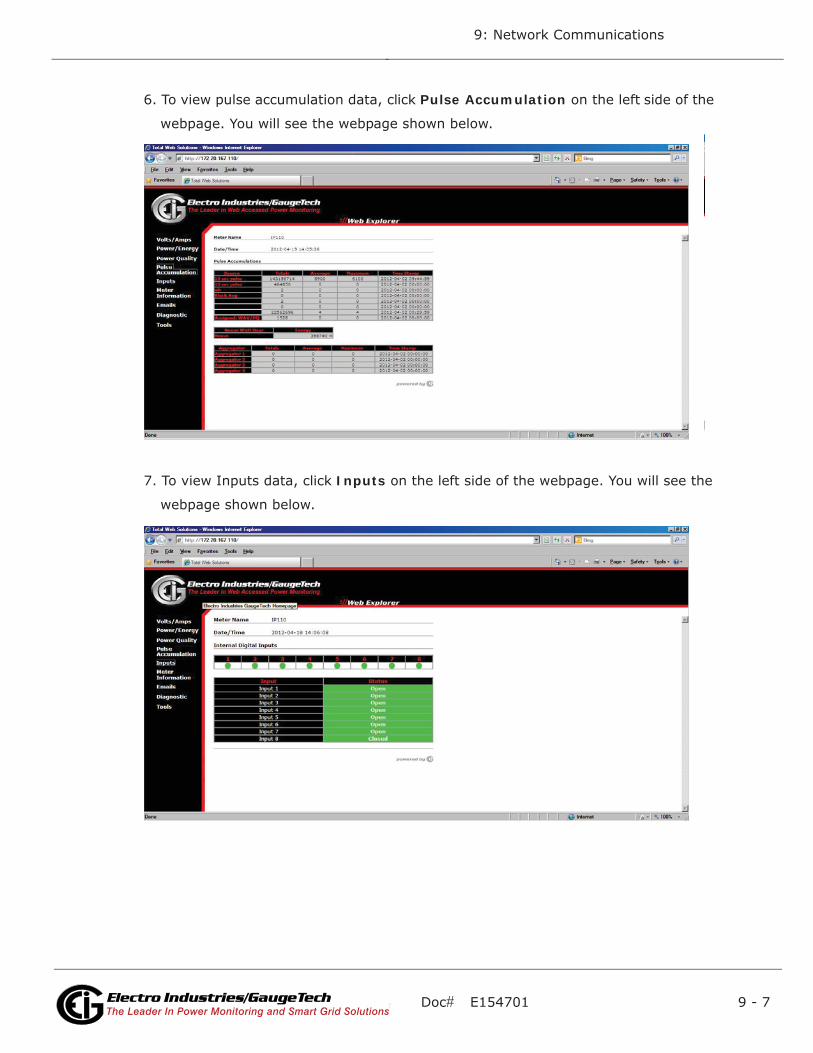
Doc# E154701 9 - 7
9: Network Communications
Electro Industries/GaugeTechThe Leader In Power Monitoring and Smart Grid SolutionsElectro Industries/GaugeTechThe Leader In Power Monitoring and Smart Grid Solutions
6. To view pulse accumulation data, click Pulse Accumulation on the left side of the
webpage. You will see the webpage shown below.
7. To view Inputs data, click Inputs on the left side of the webpage. You will see the
webpage shown below.
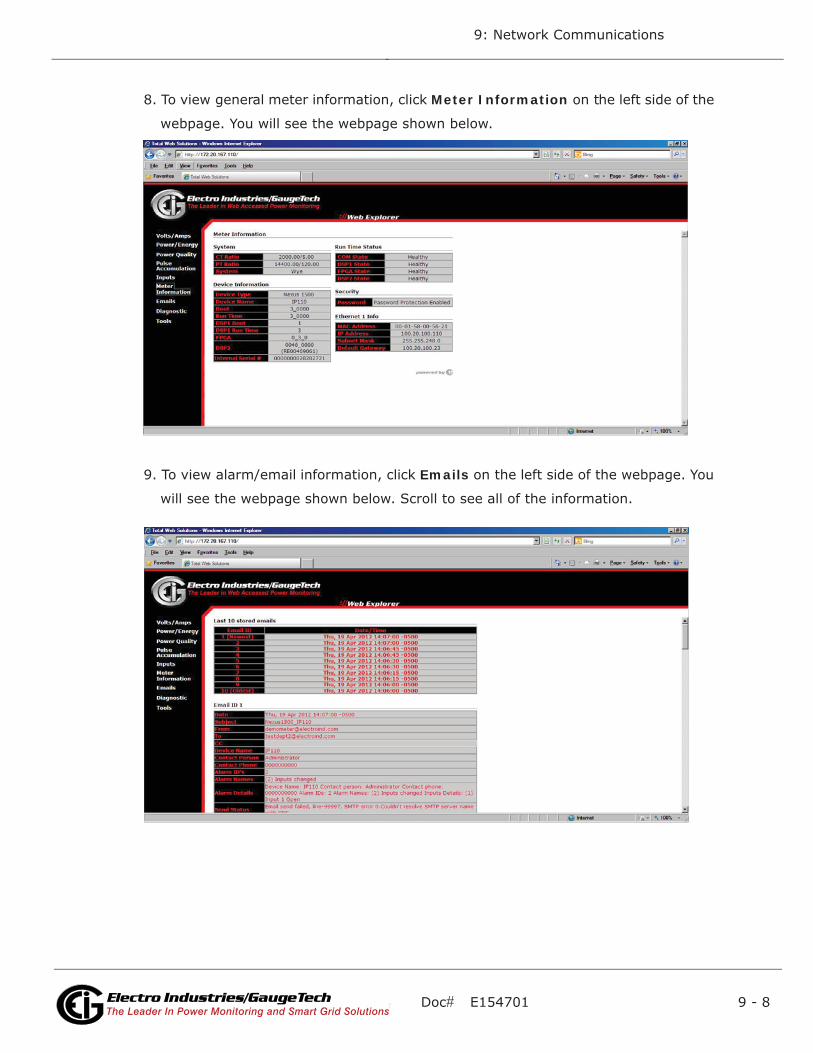
Doc# E154701 9 - 8
9: Network Communications
Electro Industries/GaugeTechThe Leader In Power Monitoring and Smart Grid SolutionsElectro Industries/GaugeTechThe Leader In Power Monitoring and Smart Grid Solutions
8. To view general meter information, click Meter Information on the left side of the
webpage. You will see the webpage shown below.
9. To view alarm/email information, click Emails on the left side of the webpage. You
will see the webpage shown below. Scroll to see all of the information.
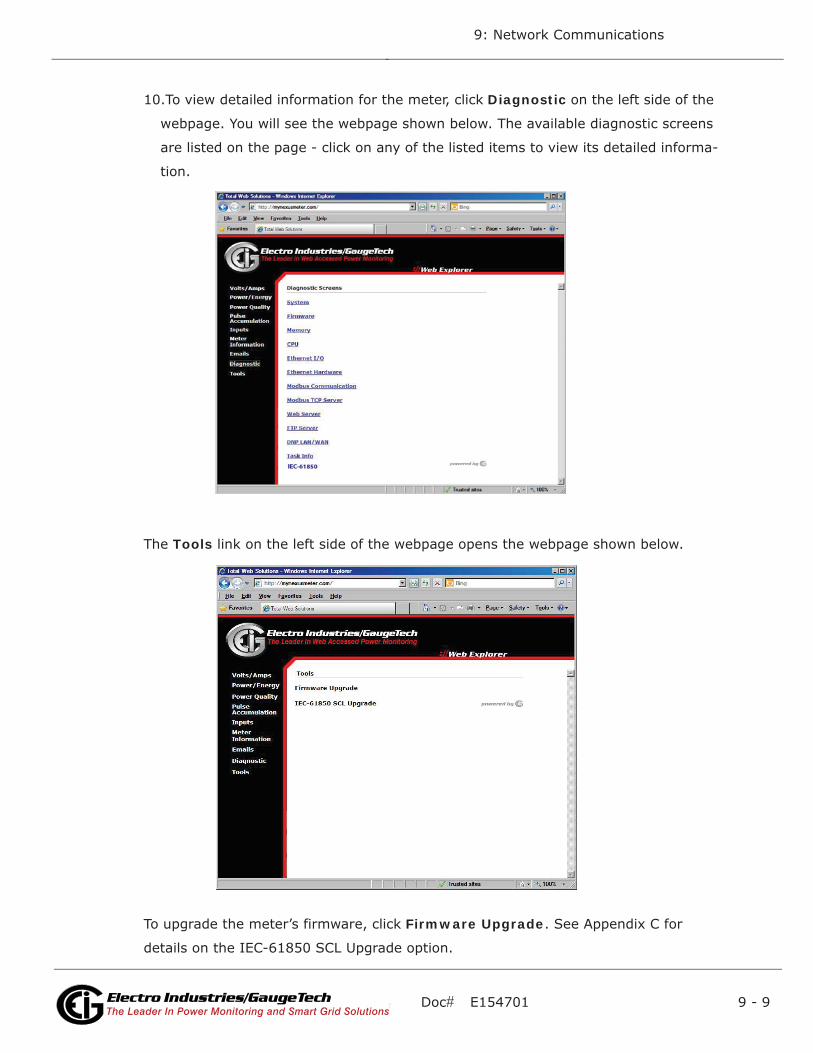
Doc# E154701 9 - 9
9: Network Communications
Electro Industries/GaugeTechThe Leader In Power Monitoring and Smart Grid SolutionsElectro Industries/GaugeTechThe Leader In Power Monitoring and Smart Grid Solutions
10.To view detailed information for the meter, click Diagnostic on the left side of the
webpage. You will see the webpage shown below. The available diagnostic screens
are listed on the page - click on any of the listed items to view its detailed informa-
tion.
The Tools link on the left side of the webpage opens the webpage shown below.
To upgrade the meter’s firmware, click Firmware Upgrade. See Appendix C for
details on the IEC-61850 SCL Upgrade option.
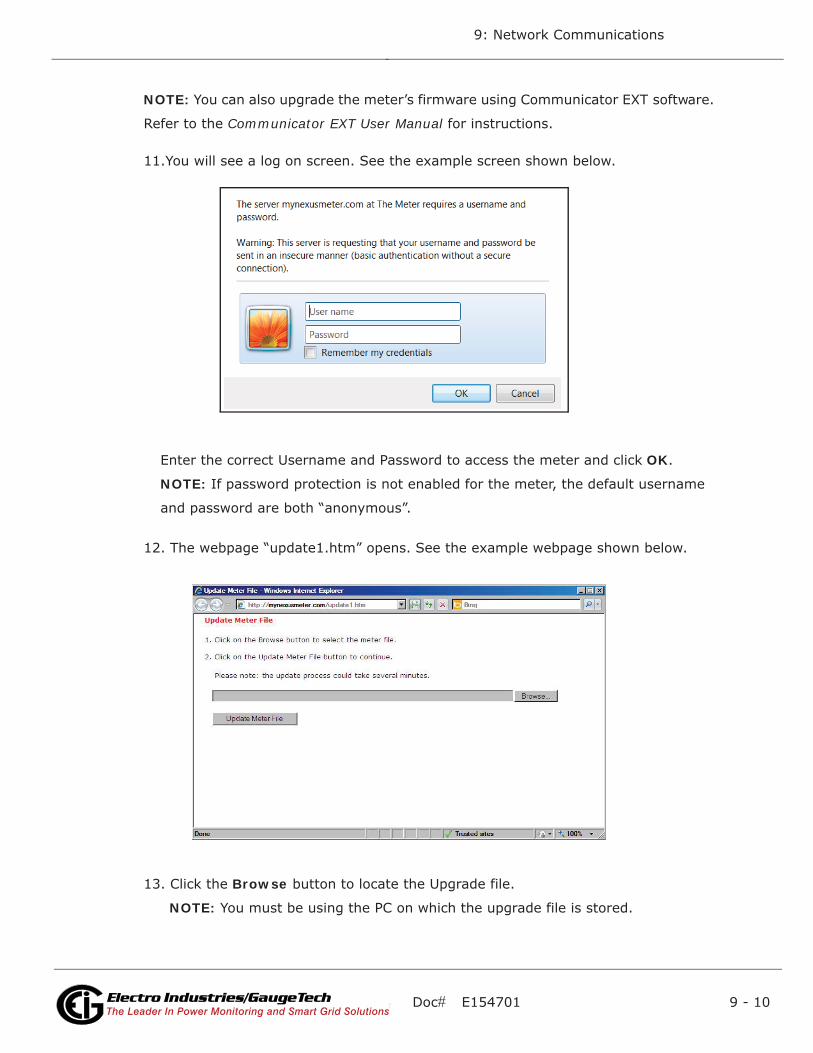
Doc# E154701 9 - 10
9: Network Communications
Electro Industries/GaugeTechThe Leader In Power Monitoring and Smart Grid SolutionsElectro Industries/GaugeTechThe Leader In Power Monitoring and Smart Grid Solutions
NOTE: You can also upgrade the meter’s firmware using Communicator EXT software.
Refer to the Communicator EXT User Manual for instructions.
11.You will see a log on screen. See the example screen shown below.
Enter the correct Username and Password to access the meter and click OK.
NOTE: If password protection is not enabled for the meter, the default username
and password are both “anonymous”.
12. The webpage “update1.htm” opens. See the example webpage shown below.
13. Click the Browse button to locate the Upgrade file.
NOTE: You must be using the PC on which the upgrade file is stored.
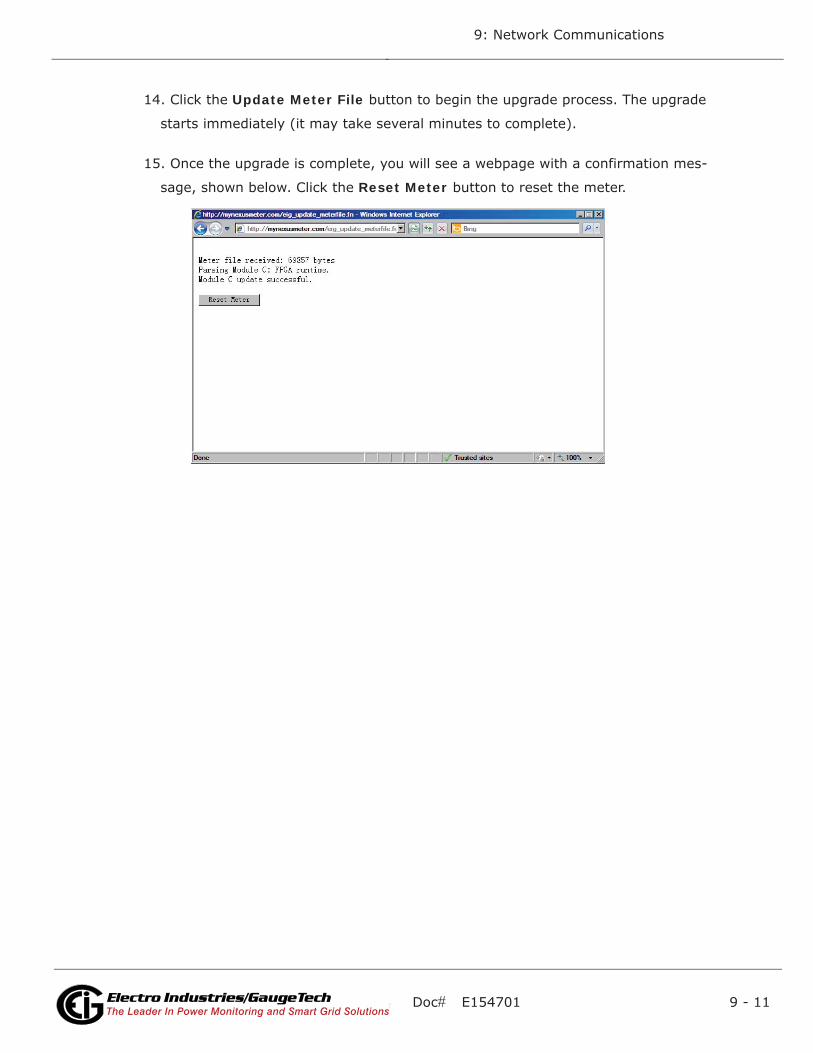
Doc# E154701 9 - 11
9: Network Communications
Electro Industries/GaugeTechThe Leader In Power Monitoring and Smart Grid SolutionsElectro Industries/GaugeTechThe Leader In Power Monitoring and Smart Grid Solutions
14. Click the Update Meter File button to begin the upgrade process. The upgrade
starts immediately (it may take several minutes to complete).
15. Once the upgrade is complete, you will see a webpage with a confirmation mes-
sage, shown below. Click the Reset Meter button to reset the meter.

Doc# E154701 9 - 12
9: Network Communications
Electro Industries/GaugeTechThe Leader In Power Monitoring and Smart Grid SolutionsElectro Industries/GaugeTechThe Leader In Power Monitoring and Smart Grid Solutions
This page intentionally left blank.
Doc# E154701 10 - 1
10: Flicker Analysis
Electro Industries/GaugeTechThe Leader In Power Monitoring and Smart Grid SolutionsElectro Industries/GaugeTechThe Leader In Power Monitoring and Smart Grid Solutions
10: Flicker Analysis
10.1: Overview
Flicker is the sensation that is experienced by the human visual system when it is
subjected to changes occurring in the illumination intensity of light sources. The
primary effects of flicker are headaches, irritability and, sometimes, epileptic
seizures.
IEC 61000-4-15 and former IEC 868 describe the methods used to determine flicker
severity. This phenomenon is strictly related to the sensitivity and the reaction of
individuals. It can only be studied on a statistical basis by setting up suitable
experiments among people.
The Nexus® 1500 meter has compliance for flicker and other power quality measure-
ments. Refer to Chapters 16 and 17 of the Communicator EXT User Manual for
additional information on flicker and compliance monitoring.
10.2: Theory of Operation
Flicker can be caused by Voltage variations that are in turn caused by variable loads,
such as arc furnaces, laser printers and microwave ovens. In order to model the eye
brain change, which is a complex physiological process, the signal from the power
network has to be processed while conforming with Figure 10.1, shown on page 10-4.
• Block 1 consists of scaling circuitry and an automatic gain control function that
normalizes input Voltages to Blocks 2, 3 and 4.
• Block 2 recovers the Voltage fluctuation by squaring the input voltage scaled to the
reference level. This simulates the behavior of a lamp.
• Block 3 is composed of a cascade of two filters and a measuring range selector. In
this implementation, a log classifier covers the full scale in use so the gain selection
is automatic and not shown here. The first filter eliminates the DC component and
the double mains frequency components of the demodulated output. For 50Hz
operation, the configuration consists of a first-order high pass filter with 3db cut-off
frequency at about 0.05Hz and a 6-order butterworth low pass filter with 35Hz 3db
cut-off frequency. The second filter is a weighting filter that simulates the response
of the human visual system to sinusoidal Voltage fluctuations of a coiled filament,
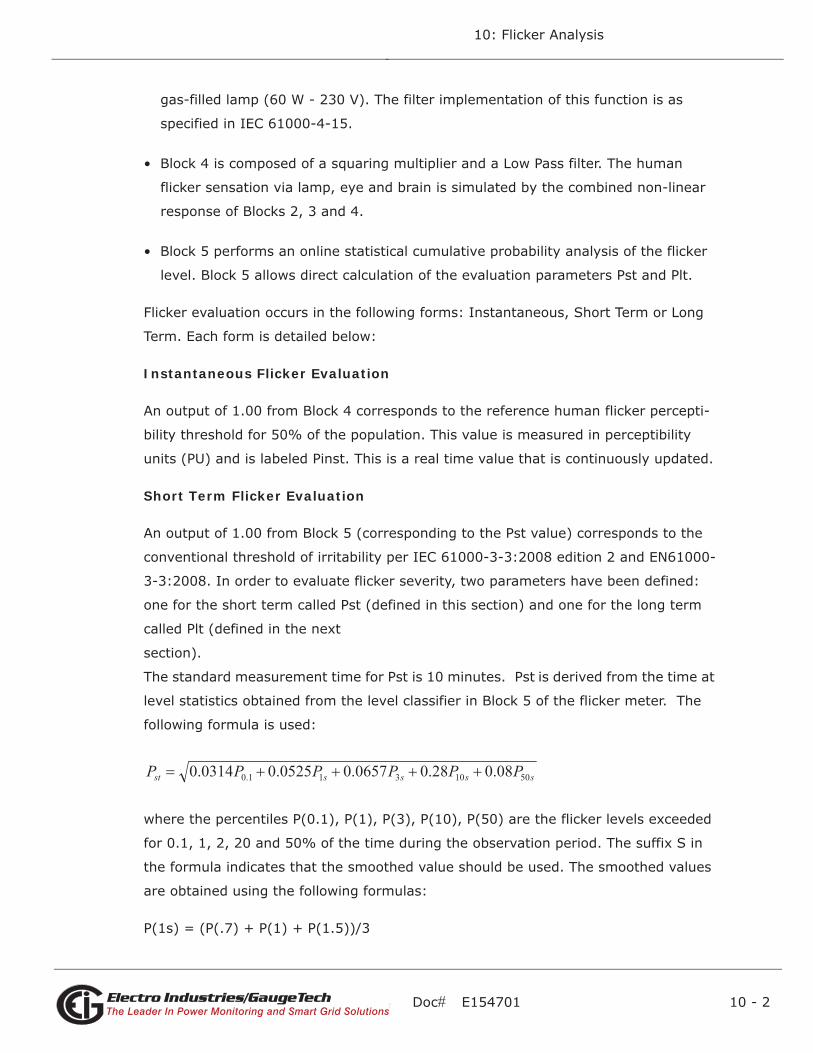
Doc# E154701 10 - 2
10: Flicker Analysis
Electro Industries/GaugeTechThe Leader In Power Monitoring and Smart Grid SolutionsElectro Industries/GaugeTechThe Leader In Power Monitoring and Smart Grid Solutions
gas-filled lamp (60 W - 230 V). The filter implementation of this function is as
specified in IEC 61000-4-15.
• Block 4 is composed of a squaring multiplier and a Low Pass filter. The human
flicker sensation via lamp, eye and brain is simulated by the combined non-linear
response of Blocks 2, 3 and 4.
• Block 5 performs an online statistical cumulative probability analysis of the flicker
level. Block 5 allows direct calculation of the evaluation parameters Pst and Plt.
Flicker evaluation occurs in the following forms: Instantaneous, Short Term or Long
Term. Each form is detailed below:
Instantaneous Flicker Evaluation
An output of 1.00 from Block 4 corresponds to the reference human flicker percepti-
bility threshold for 50% of the population. This value is measured in perceptibility
units (PU) and is labeled Pinst. This is a real time value that is continuously updated.
Short Term Flicker Evaluation
An output of 1.00 from Block 5 (corresponding to the Pst value) corresponds to the
conventional threshold of irritability per IEC 61000-3-3:2008 edition 2 and EN61000-
3-3:2008. In order to evaluate flicker severity, two parameters have been defined:
one for the short term called Pst (defined in this section) and one for the long term
called Plt (defined in the next
section).
The standard measurement time for Pst is 10 minutes. Pst is derived from the time at
level statistics obtained from the level classifier in Block 5 of the flicker meter. The
following formula is used:
where the percentiles P(0.1), P(1), P(3), P(10), P(50) are the flicker levels exceeded
for 0.1, 1, 2, 20 and 50% of the time during the observation period. The suffix S in
the formula indicates that the smoothed value should be used. The smoothed values
are obtained using the following formulas:
P(1s) = (P(.7) + P(1) + P(1.5))/3
ssssst PPPPPP 5010311.0 08.028.00657.00525.00314.0
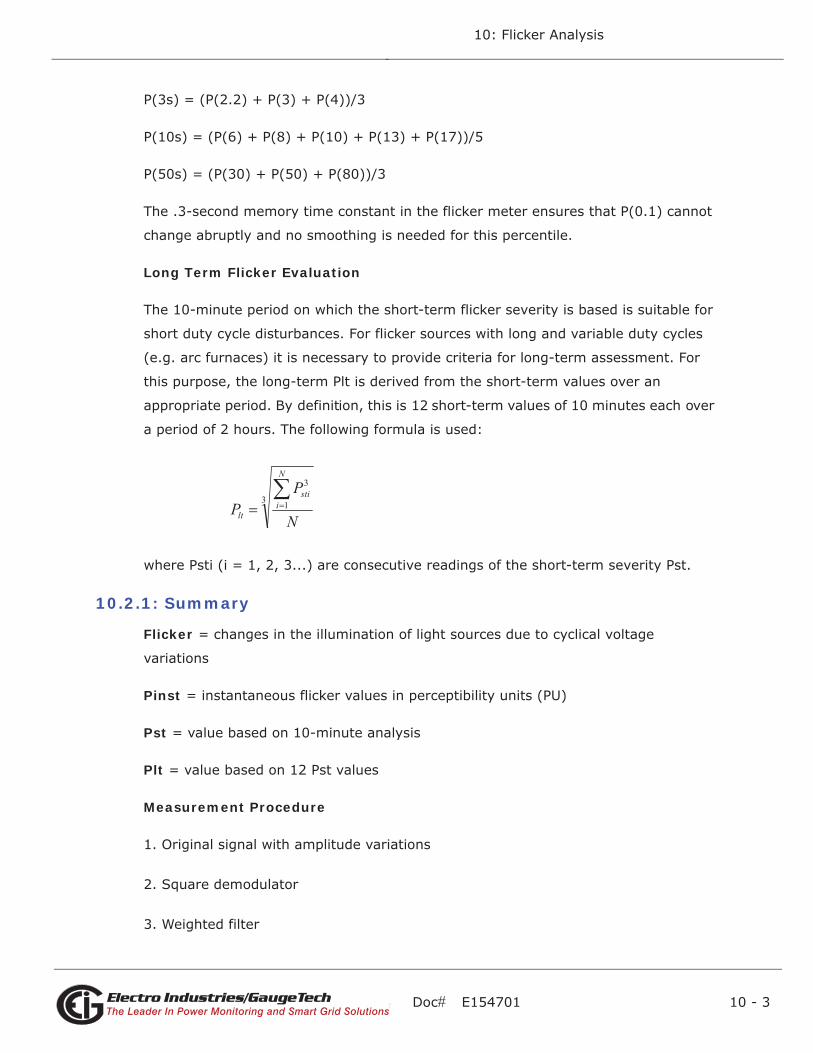
Doc# E154701 10 - 3
10: Flicker Analysis
Electro Industries/GaugeTechThe Leader In Power Monitoring and Smart Grid SolutionsElectro Industries/GaugeTechThe Leader In Power Monitoring and Smart Grid Solutions
P(3s) = (P(2.2) + P(3) + P(4))/3
P(10s) = (P(6) + P(8) + P(10) + P(13) + P(17))/5
P(50s) = (P(30) + P(50) + P(80))/3
The .3-second memory time constant in the flicker meter ensures that P(0.1) cannot
change abruptly and no smoothing is needed for this percentile.
Long Term Flicker Evaluation
The 10-minute period on which the short-term flicker severity is based is suitable for
short duty cycle disturbances. For flicker sources with long and variable duty cycles
(e.g. arc furnaces) it is necessary to provide criteria for long-term assessment. For
this purpose, the long-term Plt is derived from the short-term values over an
appropriate period. By definition, this is 12 short-term values of 10 minutes each over
a period of 2 hours. The following formula is used:
where Psti (i = 1, 2, 3...) are consecutive readings of the short-term severity Pst.
10.2.1: Summary
Flicker = changes in the illumination of light sources due to cyclical voltage
variations
Pinst = instantaneous flicker values in perceptibility units (PU)
Pst = value based on 10-minute analysis
Plt = value based on 12 Pst values
Measurement Procedure
1. Original signal with amplitude variations
2. Square demodulator
3. Weighted filter
3 1
3
N
PP
N
isti
lt
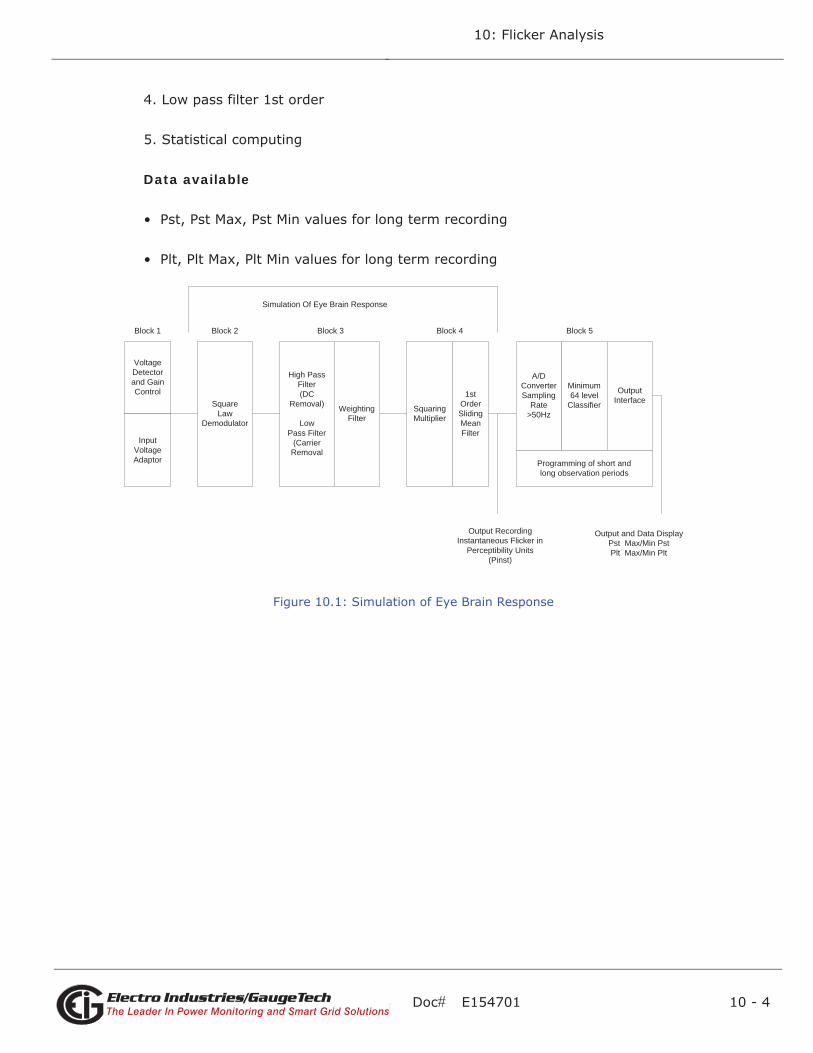
Doc# E154701 10 - 4
10: Flicker Analysis
Electro Industries/GaugeTechThe Leader In Power Monitoring and Smart Grid SolutionsElectro Industries/GaugeTechThe Leader In Power Monitoring and Smart Grid Solutions
4. Low pass filter 1st order
5. Statistical computing
Data available
• Pst, Pst Max, Pst Min values for long term recording
• Plt, Plt Max, Plt Min values for long term recording
Figure 10.1: Simulation of Eye Brain Response
Block 1 Block 2 Block 3
VoltageDetectorand GainControl
InputVoltageAdaptor
SquareLaw
Demodulator
High PassFilter(DC
Removal)
LowPass Filter
(CarrierRemoval
WeightingFilter
SquaringMultiplier
1stOrderSlidingMeanFilter
A/DConverterSampling
Rate>50Hz
Minimum64 level
Classifier
OutputInterface
Programming of short andlong observation periods
Block 4 Block 5
Simulation Of Eye Brain Response
Output RecordingInstantaneous Flicker in
Perceptibility Units(Pinst)
Output and Data DisplayPst Max/Min PstPlt Max/Min Plt
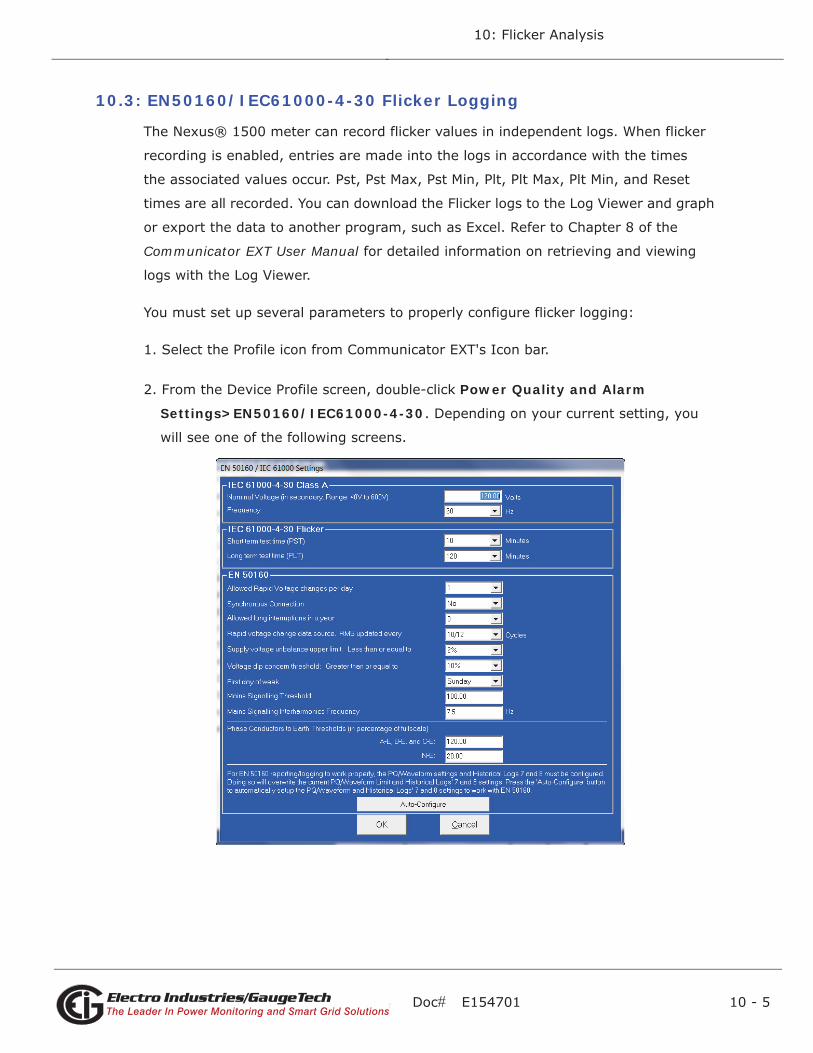
Doc# E154701 10 - 5
10: Flicker Analysis
Electro Industries/GaugeTechThe Leader In Power Monitoring and Smart Grid SolutionsElectro Industries/GaugeTechThe Leader In Power Monitoring and Smart Grid Solutions
10.3: EN50160/IEC61000-4-30 Flicker Logging
The Nexus® 1500 meter can record flicker values in independent logs. When flicker
recording is enabled, entries are made into the logs in accordance with the times
the associated values occur. Pst, Pst Max, Pst Min, Plt, Plt Max, Plt Min, and Reset
times are all recorded. You can download the Flicker logs to the Log Viewer and graph
or export the data to another program, such as Excel. Refer to Chapter 8 of the
Communicator EXT User Manual for detailed information on retrieving and viewing
logs with the Log Viewer.
You must set up several parameters to properly configure flicker logging:
1. Select the Profile icon from Communicator EXT's Icon bar.
2. From the Device Profile screen, double-click Power Quality and Alarm
Settings>EN50160/IEC61000-4-30. Depending on your current setting, you
will see one of the following screens.
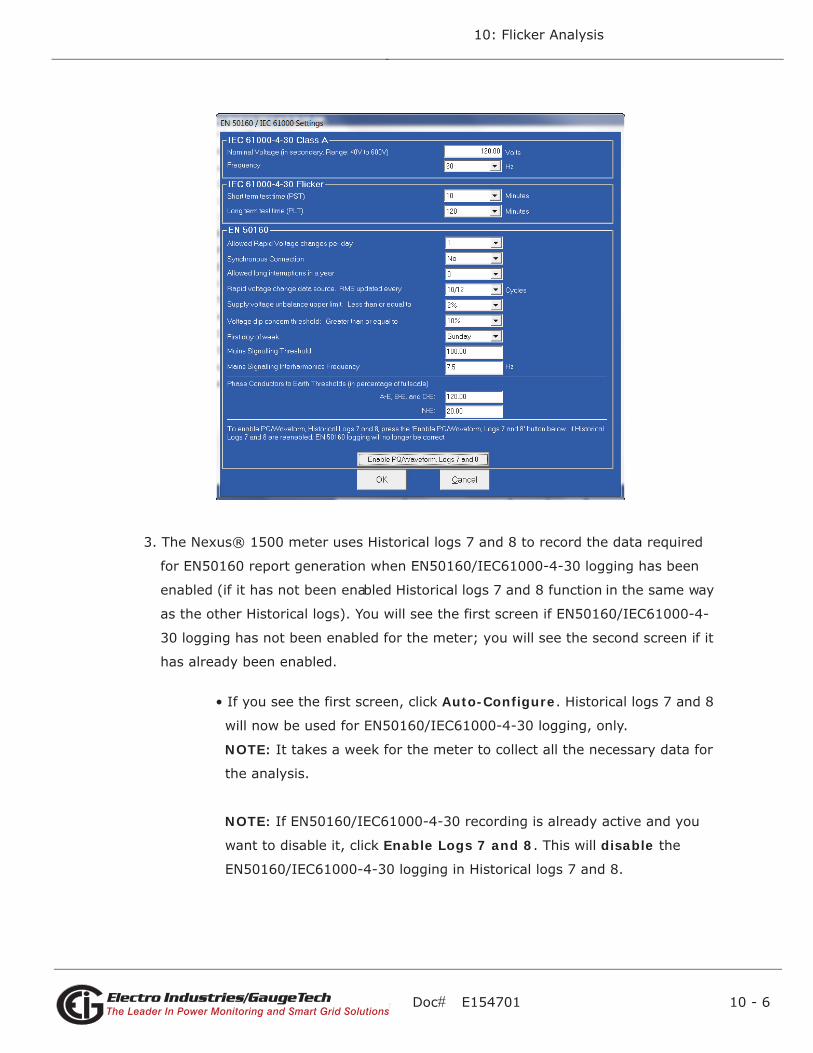
Doc# E154701 10 - 6
10: Flicker Analysis
Electro Industries/GaugeTechThe Leader In Power Monitoring and Smart Grid SolutionsElectro Industries/GaugeTechThe Leader In Power Monitoring and Smart Grid Solutions
3. The Nexus® 1500 meter uses Historical logs 7 and 8 to record the data required
for EN50160 report generation when EN50160/IEC61000-4-30 logging has been
enabled (if it has not been enabled Historical logs 7 and 8 function in the same way
as the other Historical logs). You will see the first screen if EN50160/IEC61000-4-
30 logging has not been enabled for the meter; you will see the second screen if it
has already been enabled.
• If you see the first screen, click Auto-Configure. Historical logs 7 and 8
will now be used for EN50160/IEC61000-4-30 logging, only.
NOTE: It takes a week for the meter to collect all the necessary data for
the analysis.
NOTE: If EN50160/IEC61000-4-30 recording is already active and you
want to disable it, click Enable Logs 7 and 8. This will disable the
EN50160/IEC61000-4-30 logging in Historical logs 7 and 8.
Doc# E154701 10 - 7
10: Flicker Analysis
Electro Industries/GaugeTechThe Leader In Power Monitoring and Smart Grid SolutionsElectro Industries/GaugeTechThe Leader In Power Monitoring and Smart Grid Solutions
4. Make the following selections/entries:
a. IEC 61000-4-30 Class A:
• Enter the nominal Voltage in secondary (range from 40V to 600V).
• Select the frequency (50 or 60Hz).
b. IEC 61000 4-30 Flicker:
• Select the short term test time (1-10 minutes, in minute increments).
• Select the long term test time (10-240 minutes, in ten minute
increments).
c. EN 50160:
• Select the number of allowed rapid Voltage changes per day (1- 50).
• Select the synchronous connection status (Yes or No: Yes for a system
with a synchronous connection to another system, No if there is no such
synchronous connection).
• Select the number of allowed long interruptions (0-100).
• Select how often RMS is updated for rapid Voltage data source (1 cycle or
10/12 cycles)
• Select the upper limit for the supply Voltage unbalance (less than or
equal to 2% or 3%).
• Select the Voltage dip concern threshold (greater than or equal to 10%-
85%).
• Select the first day of the week (Sunday or Monday).
• Enter the Mains signalling threshold.
• Enter the Mains signalling Interharmonic frequency.
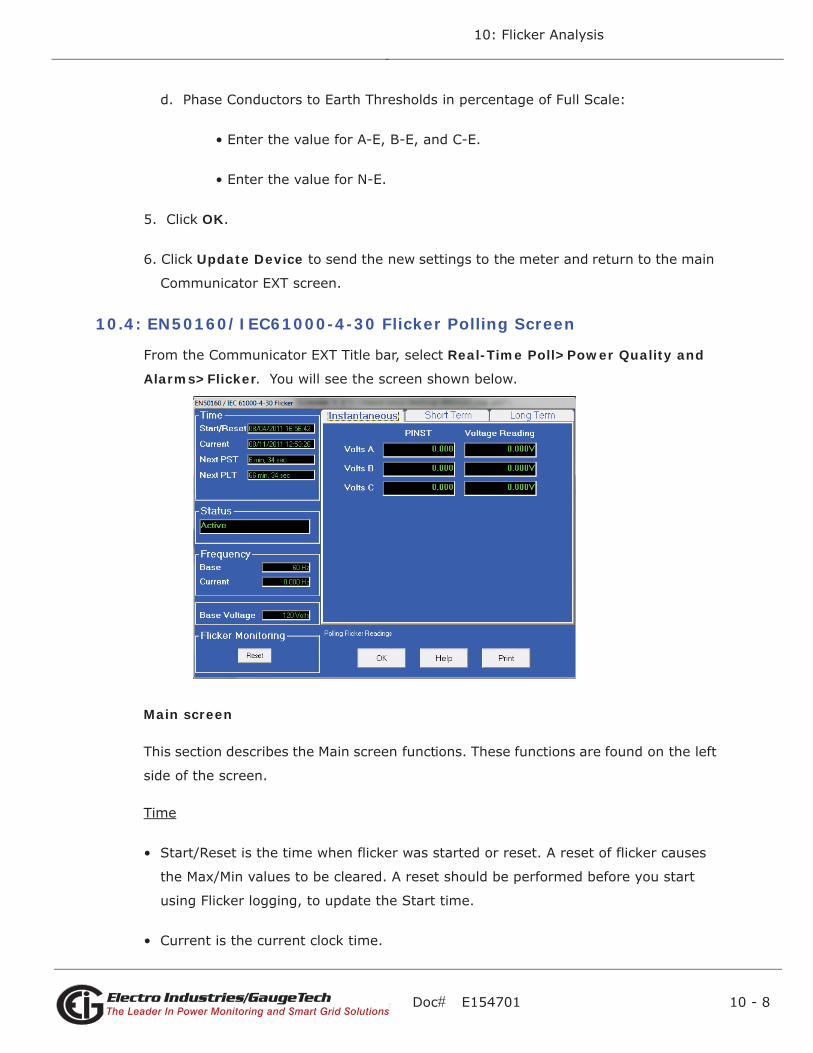
Doc# E154701 10 - 8
10: Flicker Analysis
Electro Industries/GaugeTechThe Leader In Power Monitoring and Smart Grid SolutionsElectro Industries/GaugeTechThe Leader In Power Monitoring and Smart Grid Solutions
d. Phase Conductors to Earth Thresholds in percentage of Full Scale:
• Enter the value for A-E, B-E, and C-E.
• Enter the value for N-E.
5. Click OK.
6. Click Update Device to send the new settings to the meter and return to the main
Communicator EXT screen.
10.4: EN50160/IEC61000-4-30 Flicker Polling Screen
From the Communicator EXT Title bar, select Real-Time Poll>Power Quality and
Alarms>Flicker. You will see the screen shown below.
Main screen
This section describes the Main screen functions. These functions are found on the left
side of the screen.
Time
• Start/Reset is the time when flicker was started or reset. A reset of flicker causes
the Max/Min values to be cleared. A reset should be performed before you start
using Flicker logging, to update the Start time.
• Current is the current clock time.
Doc# E154701 10 - 9
10: Flicker Analysis
Electro Industries/GaugeTechThe Leader In Power Monitoring and Smart Grid SolutionsElectro Industries/GaugeTechThe Leader In Power Monitoring and Smart Grid Solutions
• Next Pst is the countdown time to when the next Pst value is available.
• Next Plt is the countdown time to when the next Plt value is available.
Status
• Indicates the current status: Active = on.
Frequency
• Base is the operating frequency (50 or 60 Hz) selected in the EN50160 Flicker
screen (see Section 10.3).
• Current is the real time frequency measurement of the applied Voltage.
Base Voltage
• The Voltage reference based on the Standard’s specification, calculated automati-
cally by the Nexus 1500 meter®.
Flicker Monitoring
• Click Reset to cause the Max/Min values to be cleared.
NOTE: The Reset function may be restricted to a level 2 password. If so, and if you
have not signed on with a level 2 password, you will not see the Reset button.
Use the tabs at the top of the screen view to the Instantaneous, Short Term, and Long
Term readings.
Instantaneous Readings
NOTE: The Instantaneous view is the default of this screen (see the screen shown on
the previous page). If you are in the Short or Long Term views, click on the
Instantaneous tab to display this view.
• The PU values, Pinst for Voltage Inputs Va, Vb and Vc are displayed here and are
continuously updated. The corresponding current Voltage values for each channel
are displayed for reference.
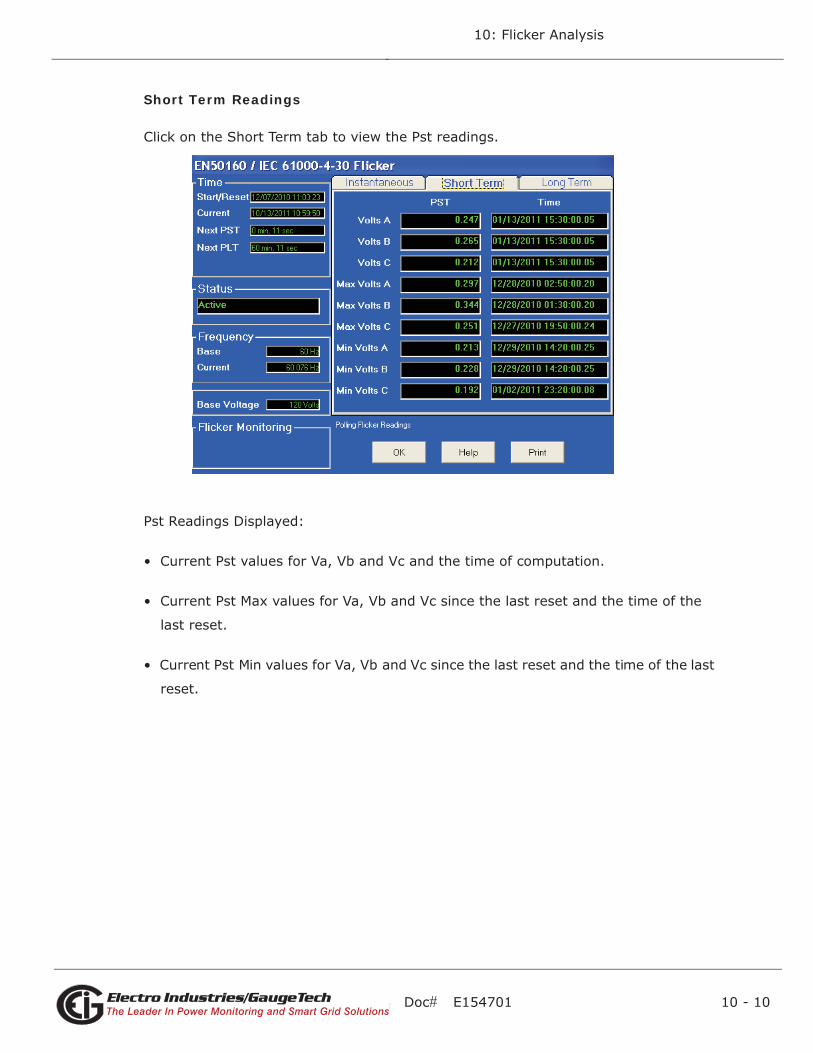
Doc# E154701 10 - 10
10: Flicker Analysis
Electro Industries/GaugeTechThe Leader In Power Monitoring and Smart Grid SolutionsElectro Industries/GaugeTechThe Leader In Power Monitoring and Smart Grid Solutions
Short Term Readings
Click on the Short Term tab to view the Pst readings.
Pst Readings Displayed:
• Current Pst values for Va, Vb and Vc and the time of computation.
• Current Pst Max values for Va, Vb and Vc since the last reset and the time of the
last reset.
• Current Pst Min values for Va, Vb and Vc since the last reset and the time of the last
reset.
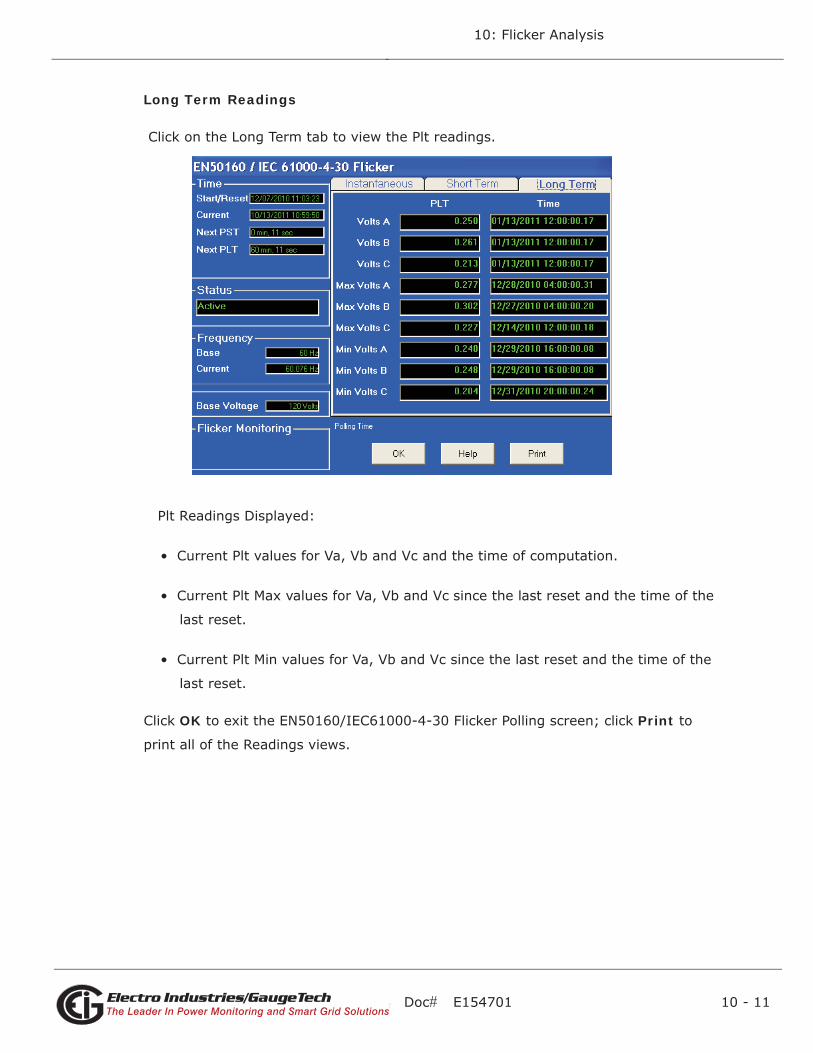
Doc# E154701 10 - 11
10: Flicker Analysis
Electro Industries/GaugeTechThe Leader In Power Monitoring and Smart Grid SolutionsElectro Industries/GaugeTechThe Leader In Power Monitoring and Smart Grid Solutions
Long Term Readings
Click on the Long Term tab to view the Plt readings.
Plt Readings Displayed:
• Current Plt values for Va, Vb and Vc and the time of computation.
• Current Plt Max values for Va, Vb and Vc since the last reset and the time of the
last reset.
• Current Plt Min values for Va, Vb and Vc since the last reset and the time of the
last reset.
Click OK to exit the EN50160/IEC61000-4-30 Flicker Polling screen; click Print to
print all of the Readings views.
Doc# E154701 10 - 12
10: Flicker Analysis
Electro Industries/GaugeTechThe Leader In Power Monitoring and Smart Grid SolutionsElectro Industries/GaugeTechThe Leader In Power Monitoring and Smart Grid Solutions
10.5: Polling through Communications
The Pinst, Pst, Pst Max, Pst Min, Plt, Plt Max, Plt Min values can be polled through the
communications port. Refer to the Nexus® 1500 meter's Modbus and DNP Mapping
manuals for register assignments and data definitions.
10.6: Log Viewer
1. Click the Open Log icon from Communicator EXT's Icon bar.
2. Log Viewer opens. Using the menus at the top of the screen, select a meter, time
ranges and values to access.
3. Click the Flicker icon.
The values and the associated time stamps (when the values occurred) are displayed
in a grid box. Use the buttons at the bottom of the screen to create a graph or export
the data to another program.
• Graphed values include Pst and Plt Va, Vb and Vc.
• Displayed values include Pst and Plt Max and Min for Va, Vb and Vc.
NOTE: Max and Min values are only displayed; they cannot be graphed. However,
Max and Min values are available for export.
10.7: Performance Notes
• Pst and Plt average time are synchronized to the clock (e.g. for a 10 minute
average, the times will occur at 0, 10, 20, etc.). The actual time of the first average
can be less than the selected period to allow for initial clock synchronization.
• If the wrong frequency is chosen (e.g. 50Hz selection for a system operating at
60Hz), flicker will still operate but the computed values will not be valid. Therefore,
you should select the frequency setting with care.
• User settings are stored. If flicker is enabled and power is removed from the meter,
flicker will still be on when power returns. This can cause gaps in the logged data.
• The Max and Min values are stored, and are not lost if the unit is powered down.

Doc# E154701 10 - 13
10: Flicker Analysis
Electro Industries/GaugeTechThe Leader In Power Monitoring and Smart Grid SolutionsElectro Industries/GaugeTechThe Leader In Power Monitoring and Smart Grid Solutions
• Flicker meets the requirements of IEC 61000-4-15, IEC61000-4-30 and former IEC
868. Refer to those specifications for more details, if needed. Refer to chapters 16
and 17 in the Communicator EXT User Manual for additional information.

Doc# E154701 10 - 14
10: Flicker Analysis
Electro Industries/GaugeTechThe Leader In Power Monitoring and Smart Grid SolutionsElectro Industries/GaugeTechThe Leader In Power Monitoring and Smart Grid Solutions
This page intentionally left blank.
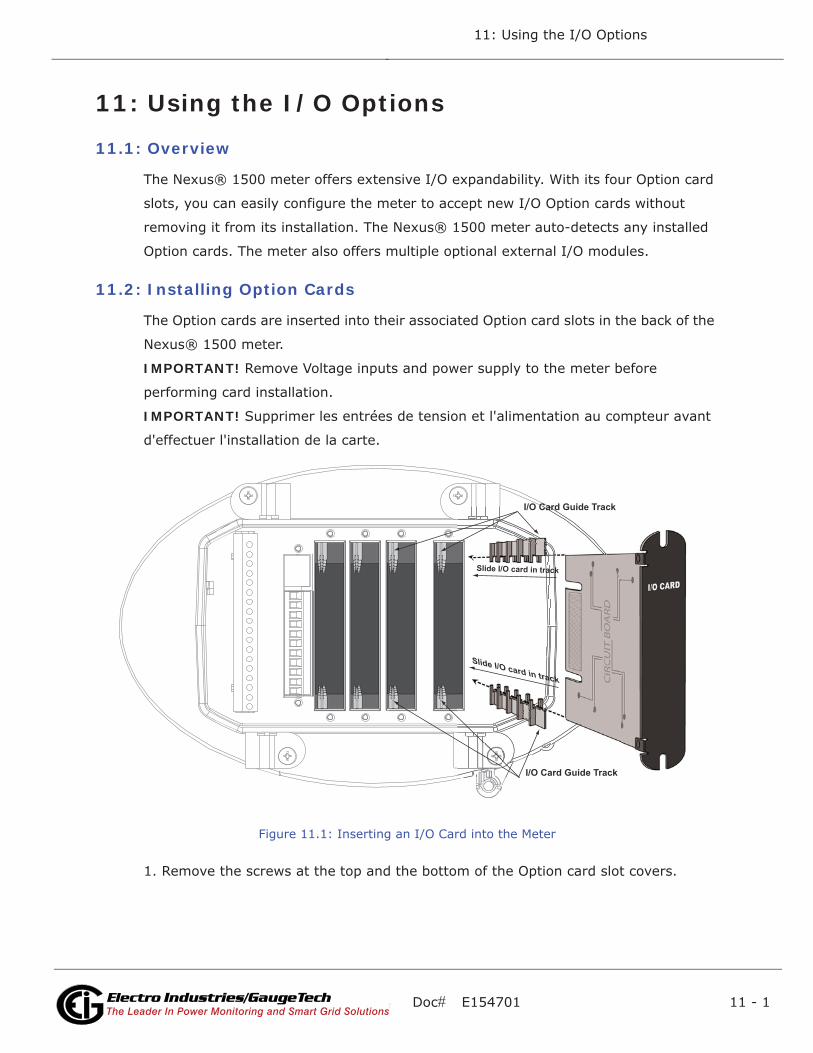
Doc# E154701 11 - 1
11: Using the I/O Options
Electro Industries/GaugeTechThe Leader In Power Monitoring and Smart Grid SolutionsElectro Industries/GaugeTechThe Leader In Power Monitoring and Smart Grid Solutions
11: Using the I/O Options
11.1: Overview
The Nexus® 1500 meter offers extensive I/O expandability. With its four Option card
slots, you can easily configure the meter to accept new I/O Option cards without
removing it from its installation. The Nexus® 1500 meter auto-detects any installed
Option cards. The meter also offers multiple optional external I/O modules.
11.2: Installing Option Cards
The Option cards are inserted into their associated Option card slots in the back of the
Nexus® 1500 meter.
IMPORTANT! Remove Voltage inputs and power supply to the meter before
performing card installation.
IMPORTANT! Supprimer les entrées de tension et l'alimentation au compteur avant
d'effectuer l'installation de la carte.
Figure 11.1: Inserting an I/O Card into the Meter
1. Remove the screws at the top and the bottom of the Option card slot covers.
I/O Card Guide Track
I/O Card Guide Track
Slide I/O card in track

Doc# E154701 11 - 2
11: Using the I/O Options
Electro Industries/GaugeTechThe Leader In Power Monitoring and Smart Grid SolutionsElectro Industries/GaugeTechThe Leader In Power Monitoring and Smart Grid Solutions
2. There is a plastic "track" on the top and the bottom of the slot. The Option card fits
into this track.
CAUTION! Make sure the I/O card is inserted properly into the track to
avoid damaging the card's components.
3. Slide the card inside the plastic track and insert it into the slot. You will hear a click
when the card is fully inserted. Be careful: it is easy to miss the guide track. Refer
to Figure 11.1.
11.3: Configuring Option Cards
CAUTION! FOR PROPER OPERATION, RESET ALL PARAMETERS IN THE UNIT
AFTER HARDWARE MODIFICATION.
The Nexus® 1500 meter auto-detects any Option cards installed in it. Configure the
Option cards through Communicator EXT software. Refer to Chapter 19 of the
Communicator EXT User Manual for detailed instructions.
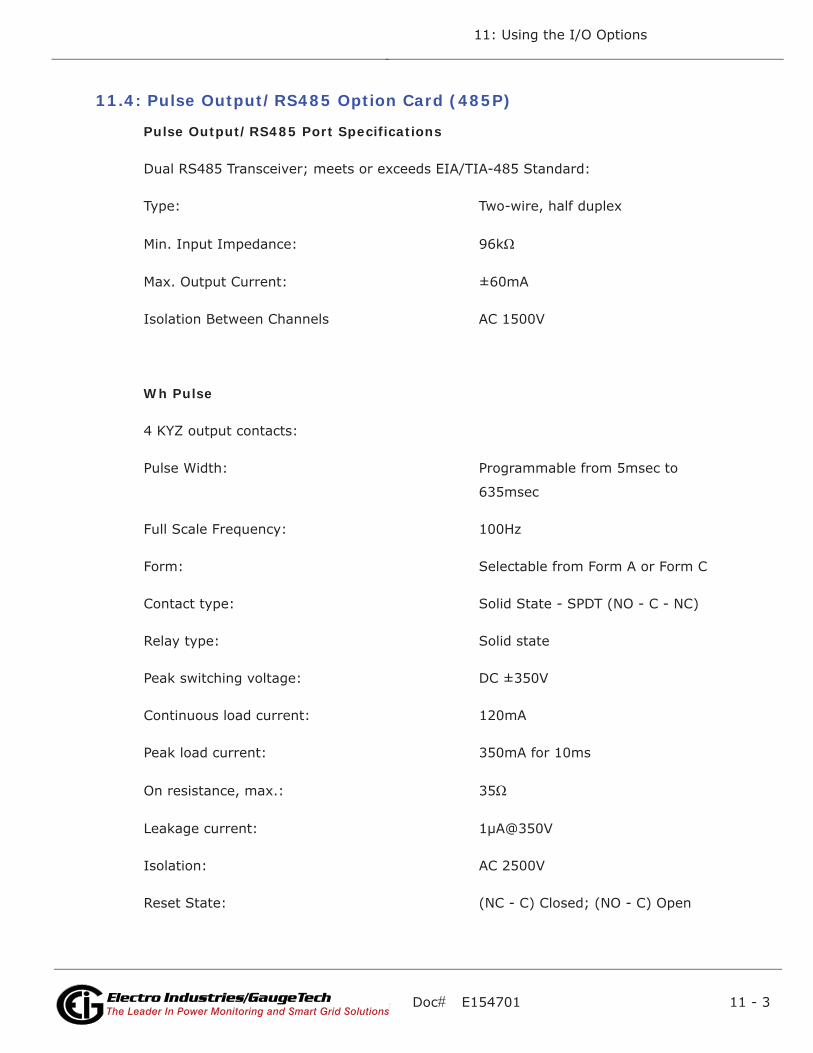
Doc# E154701 11 - 3
11: Using the I/O Options
Electro Industries/GaugeTechThe Leader In Power Monitoring and Smart Grid SolutionsElectro Industries/GaugeTechThe Leader In Power Monitoring and Smart Grid Solutions
11.4: Pulse Output/RS485 Option Card (485P)
Pulse Output/RS485 Port Specifications
Dual RS485 Transceiver; meets or exceeds EIA/TIA-485 Standard:
Type: Two-wire, half duplex
Min. Input Impedance: 96k
Max. Output Current: ±60mA
Isolation Between Channels AC 1500V
Wh Pulse
4 KYZ output contacts:
Pulse Width: Programmable from 5msec to
635msec
Full Scale Frequency: 100Hz
Form: Selectable from Form A or Form C
Contact type: Solid State - SPDT (NO - C - NC)
Relay type: Solid state
Peak switching voltage: DC ±350V
Continuous load current: 120mA
Peak load current: 350mA for 10ms
On resistance, max.: 35
Leakage current: 1μA@350V
Isolation: AC 2500V
Reset State: (NC - C) Closed; (NO - C) Open
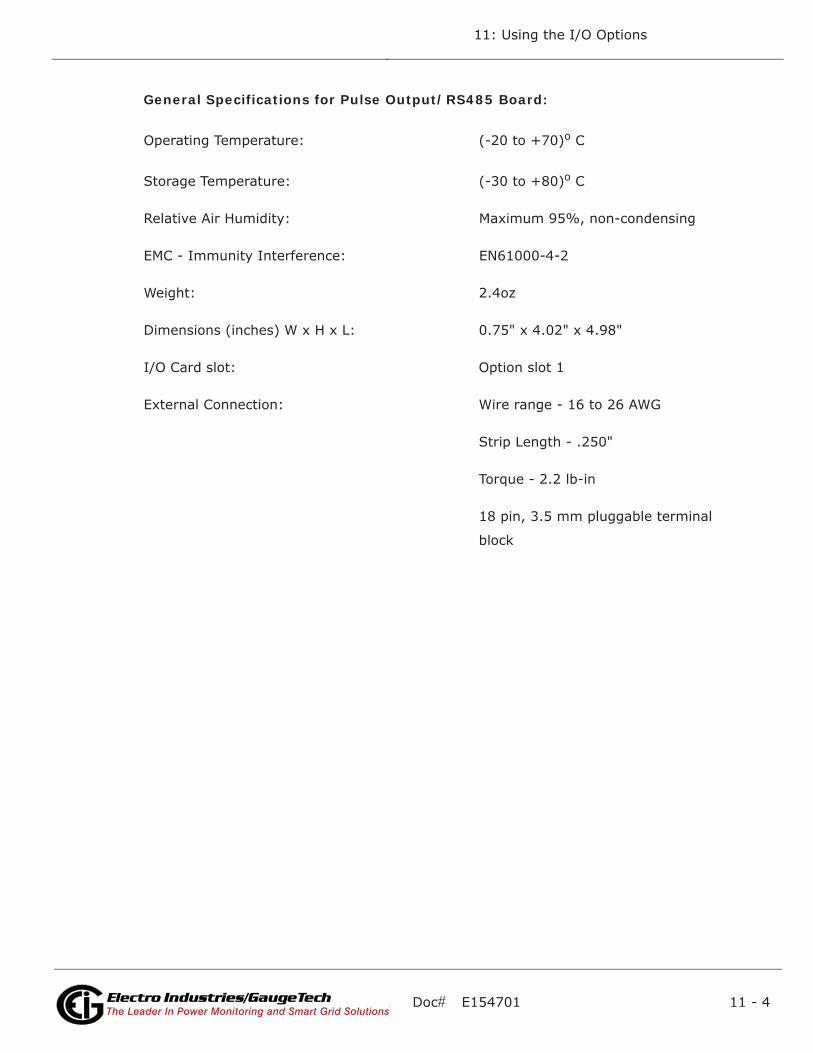
Doc# E154701 11 - 4
11: Using the I/O Options
Electro Industries/GaugeTechThe Leader In Power Monitoring and Smart Grid SolutionsElectro Industries/GaugeTechThe Leader In Power Monitoring and Smart Grid Solutions
General Specifications for Pulse Output/RS485 Board:
Operating Temperature: (-20 to +70)o C
Storage Temperature: (-30 to +80)o C
Relative Air Humidity: Maximum 95%, non-condensing
EMC - Immunity Interference: EN61000-4-2
Weight: 2.4oz
Dimensions (inches) W x H x L: 0.75" x 4.02" x 4.98"
I/O Card slot: Option slot 1
External Connection: Wire range - 16 to 26 AWG
Strip Length - .250"
Torque - 2.2 lb-in
18 pin, 3.5 mm pluggable terminal
block
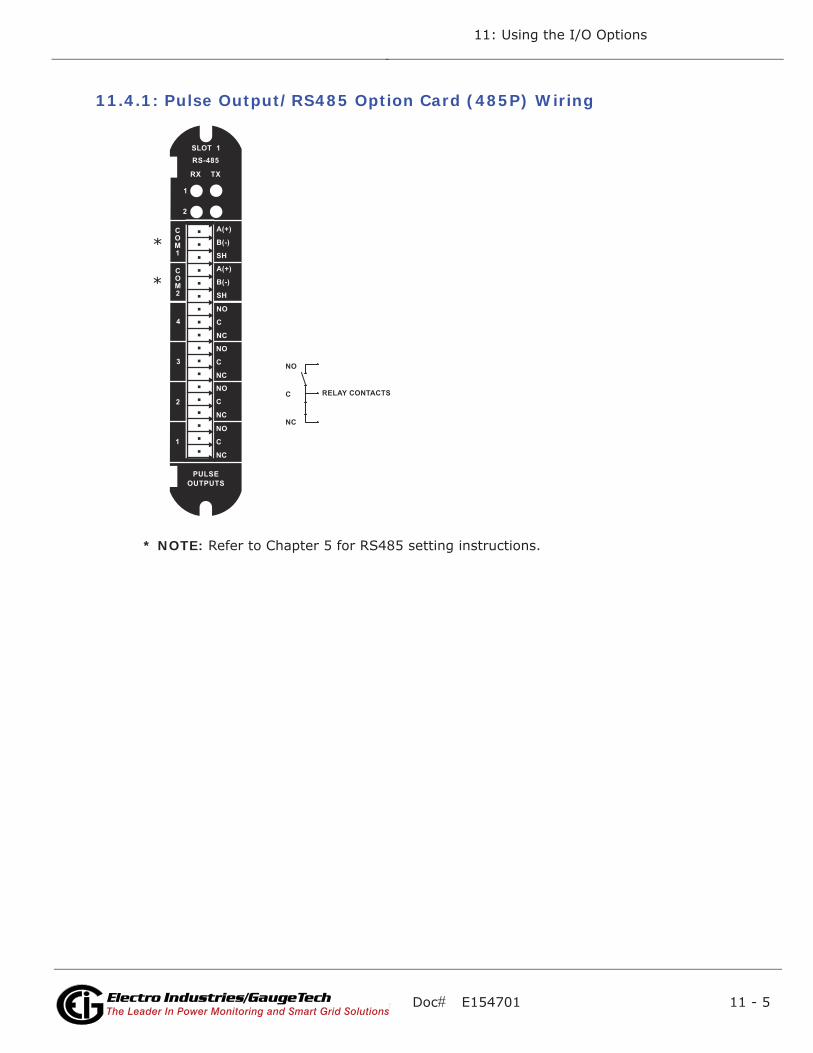
Doc# E154701 11 - 5
11: Using the I/O Options
Electro Industries/GaugeTechThe Leader In Power Monitoring and Smart Grid SolutionsElectro Industries/GaugeTechThe Leader In Power Monitoring and Smart Grid Solutions
11.4.1: Pulse Output/RS485 Option Card (485P) Wiring
* NOTE: Refer to Chapter 5 for RS485 setting instructions.
SLOT 1RS-485
RX TX
1
2
COM2
A(+)
B(-)
SH
NO
C
NC
4
NO
C
NC
3
NO
C
NC
2
1
NO
C
NC
PULSEOUTPUTS
A(+)
B(-)
SH
COM1
NO
C
NC
RELAY CONTACTS
*
*
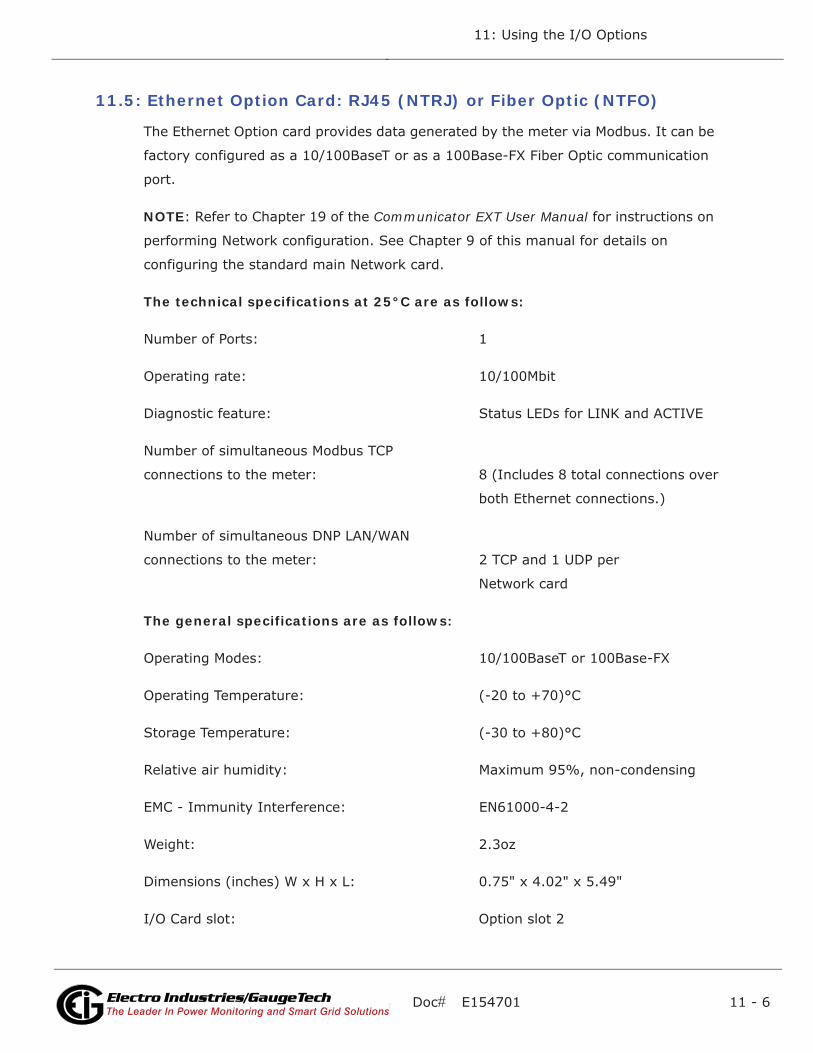
Doc# E154701 11 - 6
11: Using the I/O Options
Electro Industries/GaugeTechThe Leader In Power Monitoring and Smart Grid SolutionsElectro Industries/GaugeTechThe Leader In Power Monitoring and Smart Grid Solutions
11.5: Ethernet Option Card: RJ45 (NTRJ) or Fiber Optic (NTFO)
The Ethernet Option card provides data generated by the meter via Modbus. It can be
factory configured as a 10/100BaseT or as a 100Base-FX Fiber Optic communication
port.
NOTE: Refer to Chapter 19 of the Communicator EXT User Manual for instructions on
performing Network configuration. See Chapter 9 of this manual for details on
configuring the standard main Network card.
The technical specifications at 25°C are as follows:
Number of Ports: 1
Operating rate: 10/100Mbit
Diagnostic feature: Status LEDs for LINK and ACTIVE
Number of simultaneous Modbus TCP
connections to the meter: 8 (Includes 8 total connections over
both Ethernet connections.)
Number of simultaneous DNP LAN/WAN
connections to the meter: 2 TCP and 1 UDP per
Network card
The general specifications are as follows:
Operating Modes: 10/100BaseT or 100Base-FX
Operating Temperature: (-20 to +70)°C
Storage Temperature: (-30 to +80)°C
Relative air humidity: Maximum 95%, non-condensing
EMC - Immunity Interference: EN61000-4-2
Weight: 2.3oz
Dimensions (inches) W x H x L: 0.75" x 4.02" x 5.49"
I/O Card slot: Option slot 2
Doc# E154701 11 - 7
11: Using the I/O Options
Electro Industries/GaugeTechThe Leader In Power Monitoring and Smart Grid SolutionsElectro Industries/GaugeTechThe Leader In Power Monitoring and Smart Grid Solutions
Connection Type: RJ45 modular (Auto-detecting
transmit and receive)10/100BaseT
OR
Duplex ST Receptacle - 100Base-FX
Fiber Optic Specifications are as follows:
Connector: ST
Fiber Mode: Multimode Fiber 62.5/125um
Wavelength: 1310nm
Max. Distance: 2km
Default Configuration
The Nexus® 1500 meter automatically recognizes the installed Option card during
power-up. If you have not programmed a configuration for the Ethernet card, the unit
defaults to the following configuration:
IP Address: 10.0.1.1
Subnet Mask: 255.255.255.0
Default Gateway: 0.0.0.0
NOTE: The IP addresses of the Nexus® 1500 meter's standard main Network card
and optional Network Card 2 must be in different subnets.
Doc# E154701 11 - 8
11: Using the I/O Options
Electro Industries/GaugeTechThe Leader In Power Monitoring and Smart Grid SolutionsElectro Industries/GaugeTechThe Leader In Power Monitoring and Smart Grid Solutions
11.6: Relay Output Option Card (6RO1)
The Relay Output card has 6 relay contact outputs for load switching. The outputs are
electrically isolated from the main unit.
The technical specifications at 25°C are as follows:
Power consumption: 0.320W internal
Relay outputs:
Number of outputs: 6
Contact type: Changeover (SPDT)
Relay type: Mechanically latching
Switching voltage: AC 250V / DC 30V
Switching power: 1250VA / 150W
Switching current: 5A
Switching rate max: 10/s
Mechanical life: 5 x 10⁷ switching operations
Electrical life: 105 switching operations at rated
current
Breakdown voltage: AC 1000V between open contacts
Isolation: AC 2500V surge system to contacts
Reset/Power down state: No change - last state is retained
The general specifications are as follows:
Operating temperature: (-20 to +70)°C
Storage temperature: (-30 to +80)°C
Relative air humidity: Maximum 95%, non-condensing
EMC - Immunity Interference: EN61000-4-2
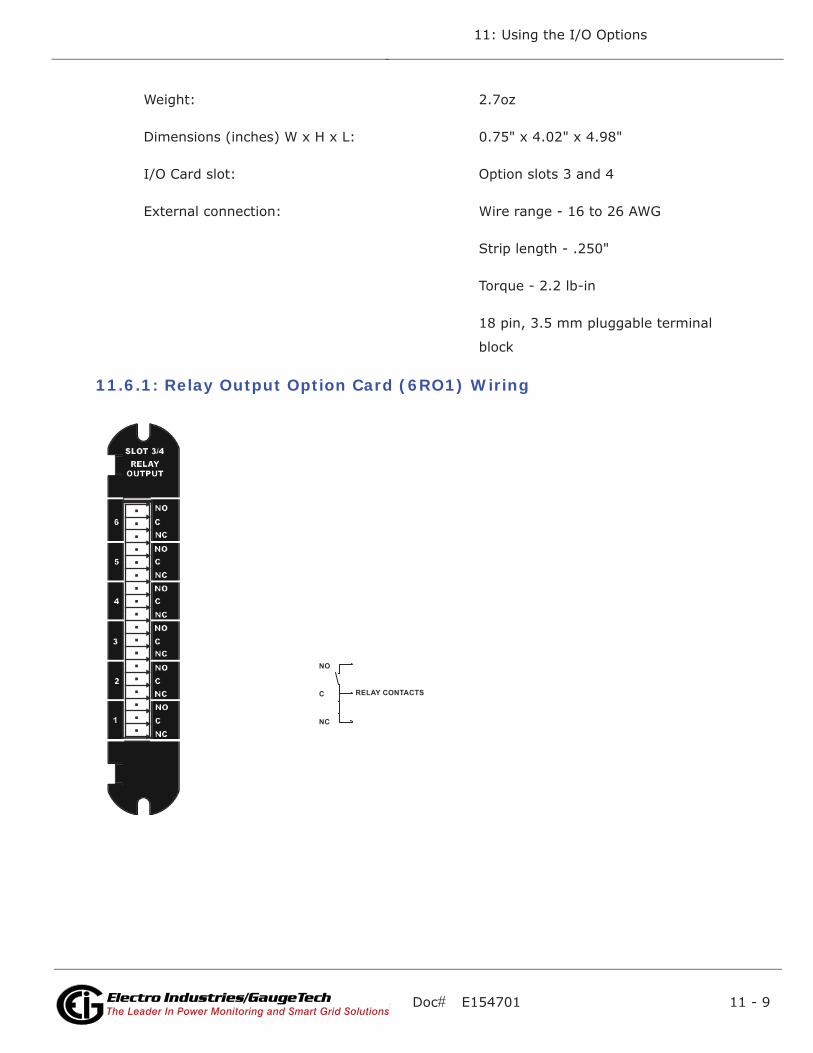
Doc# E154701 11 - 9
11: Using the I/O Options
Electro Industries/GaugeTechThe Leader In Power Monitoring and Smart Grid SolutionsElectro Industries/GaugeTechThe Leader In Power Monitoring and Smart Grid Solutions
Weight: 2.7oz
Dimensions (inches) W x H x L: 0.75" x 4.02" x 4.98"
I/O Card slot: Option slots 3 and 4
External connection: Wire range - 16 to 26 AWG
Strip length - .250"
Torque - 2.2 lb-in
18 pin, 3.5 mm pluggable terminal
block
11.6.1: Relay Output Option Card (6RO1) Wiring
NO
C
NC
RELAY CONTACTS
Doc# E154701 11 - 10
11: Using the I/O Options
Electro Industries/GaugeTechThe Leader In Power Monitoring and Smart Grid SolutionsElectro Industries/GaugeTechThe Leader In Power Monitoring and Smart Grid Solutions
11.7: Digital Input Option Card (16DI1)
The Digital Input Option card offers 16 wet/dry contact sensing digital inputs.
The technical specifications at 25°C are as follows:
Power consumption: 0.610W
Number of inputs: 16
Sensing type: Wet or dry contact status detection
Wetting voltage: DC (12-24)V, internally generated
Input current: 1.25mA - constant current
regulated
Minimum input voltage: 0V (input shorted to V-)
Maximum input voltage: DC 150V (diode protected against
polarity reversal)
Filtering: De-bouncing with 10ms delay time
Detection scan rate: 20ms
Isolation: AC 2500V system to inputs
The general specifications are as follows:
Operating temperature: (-20 to +70)°C
Storage temperature: (-30 to +80)°C
Relative air humidity: Maximum 95%, non-condensing
EMC - Immunity Interference: EN61000-4-2
Weight: 2.4oz
Dimensions (inches) W x H x L: 0.75" x 4.02" x 4.98"
I/O Card slot: Option slots 3 and 4
External connection: Wire range - 16 to 26 AWG
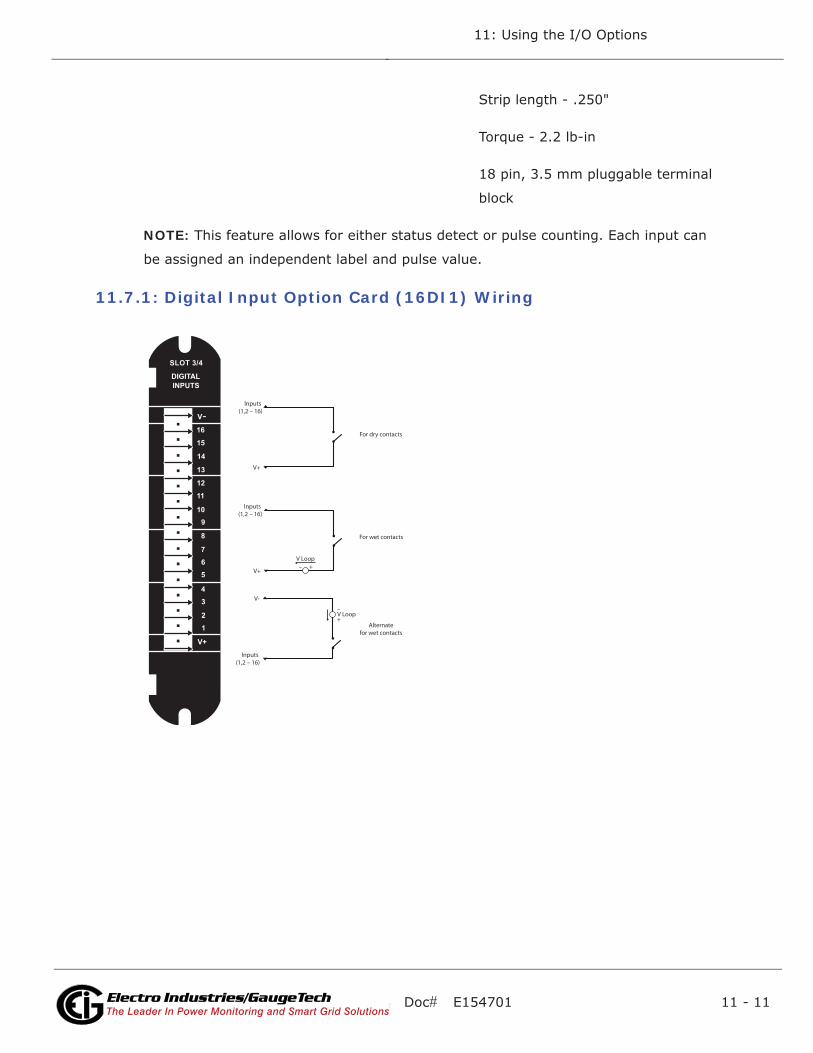
Doc# E154701 11 - 11
11: Using the I/O Options
Electro Industries/GaugeTechThe Leader In Power Monitoring and Smart Grid SolutionsElectro Industries/GaugeTechThe Leader In Power Monitoring and Smart Grid Solutions
Strip length - .250"
Torque - 2.2 lb-in
18 pin, 3.5 mm pluggable terminal
block
NOTE: This feature allows for either status detect or pulse counting. Each input can
be assigned an independent label and pulse value.
11.7.1: Digital Input Option Card (16DI1) Wiring
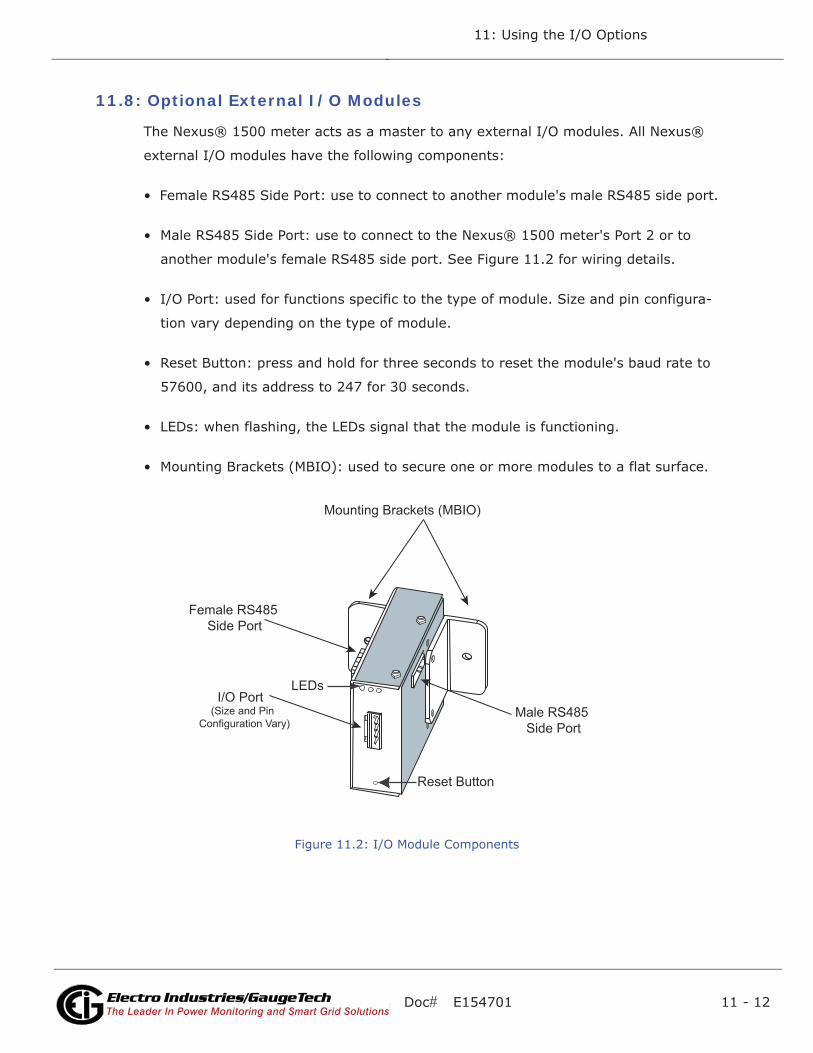
Doc# E154701 11 - 12
11: Using the I/O Options
Electro Industries/GaugeTechThe Leader In Power Monitoring and Smart Grid SolutionsElectro Industries/GaugeTechThe Leader In Power Monitoring and Smart Grid Solutions
11.8: Optional External I/O Modules
The Nexus® 1500 meter acts as a master to any external I/O modules. All Nexus®
external I/O modules have the following components:
• Female RS485 Side Port: use to connect to another module's male RS485 side port.
• Male RS485 Side Port: use to connect to the Nexus® 1500 meter's Port 2 or to
another module's female RS485 side port. See Figure 11.2 for wiring details.
• I/O Port: used for functions specific to the type of module. Size and pin configura-
tion vary depending on the type of module.
• Reset Button: press and hold for three seconds to reset the module's baud rate to
57600, and its address to 247 for 30 seconds.
• LEDs: when flashing, the LEDs signal that the module is functioning.
• Mounting Brackets (MBIO): used to secure one or more modules to a flat surface.
Figure 11.2: I/O Module Components
Mounting Brackets (MBIO)
Male RS485 Side Port
Female RS485 Side Port
I/O Port (Size and PinConfiguration Vary)
Reset Button
LEDs
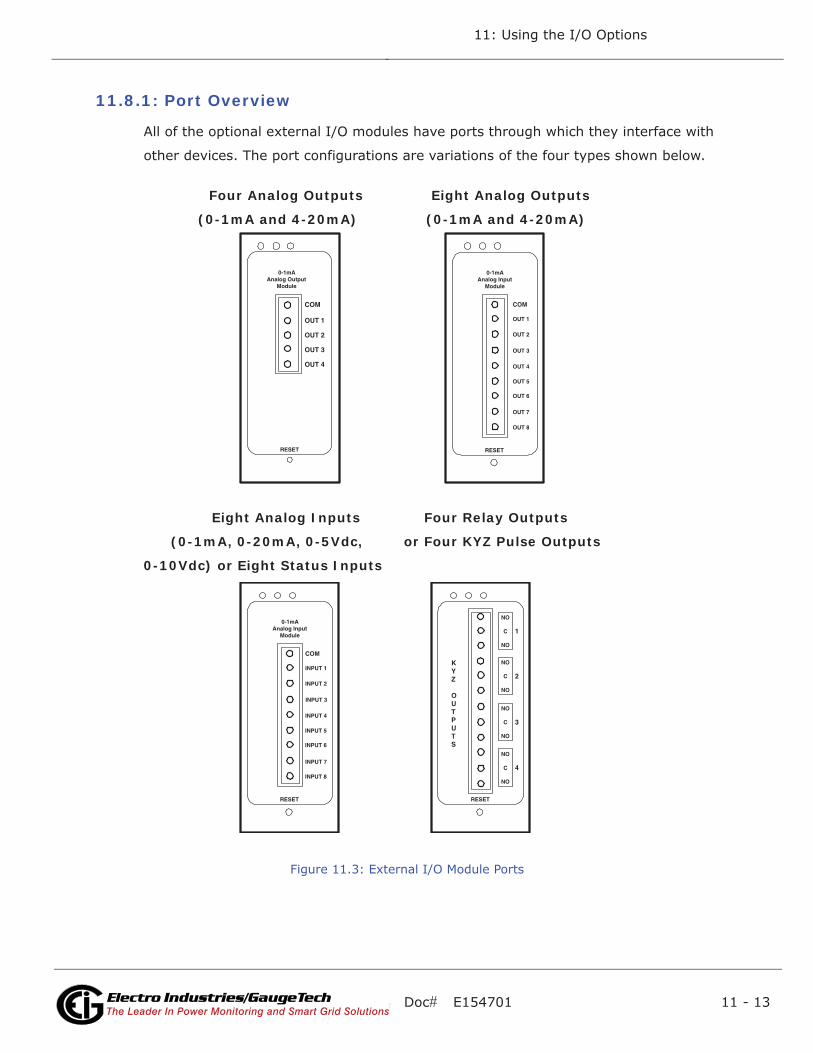
Doc# E154701 11 - 13
11: Using the I/O Options
Electro Industries/GaugeTechThe Leader In Power Monitoring and Smart Grid SolutionsElectro Industries/GaugeTechThe Leader In Power Monitoring and Smart Grid Solutions
11.8.1: Port Overview
All of the optional external I/O modules have ports through which they interface with
other devices. The port configurations are variations of the four types shown below.
Four Analog Outputs Eight Analog Outputs
(0-1mA and 4-20mA) (0-1mA and 4-20mA)
Eight Analog Inputs Four Relay Outputs
(0-1mA, 0-20mA, 0-5Vdc, or Four KYZ Pulse Outputs
0-10Vdc) or Eight Status Inputs
Figure 11.3: External I/O Module Ports
RESET
COM
OUT 1
OUT 2
OUT 3
OUT 4
0-1mAAnalog Input
Module
OUT 5
OUT 6
OUT 7
OUT 8
RESET
COM
OUT 1
OUT 2
OUT 3
OUT 4
0-1mAAnalog Output
Module
RESET
COM
INPUT 1
INPUT 2
INPUT 3
INPUT 4
0-1mAAnalog Input
Module
INPUT 5
INPUT 6
INPUT 7
INPUT 8
RESET
NO
1C
NO
NO
2
KYZ
OUTPUTS
C
NO
NO
3C
NO
NO
4C
NO
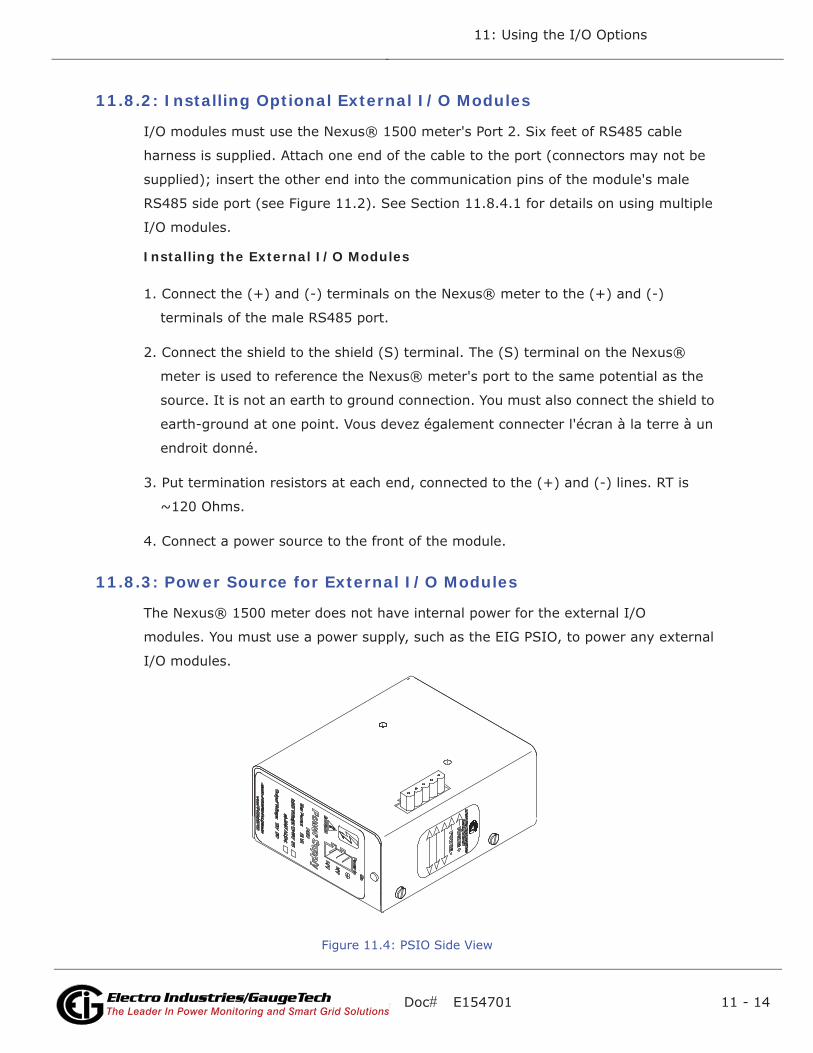
Doc# E154701 11 - 14
11: Using the I/O Options
Electro Industries/GaugeTechThe Leader In Power Monitoring and Smart Grid SolutionsElectro Industries/GaugeTechThe Leader In Power Monitoring and Smart Grid Solutions
11.8.2: Installing Optional External I/O Modules
I/O modules must use the Nexus® 1500 meter's Port 2. Six feet of RS485 cable
harness is supplied. Attach one end of the cable to the port (connectors may not be
supplied); insert the other end into the communication pins of the module's male
RS485 side port (see Figure 11.2). See Section 11.8.4.1 for details on using multiple
I/O modules.
Installing the External I/O Modules
1. Connect the (+) and (-) terminals on the Nexus® meter to the (+) and (-)
terminals of the male RS485 port.
2. Connect the shield to the shield (S) terminal. The (S) terminal on the Nexus®
meter is used to reference the Nexus® meter's port to the same potential as the
source. It is not an earth to ground connection. You must also connect the shield to
earth-ground at one point. Vous devez également connecter l'écran à la terre à un
endroit donné.
3. Put termination resistors at each end, connected to the (+) and (-) lines. RT is
~120 Ohms.
4. Connect a power source to the front of the module.
11.8.3: Power Source for External I/O Modules
The Nexus® 1500 meter does not have internal power for the external I/O
modules. You must use a power supply, such as the EIG PSIO, to power any external
I/O modules.
Figure 11.4: PSIO Side View
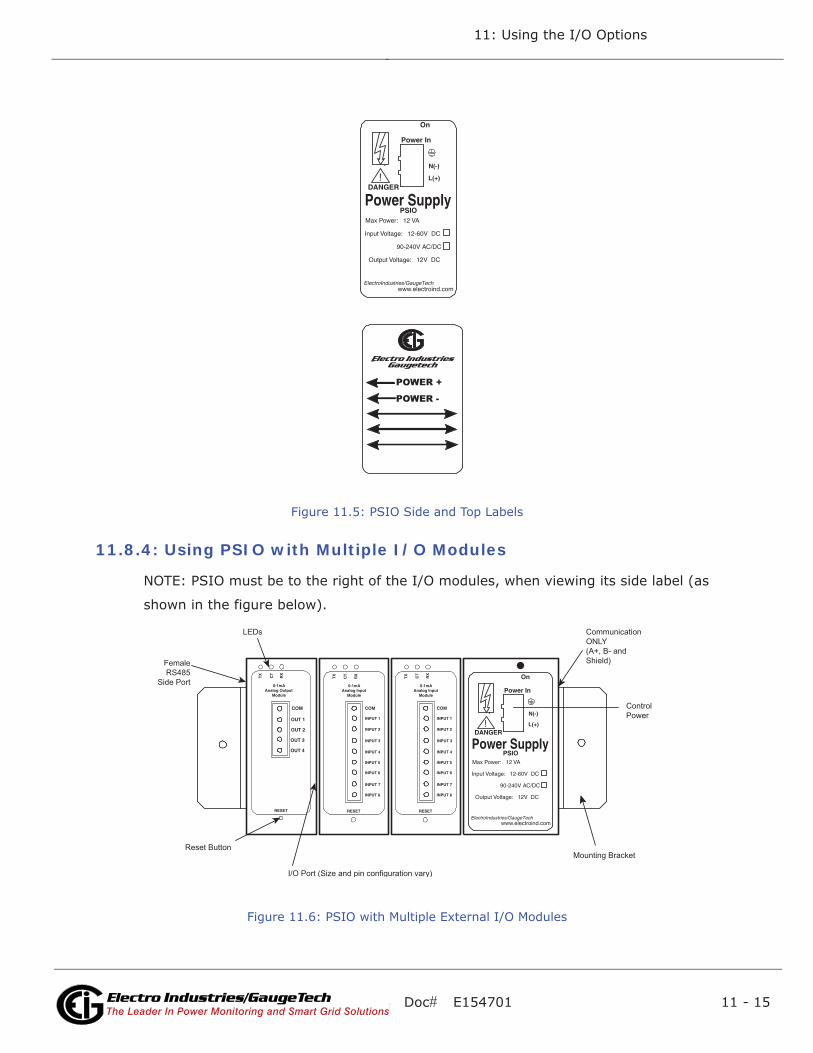
Doc# E154701 11 - 15
11: Using the I/O Options
Electro Industries/GaugeTechThe Leader In Power Monitoring and Smart Grid SolutionsElectro Industries/GaugeTechThe Leader In Power Monitoring and Smart Grid Solutions
Figure 11.5: PSIO Side and Top Labels
11.8.4: Using PSIO with Multiple I/O Modules
NOTE: PSIO must be to the right of the I/O modules, when viewing its side label (as
shown in the figure below).
Figure 11.6: PSIO with Multiple External I/O Modules
POWER +
POWER -
!DANGER
On
L(+)
Power Supply
PSIO Max Power: 12 VA
Input Voltage: 12-60V DC
www.electroind.com
Output Voltage: 12V DC
ElectroIndustries/GaugeTech
90-240V AC/DC
N(-)
Power In
!DANGER
On
L(+)
Power Supply
PSIO Max Power: 12 VA
Input Voltage: 12-60V DC
www.electroind.com
Output Voltage: 12V DC
ElectroIndustries/GaugeTech
90-240V AC/DC
N(-)
Power In
RESET
COM INPUT 1
INPUT 2
INPUT 3
INPUT 4
0-1mA Analog Input
Module
INPUT 5 INPUT 6
INPUT 7 INPUT 8
RESET
COM INPUT 1
INPUT 2
INPUT 3
INPUT 4
0-1mA Analog Input
Module
INPUT 5 INPUT 6
INPUT 7 INPUT 8
RESET
COM OUT 1 OUT 2 OUT 3 OUT 4
TX
R
X
CT
0-1mA Analog Output
Module
RX
R
X
CT
C
T
TX
T
X
Reset Button
I/O Port (Size and pin configuration vary)
LEDs Communication ONLY (A+, B- and Shield) Female
RS485 Side Port
Control Power
Mounting Bracket
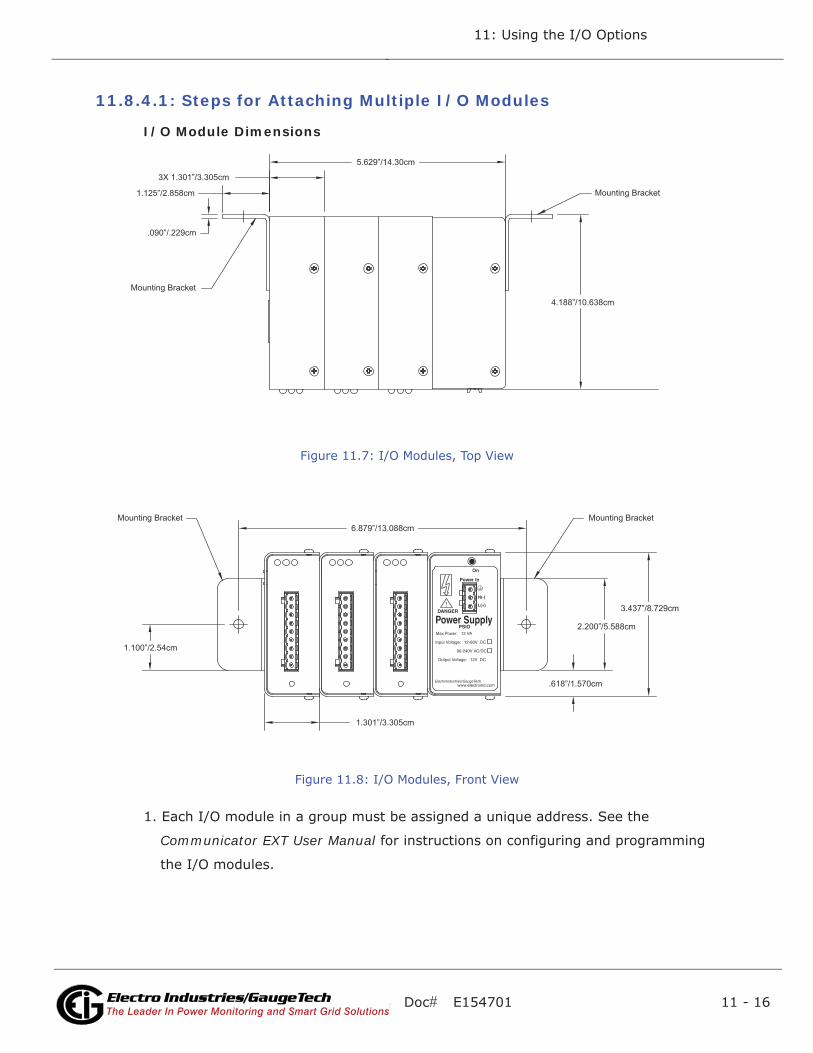
Doc# E154701 11 - 16
11: Using the I/O Options
Electro Industries/GaugeTechThe Leader In Power Monitoring and Smart Grid SolutionsElectro Industries/GaugeTechThe Leader In Power Monitoring and Smart Grid Solutions
11.8.4.1: Steps for Attaching Multiple I/O Modules
I/O Module Dimensions
Figure 11.7: I/O Modules, Top View
Figure 11.8: I/O Modules, Front View
1. Each I/O module in a group must be assigned a unique address. See the
Communicator EXT User Manual for instructions on configuring and programming
the I/O modules.
Mounting Bracket
Mounting Bracket
5.629”/14.30cm
4.188”/10.638cm
.090”/.229cm
3X 1.301”/3.305cm
1.125”/2.858cm
Mounting Bracket6.879”/13.088cm
1.100”/2.54cm
1.301”/3.305cm
.618”/1.570cm
2.200”/5.588cm
3.437”/8.729cm
Mounting Bracket
Doc# E154701 11 - 17
11: Using the I/O Options
Electro Industries/GaugeTechThe Leader In Power Monitoring and Smart Grid SolutionsElectro Industries/GaugeTechThe Leader In Power Monitoring and Smart Grid Solutions
2. Starting with the left module and using a slotted screwdriver, fasten the first I/O
module to the left mounting bracket. The left mounting bracket is the one with the
PEM. Fasten the internal screw tightly into the left mounting bracket.
3. Slide the female RS485 port into the male RS485 side port to connect the next
I/O module to the left module. Fasten together enough to grab but do not tighten,
yet.
4. Combine the modules together, one by one.
5. Attach a PSIO (power supply) to the right of each group of I/O modules it is supply-
ing with power (see Figure 11.6). The PSIO supplies 12VA at 125V AC/DC. See
sections 11.8.6 - 11.8.8 for I/O modules power requirements.
6. Once you have combined all of the I/O modules together for the group, fasten them
tightly. This final tightening locks the group together as a unit.
7. Attach the right mounting bracket to the right side of the group using the small
Phillips Head screws provided.
8. Mount the attached group of modules on a secure, flat surface. This insures that all
modules stay securely connected.
11.8.5: Factory Settings and Reset Button
Factory Settings
All external I/O modules are shipped with a preset address and a baud rate of 57600.
See following sections for I/O Module addresses.
Reset Button:
If there is a communication problem or if you are unsure of a module's address and
baud rate, press and hold the Reset button for 3 seconds; the module resets to a
default address of 247 at 57600 baud rate for 30 seconds.
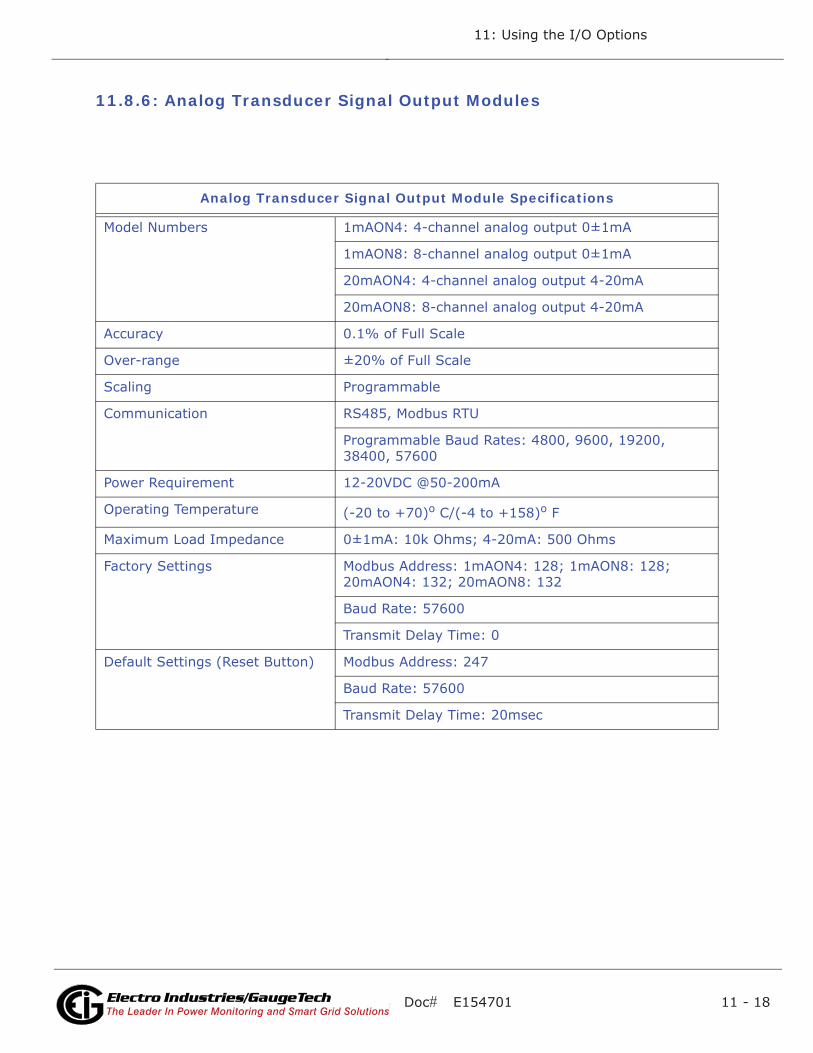
Doc# E154701 11 - 18
11: Using the I/O Options
Electro Industries/GaugeTechThe Leader In Power Monitoring and Smart Grid SolutionsElectro Industries/GaugeTechThe Leader In Power Monitoring and Smart Grid Solutions
11.8.6: Analog Transducer Signal Output Modules
Table 1:
Analog Transducer Signal Output Module Specifications
Model Numbers 1mAON4: 4-channel analog output 0±1mA
1mAON8: 8-channel analog output 0±1mA
20mAON4: 4-channel analog output 4-20mA
20mAON8: 8-channel analog output 4-20mA
Accuracy 0.1% of Full Scale
Over-range ±20% of Full Scale
Scaling Programmable
Communication RS485, Modbus RTU
Programmable Baud Rates: 4800, 9600, 19200, 38400, 57600
Power Requirement 12-20VDC @50-200mA
Operating Temperature (-20 to +70)o C/(-4 to +158)o F
Maximum Load Impedance 0±1mA: 10k Ohms; 4-20mA: 500 Ohms
Factory Settings Modbus Address: 1mAON4: 128; 1mAON8: 128; 20mAON4: 132; 20mAON8: 132
Baud Rate: 57600
Transmit Delay Time: 0
Default Settings (Reset Button) Modbus Address: 247
Baud Rate: 57600
Transmit Delay Time: 20msec
Doc# E154701 11 - 19
11: Using the I/O Options
Electro Industries/GaugeTechThe Leader In Power Monitoring and Smart Grid SolutionsElectro Industries/GaugeTechThe Leader In Power Monitoring and Smart Grid Solutions
11.8.6.1: Overview
The Analog Transducer Signal Output modules (0±1mA or 4-20mA) are available in
either a 4- or 8-channel configuration. Maximum registers per request, read or write,
is 17 registers.
All outputs share a single common point. This is also an isolated connection (from
ground).
11.8.6.2: Normal Mode
Normal mode is the same for the 0-1mA and the 4-20mA Analog Output modules
except for the number of processes performed by the modules.
Both devices:
1. Accept new values through communication
2. Output current loops scaled from previously accepted values
The 0-1mA module includes one more process in its Normal mode:
3. Reads and averages the A/D and adjust values for Process 2, above
The device operates with the following default parameters:
Address 247 (F7H)
Baud Rate 57600 Baud
Transmit Delay Time 20msec
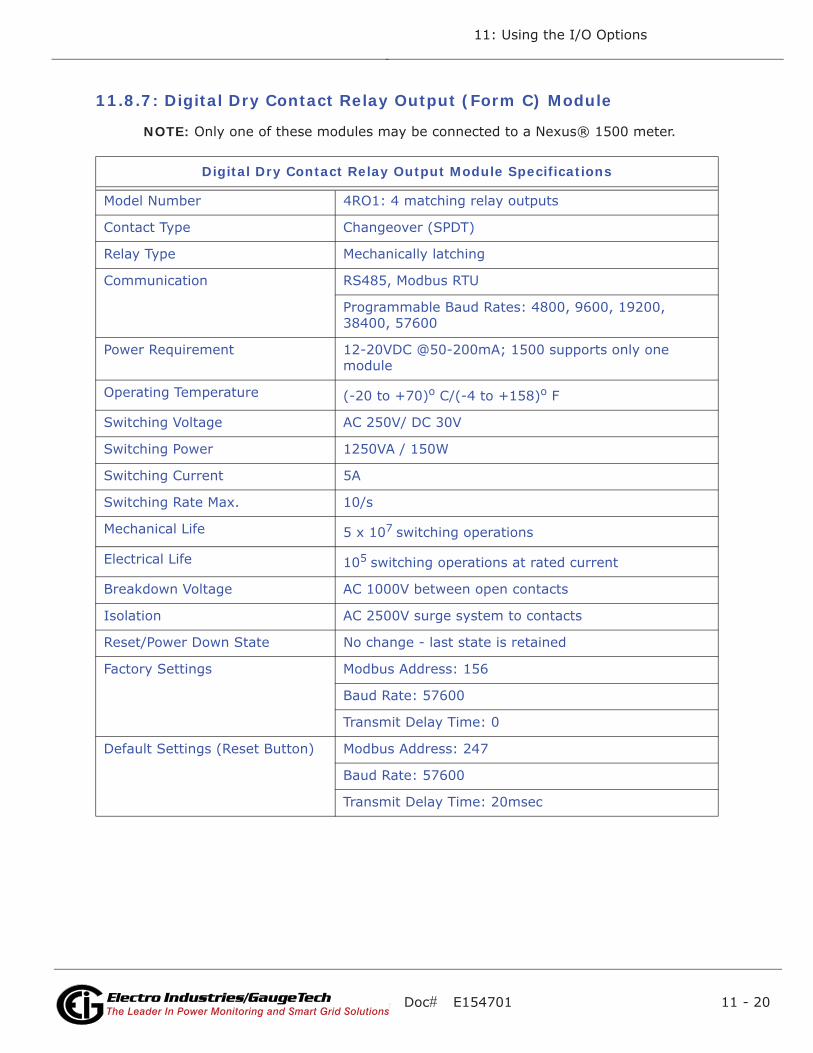
Doc# E154701 11 - 20
11: Using the I/O Options
Electro Industries/GaugeTechThe Leader In Power Monitoring and Smart Grid SolutionsElectro Industries/GaugeTechThe Leader In Power Monitoring and Smart Grid Solutions
11.8.7: Digital Dry Contact Relay Output (Form C) Module
NOTE: Only one of these modules may be connected to a Nexus® 1500 meter.
Digital Dry Contact Relay Output Module Specifications
Model Number 4RO1: 4 matching relay outputs
Contact Type Changeover (SPDT)
Relay Type Mechanically latching
Communication RS485, Modbus RTU
Programmable Baud Rates: 4800, 9600, 19200, 38400, 57600
Power Requirement 12-20VDC @50-200mA; 1500 supports only one module
Operating Temperature (-20 to +70)o C/(-4 to +158)o F
Switching Voltage AC 250V/ DC 30V
Switching Power 1250VA / 150W
Switching Current 5A
Switching Rate Max. 10/s
Mechanical Life 5 x 10⁷ switching operations
Electrical Life 105 switching operations at rated current
Breakdown Voltage AC 1000V between open contacts
Isolation AC 2500V surge system to contacts
Reset/Power Down State No change - last state is retained
Factory Settings Modbus Address: 156
Baud Rate: 57600
Transmit Delay Time: 0
Default Settings (Reset Button) Modbus Address: 247
Baud Rate: 57600
Transmit Delay Time: 20msec
Doc# E154701 11 - 21
11: Using the I/O Options
Electro Industries/GaugeTechThe Leader In Power Monitoring and Smart Grid SolutionsElectro Industries/GaugeTechThe Leader In Power Monitoring and Smart Grid Solutions
11.8.7.1: Overview
The Relay Output module consists of four latching relay outputs. In Normal mode, the
device accepts commands to control the relays. Relay Output modules are
triggered by limits programmed with the Communicator EXT software. See the
Communicator EXT User Manual for details on programming limits.
Each latching relay will hold its state in the event of a power loss.
11.8.7.2: Communication
Maximum registers per request, read or write, is 4 registers.
The device operates with the following default parameters:
Address 247 (F7H)
Baud Rate 57600 Baud
Transmit Delay Time 20msec
11.8.7.3: Normal Mode
Normal mode consists of one process: the device accepts new commands to control
the relays.
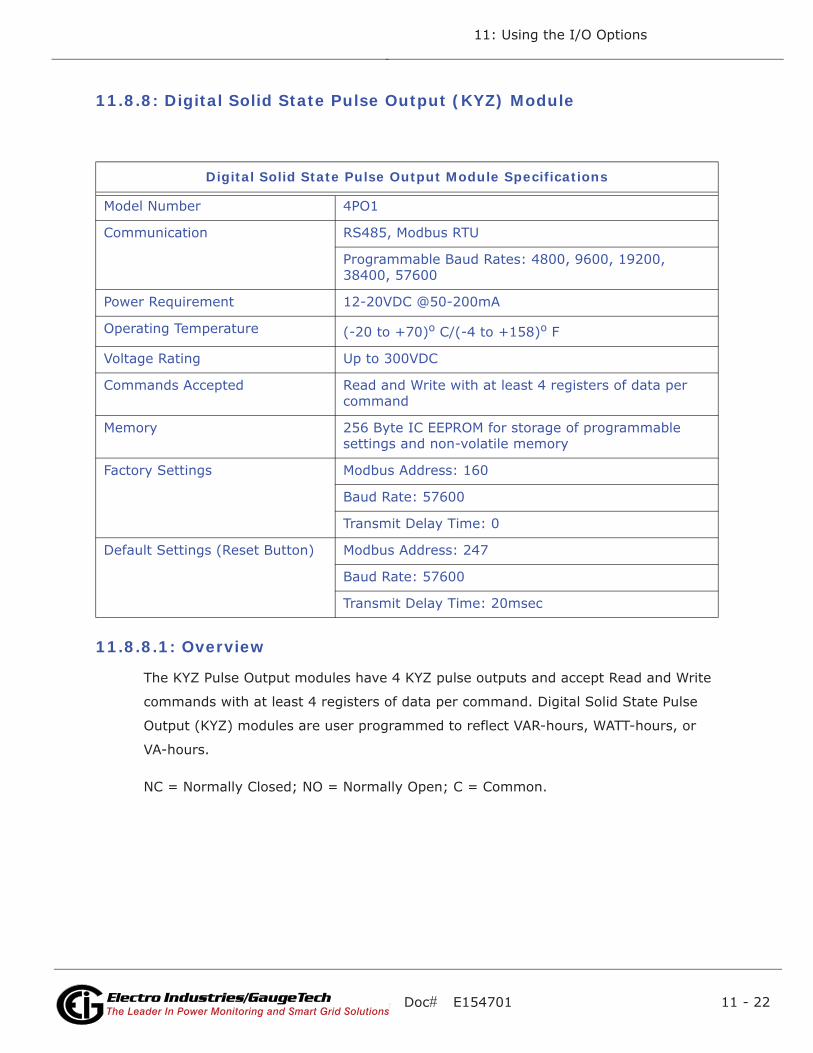
Doc# E154701 11 - 22
11: Using the I/O Options
Electro Industries/GaugeTechThe Leader In Power Monitoring and Smart Grid SolutionsElectro Industries/GaugeTechThe Leader In Power Monitoring and Smart Grid Solutions
11.8.8: Digital Solid State Pulse Output (KYZ) Module
11.8.8.1: Overview
The KYZ Pulse Output modules have 4 KYZ pulse outputs and accept Read and Write
commands with at least 4 registers of data per command. Digital Solid State Pulse
Output (KYZ) modules are user programmed to reflect VAR-hours, WATT-hours, or
VA-hours.
NC = Normally Closed; NO = Normally Open; C = Common.
Digital Solid State Pulse Output Module Specifications
Model Number 4PO1
Communication RS485, Modbus RTU
Programmable Baud Rates: 4800, 9600, 19200, 38400, 57600
Power Requirement 12-20VDC @50-200mA
Operating Temperature (-20 to +70)o C/(-4 to +158)o F
Voltage Rating Up to 300VDC
Commands Accepted Read and Write with at least 4 registers of data per command
Memory 256 Byte IC EEPROM for storage of programmable settings and non-volatile memory
Factory Settings Modbus Address: 160
Baud Rate: 57600
Transmit Delay Time: 0
Default Settings (Reset Button) Modbus Address: 247
Baud Rate: 57600
Transmit Delay Time: 20msec
Doc# E154701 11 - 23
11: Using the I/O Options
Electro Industries/GaugeTechThe Leader In Power Monitoring and Smart Grid SolutionsElectro Industries/GaugeTechThe Leader In Power Monitoring and Smart Grid Solutions
11.8.8.2: Communication
Maximum registers per request, read or write, is 4 registers.
The device operates with the following default parameters:
Address 247 (F7H)
Baud Rate 57600 Baud
Transmit Delay Time 20msec
11.8.8.3: Normal Mode
Energy readings are given to the device frequently. The device generates a pulse at
each channel after a certain energy increase.
Normal operation consists of three processes:
1. The first process accepts writes to registers 04097 - 04112. Writes can be up to
four registers long and should end on the fourth register of a group (register
04100, or registers 04103-04112 or registers 04109-04112). These writes can be
interpreted as two-byte, four-byte, six-byte or eight-byte energy readings. The
reception of the first value for a given channel provides the initial value for that
channel. Subsequent writes will increment the residual for that channel by the dif-
ference of the old value and the new value. The previous value is then replaced
with the new value. Attempting to write a value greater than the programmed roll-
over value for a given channel is completely ignored and no registers are modified.
If the difference is greater than half of the programmed rollover value for a given
channel, the write does not increment the residual but does update the last value.
Overflow of the residual is not prevented.
2. The second process occurs in the main loop and attempts to decrement the
residual by the programmed Energy/Pulse value. If the residual is greater than the
programmed Energy/Pulse value and the Pending Pulses value for that channel has
not reached the maximum limit, then residual is decremented appropriately and
the Pending Pulses value is incremented by two, signifying two more transitions
and one more pulse.
3. The third process runs from a timer that counts off pulse widths from the
Programmable Minimum Pulse Width values. If there are pulses pending for a
Doc# E154701 11 - 24
11: Using the I/O Options
Electro Industries/GaugeTechThe Leader In Power Monitoring and Smart Grid SolutionsElectro Industries/GaugeTechThe Leader In Power Monitoring and Smart Grid Solutions
channel and the delay has passed, then the Pending Pulses value is decremented
for that channel and the output relay is toggled.
Operation Indicator (0000H = OK, 1000H = Problem):
Bit 1: 1 = EEPROM Failure
Bit 2: 1 = Checksum for Communications settings bad
Bit 3: 1 = Checksum for Programmable settings bad
Bit 4: 1 = 1 or more Communications settings are
invalid
Bit 5: 1 = 1 or more Programmable settings are
invalid
Bit 6: 1 = 1 or more Programmable settings have been
modified
Bit 7: 1 = Forced default by reset value
Bit 15: 1 = Normal operation of the device is disabled
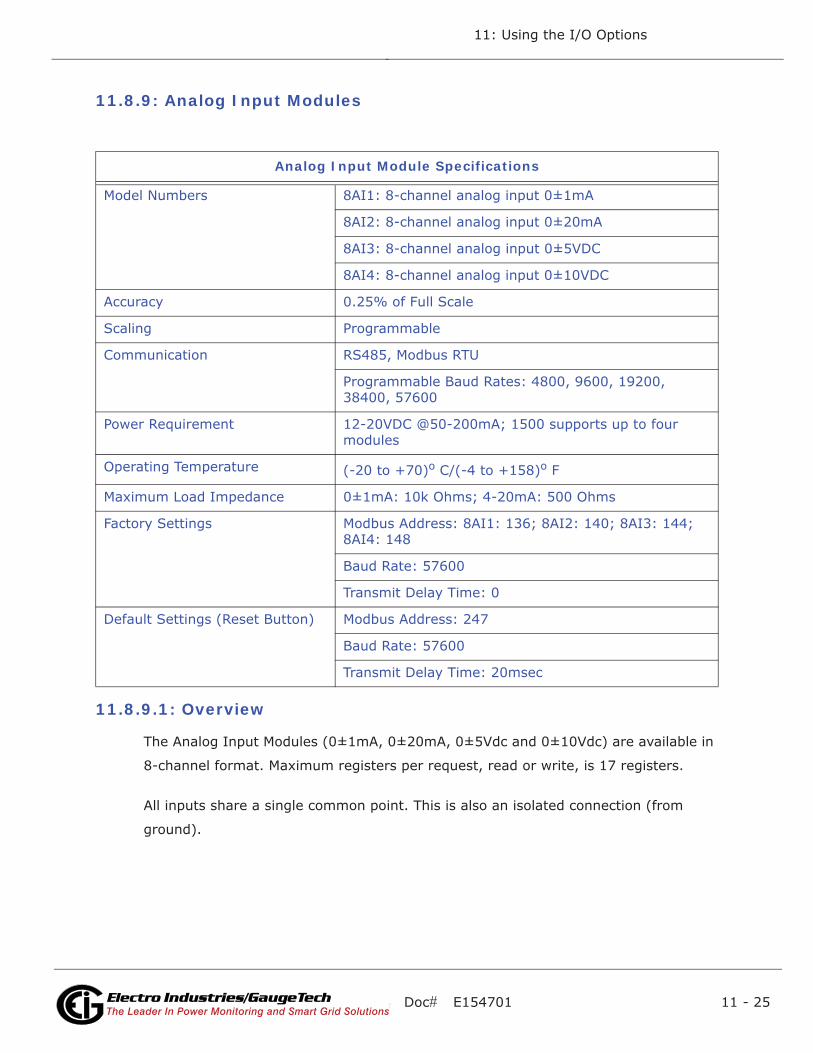
Doc# E154701 11 - 25
11: Using the I/O Options
Electro Industries/GaugeTechThe Leader In Power Monitoring and Smart Grid SolutionsElectro Industries/GaugeTechThe Leader In Power Monitoring and Smart Grid Solutions
11.8.9: Analog Input Modules
11.8.9.1: Overview
The Analog Input Modules (0±1mA, 0±20mA, 0±5Vdc and 0±10Vdc) are available in
8-channel format. Maximum registers per request, read or write, is 17 registers.
All inputs share a single common point. This is also an isolated connection (from
ground).
Table 2:
Analog Input Module Specifications
Model Numbers 8AI1: 8-channel analog input 0±1mA
8AI2: 8-channel analog input 0±20mA
8AI3: 8-channel analog input 0±5VDC
8AI4: 8-channel analog input 0±10VDC
Accuracy 0.25% of Full Scale
Scaling Programmable
Communication RS485, Modbus RTU
Programmable Baud Rates: 4800, 9600, 19200, 38400, 57600
Power Requirement 12-20VDC @50-200mA; 1500 supports up to four modules
Operating Temperature (-20 to +70)o C/(-4 to +158)o F
Maximum Load Impedance 0±1mA: 10k Ohms; 4-20mA: 500 Ohms
Factory Settings Modbus Address: 8AI1: 136; 8AI2: 140; 8AI3: 144; 8AI4: 148
Baud Rate: 57600
Transmit Delay Time: 0
Default Settings (Reset Button) Modbus Address: 247
Baud Rate: 57600
Transmit Delay Time: 20msec
Doc# E154701 11 - 26
11: Using the I/O Options
Electro Industries/GaugeTechThe Leader In Power Monitoring and Smart Grid SolutionsElectro Industries/GaugeTechThe Leader In Power Monitoring and Smart Grid Solutions
11.8.9.2: Normal Mode
In Normal Mode, the Input Module:
1. Reads and averages the A/D and adjusts values for process 2.
2. Calculates the percentage of Input Value.
NOTE: The percentage value of the Input is stored in Input Value Registers (Registers
04097-04104).
The device operates with the following default parameters:
Address: 247 (F7H)
Baud Rate: 57600 Baud
Transmit Delay Time: 20 msec
Doc# E154701 11 - 27
11: Using the I/O Options
Electro Industries/GaugeTechThe Leader In Power Monitoring and Smart Grid SolutionsElectro Industries/GaugeTechThe Leader In Power Monitoring and Smart Grid Solutions
11.9: Additional External I/O Module Specifications
Analog Transducer Signal Outputs (Up to four modules can be used.)
1mAON4: 4 Analog Outputs, scalable, bidirectional
1mAON8: 8 Analog Outputs, scalable, bidirectional
20mAON4: 4 Analog Outputs, scalable
20mAON8: 8 Analog Outputs, scalable
Digital Dry Contact Relay Outputs (One module can be used.)
4RO1: 4 Relay Outputs 10 Amps, 125Vac, 30Vdc, Form C
Digital Solid State Pulse Outputs (Up to four modules can be used.)
4PO1: 4 Solid State Pulse Outputs, Form A KYZ pulses
Analog Transducer Inputs (Up to four modules can be used.)
• 8AI1: 8 Analog Inputs 0–1mA, scalable and bidirectional
• 8AI2: 8 Analog Inputs 0–20mA, scalable
• 8AI3: 8 Analog Inputs 0–5V DC, scalable
• 8AI4: 8 Analog Inputs 0–10V DC, scalable
Other I/O Module Accessories
MBIO: Bracket for surface-mounting external I/O modules to any enclosure
PSIO: 12V external power supply, which is necessary whenever you are connecting an
external I/O module to a Nexus® 1500 meter.

Doc# E154701 11 - 28
11: Using the I/O Options
Electro Industries/GaugeTechThe Leader In Power Monitoring and Smart Grid SolutionsElectro Industries/GaugeTechThe Leader In Power Monitoring and Smart Grid Solutions
This page intentionally left blank.

Doc# E154701 A - 1
A: Installing the USB Virtual Com Port
Electro Industries/GaugeTechThe Leader In Power Monitoring and Smart Grid SolutionsElectro Industries/GaugeTechThe Leader In Power Monitoring and Smart Grid Solutions
A: Installing the USB Virtual Comm Port
A.1: Introduction
As mentioned in Chapter 5, EIG provides a driver (for operating systems earlier than
Windows® 7) that allows you to configure the Nexus® 1500 meter's USB port as a
Virtual Serial port. The driver is on the CD that came with your meter. Follow the
instructions in this chapter to install the driver and connect to the meter's Virtual port.
A.2: Installing the Virtual Port's Driver
1. Insert the Nexus® Meter Series CD into your PC's CD drive. The screen shown
below opens in your Browser.
2. Click the Nexus® Technical Documents button. The following screen opens in
your browser.
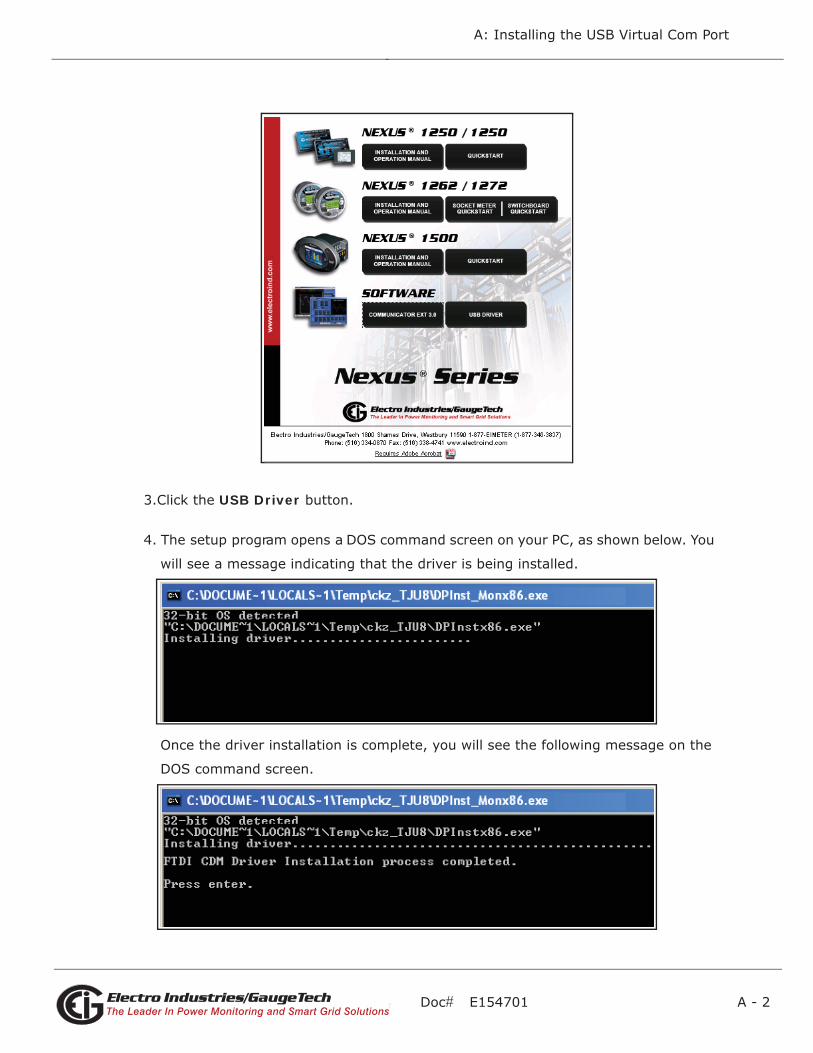
Doc# E154701 A - 2
A: Installing the USB Virtual Com Port
Electro Industries/GaugeTechThe Leader In Power Monitoring and Smart Grid SolutionsElectro Industries/GaugeTechThe Leader In Power Monitoring and Smart Grid Solutions
3.Click the USB Driver button.
4. The setup program opens a DOS command screen on your PC, as shown below. You
will see a message indicating that the driver is being installed.
Once the driver installation is complete, you will see the following message on the
DOS command screen.
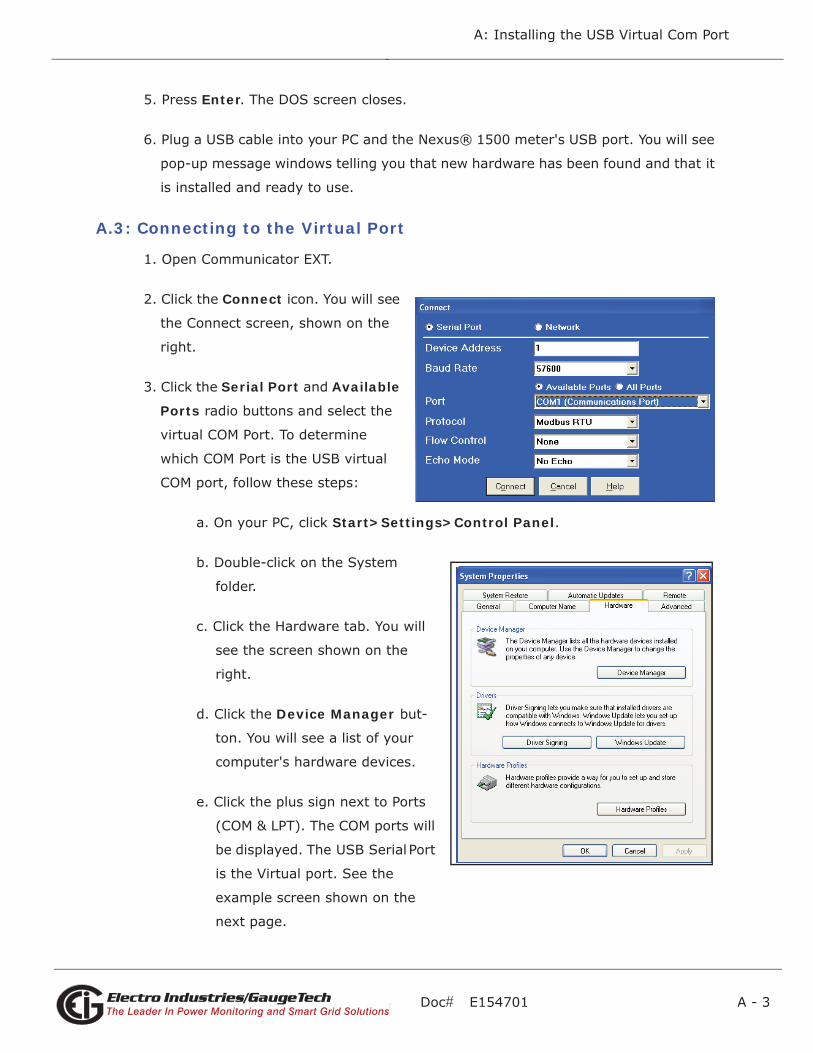
Doc# E154701 A - 3
A: Installing the USB Virtual Com Port
Electro Industries/GaugeTechThe Leader In Power Monitoring and Smart Grid SolutionsElectro Industries/GaugeTechThe Leader In Power Monitoring and Smart Grid Solutions
5. Press Enter. The DOS screen closes.
6. Plug a USB cable into your PC and the Nexus® 1500 meter's USB port. You will see
pop-up message windows telling you that new hardware has been found and that it
is installed and ready to use.
A.3: Connecting to the Virtual Port
1. Open Communicator EXT.
2. Click the Connect icon. You will see
the Connect screen, shown on the
right.
3. Click the Serial Port and Available
Ports radio buttons and select the
virtual COM Port. To determine
which COM Port is the USB virtual
COM port, follow these steps:
a. On your PC, click Start>Settings>Control Panel.
b. Double-click on the System
folder.
c. Click the Hardware tab. You will
see the screen shown on the
right.
d. Click the Device Manager but-
ton. You will see a list of your
computer's hardware devices.
e. Click the plus sign next to Ports
(COM & LPT). The COM ports will
be displayed. The USB Serial Port
is the Virtual port. See the
example screen shown on the
next page.
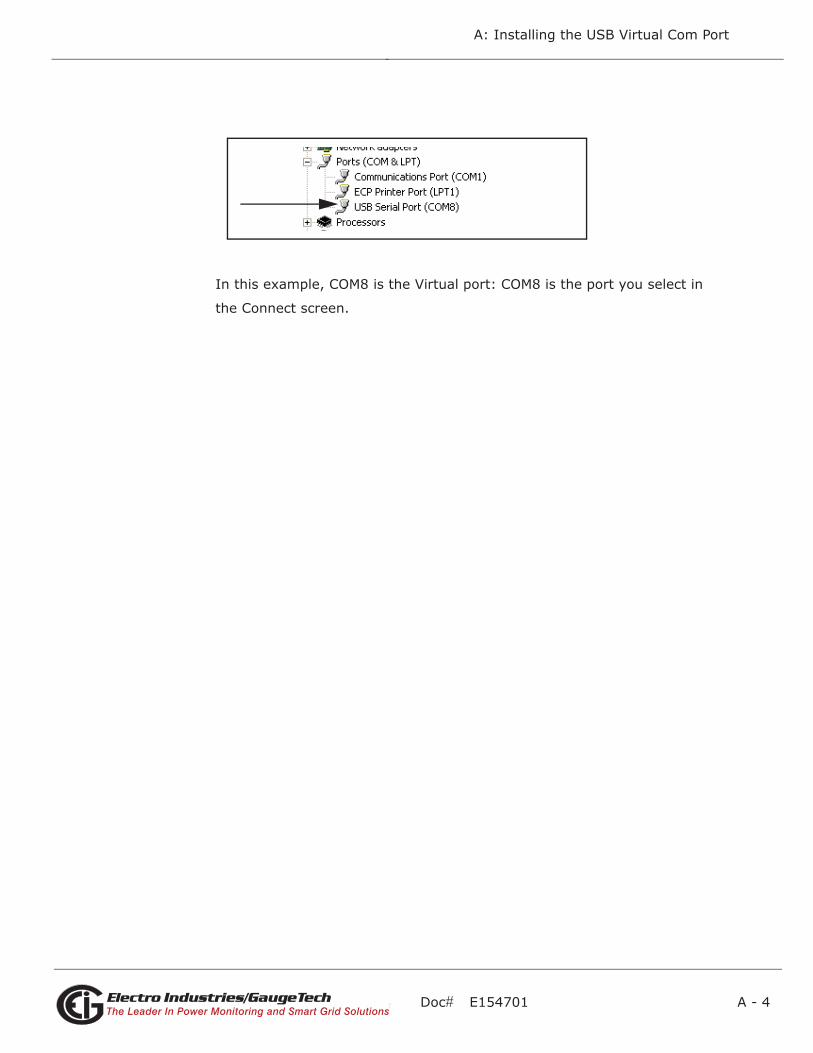
Doc# E154701 A - 4
A: Installing the USB Virtual Com Port
Electro Industries/GaugeTechThe Leader In Power Monitoring and Smart Grid SolutionsElectro Industries/GaugeTechThe Leader In Power Monitoring and Smart Grid Solutions
In this example, COM8 is the Virtual port: COM8 is the port you select in
the Connect screen.

Doc# E154701 B - 1
B: Power Supply Options
Electro Industries/GaugeTechThe Leader In Power Monitoring and Smart Grid SolutionsElectro Industries/GaugeTechThe Leader In Power Monitoring and Smart Grid Solutions
B: Power Supply OptionsThe Nexus® 1500 meter offers the following power supply options:
Option Description
115AC UL Rated AC Power Supply (100-240)VAC
D2 UL Rated High-Voltage DC (100-240)VDC, (90-265)VAC

Doc# E154701 B - 2
B: Power Supply Options
Electro Industries/GaugeTechThe Leader In Power Monitoring and Smart Grid SolutionsElectro Industries/GaugeTechThe Leader In Power Monitoring and Smart Grid Solutions
This page intentionally left blank.
Doc# E154701 C - 1
C: Using the IEC61850 Protocol Ethernet Network Server
Electro Industries/GaugeTechThe Leader In Power Monitoring and Smart Grid SolutionsElectro Industries/GaugeTechThe Leader In Power Monitoring and Smart Grid Solutions
C: Using the IEC 61850 Protocol Ethernet Network Server
C.1: Overview of IEC 61850
With V-SwitchTM keys 2 and 3, the Nexus® 1500 meter’s Main Network card has the
ability to function as an IEC 61850 Protocol Ethernet Network server. With the IEC
61850 Protocol Ethernet Network server added to the Nexus® 1500 meter, the unit
becomes an advanced intelligent Device that can be networked on a IEC 61850 stan-
dard network within an electrical distribution system.
IEC 61850 is a standard for the design of electrical substation automation, including
the networking of substation devices. The IEC 61850 standard is part of the Interna-
tional Electrotechnical Commission's (IEC) Technical Committee 57 (TC57). It consists
of a suite of protocols (MMS, SMV, etc.) and abstract definitions that provide a stan-
dardized method of communication and integration to support intelligent electronic
devices from any vendor, networked together to perform protection, monitoring,
automation, metering and control in a substation environment. For more information
on IEC 61850 go to http://iec61850.ucaiug.org/.
IEC 61850 was developed to:
• Specify a design methodology for automation system construction.
• Reduce the effort for users to construct automation systems using devices from
multiple vendors.
• Assure interoperability between components within the automation system.
• “Future-proof” the system by providing simple upgrade paths as the underlying
technologies change.
• Communicate information rather than data that requires further processing. The
functionality of the components is moved away from the clients (requesters)
toward the servers (responders).
IEC 61850 differs from previous standards in that:
• It specifies all aspects of the automation system from system specifications,
through device specifications, and then through the testing regime.
Doc# E154701 C - 2
C: Using the IEC61850 Protocol Ethernet Network Server
Electro Industries/GaugeTechThe Leader In Power Monitoring and Smart Grid SolutionsElectro Industries/GaugeTechThe Leader In Power Monitoring and Smart Grid Solutions
• The IEC 61850 standard specifies a layered approach to the specification of
devices. The layered approach allows “future-proofing” of basic functionality by
allowing individual “stack” components to be upgraded as technology progresses.
• The individual objects within devices are addressed through a hierarchy of names
rather than numbers.
• Each object has precise, standard terminology across the entire vendor community.
• Devices can provide an online description of their data model.
• A complete (offline) description language defines the way all of the parts of the sys-
tem are handled, giving a consistent view of all components within the system.
The IEC 61850 standard was developed for electrical substation automation, but has
been applied to Distributed Energy resources, distribution line equipment, hydro-elec-
tric power plants, and wind power plants.
C.1.1: Relationship of Clients and Servers in IEC 61850
The understanding of the roles of clients and servers and publishers and subscribers is
key to the use of IEC 61850 devices.
A client is the requester (sink) of information while the server is the responder
(source) of information. Information generally flows on a request-response basis with
the client issuing the request and the server issuing the response. However, the con-
cept of servers is extended to provide autonomous transmissions when “interesting”
events occur within the server. This information flow is always to the client requesting
this “interesting information.” Clients are the devices or services which “talk” to IEC
61850 servers. The function of the client is to configure the server “connection,” set
up any dynamic information in the server, enable the reporting mechanisms, and pos-
sibly interrogate specific information from the server. Most clients are relatively pas-
sive devices which await information from the server but perform little direct ongoing
interactions with them except for control operations.
Some clients are used for diagnostic purposes. These devices generally perform ongo-
ing direct interrogation of the servers. A specific example is the “desktop client,”
where the engineer remotely diagnoses system problems or retrieves data which is
not normally sent from the server (for example, power quality information).
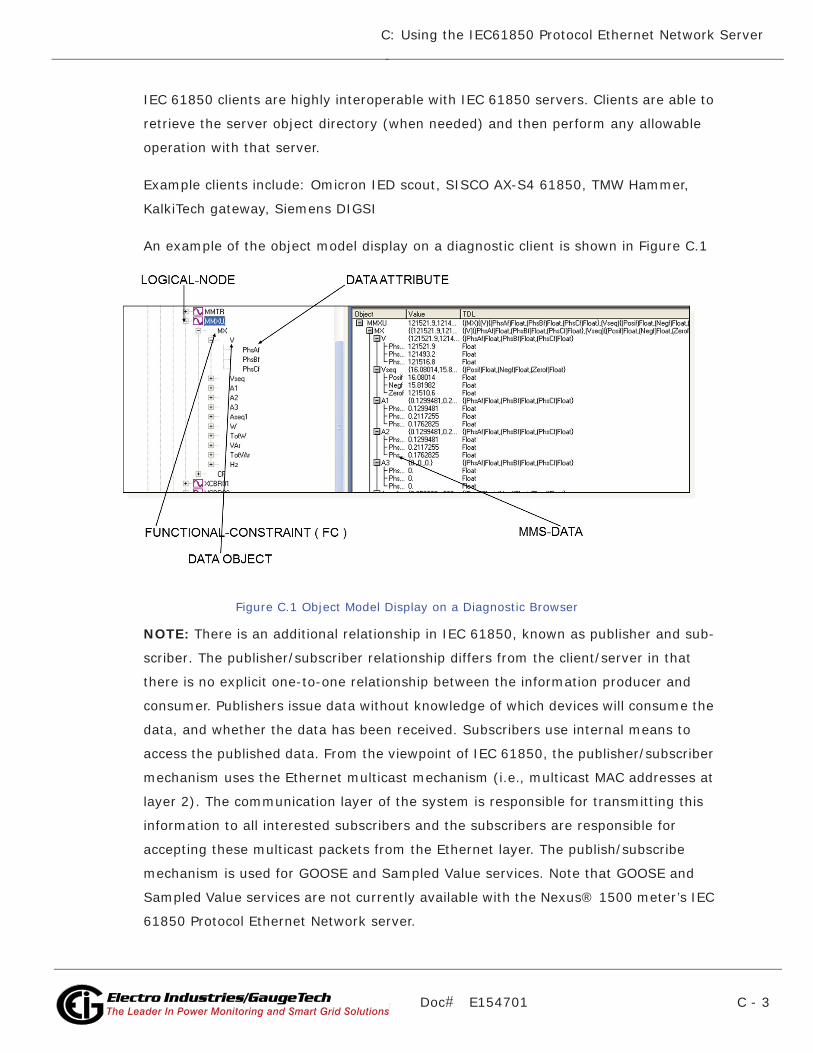
Doc# E154701 C - 3
C: Using the IEC61850 Protocol Ethernet Network Server
Electro Industries/GaugeTechThe Leader In Power Monitoring and Smart Grid SolutionsElectro Industries/GaugeTechThe Leader In Power Monitoring and Smart Grid Solutions
IEC 61850 clients are highly interoperable with IEC 61850 servers. Clients are able to
retrieve the server object directory (when needed) and then perform any allowable
operation with that server.
Example clients include: Omicron IED scout, SISCO AX-S4 61850, TMW Hammer,
KalkiTech gateway, Siemens DIGSI
An example of the object model display on a diagnostic client is shown in Figure C.1
Figure C.1 Object Model Display on a Diagnostic Browser
NOTE: There is an additional relationship in IEC 61850, known as publisher and sub-
scriber. The publisher/subscriber relationship differs from the client/server in that
there is no explicit one-to-one relationship between the information producer and
consumer. Publishers issue data without knowledge of which devices will consume the
data, and whether the data has been received. Subscribers use internal means to
access the published data. From the viewpoint of IEC 61850, the publisher/subscriber
mechanism uses the Ethernet multicast mechanism (i.e., multicast MAC addresses at
layer 2). The communication layer of the system is responsible for transmitting this
information to all interested subscribers and the subscribers are responsible for
accepting these multicast packets from the Ethernet layer. The publish/subscribe
mechanism is used for GOOSE and Sampled Value services. Note that GOOSE and
Sampled Value services are not currently available with the Nexus® 1500 meter’s IEC
61850 Protocol Ethernet Network server.
Doc# E154701 C - 4
C: Using the IEC61850 Protocol Ethernet Network Server
Electro Industries/GaugeTechThe Leader In Power Monitoring and Smart Grid SolutionsElectro Industries/GaugeTechThe Leader In Power Monitoring and Smart Grid Solutions
C.1.2: Structure of IEC 61850 Network
As mentioned before, IEC 61850 lets you set up an automated communication struc-
ture for devices from any vendor. In order to set up this network, IEC 61850 renames
devices (e.g., meters), measured parameters (e.g., Phase to Phase Voltage), and
functions (e.g., reporting) into a specific language and file structure. This way all of
the elements of the network can function together quickly and effectively. The lan-
guage that the IEC 61850 network uses is structured, that is it is very specific in how
the system information is entered, and hierarchical, which means that it has different
levels for specific information; for example, meter information is entered on one level,
and the information about the actual physical connection between meters and other
hardware is entered on another level.
The structure of the IEC 61850 network is composed of different kinds of files, each
containing information that the system needs in order to function. IEC 61850 configu-
ration uses text-based (XML) files known as the System Configuration Language
(SCL). SCL files use the concept of an XML schema, which defines the structure and
content of an XML file. The schema used by SCL files describes most (though not all)
of the restrictions required to ensure a consistent description file. An SCL file superfi-
cially looks like an HTML file. It consists of 6 parts:
• Prologue: XML declaration, (XML) namespace declarations, etc.
• Header element: Names the system and contains the file version history
• Substation element: defines the physical structure of the system
• Communication element: defines all device-to-device communication aspects
• IED element: defines the data model presented by each communicating device
• DataTypeTemplates element: contains the detailed definition of data models
After it is written, the XML file can be checked by "validators" against the schema
using freely available tools.
The IEC 61850 network uses four types of SCL files, each with identical structure:
Doc# E154701 C - 5
C: Using the IEC61850 Protocol Ethernet Network Server
Electro Industries/GaugeTechThe Leader In Power Monitoring and Smart Grid SolutionsElectro Industries/GaugeTechThe Leader In Power Monitoring and Smart Grid Solutions
• SSD - System Specification Description: used during the specification stage of a
system to define physical equipment, connections between physical equipment,
and Logical Nodes which will be used by each piece of equipment.
• ICD - IED Capability Description: this is provided by the communication equipment
vendor to specify the features of the equipment and the data model published by
the equipment. Each of the devices in the network has an ICD file which describes
all of the information about the device, for example, IP address on the network and
Com ports. The (vendor supplied) ICD variation of the SCL file contains a Commu-
nication section specifying the lower-layer selectors and default addressing and
also an IED section containing the data model of the device. See Section C.4.2 for
information on the Nexus® 1500 meter’s .icd file.
• SCD - System Configuration Description: a complete description of the configured
automation system including all devices (for example, meters, breakers, and
relays) and all needed inter-device communications (for example, the measured
parameters and the actions to be performed, such as turning on a relay when a
certain reading is obtained). It can also include elements of the SSD file. The SCD
file is created by a System Configurator, which is a software application that takes
the information from the various devices along with other configuration parameters
and generates the SCD file.
• CID - Configured IED Description: the file used to configure an individual device. It
is a pure subset of the SCD file. The device may also have a CID file, which is a
smaller subset of the device’s ICD file. The CID file describes the exact settings for
the device in this particular IEC 61850 network. The Nexus® 1500 meter’s IEC
61850 Protocol Ethernet Network card uses a CID file. See Section C.2.2.2 for
instructions for uploading the Nexus® 1500 meter’s .cid file.
Each type of SCL file has different required elements with only the prologue and
Header element required in every file type.
C .1.2.1: Elements of an IEC 61850 Network
• A physical device has a name (IEDname) and consists of one or more AccessPoints.
• An AccessPoint has an IP address and consists of one or more Logical Devices
• A Logical Device contains LLN0 and LPHD1 and optional other Logical Nodes.
Doc# E154701 C - 6
C: Using the IEC61850 Protocol Ethernet Network Server
Electro Industries/GaugeTechThe Leader In Power Monitoring and Smart Grid SolutionsElectro Industries/GaugeTechThe Leader In Power Monitoring and Smart Grid Solutions
• LLN0 (Logical Node Zero) is a special object which "controls" the Logical Device. It
contains all of the datasets used for unsolicited transmission from the device. It
also contains the report, SV, and GOOSE control blocks (which reference the datas-
ets).
• LPHD1 (Physical Device) represents the hardware "box" and contains nameplate
information.
• Logical Nodes (LNs) are standardized groups of "Data Objects" (DOs). The grouping
is used to assemble complex functions from small groups of objects (think of them
as building blocks). The standard defines specific mandatory and optional DOs for
each LN. The device may instantiate multiple LNs of the same type differentiated by
either a (named) prefix or (numerical) suffix.
• Data Objects represent "real-world" information, possibly grouped by electrical
object. The IEC 61850 standard has specific semantics for each of the DOs. For
example, the DO named "PhV" represents the voltage of a point on a three-phase
power system. The DOs are composed of standardized Common Data Classes
(CDCs) which are groups of low-level attributes of the objects. For example, the DO
named "Hz" represents system frequency and is of CDC named "MV" (Measurement
Value).
• Common Data Classes (CDCs) consists of standardized groups of "attributes" (sim-
ple data types). For example, the attribute "instMag" represents the instantaneous
magnitude of the underlying quantity. The standard specifies mandatory and
optional attributes for each CDC. For example, the DO named "Hz" in Logical Node
class MMXU contains a mandatory attribute named "mag" which represents the
deadbanded value of the frequency. The physical device contains a database of
data values which map to the various structures described above. The database
values are manipulated by the device to perform actions such as deadbanding
(holding a constant value until the underlying value changes by more than a speci-
fied amount) or triggering of reports.
Doc# E154701 C - 7
C: Using the IEC61850 Protocol Ethernet Network Server
Electro Industries/GaugeTechThe Leader In Power Monitoring and Smart Grid SolutionsElectro Industries/GaugeTechThe Leader In Power Monitoring and Smart Grid Solutions
C.1.3: Steps in Configuring an IEC 61850 Network
1. The first thing needed is the SSD for physical connections, then the vendor-pro-
vided ICD files which are combined into a SCD file by a vendor-independent System
Configurator. The System Configurator assigns addresses to the equipment and
sets up datasets, reports, etc. for inter-device communication. The system configu-
rator will create an "instance" of the configured device by applying the following
information:
• The name of the device
• The IP address, subnet mask, and IP gateway of the device
• Datasets: the user must decide which information within the IED will be included
in reports, etc. and place this information into datasets. The System Configura-
tor should allow the selection of information using a "pick list" from information
within the ICD file.
2. The resulting SCD file is then imported by vendor-specific tools into the various
devices.
Some vendors add the additional step of filtering the SCD file into a smaller file
containing only information needed by the specific device, resulting in a CID file
which is used to configure the device. The actual configuration of the device is left
unspecified by IEC 61850 except to require that the SCD file remains the source of
the configuration information. In this way, consistency of the information across the
whole system is maintained.
See Figure C.2 for a graphical illustration of the process.
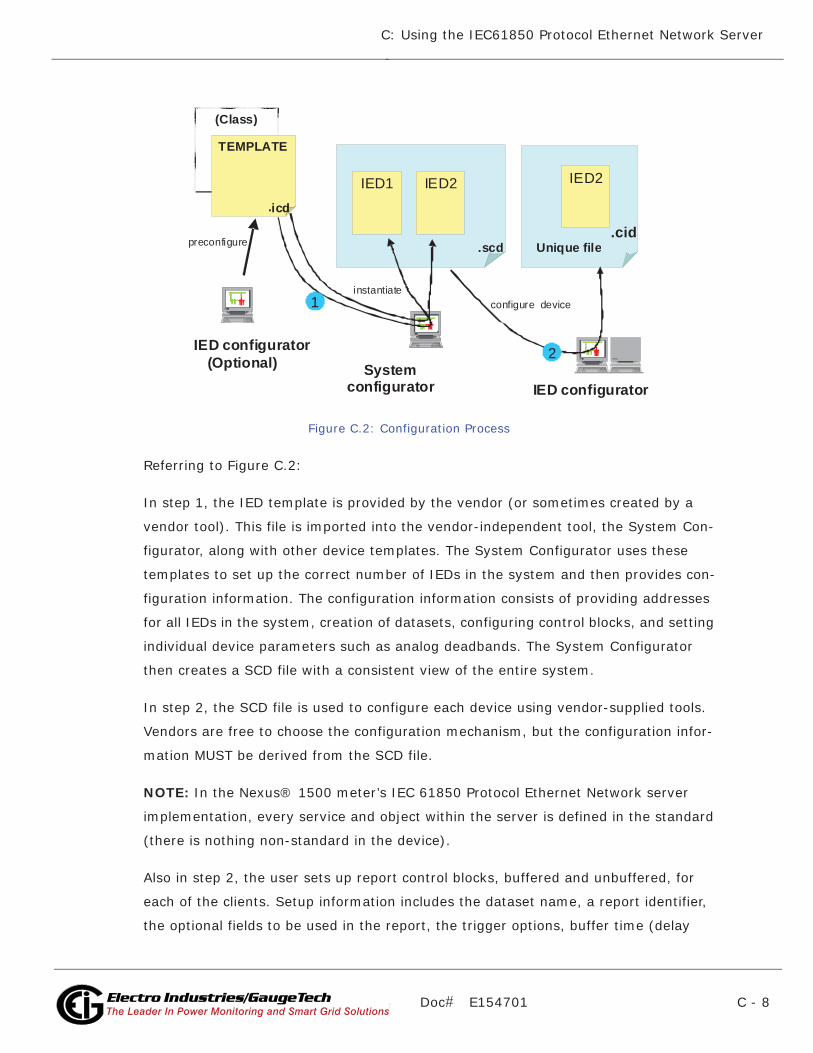
Doc# E154701 C - 8
C: Using the IEC61850 Protocol Ethernet Network Server
Electro Industries/GaugeTechThe Leader In Power Monitoring and Smart Grid SolutionsElectro Industries/GaugeTechThe Leader In Power Monitoring and Smart Grid Solutions
Figure C.2: Configuration Process
Referring to Figure C.2:
In step 1, the IED template is provided by the vendor (or sometimes created by a
vendor tool). This file is imported into the vendor-independent tool, the System Con-
figurator, along with other device templates. The System Configurator uses these
templates to set up the correct number of IEDs in the system and then provides con-
figuration information. The configuration information consists of providing addresses
for all IEDs in the system, creation of datasets, configuring control blocks, and setting
individual device parameters such as analog deadbands. The System Configurator
then creates a SCD file with a consistent view of the entire system.
In step 2, the SCD file is used to configure each device using vendor-supplied tools.
Vendors are free to choose the configuration mechanism, but the configuration infor-
mation MUST be derived from the SCD file.
NOTE: In the Nexus® 1500 meter’s IEC 61850 Protocol Ethernet Network server
implementation, every service and object within the server is defined in the standard
(there is nothing non-standard in the device).
Also in step 2, the user sets up report control blocks, buffered and unbuffered, for
each of the clients. Setup information includes the dataset name, a report identifier,
the optional fields to be used in the report, the trigger options, buffer time (delay
(Class)
.scd
TEMPLATE
.icd
instantiate
preconfigure.cid
Unique file
IED configurator
IED configuratorSystem
configurator
IED1 IED2 IED2
1
2(Optional)
configure device
Doc# E154701 C - 9
C: Using the IEC61850 Protocol Ethernet Network Server
Electro Industries/GaugeTechThe Leader In Power Monitoring and Smart Grid SolutionsElectro Industries/GaugeTechThe Leader In Power Monitoring and Smart Grid Solutions
from first event to report issuance), and integrity time (server periodic reports of all
data in dataset). The decision whether to use buffered or unbuffered must be decided
by the user.
Finally, in step 2 the System Configurator performs a consistency check and then out-
puts the SCD file. The SCD file is imported by the "ScdToCid" tool where the user
specifies the device name.
The resulting CID file is then imported into the target device.
C.1.4: Electro Industries’ Implementation of the IEC 61850 Server
Following are features of EIG’s IEC 61850 implementation:
• The lower-level addressing uses PSEL=00000001, SSEL=0001, and TSEL=0001.
• At the server level, each implements a single Logical Device name formed by con-
catenating the IED name (chosen by the System Configurator) and "Meas" (ex,
"MyDeviceMeas").
• The Logical Nodes implemented within the Logical Device include the standard LLN0
and LPHD1 with optional standard logical nodes in the "M" class (ex, "MMXU") and
"T" class (ex, "TVTR"). Each Logical Node contains only standardized objects of
standardized types (Common Data Class, CDC). The device is based upon the first
edition of the IEC 61850 standards.
Examples of Logical Nodes within the Nexus® 1500 family include eneMMTR1
(energy metering) and nsMMXU1 (normal speed Measurement Unit).
• The Nexus® 1500 device will get its IED name from the first <IED> section in the
configuration file (.cid). This name will be used for accessing its access point (IP
address) and its single Logical Device named "Meas". The IED name can be com-
posed of any string of up to 32 (alphanumeric only) characters.
• The logical nodes implemented in the Nexus® 1500 meter are listed below:
• The node LLN0 keeps common information for the entire logical device. In this
node Datasets and Reports can be defined, based on the limitations provided in
the ICD file: the Nexus® 1500 meter supports up to 32 datasets with up to 256
attributes each, and up to 16 report control blocks. The report control blocks and
datasets must be configured in the CID file, although the options, triggers and
Doc# E154701 C - 10
C: Using the IEC61850 Protocol Ethernet Network Server
Electro Industries/GaugeTechThe Leader In Power Monitoring and Smart Grid SolutionsElectro Industries/GaugeTechThe Leader In Power Monitoring and Smart Grid Solutions
integrity period can be dynamically configured by IEC client. (The Nexus® 1500
meter does not support Goose nor Journals.)
• The node LPHD1 defines physical parameters such as vendor, serial number,
device name plate and the software revision number.
• The node nsMMXU1 contains the "normal-speed" basic electrical measurements
such as Volts / Amps / Watts / VARs / Frequency / Power Factor / etc. The elec-
trical measurements are data objects in hierarchical structure as per the IEC
61850 specifications.
For example, Phase A voltage:
• which is in the object "PhV"
• which is of type "WYE_ABC_mag_noDC"
• which in turn has the object "phsA"
• which again has an attribute named "instVal" to represent instantaneous
values, and also the "mag" attribute, which represents the magnitude as
an analog magnitude, with the attribute "f" to get the value in 32-bit
floating point.
Thus the voltage of phase A, would be referred in this nested structure as
"Meas/nsMMXU1.PhV.phsA.instVal.mag.f".
• The node hsMFLK1 is used for short term flicker (per phase) and long term flicker
(per phase); hs stands for "high speed" (200msec).
• The node nsMHAI1 groups together the THD per phase measurements taken at
normal speed.
Following the previous example, the THD for phase A would be referred as
"Meas/nsMHAI1.ThdPhV.phsA.instCVal.mag.f".
• The node 1sMSQI1 is used for voltage/current symmetrical components per-
phase (zero, positive and negative); 1s stands for “low speed” (3 seconds).
• The node eneMMTR1 groups together all measurements related to energy coun-
ters, like +/- Watt;hours, +/- VAr-hours and Total VA-hours.
Doc# E154701 C - 11
C: Using the IEC61850 Protocol Ethernet Network Server
Electro Industries/GaugeTechThe Leader In Power Monitoring and Smart Grid SolutionsElectro Industries/GaugeTechThe Leader In Power Monitoring and Smart Grid Solutions
• The node intGGIO1 is used for the built-in high-speed digital inputs; the node
extGGIO1 is used for the slot 3 option board’s digital inputs; the node extGGIO2
is used for the slot 4 option board’s digital inputs.
• The nodes setTCTR1, setTCTR2, setTCTR3 and setTCTR4 contain the ratio of the
current used by the measuring device, for phases A,B,C and Neutral, respec-
tively. In this way, the user can take the IEC measurements (primary) and con-
vert them to Secondary using the ratios contained in these nodes.
• The nodes setTVTR1, setTVTR2 and setTVTR3 contain the ratio of the voltage
used by the measuring device.
• Any of the defined objects/ attributes can be placed within a dataset.
• The normal-speed in the Nexus® 1500 meter is measurements taken every sec-
ond. The energy counters are also updated every second.
The configuration of the devices takes place by converting the SCD file exported by
the System Configuration tool into a CID file. This CID file contains all of the informa-
tion from the SCD file which is needed for configuration by the EIG device. The tool is
named "SCDtoCIDConverter" and is a simple, publicly available program. The result-
ing CID file is then sent to the EIG device using HTTP file transfer.
C.1.4.1: Nexus® 1500 Server Configuration
The configuration file (CID) should be stored in the Nexus® 1500 meter in order to
configure the server. At power up the server reads the file, parses it and configures all
the internal settings for proper functionality.
Storing the CID file in the Nexus® 1500 meter is accomplished through its webpage.
The webpage allows the user to locate the CID file, and submit it to the Nexus® 1500
meter for storage.
After storing the CID file, access the Nexus® 1500 meter’s webpage again, to make
sure that the file has been stored, and to see if there is any problem with it, by check-
ing its status. The CID file will be successfully updated if the IP address inside the .cid
file matches with the one programmed into the device profile.
Doc# E154701 C - 12
C: Using the IEC61850 Protocol Ethernet Network Server
Electro Industries/GaugeTechThe Leader In Power Monitoring and Smart Grid SolutionsElectro Industries/GaugeTechThe Leader In Power Monitoring and Smart Grid Solutions
• A common problem you may see is IP mismatch (the IP address in the CID file
does not match the IP configured in the Nexus® 1500 meter’s device profile). In
this case the Nexus® 1500 meter will use the IP address from its device profile,
and the IEC Server will work only with that address.
• If there is a critical error in the stored CID file, which prevents the IEC Server from
running, the CID file will not be used, and instead the Default CID file (embedded in
the server) will be used. The webpage will alert you to this situation.
• If further details are needed, for example, information on the reason the CID stor-
age failed, the web server provides a link to the system log. In the system log-
screen you can view messages from the IEC 61850 parser, and you can take
actions to correct the error.
See Section C.2 for instructions on configuring the Nexus® 1500 meter’s IEC 61850
Protocol Ethernet Network server.
C.1.5: Reference Materials
Following is a list of background information on IEC 61850 that is available on the
Internet:
• http://www.sisconet.com/downloads/
IEC61850_Overview_and_Benefits_Paper_General.pdf
• http://www.sisconet.com/downloads/CIGRE%202004%20Presentations.zip
(IEC618650 Presentation IEC 61850 û Data Model and Services.pdf)
• http://www.ucaiug.org/Meetings/Austin2011/Shared%20Documents/IEC_61850-
Tutorial.pdf (pages 24-32 and 40-161)
• http://brodersensystems.com/wordpress/wp-content/uploads/DTU-Master-Thesis-
RTU32.pdf (pages 9-36)
Additionally, there is a good article on the predecessor to IEC 61850 (UCA 2.0) at
http://www.elp.com/index/display/article-display/66170/articles/utility-automation-
engineering-td/volume-5/issue-2/features/uca-20-for-dummies.html.
Another good article on multi-vendor IED integration can be found at http://
www.gedigitalenergy.com/smartgrid/Aug07/EIC61850.pdf.
Doc# E154701 C - 13
C: Using the IEC61850 Protocol Ethernet Network Server
Electro Industries/GaugeTechThe Leader In Power Monitoring and Smart Grid SolutionsElectro Industries/GaugeTechThe Leader In Power Monitoring and Smart Grid Solutions
C.1.6: Free Tools for IEC 61850 Start-up
The Internet also provides some free IEC 61850 configuration tools:
• Schema validation tools: http://notepad-plus-plus.org/
go to plug-in manager and install XML tools (however, there is no (legal) public
copies of the schema available). However, a web search file the filename
SCL_Basetypes.xsd turns up many copies and the entire set of XSD file is often
nearby.
• http://opensclconfig.git.sourceforge.net/
Apparent open-source project, not tested
• http://www.sisconet.com/downloads/SCDtoCIDConverter0-9.exe
filters SCD file to a CID file
• http://www.sisconet.com/downloads/skunkworks2-8.exe Ethernet analyzer
C.1.7: Commercial Tools for IEC 61850 Implementation
Following is a list of tools for IEC 61850 configuration which you can purchase:
• http://www.sisconet.com/ax-s4_61850.htm
Client for IEC 61850
• http://products.trianglemicroworks.com/documents/
TMW%2061850%20Test%20Suite%20Combined.pdf
Clients and servers for IEC 61850
• http://www.omicron.at/en/products/pro/communication-protocols/iedscout/
test client
• http://kalkitech.com/products/sync-6000-series-scl-manager--iec61850-substa-
tion-design-tool
SCL editing tool
Doc# E154701 C - 14
C: Using the IEC61850 Protocol Ethernet Network Server
Electro Industries/GaugeTechThe Leader In Power Monitoring and Smart Grid SolutionsElectro Industries/GaugeTechThe Leader In Power Monitoring and Smart Grid Solutions
C.2: Using the Nexus® 1500 Meter’s IEC 61850 Protocol Ethernet Network Server
This section contains instructions for understanding and configuring the Nexus® 1500
meter’s IEC 61850 Protocol Ethernet Network server.
C.2.1: Overview
The IEC 61850 Protocol Ethernet Network card is a Nexus® 1500 standard I/O board.
It is available via Ethernet port 1 with V-SwitchTM keys 2 and 3. The IEC 61850 Proto-
col Ethernet Network server has the following features:
• Standard Ethernet 10/100 Mbps connector is used to link the unit into an Ethernet
network.
• Standard operation port 102, which can be reconfigured to any valid TCP/IP port.
• Up to 6 simultaneous connections can be established with the unit.
• Configurable via the .CID file (XML formatted)
• Embedded Capabilities File (.ICD downloadable from the unit)
• Supports MMS protocol.
• Supports the following Logical Nodes:
• LLN0 (with predefined Sets and Reports)
• LPHD (Identifiers)
• MMXU with
• Phase-to-N Voltages
• Phase-to-Phase Voltages
• Phase Currents
• Per Phase VA
• Total VA
• Per Phase Var
Doc# E154701 C - 15
C: Using the IEC61850 Protocol Ethernet Network Server
Electro Industries/GaugeTechThe Leader In Power Monitoring and Smart Grid SolutionsElectro Industries/GaugeTechThe Leader In Power Monitoring and Smart Grid Solutions
• Total Var
• Per Phase W
• Total W
• Per Phase PF
• Total PF
• Frequency
• MHAI with Per Phase THD for voltage and current
• MSQI with
• Voltage symmetrical components per phase (zero, positive and negative)
• Current symmetrical components per phase (zero, positive and negative)
• MMTR with
• Demand Wh
• Supplied Wh
• Demand Varh
• SuppliedVArh
• Total VAh
• GGIO with built-in and option board digital inputs and virtual inputs
• Supports polled (Queried Requests) operation mode.
• Supports Buffered Reports
• Supports Unbuffered Reports
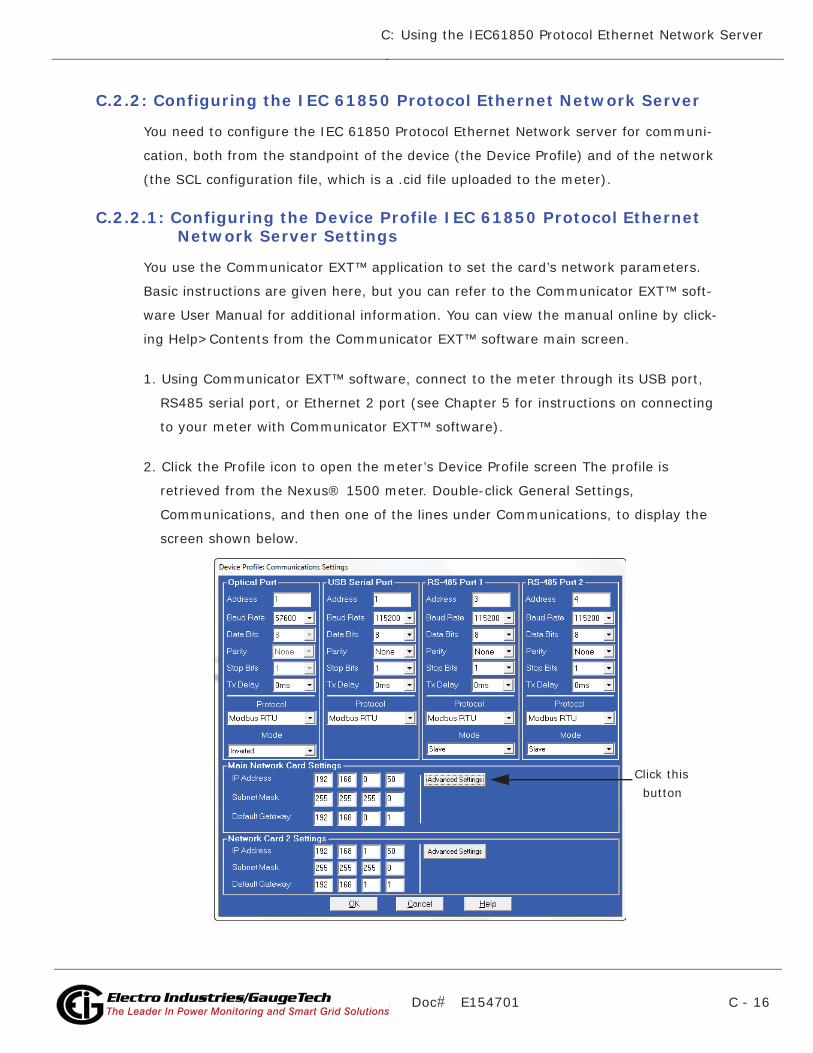
Doc# E154701 C - 16
C: Using the IEC61850 Protocol Ethernet Network Server
Electro Industries/GaugeTechThe Leader In Power Monitoring and Smart Grid SolutionsElectro Industries/GaugeTechThe Leader In Power Monitoring and Smart Grid Solutions
C.2.2: Configuring the IEC 61850 Protocol Ethernet Network Server
You need to configure the IEC 61850 Protocol Ethernet Network server for communi-
cation, both from the standpoint of the device (the Device Profile) and of the network
(the SCL configuration file, which is a .cid file uploaded to the meter).
C.2.2.1: Configuring the Device Profile IEC 61850 Protocol Ethernet Network Server Settings
You use the Communicator EXT™ application to set the card’s network parameters.
Basic instructions are given here, but you can refer to the Communicator EXT™ soft-
ware User Manual for additional information. You can view the manual online by click-
ing Help>Contents from the Communicator EXT™ software main screen.
1. Using Communicator EXT™ software, connect to the meter through its USB port,
RS485 serial port, or Ethernet 2 port (see Chapter 5 for instructions on connecting
to your meter with Communicator EXT™ software).
2. Click the Profile icon to open the meter’s Device Profile screen The profile is
retrieved from the Nexus® 1500 meter. Double-click General Settings,
Communications, and then one of the lines under Communications, to display the
screen shown below.
Click this button
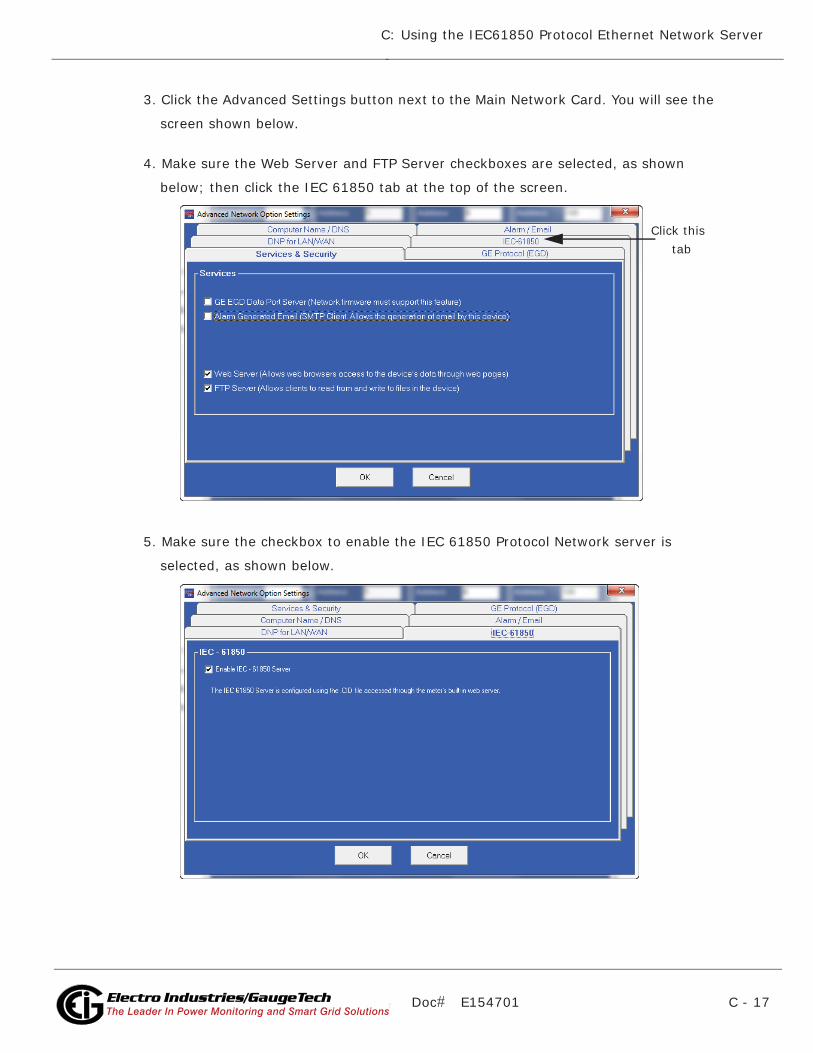
Doc# E154701 C - 17
C: Using the IEC61850 Protocol Ethernet Network Server
Electro Industries/GaugeTechThe Leader In Power Monitoring and Smart Grid SolutionsElectro Industries/GaugeTechThe Leader In Power Monitoring and Smart Grid Solutions
3. Click the Advanced Settings button next to the Main Network Card. You will see the
screen shown below.
4. Make sure the Web Server and FTP Server checkboxes are selected, as shown
below; then click the IEC 61850 tab at the top of the screen.
5. Make sure the checkbox to enable the IEC 61850 Protocol Network server is
selected, as shown below.
Click this tab
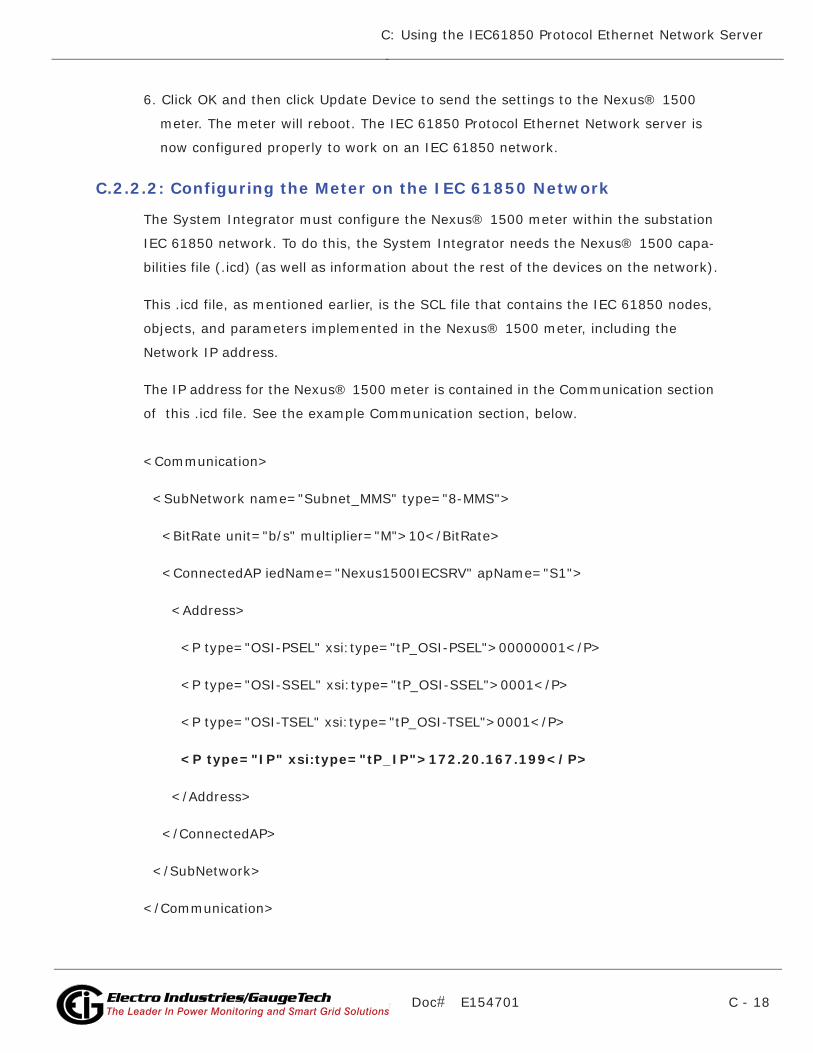
Doc# E154701 C - 18
C: Using the IEC61850 Protocol Ethernet Network Server
Electro Industries/GaugeTechThe Leader In Power Monitoring and Smart Grid SolutionsElectro Industries/GaugeTechThe Leader In Power Monitoring and Smart Grid Solutions
6. Click OK and then click Update Device to send the settings to the Nexus® 1500
meter. The meter will reboot. The IEC 61850 Protocol Ethernet Network server is
now configured properly to work on an IEC 61850 network.
C.2.2.2: Configuring the Meter on the IEC 61850 Network
The System Integrator must configure the Nexus® 1500 meter within the substation
IEC 61850 network. To do this, the System Integrator needs the Nexus® 1500 capa-
bilities file (.icd) (as well as information about the rest of the devices on the network).
This .icd file, as mentioned earlier, is the SCL file that contains the IEC 61850 nodes,
objects, and parameters implemented in the Nexus® 1500 meter, including the
Network IP address.
The IP address for the Nexus® 1500 meter is contained in the Communication section
of this .icd file. See the example Communication section, below.
<Communication>
<SubNetwork name="Subnet_MMS" type="8-MMS">
<BitRate unit="b/s" multiplier="M">10</BitRate>
<ConnectedAP iedName="Nexus1500IECSRV" apName="S1">
<Address>
<P type="OSI-PSEL" xsi:type="tP_OSI-PSEL">00000001</P>
<P type="OSI-SSEL" xsi:type="tP_OSI-SSEL">0001</P>
<P type="OSI-TSEL" xsi:type="tP_OSI-TSEL">0001</P>
<P type="IP" xsi:type="tP_IP">172.20.167.199</P>
</Address>
</ConnectedAP>
</SubNetwork>
</Communication>
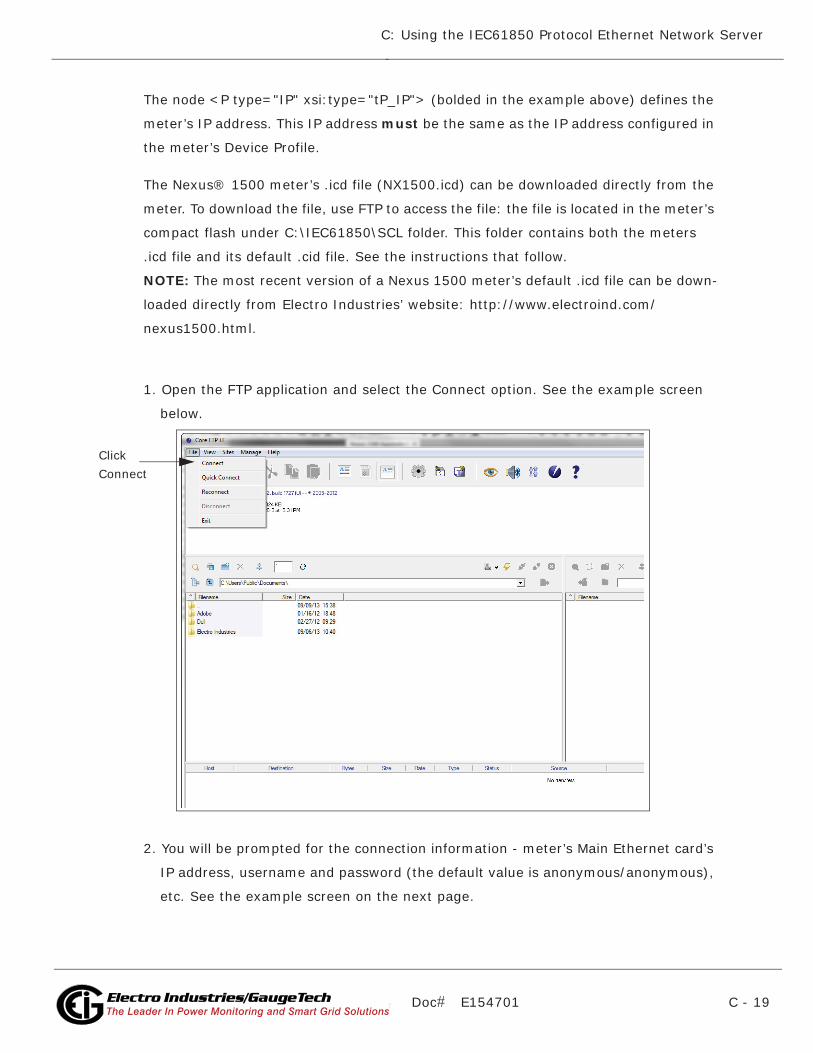
Doc# E154701 C - 19
C: Using the IEC61850 Protocol Ethernet Network Server
Electro Industries/GaugeTechThe Leader In Power Monitoring and Smart Grid SolutionsElectro Industries/GaugeTechThe Leader In Power Monitoring and Smart Grid Solutions
The node <P type="IP" xsi:type="tP_IP"> (bolded in the example above) defines the
meter’s IP address. This IP address must be the same as the IP address configured in
the meter’s Device Profile.
The Nexus® 1500 meter’s .icd file (NX1500.icd) can be downloaded directly from the
meter. To download the file, use FTP to access the file: the file is located in the meter’s
compact flash under C:\IEC61850\SCL folder. This folder contains both the meters
.icd file and its default .cid file. See the instructions that follow.
NOTE: The most recent version of a Nexus 1500 meter’s default .icd file can be down-
loaded directly from Electro Industries’ website: http://www.electroind.com/
nexus1500.html.
1. Open the FTP application and select the Connect option. See the example screen
below.
2. You will be prompted for the connection information - meter’s Main Ethernet card’s
IP address, username and password (the default value is anonymous/anonymous),
etc. See the example screen on the next page.
ClickConnect
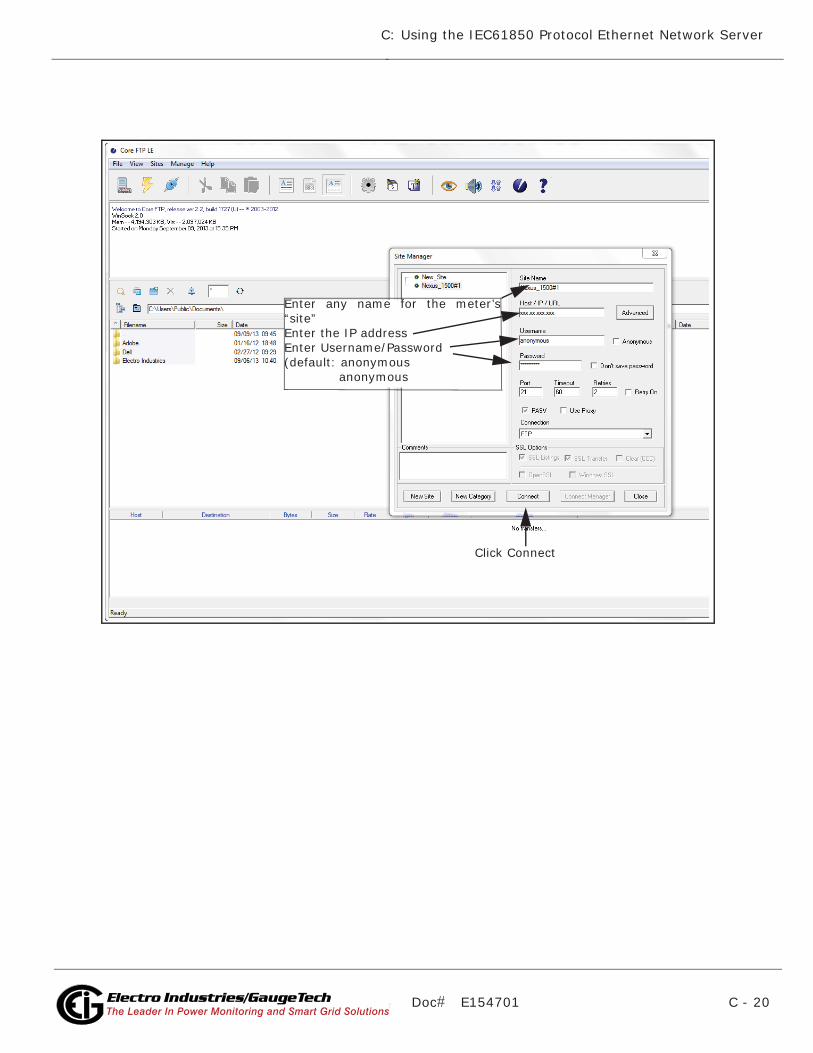
Doc# E154701 C - 20
C: Using the IEC61850 Protocol Ethernet Network Server
Electro Industries/GaugeTechThe Leader In Power Monitoring and Smart Grid SolutionsElectro Industries/GaugeTechThe Leader In Power Monitoring and Smart Grid Solutions
Enter any name for the meter’s“site”Enter the IP addressEnter Username/Password(default: anonymous anonymous
Click Connect
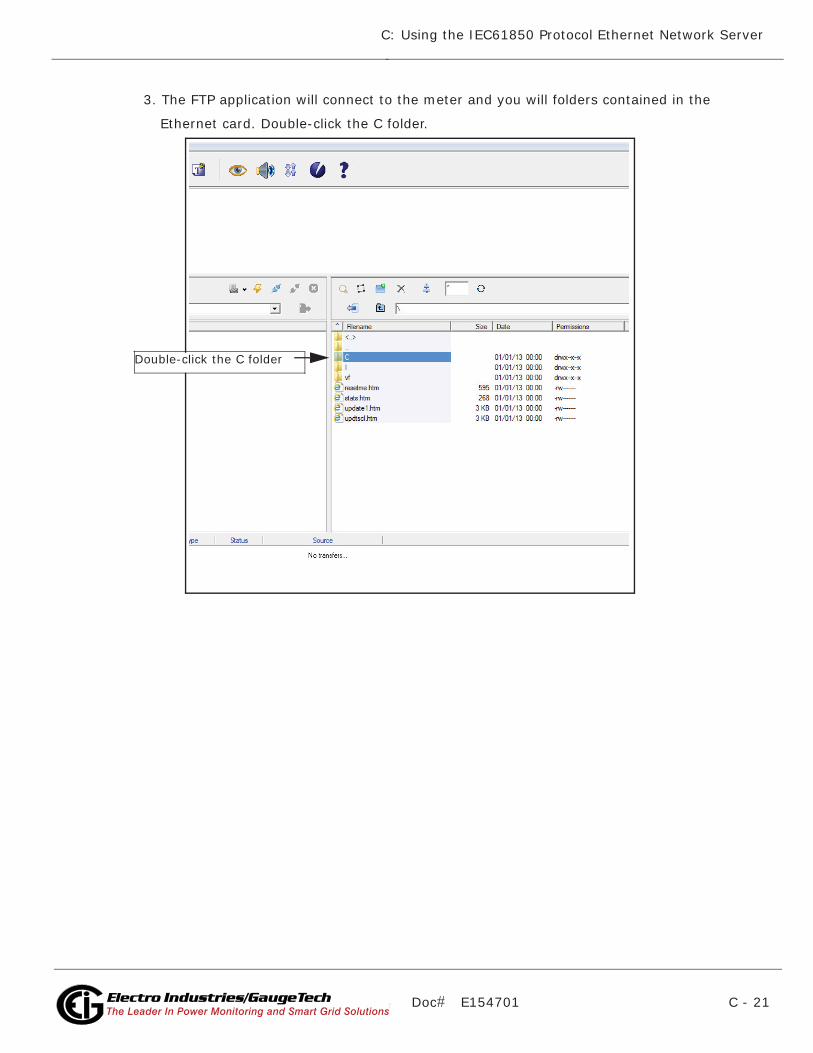
Doc# E154701 C - 21
C: Using the IEC61850 Protocol Ethernet Network Server
Electro Industries/GaugeTechThe Leader In Power Monitoring and Smart Grid SolutionsElectro Industries/GaugeTechThe Leader In Power Monitoring and Smart Grid Solutions
3. The FTP application will connect to the meter and you will folders contained in the
Ethernet card. Double-click the C folder.
Double-click the C folder
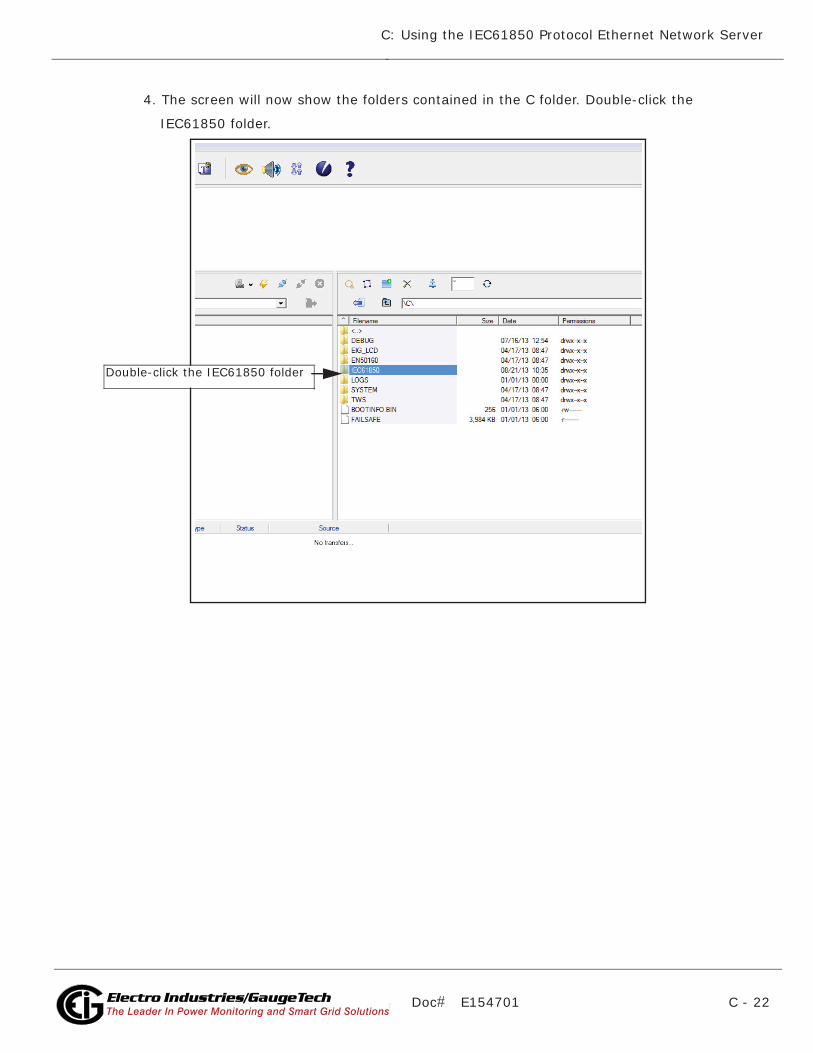
Doc# E154701 C - 22
C: Using the IEC61850 Protocol Ethernet Network Server
Electro Industries/GaugeTechThe Leader In Power Monitoring and Smart Grid SolutionsElectro Industries/GaugeTechThe Leader In Power Monitoring and Smart Grid Solutions
4. The screen will now show the folders contained in the C folder. Double-click the
IEC61850 folder.
Double-click the IEC61850 folder
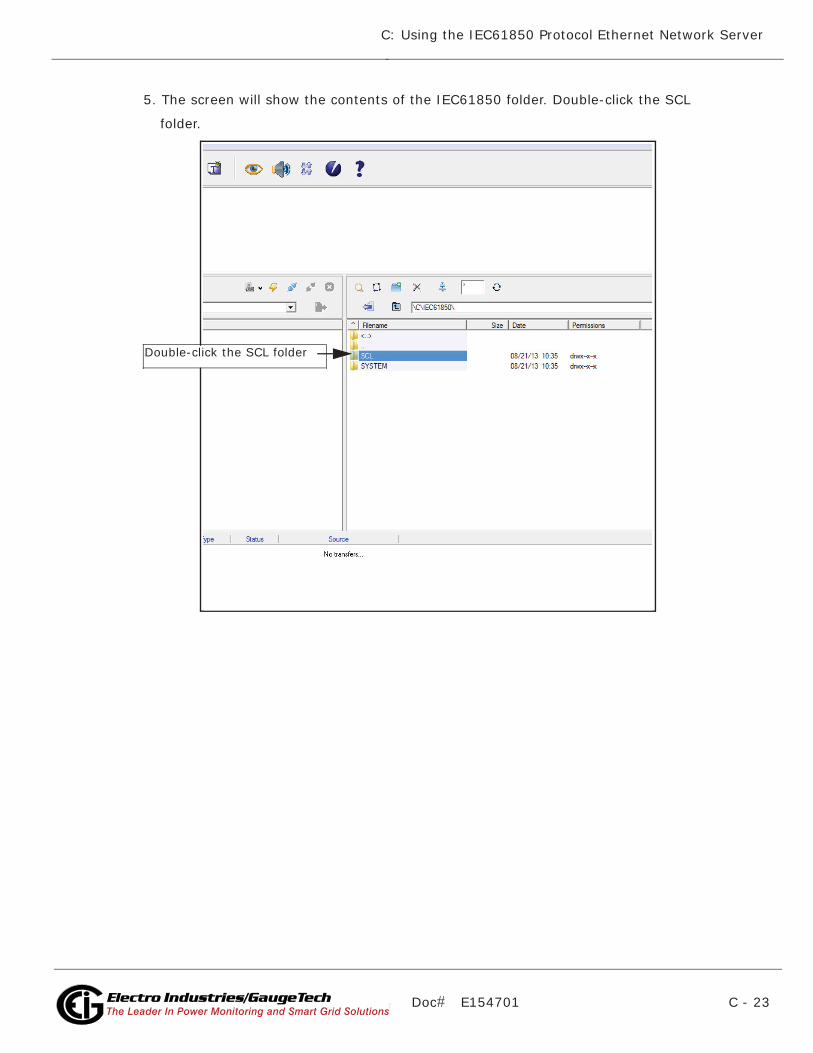
Doc# E154701 C - 23
C: Using the IEC61850 Protocol Ethernet Network Server
Electro Industries/GaugeTechThe Leader In Power Monitoring and Smart Grid SolutionsElectro Industries/GaugeTechThe Leader In Power Monitoring and Smart Grid Solutions
5. The screen will show the contents of the IEC61850 folder. Double-click the SCL
folder.
Double-click the SCL folder
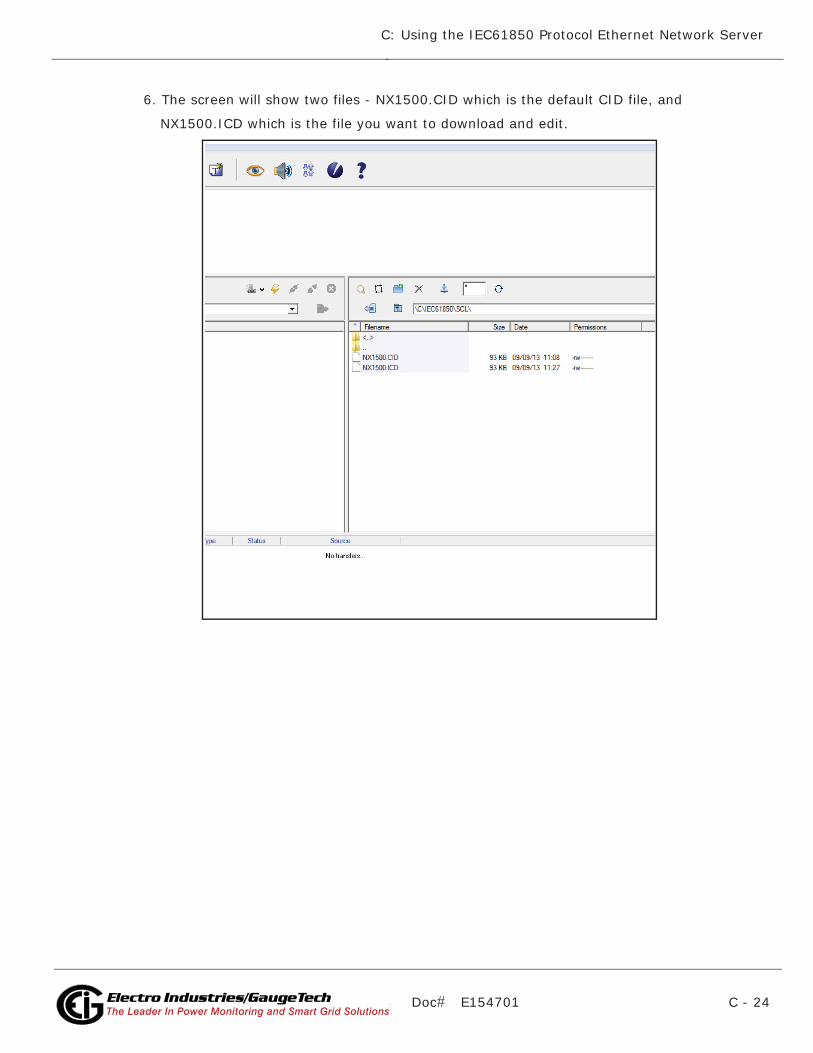
Doc# E154701 C - 24
C: Using the IEC61850 Protocol Ethernet Network Server
Electro Industries/GaugeTechThe Leader In Power Monitoring and Smart Grid SolutionsElectro Industries/GaugeTechThe Leader In Power Monitoring and Smart Grid Solutions
6. The screen will show two files - NX1500.CID which is the default CID file, and
NX1500.ICD which is the file you want to download and edit.
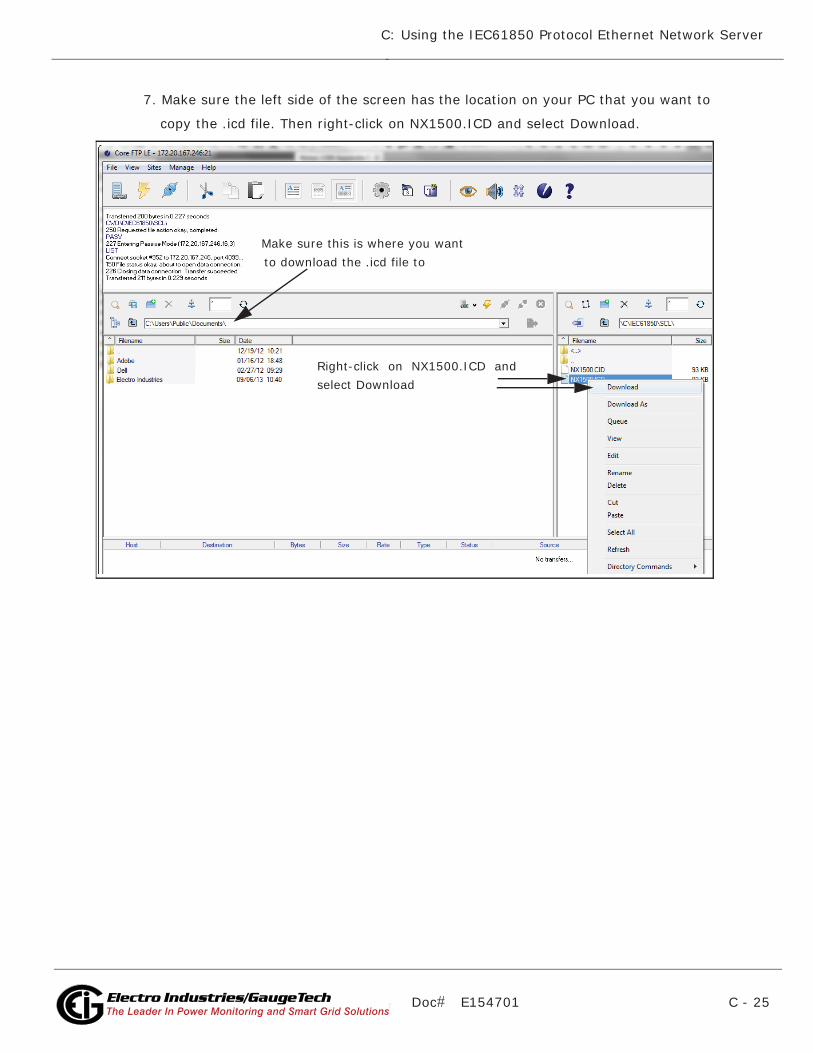
Doc# E154701 C - 25
C: Using the IEC61850 Protocol Ethernet Network Server
Electro Industries/GaugeTechThe Leader In Power Monitoring and Smart Grid SolutionsElectro Industries/GaugeTechThe Leader In Power Monitoring and Smart Grid Solutions
7. Make sure the left side of the screen has the location on your PC that you want to
copy the .icd file. Then right-click on NX1500.ICD and select Download.
Make sure this is where you wantto download the .icd file to
Right-click on NX1500.ICD andselect Download
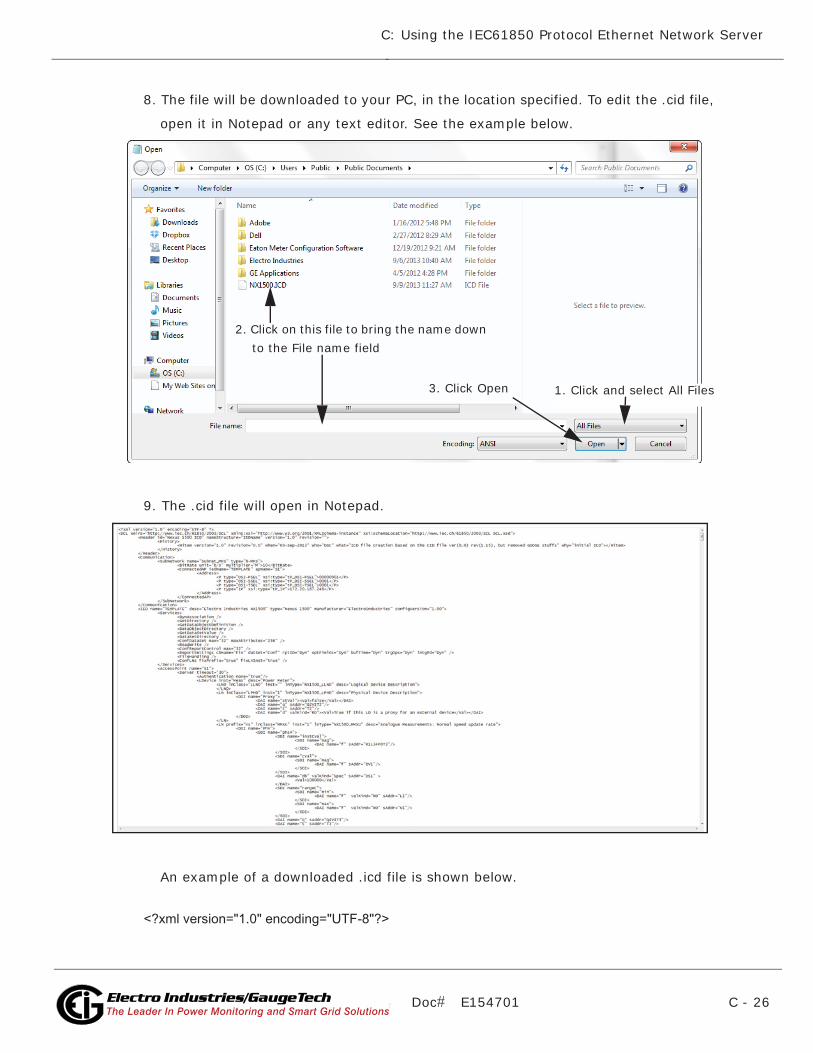
Doc# E154701 C - 26
C: Using the IEC61850 Protocol Ethernet Network Server
Electro Industries/GaugeTechThe Leader In Power Monitoring and Smart Grid SolutionsElectro Industries/GaugeTechThe Leader In Power Monitoring and Smart Grid Solutions
8. The file will be downloaded to your PC, in the location specified. To edit the .cid file,
open it in Notepad or any text editor. See the example below.
9. The .cid file will open in Notepad.
An example of a downloaded .icd file is shown below.
1. Click and select All Files
2. Click on this file to bring the name down to the File name field
3. Click Open
Doc# E154701 C - 27
C: Using the IEC61850 Protocol Ethernet Network Server
Electro Industries/GaugeTechThe Leader In Power Monitoring and Smart Grid SolutionsElectro Industries/GaugeTechThe Leader In Power Monitoring and Smart Grid Solutions
SRV
SRV N
Doc# E154701 C - 28
C: Using the IEC61850 Protocol Ethernet Network Server
Electro Industries/GaugeTechThe Leader In Power Monitoring and Smart Grid SolutionsElectro Industries/GaugeTechThe Leader In Power Monitoring and Smart Grid Solutions
10. You need to make the following changes to the .cid file:
• Change "TEMPLATE" to the iedName alphanumeric string in 2 places:
• In <Communication>
<SubNetwork name="Subnet_MMS" type="8-MMS">
<BitRate unit="b/s" multiplier="M">10</BitRate>
<ConnectedAP iedName="alphanumeric string" apName="S1">
• <IED name="alphanumeric string" desc="Electro Industries NX1500"
type="Nexus 1500" manufacturer="ElectroIndustries" configVer-
sion="1.00">
• Change the IP address to the IP address of the meter’s Main Ethernet card:
<Communication>
<SubNetwork name="Subnet_MMS" type="8-MMS">
<BitRate unit="b/s" multiplier="M">10</BitRate>
<ConnectedAP iedName="NX1500IECSRV" apName="S1">
<Address>
<P type="OSI-PSEL" xsi:type="tP_OSI-PSEL">00000001</P>
<P type="OSI-SSEL" xsi:type="tP_OSI-SSEL">0001</P>
<P type="OSI-TSEL" xsi:type="tP_OSI-TSEL">0001</P>
<P type="IP" xsi:type="tP_IP">192.168.0.50</P>
• Any modifications needed for your specific configuration: creating datasets,
reports, etc.
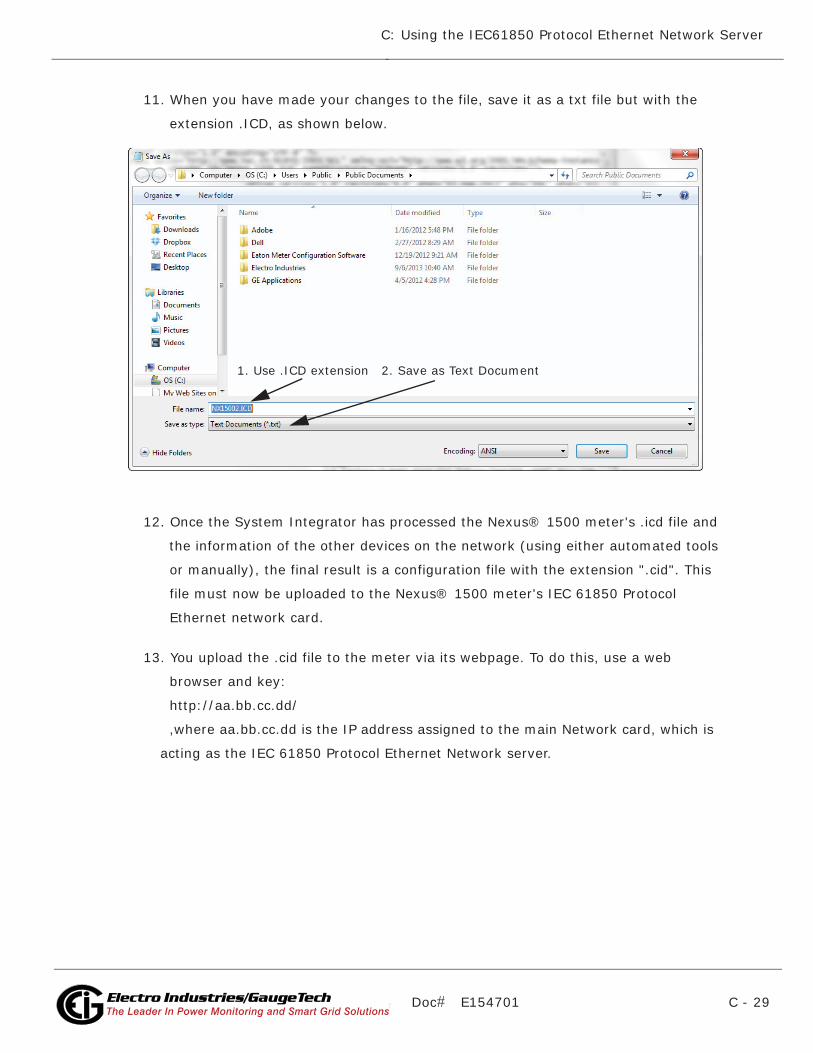
Doc# E154701 C - 29
C: Using the IEC61850 Protocol Ethernet Network Server
Electro Industries/GaugeTechThe Leader In Power Monitoring and Smart Grid SolutionsElectro Industries/GaugeTechThe Leader In Power Monitoring and Smart Grid Solutions
11. When you have made your changes to the file, save it as a txt file but with the
extension .ICD, as shown below.
12. Once the System Integrator has processed the Nexus® 1500 meter's .icd file and
the information of the other devices on the network (using either automated tools
or manually), the final result is a configuration file with the extension ".cid". This
file must now be uploaded to the Nexus® 1500 meter's IEC 61850 Protocol
Ethernet network card.
13. You upload the .cid file to the meter via its webpage. To do this, use a web
browser and key:
http://aa.bb.cc.dd/
,where aa.bb.cc.dd is the IP address assigned to the main Network card, which is
acting as the IEC 61850 Protocol Ethernet Network server.
1. Use .ICD extension 2. Save as Text Document
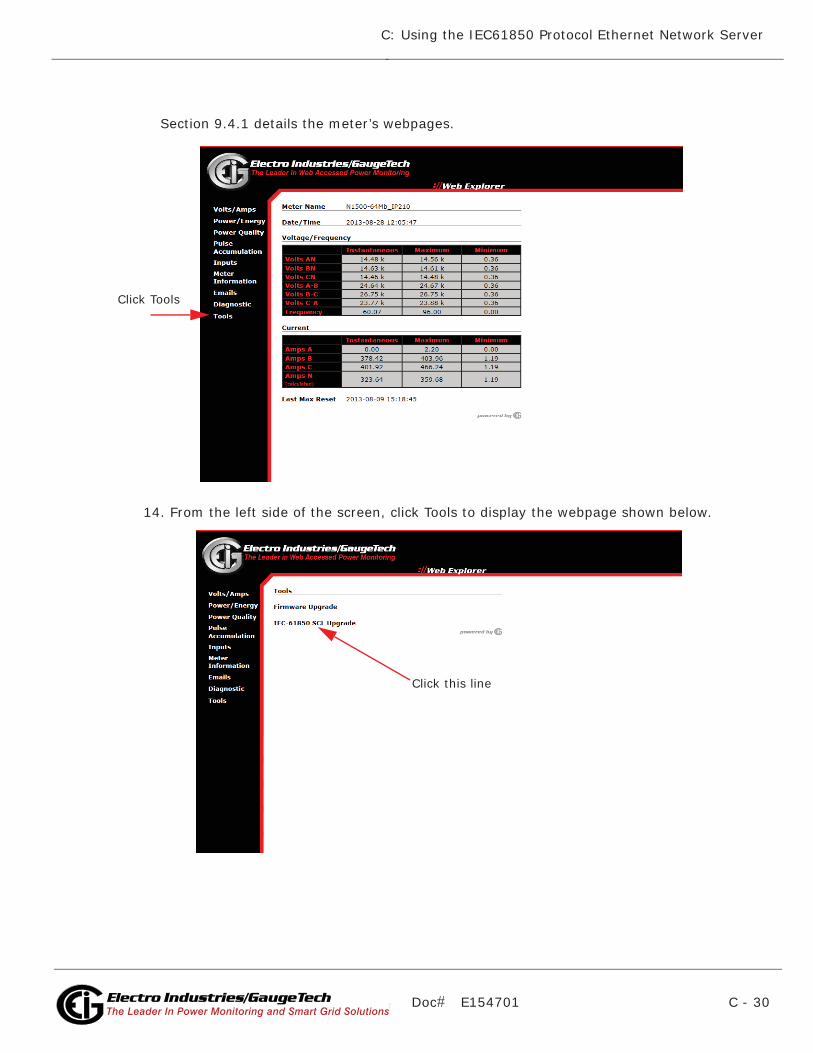
Doc# E154701 C - 30
C: Using the IEC61850 Protocol Ethernet Network Server
Electro Industries/GaugeTechThe Leader In Power Monitoring and Smart Grid SolutionsElectro Industries/GaugeTechThe Leader In Power Monitoring and Smart Grid Solutions
Section 9.4.1 details the meter’s webpages.
14. From the left side of the screen, click Tools to display the webpage shown below.
Click Tools
Click this line
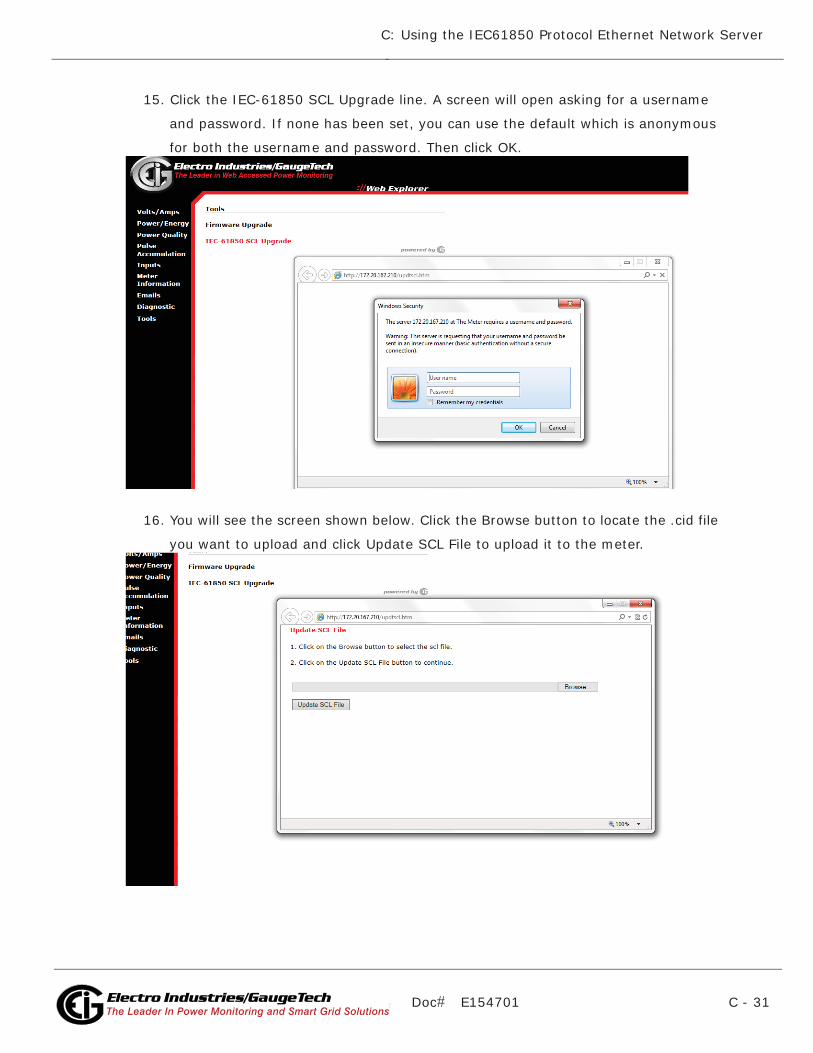
Doc# E154701 C - 31
C: Using the IEC61850 Protocol Ethernet Network Server
Electro Industries/GaugeTechThe Leader In Power Monitoring and Smart Grid SolutionsElectro Industries/GaugeTechThe Leader In Power Monitoring and Smart Grid Solutions
15. Click the IEC-61850 SCL Upgrade line. A screen will open asking for a username
and password. If none has been set, you can use the default which is anonymous
for both the username and password. Then click OK.
16. You will see the screen shown below. Click the Browse button to locate the .cid file
you want to upload and click Update SCL File to upload it to the meter.
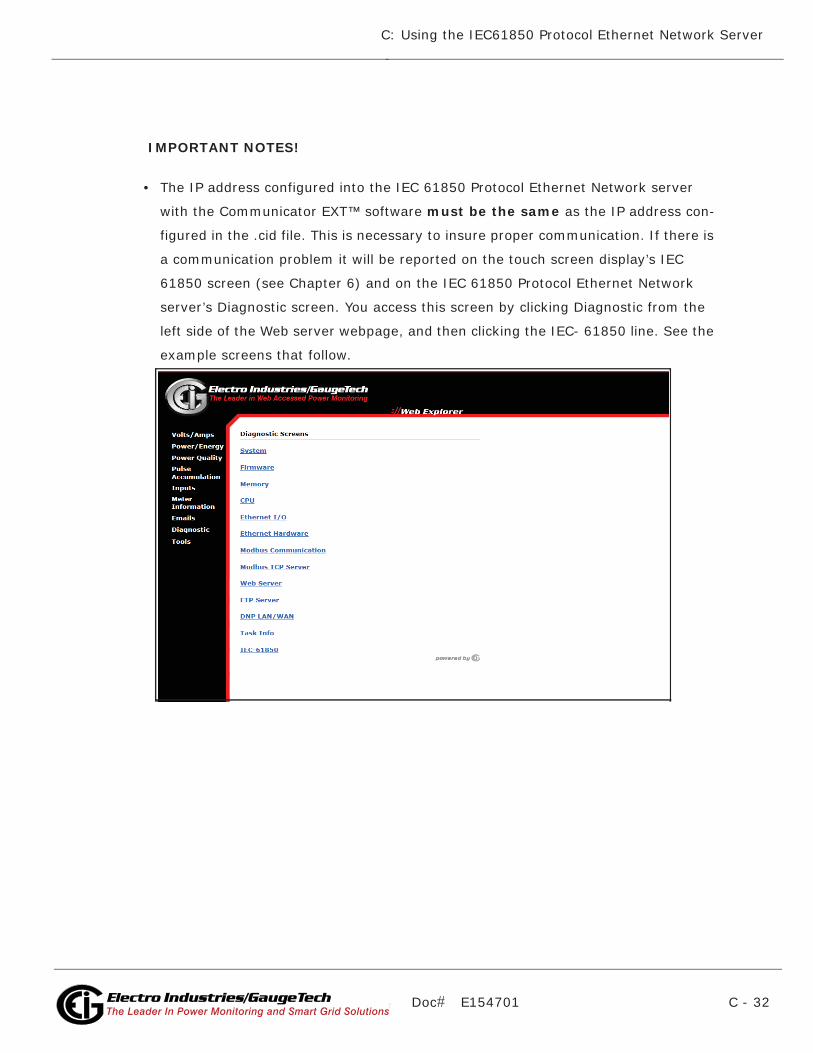
Doc# E154701 C - 32
C: Using the IEC61850 Protocol Ethernet Network Server
Electro Industries/GaugeTechThe Leader In Power Monitoring and Smart Grid SolutionsElectro Industries/GaugeTechThe Leader In Power Monitoring and Smart Grid Solutions
IMPORTANT NOTES!
• The IP address configured into the IEC 61850 Protocol Ethernet Network server
with the Communicator EXT™ software must be the same as the IP address con-
figured in the .cid file. This is necessary to insure proper communication. If there is
a communication problem it will be reported on the touch screen display’s IEC
61850 screen (see Chapter 6) and on the IEC 61850 Protocol Ethernet Network
server’s Diagnostic screen. You access this screen by clicking Diagnostic from the
left side of the Web server webpage, and then clicking the IEC- 61850 line. See the
example screens that follow.
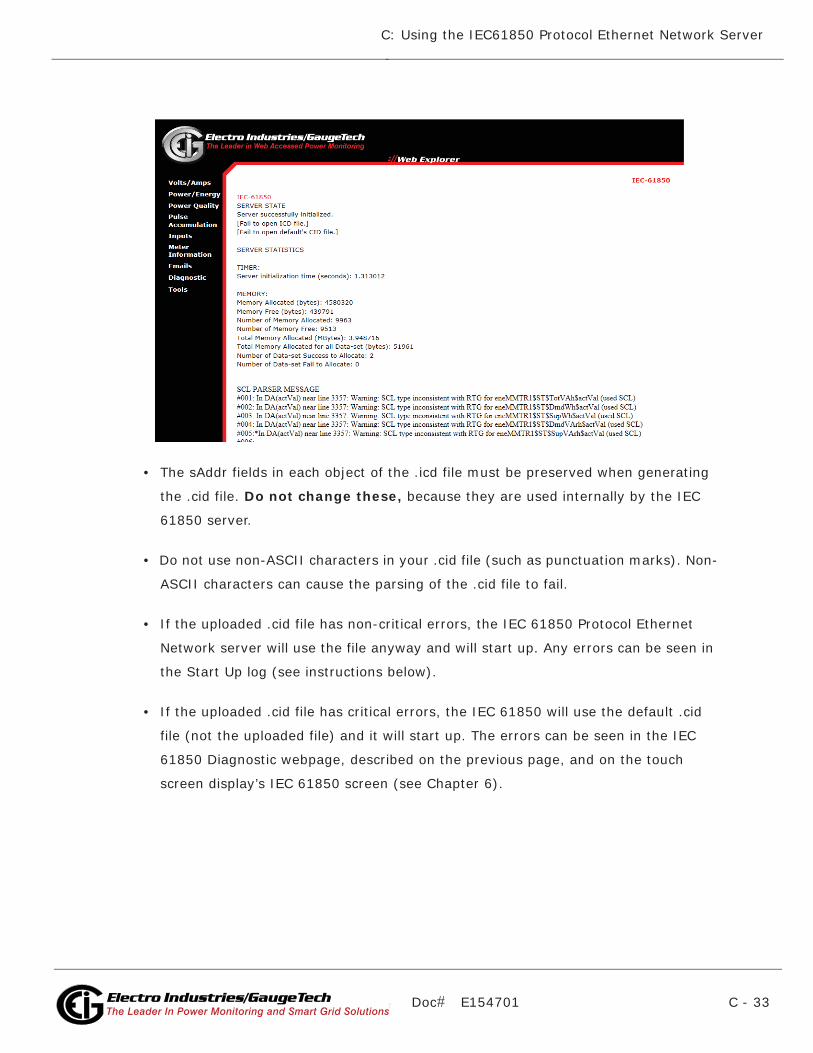
Doc# E154701 C - 33
C: Using the IEC61850 Protocol Ethernet Network Server
Electro Industries/GaugeTechThe Leader In Power Monitoring and Smart Grid SolutionsElectro Industries/GaugeTechThe Leader In Power Monitoring and Smart Grid Solutions
• The sAddr fields in each object of the .icd file must be preserved when generating
the .cid file. Do not change these, because they are used internally by the IEC
61850 server.
• Do not use non-ASCII characters in your .cid file (such as punctuation marks). Non-
ASCII characters can cause the parsing of the .cid file to fail.
• If the uploaded .cid file has non-critical errors, the IEC 61850 Protocol Ethernet
Network server will use the file anyway and will start up. Any errors can be seen in
the Start Up log (see instructions below).
• If the uploaded .cid file has critical errors, the IEC 61850 will use the default .cid
file (not the uploaded file) and it will start up. The errors can be seen in the IEC
61850 Diagnostic webpage, described on the previous page, and on the touch
screen display’s IEC 61850 screen (see Chapter 6).
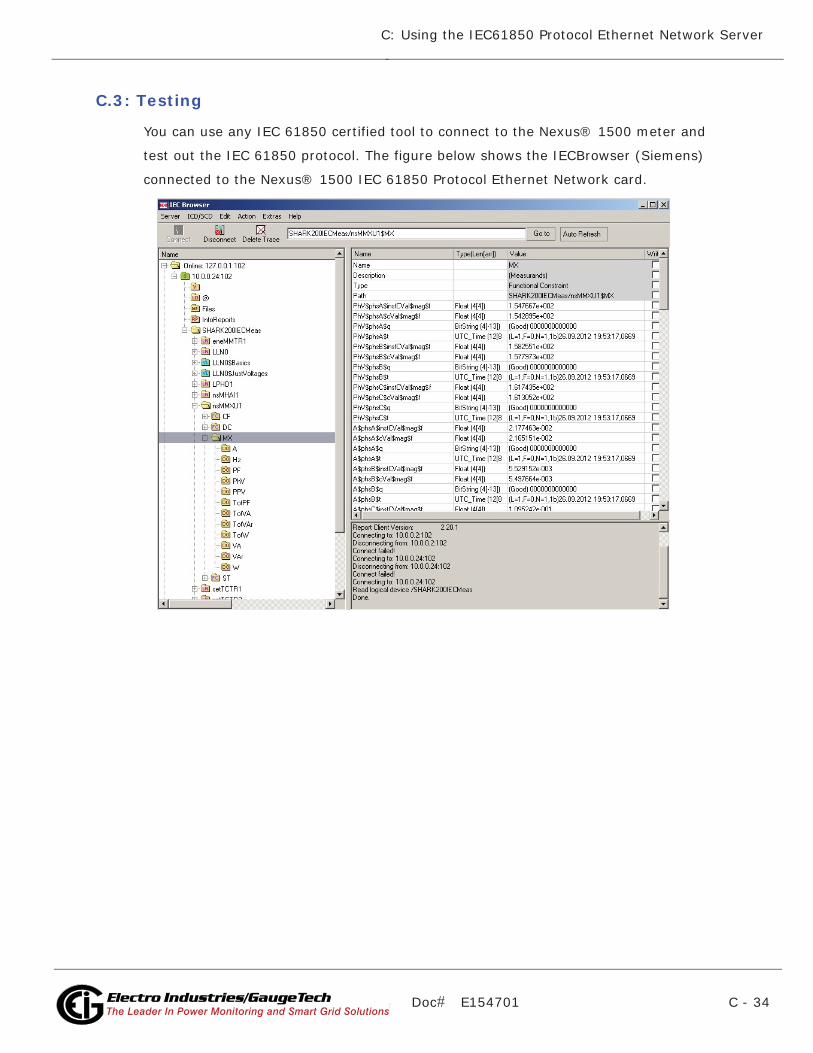
Doc# E154701 C - 34
C: Using the IEC61850 Protocol Ethernet Network Server
Electro Industries/GaugeTechThe Leader In Power Monitoring and Smart Grid SolutionsElectro Industries/GaugeTechThe Leader In Power Monitoring and Smart Grid Solutions
C.3: Testing
You can use any IEC 61850 certified tool to connect to the Nexus® 1500 meter and
test out the IEC 61850 protocol. The figure below shows the IECBrowser (Siemens)
connected to the Nexus® 1500 IEC 61850 Protocol Ethernet Network card.
Doc# E154701 GL- 1Electro Industries/GaugeTechThe Leader In Power Monitoring and Smart Grid Solutions
Glossary
Glossary
0.2 Second Values: These values are the RMS values of the indicated
quantity as calculated after approximately 200
milliseconds (3 cycles) of sampling.
1 Second Values: These values are the RMS values of the indicated
quantity as calculated after one second (60
cycles) of sampling.
Alarm: An event or condition in a meter that can cause a
trigger or call-back to occur.
Annunciator: A short label that identifies particular quantities or
values displayed, for example kWh.
Average (Current): When applied to current values (Amps) the
average is a calculated value that corresponds to
the thermal average over a specified time
interval.
The interval is specified by the user in the meter
profile. The interval is typically 15 minutes.
So, Average Amps is the thermal average of Amps
over the previous 15-minute interval. The thermal
average rises to 90% of the actual value in each
time interval. For example, if a constant 100Amp
load is applied, the thermal average will indicate
90 amps after one time interval, 99 amps after
two time intervals and 99.9 amps after three time
intervals.
Average (Input Pulse When applied to Input Pulse Accumulations, the
Accumulations: “Average” refers to the block (fixed) window
average value of the input pulses.
Doc# E154701 GL- 2Electro Industries/GaugeTechThe Leader In Power Monitoring and Smart Grid Solutions
Glossary
Average (Power): When applied to power values (Watts, VARs, VA),
the average is a calculated value that corresponds
to the thermal average over a specified time
interval.
The interval is specified by the user in the meter
profile. The interval is typically 15 minutes.
So, the Average Watts is the thermal average of
Watts over the previous 15-minute interval. The
thermal average rises to 90% of the actual value
in each time interval. For example, if a constant
100kW load is applied, the thermal average will
indicate 90kW after one time interval, 99kW after
two time intervals and 99.9kW after three time
intervals.
Bit: A unit of computer information equivalent to the
result of a choice between two alternatives (Yes/
No, On/Off, for example).
Or, the physical representation of a bit by an
electrical pulse whose presence or absence
indicates data.
Binary: Relating to a system of numbers having 2 as its
base (digits 0 and 1).
Block Window Avg
(Power): The Block (Fixed) Window Average is the average
power calculated over a user-set time interval,
typically 15 minutes. This calculated average
corresponds to the demand calculations
performed by most electric utilities in monitoring
user power demand. (See Rolling Window
Average.)
Doc# E154701 GL- 3Electro Industries/GaugeTechThe Leader In Power Monitoring and Smart Grid Solutions
Glossary
Byte: A group of 8 binary digits processed as a unit by a
computer (or device) and used especially to
represent an alphanumeric character.
CBEMA Curve: A voltage quality curve established originally by
the Computer Business Equipment Manufacturers
Association. The CBEMA Curve defines voltage
disturbances that could cause malfunction or
damage in microprocessor devices.
The curve is characterized by voltage magnitude
and the duration which the voltage is outside of
tolerance. (See ITIC Curve.)
Channel: The storage of a single value in each interval in a
load profile.
Cold Load Pickup This value is the delay from the time control
power is restored to the time when the user wants
to resume demand accumulation.
CRC Field: Cyclic Redundancy Check Field (Modbus
communication) is an error checksum
calculation that enables a Slave device to
determine if a request packet from a Master
device has been corrupted during transmission. If
the calculated value does not match the value in
the request packet, the Slave ignores the request.
CT (Current) Ratio: A Current Transformer Ratio is used to scale the
value of the current from a secondary value up to
the primary side of an instrument transformer.
Cumulative Demand: The sum of the previous billing period maximum
demand readings at the time of billing period
reset. The maximum demand for the most recent
billing period is added to the previously
Doc# E154701 GL- 4Electro Industries/GaugeTechThe Leader In Power Monitoring and Smart Grid Solutions
Glossary
accumulated total of the maximum demands.
Demand: The average value of power or a similar quantity
over a specified period of time.
Demand Interval: A specified time over which demand is calculated.
Display: User-configurable visual indication of data in a
meter.
DNP 3.0: A robust, non-proprietary protocol based on
existing open standards. DNP 3.0 is used to
operate between various systems in electric and
other utility industries and SCADA networks.
EEPROM: Nonvolatile memory; Electrically Erasable
Programmable Read Only Memory that retains its
data during a power outage without need for a
battery. Also refers to meter’s FLASH memory.
Energy Register: Programmable record that monitors any energy
quantity. Example: Watt-hours, VAR-hours,
VA-hours.
Ethernet: A type of LAN network connection that connects
two or more devices on a common communi-
cations backbone. An Ethernet LAN consists of at
least one hub device (the network backbone) with
multiple devices connected to it in a star configu-
ration. The most common versions of Ethernet in
use are 10BaseT and 100BaseT as defined in
IEEE 802.3 standards. However, several other
versions of Ethernet are also available.
Flicker: Flicker is the sensation that is experienced by the
human visual system when it is subjected to
Doc# E154701 GL- 5Electro Industries/GaugeTechThe Leader In Power Monitoring and Smart Grid Solutions
Glossary
changes occurring in the illumination intensity of
light sources. IEC 61000-4-15 and former IEC
868 describe the methods used to determine
Flicker severity.
Harmonics: Measuring values of the fundamental current and
voltage and percent of the fundamental.
I2T Threshold: Data will not accumulate until current reaches
programmed level.
Integer: Any of the natural numbers, the negatives of
those numbers, or zero.
Invalid Register: In the Nexus® meter’s Modbus Map there are
gaps between Registers. For example, the next
Register after 08320 is 34817. Any unmapped
Register stores no information and is said to be
invalid.
ITIC Curve: An updated version of the CBEMA Curve that
reflects further study into the performance of
microprocessor devices. The curve consists of a
series of steps but still defines combinations of
voltage magnitude and duration that will cause
malfunction or damage.
Ke: kWh per pulse; i.e. the energy.
kWh: Kilowatt hours; kW x demand interval in hours.
KYZ Output: Output where the rate of changes between 1 and
0 reflects the magnitude of a metered quantity.
LCD: Liquid Crystal Display.
Doc# E154701 GL- 6Electro Industries/GaugeTechThe Leader In Power Monitoring and Smart Grid Solutions
Glossary
LED: Light Emitting Diode.
Maximum Demand: The largest demand calculated during any interval
over a billing period.
Modbus ASCII: Alternate version of the Modbus protocol that
utilizes a different data transfer format. This
version is not dependent upon strict timing, as is
the RTU version. This is the best choice for
telecommunications applications (via modems).
Modbus RTU: The most common form of Modbus protocol.
Modbus RTU is an open protocol spoken by many
field devices to enable devices from multiple
vendors to communicate in a common language.
Data is transmitted in a timed binary format,
providing increased throughput and therefore,
increased performance.
Network: A communications connection between two or
more devices to enable those devices to send to
and receive data from one another. In most
applications, the network is either a serial type or
a LAN type.
NVRAM: Nonvolatile Random Access Memory: able to
keep the stored values in memory even during
the loss of circuit or control power. High speed
NVRAM is used in the Nexus® meter to gather
measured information and to insure that no
information is lost.
Optical Port: A port that facilitates infrared communication with
a meter. Using an ANSI C12.13 Type II magnetic
optical communications coupler and an RS232
cable from the coupler to a PC, the meter can be
Doc# E154701 GL- 7Electro Industries/GaugeTechThe Leader In Power Monitoring and Smart Grid Solutions
Glossary
programmed with Communicator EXT software.
Packet: A short fixed-length section of data that is
transmitted as a unit. Example: a serial string of
8-bit bytes.
Percent (%) THD: Percent Total Harmonic Distortion. (See THD.)
Protocol: A language that is spoken between two or more
devices connected on a network.
PT Ratio: Potential Transformer Ratio used to scale the
value of the voltage to the primary side of an
instrument transformer. Also referred to as VT
Ratio.
Pulse: The closing and opening of the circuit of a two-
wire pulse system or the alternate closing and
opening of one side and then the other of a three-
wire system (which is equal to two pulses).
Q Readings: Q is the quantity obtained by lagging the applied
voltage to a wattmeter by 60 degrees. Values are
displayed on the Uncompensated Power and Q
Readings screen.
Doc# E154701 GL- 8Electro Industries/GaugeTechThe Leader In Power Monitoring and Smart Grid Solutions
Glossary
Quadrant
(Programmable Values and
Factors on the Nexus®
meter:) Watt and VAR flow is typically represented using
an X-Y coordinate system. The four corners of the
X-Y plane are referred to as quadrants. Most
power applications label the right hand corner as
the first quadrant and number the remaining
quadrants in a counter-clockwise rotation. Follow-
ing are the positions of the quadrants:
1st - upper right, 2nd - upper left, 3rd - lower left
and 4th - lower right.
Power flow is generally positive in quadrants 1
and 4.
VAR flow is positive in quadrants 1 and 2.
The most common load conditions are:
Quadrant 1 - power flow positive, VAR flow
positive, inductive load, lagging or positive
power factor;
Quadrant 2 - power flow negative, VAR flow
positive, capacitive load, leading or negative
power factor.
Register: An entry or record that stores a small amount of
data.
Register Rollover: A point at which a Register reaches its maximum
value and rolls over to zero.
Reset: Logs are cleared or new (or default) values are
sent to counters or timers.
Rolling Window The Rolling (Sliding) Window Average is the
Average (Power): average power calculated over a user-set time
interval that is derived from a specified number of
sub-intervals, each of a specified time. For
Doc# E154701 GL- 9Electro Industries/GaugeTechThe Leader In Power Monitoring and Smart Grid Solutions
Glossary
example, the average is calculated over a
15-minute interval by calculating the sum of the
average of three consecutive 5-minute intervals.
This demand calculation methodology has been
adopted by several utilities to prevent customer
manipulation of kW demand by simply spreading
peak demand across two intervals.
RS232: A type of serial network connection that connects
two devices to enable communication between
the devices. An RS232 connection connects only
two points. Distance between devices is typically
limited to fairly short runs.
Current standards recommend a maximum of 50
feet but some users have had success with runs
up to 100 feet.
Communications speed is typically in the range of
1200 bits per second to 57,600 bits per second.
RS232 connection can be accomplished using Port
1 of the Nexus® 1250/1252 meter.
RS485: A type of serial network connection that connects
two or more devices to enable communication
between the devices. An RS485 connection allows
multi-drop communication from one to many
points.
Distance between devices is typically limited to
around 2,000 to 3,000 wire feet.
Communications speed is typically in the range of
120 bits per second to 115,000 bits per second.
Sag: A voltage quality event during which the RMS
voltage is lower than normal for a period of time,
typically from 1/2 cycle to 1 minute.
Doc# E154701 GL- 10Electro Industries/GaugeTechThe Leader In Power Monitoring and Smart Grid Solutions
Glossary
Secondary Rated: Any Register or pulse output that does not use
any CT or PT(VT) Ratio.
Serial Port: The type of port used to directly interface with a
device using the RS232 standard.
Swell: A voltage quality event during which the RMS
voltage is higher than normal for a period of time,
typically from 1/2 cycle to 1 minute.
TDD: The Total Demand Distortion of the current
waveform. The ratio of the root-sum-square value
of the harmonic current to the maximum demand
load current. (See equation below.)
NOTE: The TDD displayed in the Harmonics
screen is calculated by Communicator EXT
software, using the Max Average Demand.
THD: Total Harmonic Distortion is the combined effect
of all harmonics measured in a voltage or current.
The THD number is expressed as a percent of the
fundamental. For example, a 3% THD indicates
that the magnitude of all harmonic distortion
measured equals 3% of the magnitude of the
fundamental 60Hz quantity. The %THD displayed
is calculated by your Nexus® meter.
Time Stamp: A stored representation of the time of an event.
Time Stamp can include year, month, day, hour,
minute, second and Daylight Savings Time
indication.
TOU: Time of Use.
2 2 2 22 3 4 5 ... 100%1
L
I I I I xTDD
I
Doc# E154701 GL- 11Electro Industries/GaugeTechThe Leader In Power Monitoring and Smart Grid Solutions
Glossary
TOU: Time of Use.
Uncompensated
Power: VA, Watt and VAR readings not adjusted by
Transformer Loss Compensation.
V2T Threshold: Data will stop accumulating when voltage falls
below programmed level.
Voltage Imbalance: The ratio of the voltage on a phase to the average
voltage on all phases.
Voltage Quality Event: An instance of abnormal voltage on a phase. The
events the meter tracks include sags, swells,
interruptions and imbalances.
VT Ratio: The Voltage Transformer Ratio is used to scale the
value of the voltage to the primary side of an
instrument transformer. Also referred to as PT
Ratio.
Voltage, Vab: Vab, Vbc, Vca are all Phase-to-Phase voltage
measurements. These voltages are measured
between the three phase voltage inputs to the
meter.
Voltage, Van: Van, Vbn, Vcn are all Phase-to-Neutral voltages
applied to the monitor. These voltages are
measured between the phase voltage inputs and
Vn input to the meter. Technologically, these
voltages can be “measured” even when the meter
is in a Delta configuration and there is no connec-
tion to the Vn input. However, in this configu-
ration, these voltages have limited meaning and
are typically not reported.

Doc# E154701 GL- 12Electro Industries/GaugeTechThe Leader In Power Monitoring and Smart Grid Solutions
Glossary
Voltage, Vaux This is the fourth voltage input measured from
between the Vaux and Vref inputs. This input can
be scaled to any value. However, the actual input
voltage to the meter should be of the same
magnitude as the voltages applied to the Va, Vb
and Vc terminals.


![Download [1.10 MB]](https://static.documents.pub/doc/80x56/589f1bfb1a28ab9f498c3b83/download-110-mb.jpg)


