27
NFO Period: 19 th April to 3 rd May, 2021
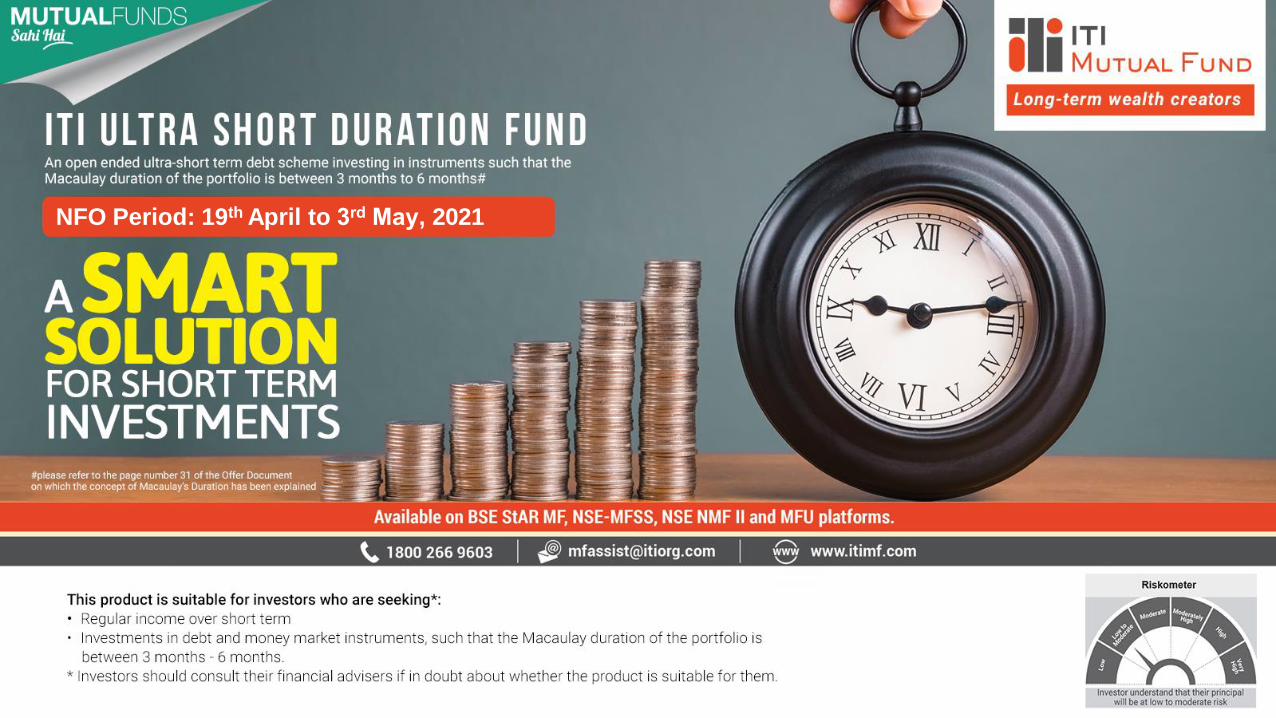
NFO Period: 19th April to 3rd May, 2021
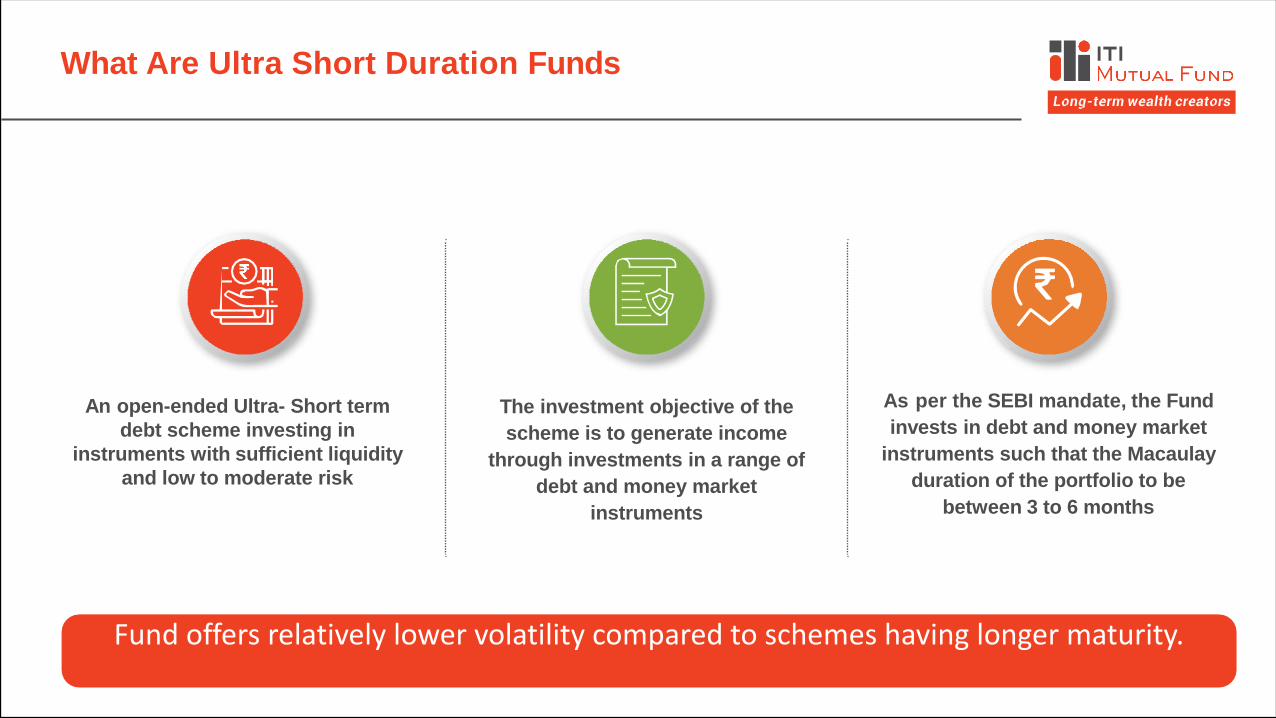
What Are Ultra Short Duration Funds
Fund offers relatively lower volatility compared to schemes having longer maturity.
The investment objective of the
scheme is to generate income
through investments in a range of
debt and money market
instruments
As per the SEBI mandate, the Fund
invests in debt and money market
instruments such that the Macaulay
duration of the portfolio to be
between 3 to 6 months
An open-ended Ultra- Short term
debt scheme investing in
instruments with sufficient liquidity
and low to moderate risk
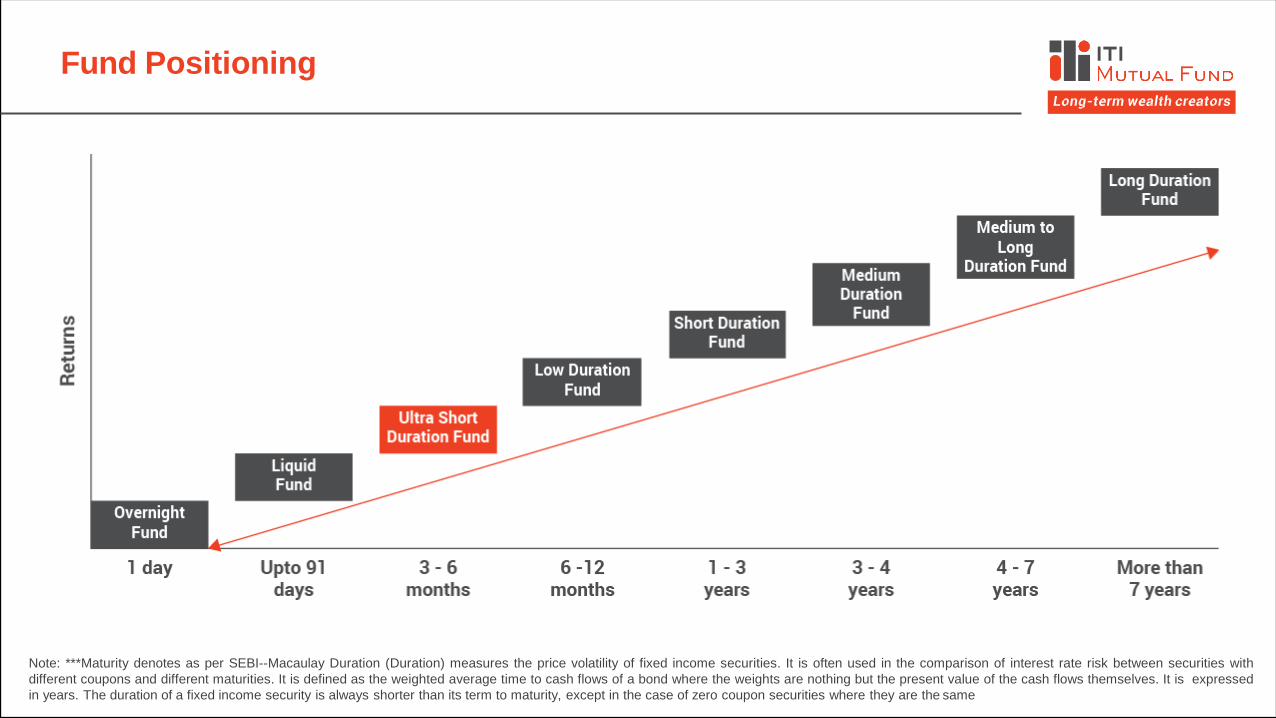
Fund Positioning
Note: ***Maturity denotes as per SEBI--Macaulay Duration (Duration) measures the price volatility of fixed income securities. It is often used in the comparison of interest rate risk between securities with
different coupons and different maturities. It is defined as the weighted average time to cash flows of a bond where the weights are nothing but the present value of the cash flows themselves. It is expressed
in years. The duration of a fixed income security is always shorter than its term to maturity, except in the case of zero coupon securities where they are the same

Ultra Short Duration Fund- Investments Universe
Universe
Examples
Banks’
Certificate of
Deposits / Bonds
• HDFCBank,
• SBI
• ICICI Bank
• AXIS Bank
• Bank ofBaroda
• Indian Bank
• NTPC, GAIL
• EXIM
• NABARD
• PGCIL / Coal India
• IOC/HPCL
• PFC/REC/IRFC
From Groups such as:
• RIL
• HDFC
• SUNDARAM
• TATA,GODREJ
• L&T
• G-Sec
• State Government
Loans (SGL)
• T-Bills
• TREPs,
• Reverse Repo
PSUs & PFIs
Commercial Papers /
Bonds
Corporate
Commercial
Papers / Bonds
Sovereign
Paper/Bonds
Note: The stock(s)/issuer(s) mentioned above are for illustration purposes only and do not constitute any research report/recommendation of the same and the Fund may or may not have any future position in these stock(s)/
issuer(s)
Advantages Of Ultra Short Duration Funds
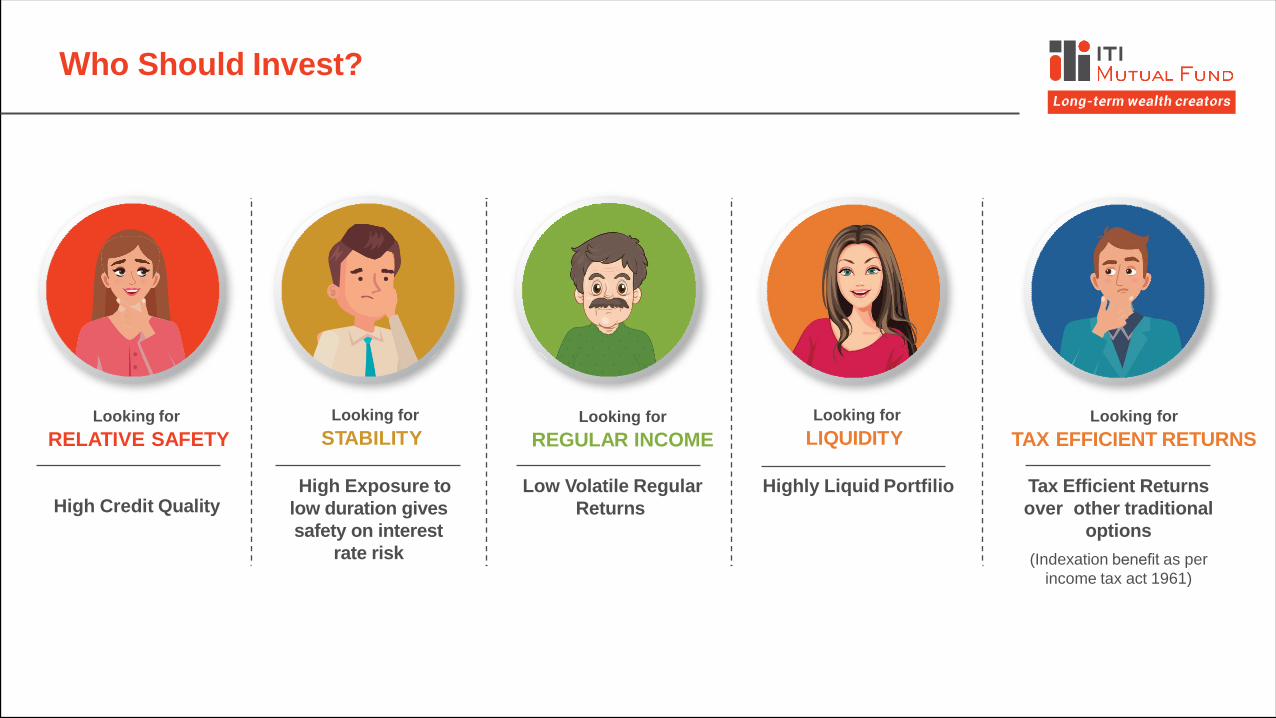
Who Should Invest?
Looking for
RELATIVE SAFETY
High Credit Quality
Looking for
STABILITY
High Exposure to
low duration gives
safety on interest
rate risk
Looking for
REGULAR INCOME
Low Volatile Regular
Returns
Looking for
LIQUIDITY
Highly Liquid Portfilio
Looking for
TAX EFFICIENT RETURNS
Tax Efficient Returns
over other traditional
options
(Indexation benefit as per
income tax act 1961)
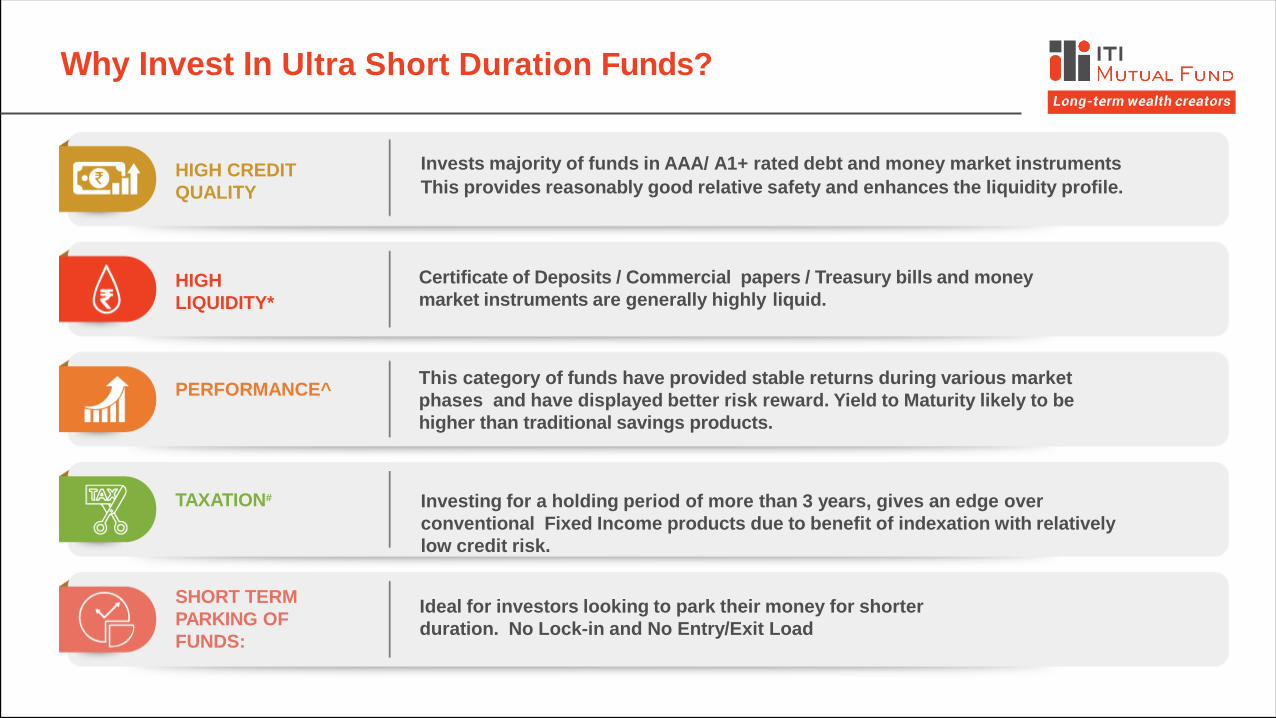
Why Invest In Ultra Short Duration Funds?
HIGH CREDIT
QUALITY
Invests majority of funds in AAA/ A1+ rated debt and money market instruments
This provides reasonably good relative safety and enhances the liquidity profile.
HIGH
LIQUIDITY*
Certificate of Deposits / Commercial papers / Treasury bills and money
market instruments are generally highly liquid.
PERFORMANCE^This category of funds have provided stable returns during various market
phases and have displayed better risk reward. Yield to Maturity likely to be
higher than traditional savings products.
TAXATION# Investing for a holding period of more than 3 years, gives an edge over
conventional Fixed Income products due to benefit of indexation with relatively
low credit risk.
SHORT TERM
PARKING OF
FUNDS:
Ideal for investors looking to park their money for shorter
duration. No Lock-in and No Entry/Exit Load
ITI ULTRA SHORT DURATION FUND

Low Volatile Return
Notes: Returns for less than one year are absolute and above one year are annualized Past performance may or may not sustain in future. The data/performance provided above pertains to the ^Average returns of CRISIL Index
across all categories are considered for analysis and does not in any manner constitute performance of any individual scheme of ITI Mutual Fund.
Source: 31st March 2021
The category has shown encouraging performance in recent times despite volatility in the debt market.
Category Returns 3 Months Returns 6 Months Returns 1 Year Return 3 Years Returns 5 Years Returns 10 Years Returns
Crisil Ultra Short-term Index 0.98% 2.18% 5.41% 6.99% 7.17% 8.17%
Crisil Liquid Index 0.91 1.91 4.61 6.34 6.63 7.62
Crisil Overnight Index 0.79% 1.55% 3.08% 4.87% 5.37% 6.69%
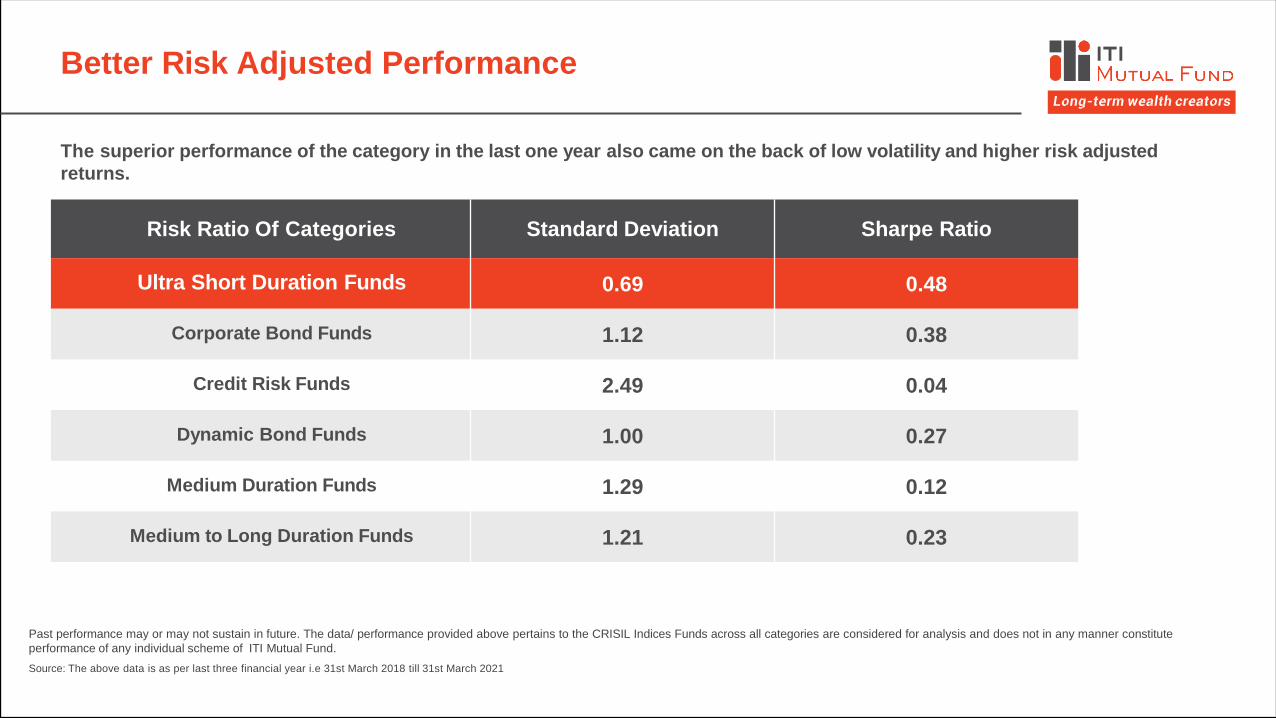
Better Risk Adjusted Performance
Past performance may or may not sustain in future. The data/ performance provided above pertains to the CRISIL Indices Funds across all categories are considered for analysis and does not in any manner constitute
performance of any individual scheme of ITI Mutual Fund.
Source: The above data is as per last three financial year i.e 31st March 2018 till 31st March 2021
The superior performance of the category in the last one year also came on the back of low volatility and higher risk adjusted
returns.
Risk Ratio Of Categories Standard Deviation Sharpe Ratio
Ultra Short Duration Funds 0.69 0.48
Corporate Bond Funds 1.12 0.38
Credit Risk Funds 2.49 0.04
Dynamic Bond Funds 1.00 0.27
Medium Duration Funds 1.29 0.12
Medium to Long Duration Funds 1.21 0.23
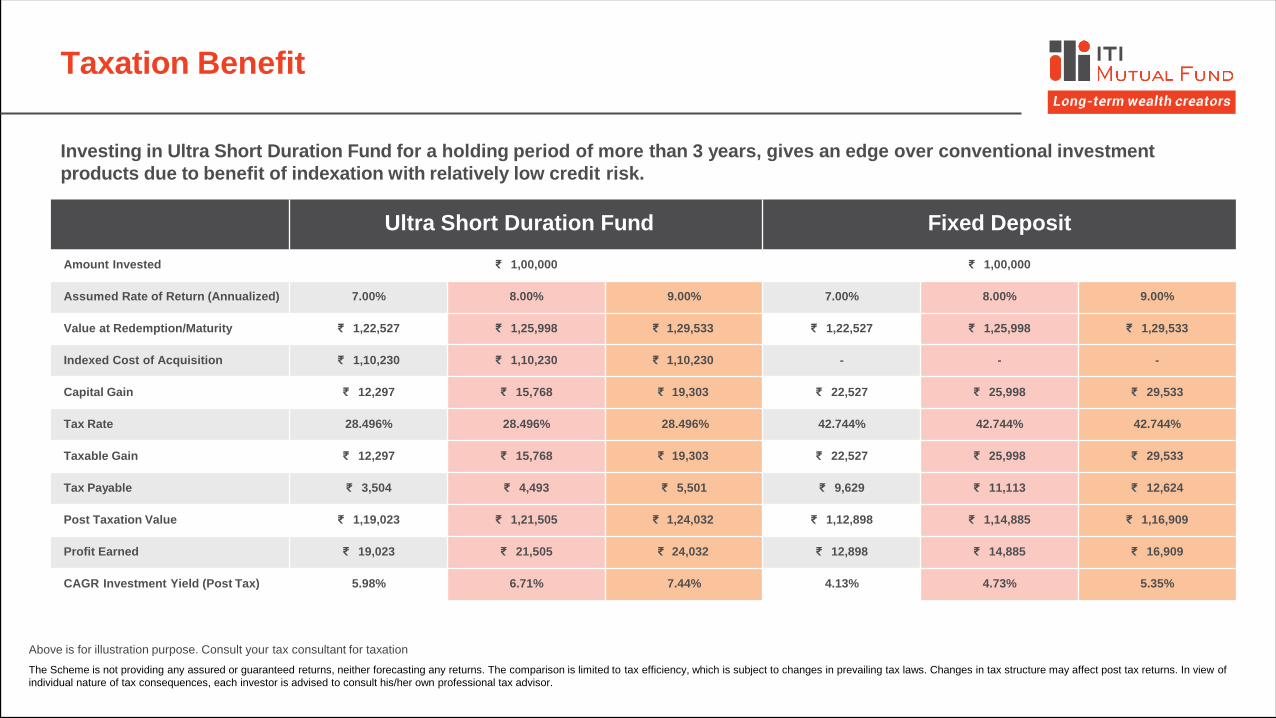
Taxation Benefit
Above is for illustration purpose. Consult your tax consultant for taxation
The Scheme is not providing any assured or guaranteed returns, neither forecasting any returns. The comparison is limited to tax efficiency, which is subject to changes in prevailing tax laws. Changes in tax structure may affect post tax returns. In view of
individual nature of tax consequences, each investor is advised to consult his/her own professional tax advisor.
Investing in Ultra Short Duration Fund for a holding period of more than 3 years, gives an edge over conventional investment
products due to benefit of indexation with relatively low credit risk.
Ultra Short Duration Fund Fixed Deposit
Amount Invested ₹ 1,00,000 ₹ 1,00,000
Assumed Rate of Return (Annualized) 7.00% 8.00% 9.00% 7.00% 8.00% 9.00%
Value at Redemption/Maturity ₹ 1,22,527 ₹ 1,25,998 ₹ 1,29,533 ₹ 1,22,527 ₹ 1,25,998 ₹ 1,29,533
Indexed Cost of Acquisition ₹ 1,10,230 ₹ 1,10,230 ₹ 1,10,230 - - -
Capital Gain ₹ 12,297 ₹ 15,768 ₹ 19,303 ₹ 22,527 ₹ 25,998 ₹ 29,533
Tax Rate 28.496% 28.496% 28.496% 42.744% 42.744% 42.744%
Taxable Gain ₹ 12,297 ₹ 15,768 ₹ 19,303 ₹ 22,527 ₹ 25,998 ₹ 29,533
Tax Payable ₹ 3,504 ₹ 4,493 ₹ 5,501 ₹ 9,629 ₹ 11,113 ₹ 12,624
Post Taxation Value ₹ 1,19,023 ₹ 1,21,505 ₹ 1,24,032 ₹ 1,12,898 ₹ 1,14,885 ₹ 1,16,909
Profit Earned ₹ 19,023 ₹ 21,505 ₹ 24,032 ₹ 12,898 ₹ 14,885 ₹ 16,909
CAGR Investment Yield (Post Tax) 5.98% 6.71% 7.44% 4.13% 4.73% 5.35%
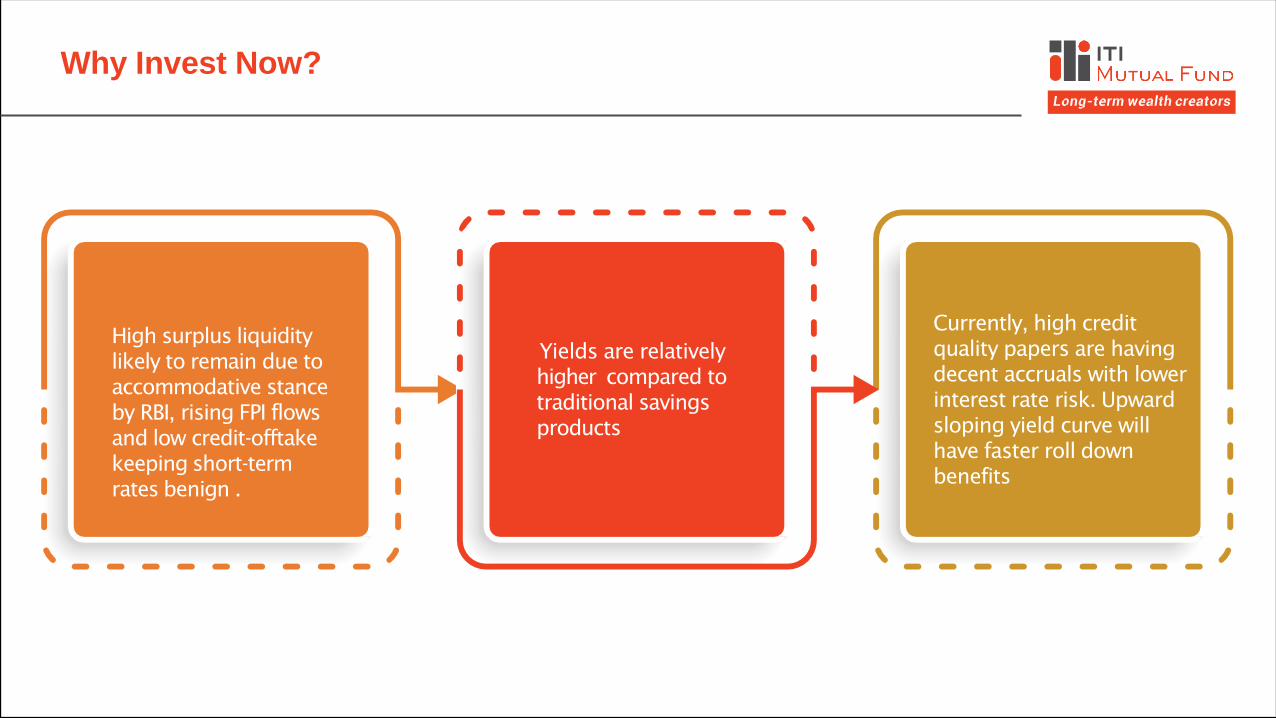
Why Invest Now?
High surplus liquidity
likely to remain due to
accommodative stance
by RBI, rising FPI flows
and low credit-offtake
keeping short-term
rates benign .
Yields are relatively
higher compared to
traditional savings
products
Currently, high credit
quality papers are having
decent accruals with lower
interest rate risk. Upward
sloping yield curve will
have faster roll down
benefits
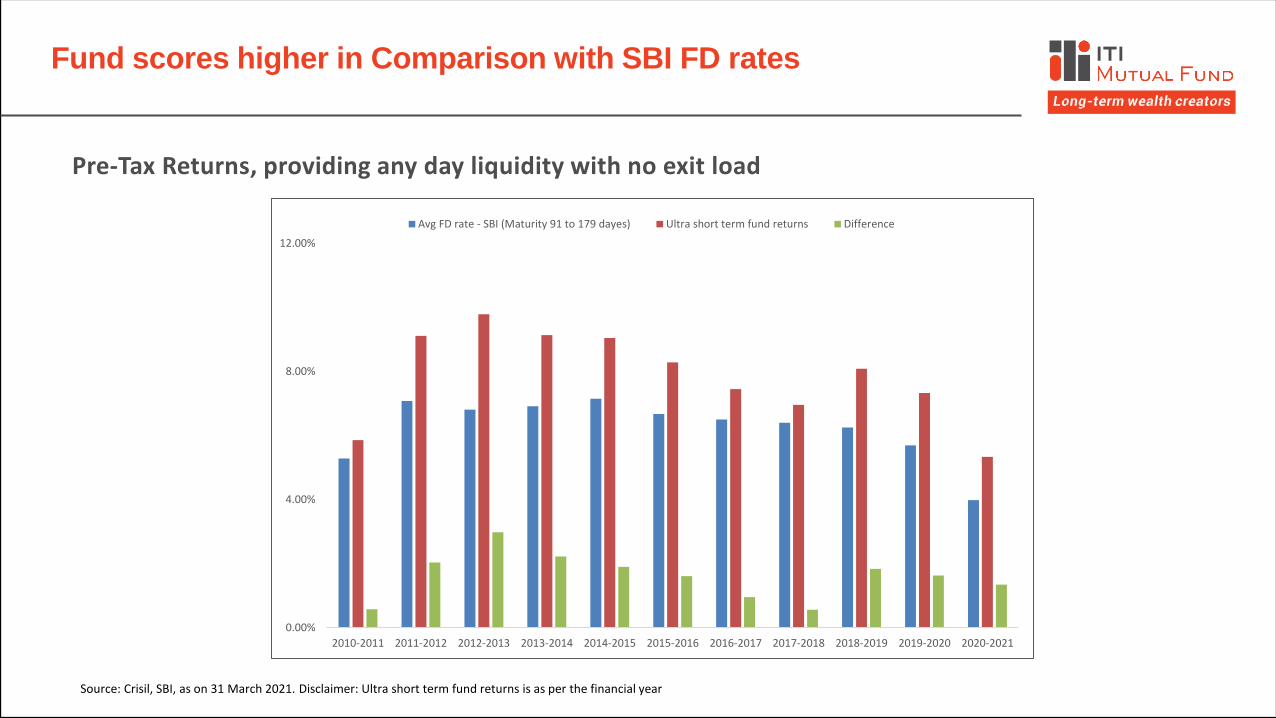
Fund scores higher in Comparison with SBI FD rates
Pre-Tax Returns, providing any day liquidity with no exit load
Source: Crisil, SBI, as on 31 March 2021. Disclaimer: Ultra short term fund returns is as per the financial year
0.00%
4.00%
8.00%
12.00%
2010-2011 2011-2012 2012-2013 2013-2014 2014-2015 2015-2016 2016-2017 2017-2018 2018-2019 2019-2020 2020-2021
Avg FD rate - SBI (Maturity 91 to 179 dayes) Ultra short term fund returns Difference
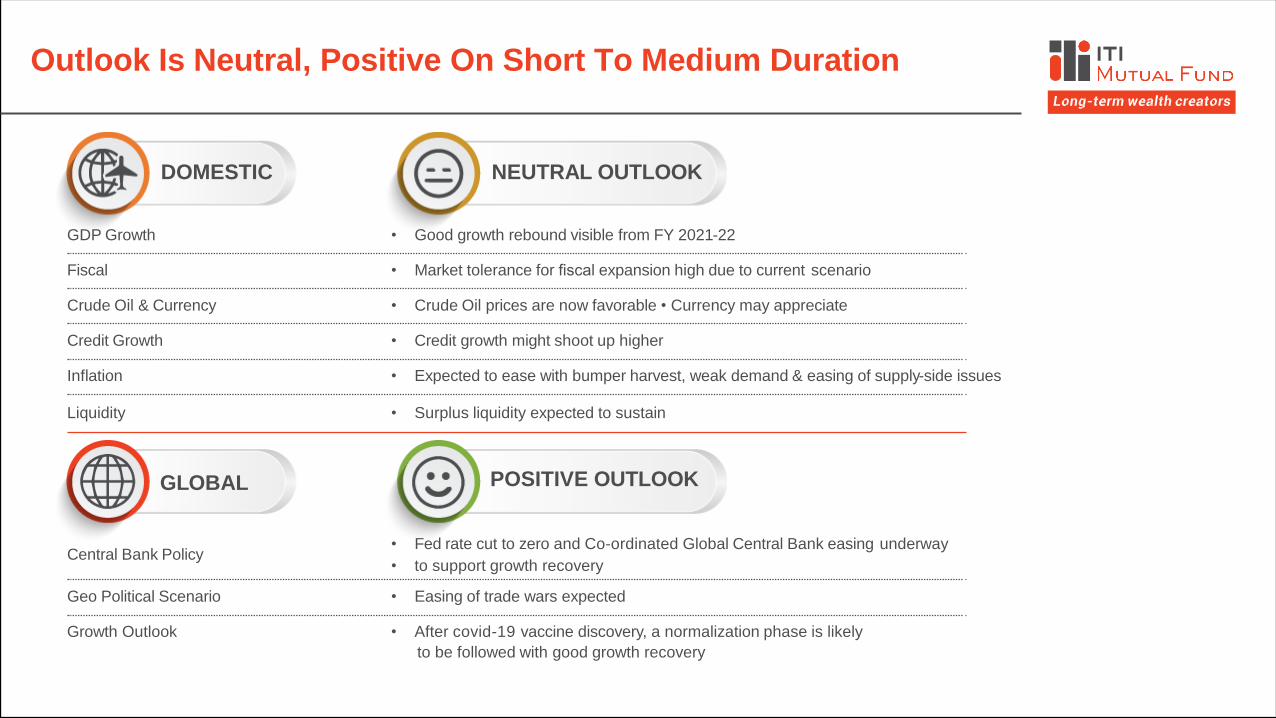
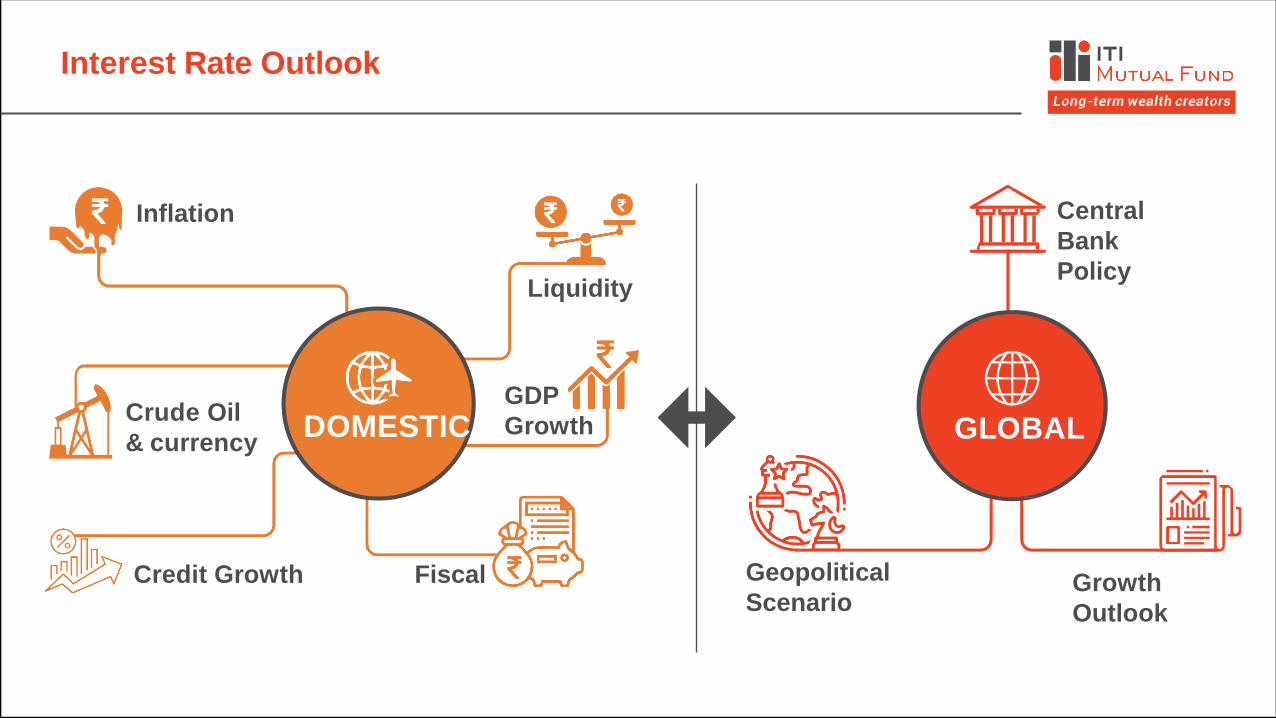
Outlook Is Neutral, Positive On Short To Medium Duration
GLOBAL
DOMESTIC NEUTRAL OUTLOOK
POSITIVE OUTLOOK
GDP Growth
Fiscal
Crude Oil & Currency
Credit Growth
Inflation
Liquidity
• Good growth rebound visible from FY 2021-22
• Market tolerance for fiscal expansion high due to current scenario
• Crude Oil prices are now favorable • Currency may appreciate
• Credit growth might shoot up higher
• Expected to ease with bumper harvest, weak demand & easing of supply-side issues
• Surplus liquidity expected to sustain
Central Bank Policy
Geo Political Scenario
• Fed rate cut to zero and Co-ordinated Global Central Bank easing underway
• to support growth recovery
• Easing of trade wars expected
Growth Outlook • After covid-19 vaccine discovery, a normalization phase is likely
to be followed with good growth recovery
Notes: The above is the current approach of the scheme and may change in future depending on the market conditions
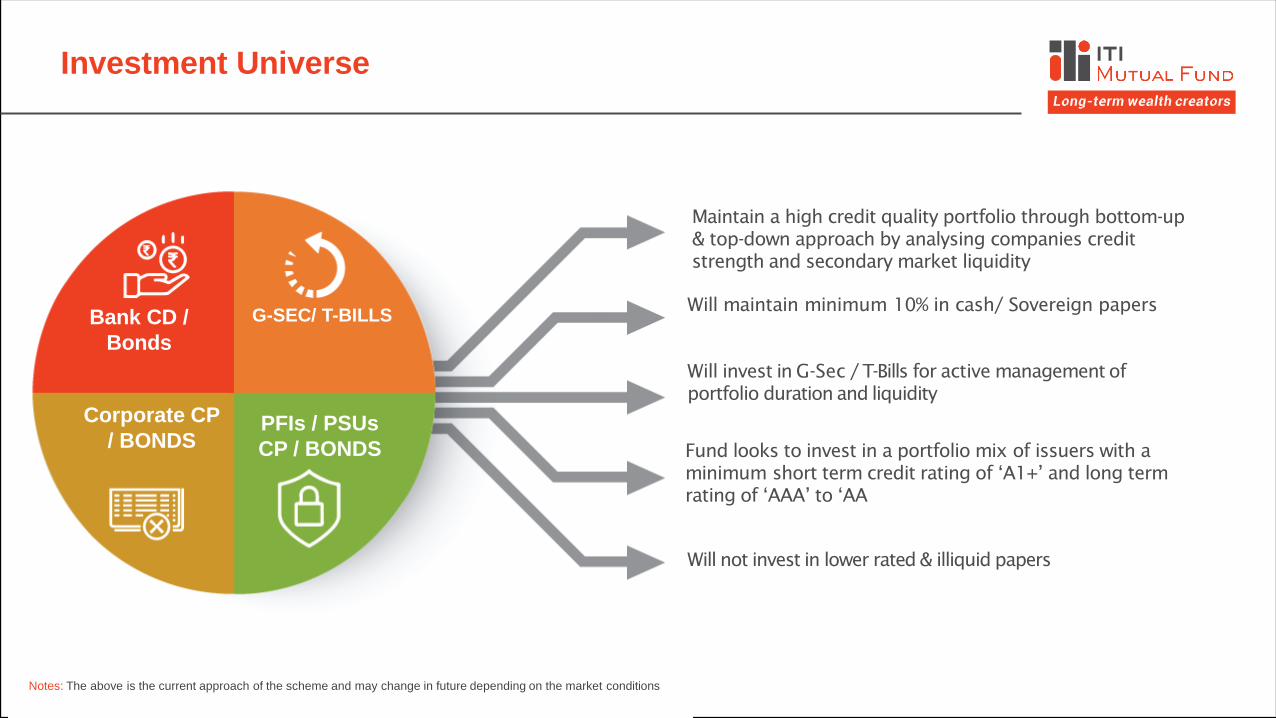
Investment Universe
Maintain a high credit quality portfolio through bottom-up
& top-down approach by analysing companies credit
strength and secondary market liquidity
Will maintain minimum 10% in cash/ Sovereign papers
Will invest in G-Sec / T-Bills for active management of
portfolio duration and liquidity
Fund looks to invest in a portfolio mix of issuers with a
minimum short term credit rating of ‘A1+’ and long term
rating of ‘AAA’ to ‘AA
Will not invest in lower rated & illiquid papers
Bank CD /
Bonds
Corporate CP
/ BONDS
G-SEC/ T-BILLS
PFIs / PSUs
CP / BONDS

Notes: The above is the current approach of the scheme and may change in future depending on the market conditions
Market Outlook
Bank CD /
Bonds
Corporate CP
/ BONDS
G-SEC/ T-BILLS
PFI / PSU CP /
BONDS
• RBI likely to maintain accommodative stance over the medium term
• Inflation to remain in the upper half of 2%-6% corridor, but do not foresee a rate hike in CY2021
• Staggered unwinding of COVID led system liquidity measures expected to gradually shift
yield curve anchor from the current reverse repo rate to the repo rate
• Short end of yield curve reasonably well positioned for this anticipated transition.
• System liquidity to continue to remain in significant surplus as compared to pre COVID era.
• Fiscal deficit glide path indicates that budget borrowings to remain elevated over medium term
• Central Bank likely to continue to “anchor” long bond yields and “allow” gradual hardening.
• OMOs and “Operation Twist” from RBI to continue in FY2022
• Reasonable probability of inclusion of India Government Bonds (GSecs) in Global Bond Indices
• Passive bond inflows will be bond supportive
• Expect markets to remain volatile as compared to CY2020, but also provide tactical opportunities.

Duration Outlook
Scenario Duration Management
GLOBAL DOMESTIC
Positive
Neutral /Positive
Neutral/Negative
Negative
Negative
Positive
Positive
Neutral /Positive
Neutral/Negative
Positive
Negative
Negative
Aggressive
Moderate
Cautious
Moderate/ Cautious
Protective
Defensive
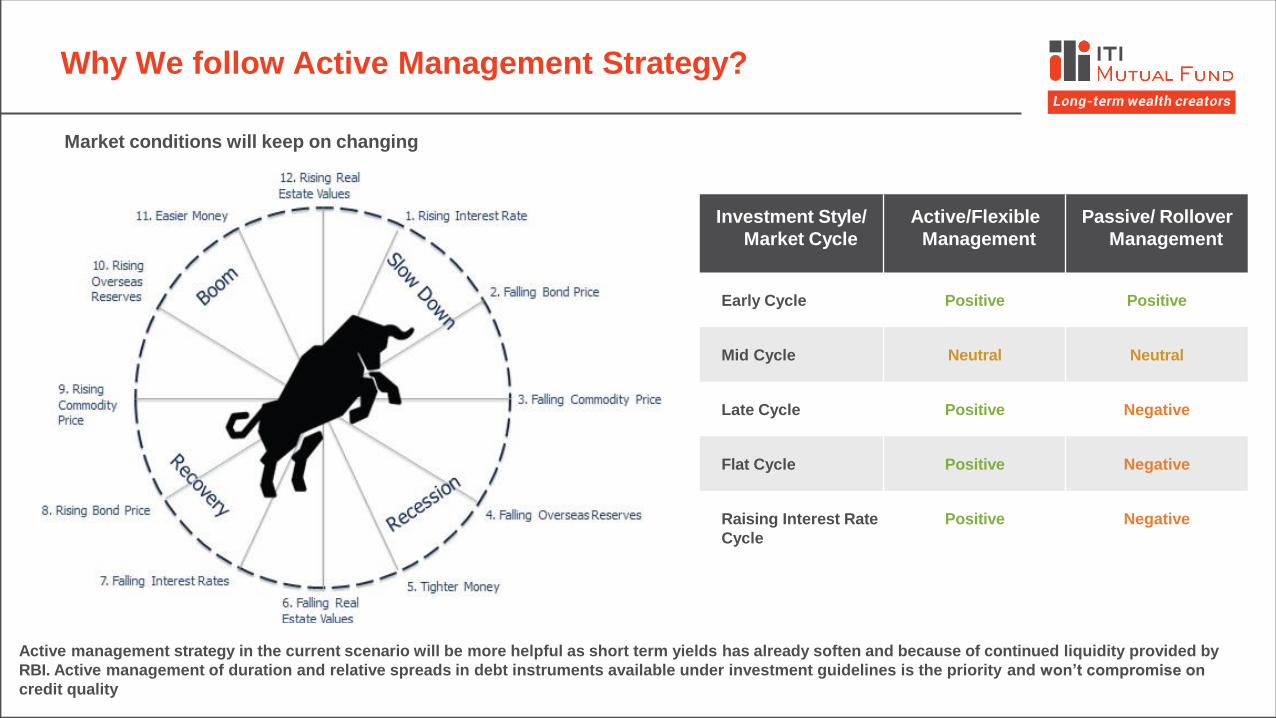
Why We follow Active Management Strategy?
Investment Style/
Market Cycle
Active/Flexible
Management
Passive/ Rollover
Management
Early Cycle Positive Positive
Mid Cycle Neutral Neutral
Late Cycle Positive Negative
Flat Cycle Positive Negative
Raising Interest Rate
Cycle
Positive Negative
Active management strategy in the current scenario will be more helpful as short term yields has already soften and because of continued liquidity provided by
RBI. Active management of duration and relative spreads in debt instruments available under investment guidelines is the priority and won’t compromise on
credit quality
Market conditions will keep on changing
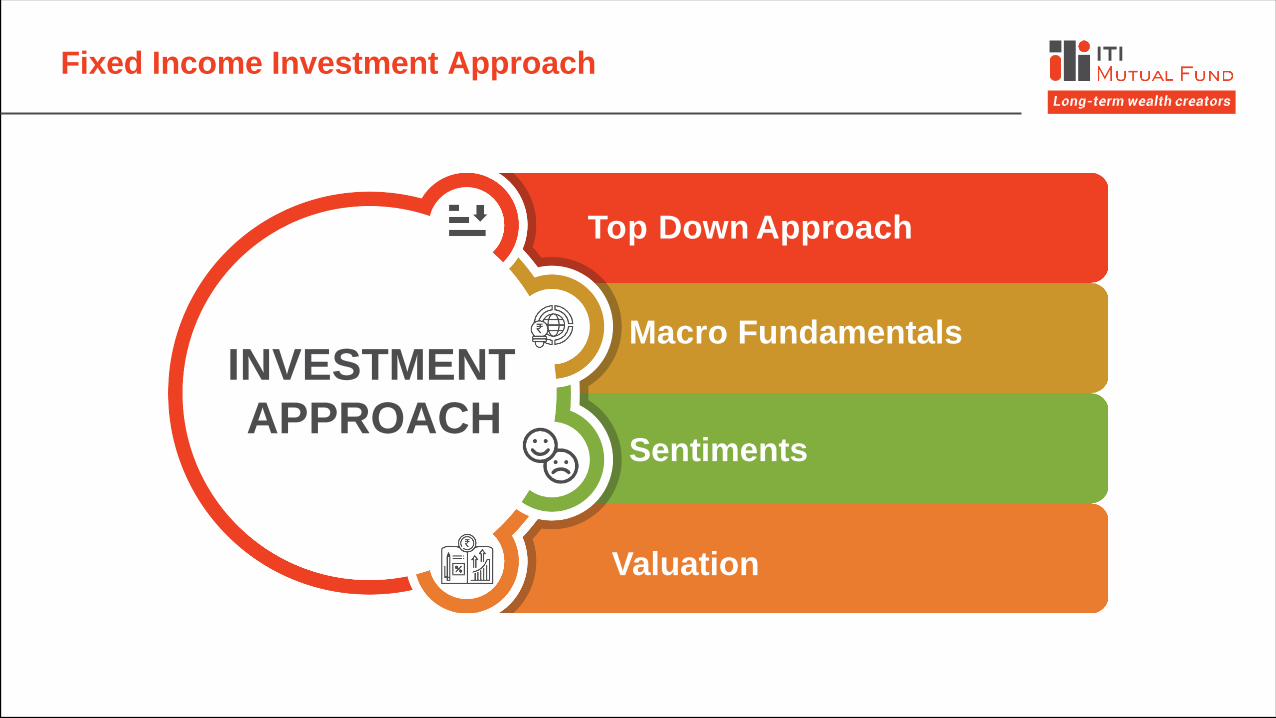
Fixed Income Investment Approach
Top Down Approach
Macro Fundamentals
Sentiments
Valuation
INVESTMENT
APPROACH
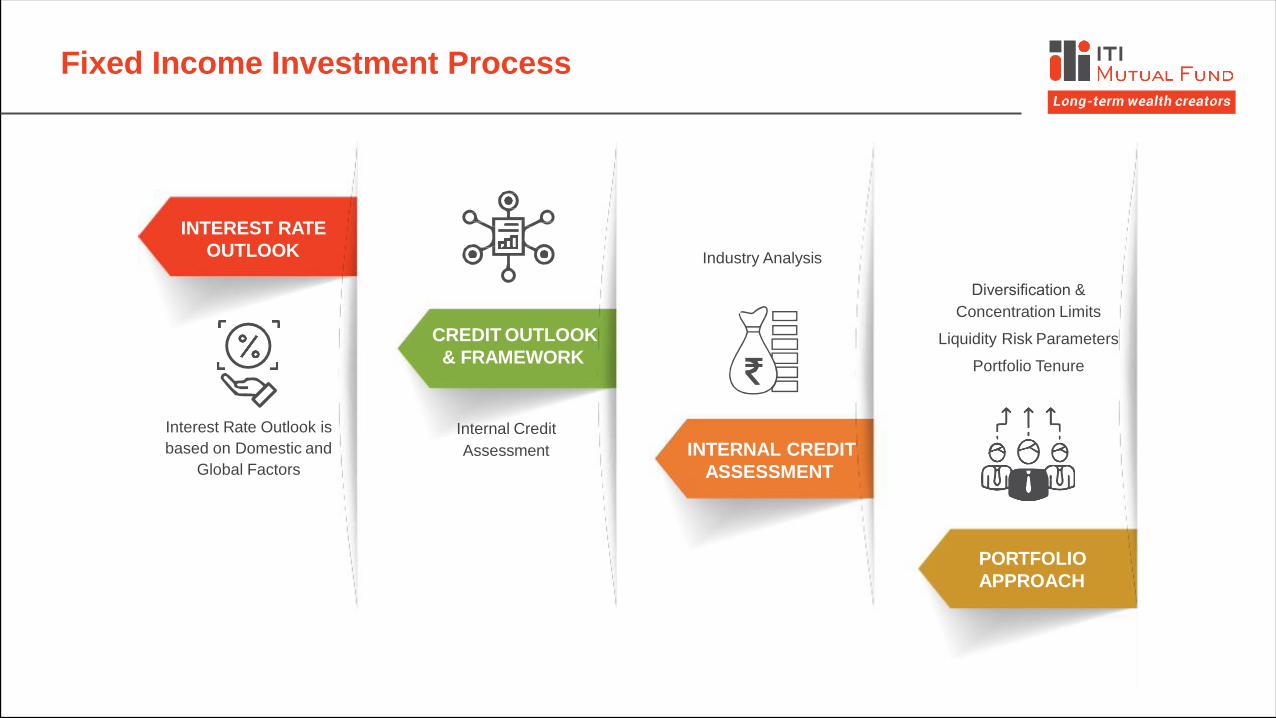
Fixed Income Investment Process
INTEREST RATE
OUTLOOK
Interest Rate Outlook is
based on Domestic and
Global Factors
CREDIT OUTLOOK
& FRAMEWORK
Internal Credit
Assessment INTERNAL CREDIT
ASSESSMENT
Industry Analysis
PORTFOLIO
APPROACH
Diversification &
Concentration Limits
Liquidity Risk Parameters
Portfolio Tenure
Interest Rate Outlook
DOMESTIC GLOBAL
Inflation
Liquidity
Central
Bank
Policy
Geopolitical
ScenarioGrowth
Outlook
GDP
Growth
Fiscal
Crude Oil
& currency
Credit Growth
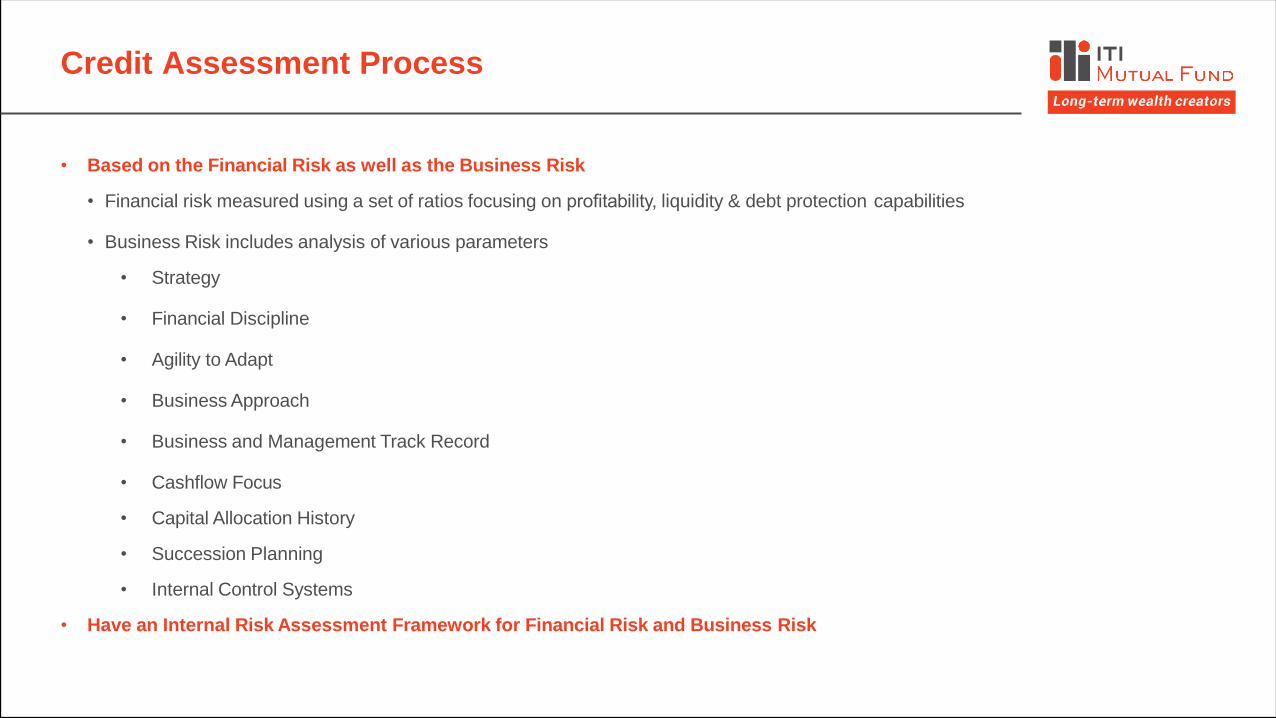
Credit Assessment Process
• Based on the Financial Risk as well as the Business Risk
• Financial risk measured using a set of ratios focusing on profitability, liquidity & debt protection capabilities
• Business Risk includes analysis of various parameters
• Strategy
• Financial Discipline
• Agility to Adapt
• Business Approach
• Business and Management Track Record
• Cashflow Focus
• Capital Allocation History
• Succession Planning
• Internal Control Systems
• Have an Internal Risk Assessment Framework for Financial Risk and Business Risk
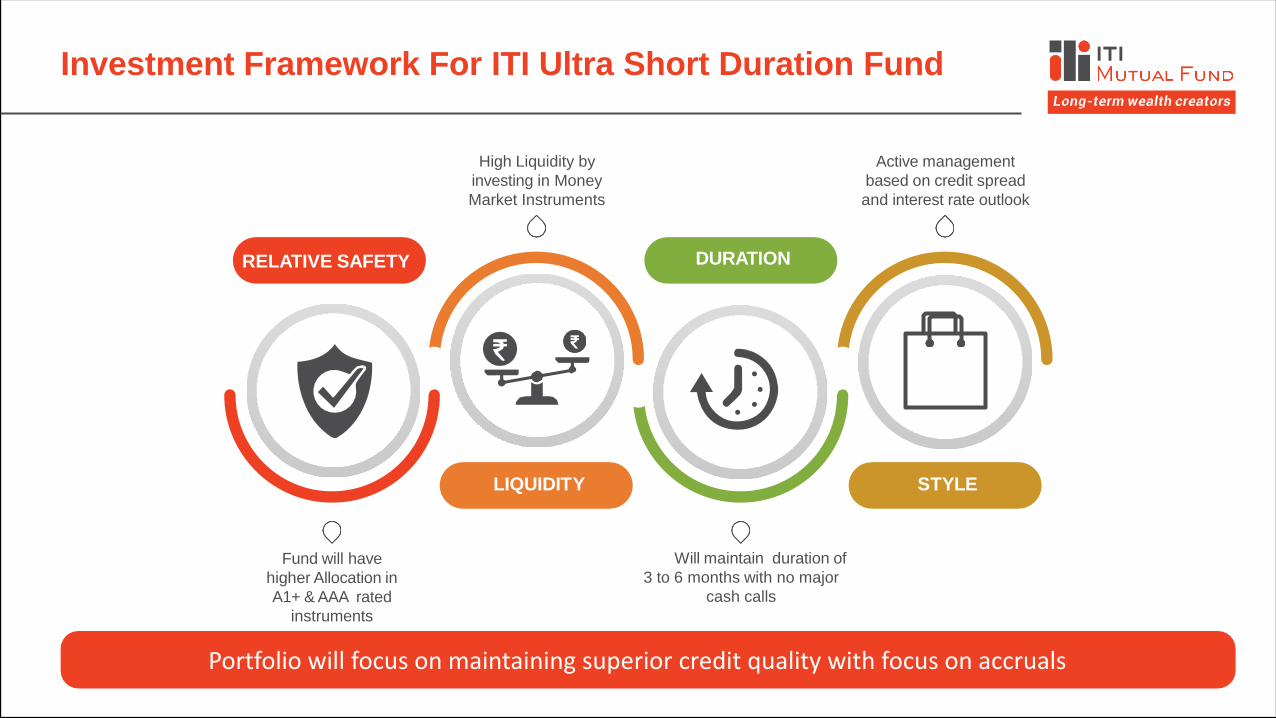
Investment Framework For ITI Ultra Short Duration Fund
Portfolio will focus on maintaining superior credit quality with focus on accruals
Fund will have
higher Allocation in
A1+ & AAA rated
instruments
High Liquidity by
investing in Money
Market Instruments
Will maintain duration of
3 to 6 months with no major
cash calls
Active management
based on credit spread
and interest rate outlook
RELATIVE SAFETY
LIQUIDITY
DURATION
STYLE
Notes: The above is the current approach of the scheme and may change in future depending on the market conditions
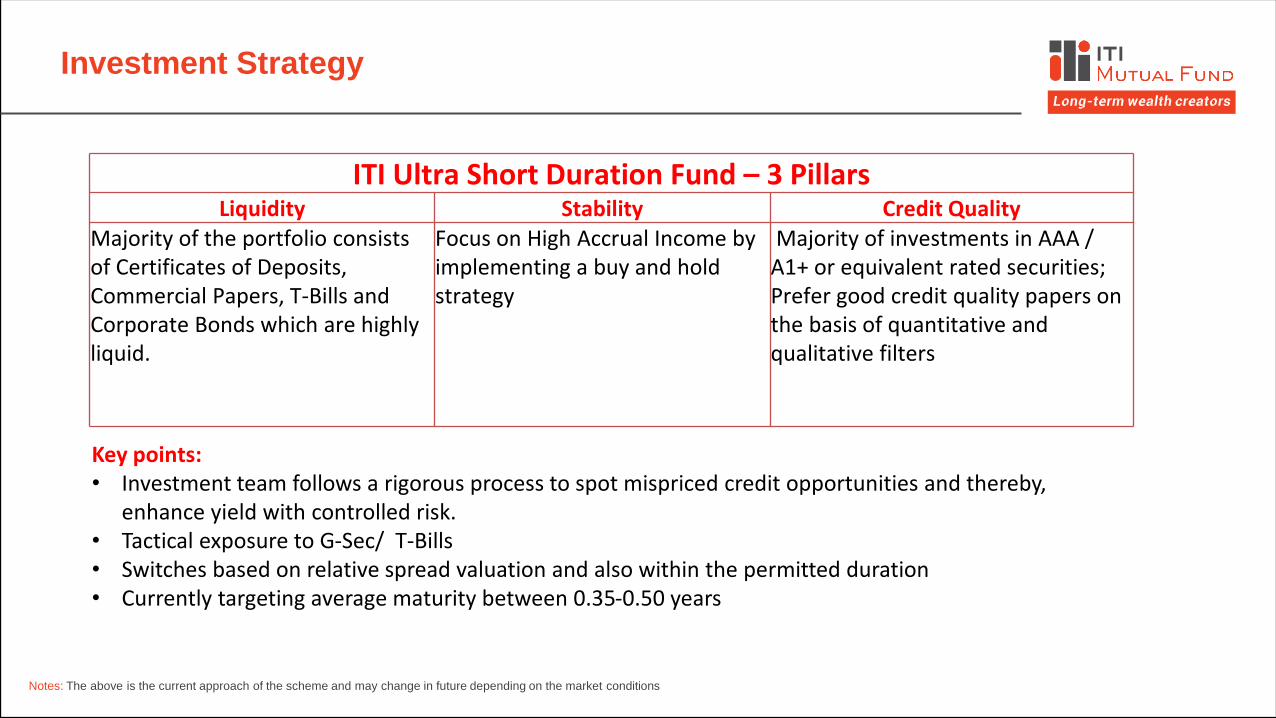
Investment Strategy
Bank CD /
Bonds
G-SEC/ T-BILLS
PFI / PSU CP /
BONDS
ITI Ultra Short Duration Fund – 3 PillarsLiquidity Stability Credit Quality
Majority of the portfolio consists of Certificates of Deposits, Commercial Papers, T-Bills and Corporate Bonds which are highly liquid.
Focus on High Accrual Income by implementing a buy and hold strategy
Majority of investments in AAA / A1+ or equivalent rated securities; Prefer good credit quality papers on the basis of quantitative and qualitative filters
Key points:• Investment team follows a rigorous process to spot mispriced credit opportunities and thereby,
enhance yield with controlled risk.• Tactical exposure to G-Sec/ T-Bills• Switches based on relative spread valuation and also within the permitted duration • Currently targeting average maturity between 0.35-0.50 years
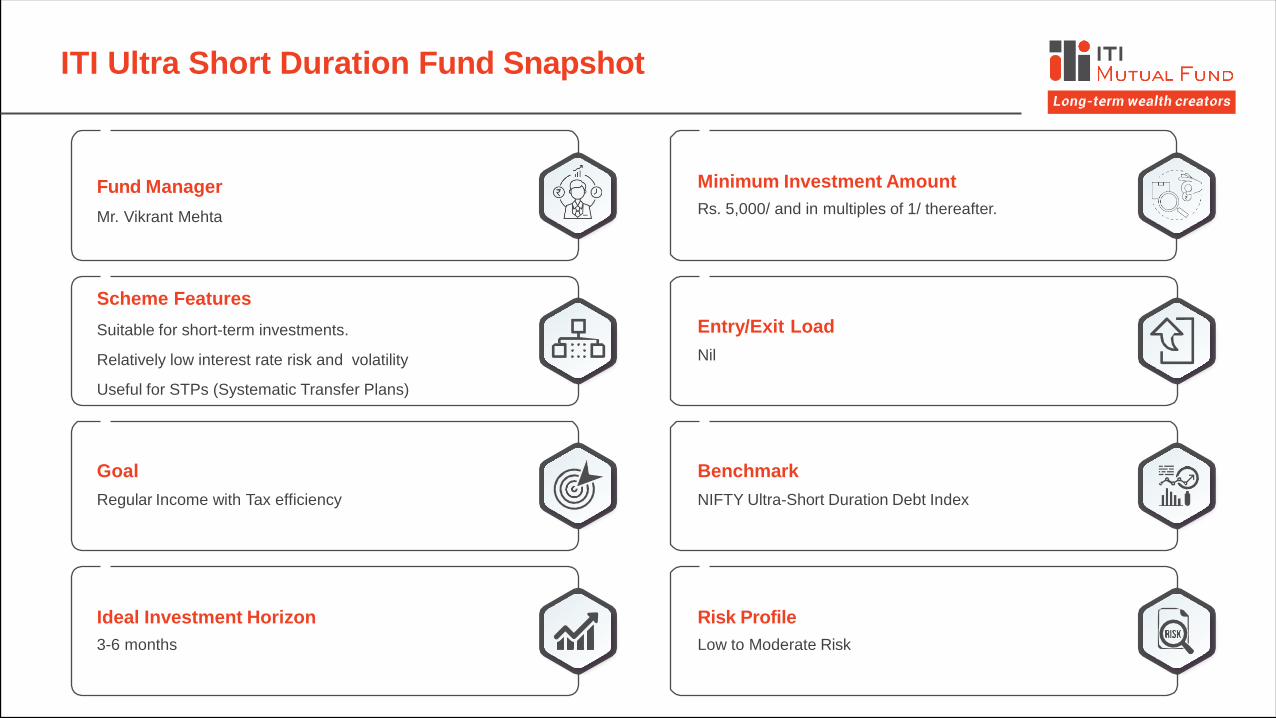
ITI Ultra Short Duration Fund Snapshot
Benchmark
NIFTY Ultra-Short Duration Debt Index
Risk Profile
Low to Moderate Risk
Entry/Exit Load
Nil
Minimum Investment Amount
Rs. 5,000/ and in multiples of 1/ thereafter.
Fund Manager
Mr. Vikrant Mehta
Scheme Features
Suitable for short-term investments.
Relatively low interest rate risk and volatility
Useful for STPs (Systematic Transfer Plans)
Goal
Regular Income with Tax efficiency
Ideal Investment Horizon
3-6 months
www.itimf.com
Toll Free Number 1800 266 9603 | [email protected]
All figures and data given in the document are dated unless stated otherwise. In the preparation of the material contained in this document, the AMC has used
information that is publicly available, including information developed in-house. However, the AMC does not warrant the accuracy, reasonableness and/ or
completeness of anyinformation.
The information provided is not intended to be used by investors as the sole basis for investment decisions, who must make their own investment decisions,
based on their own investment objectives, financial positions and needs of specific investor.
Investors are advised to consult their own legal tax and financial advisors to determine possible tax, legal and other financial implication or consequence of
subscribing to the units of ITI Mutual Fund. The information contained herein should not be construed as a forecast or promise nor should it be considered
as an investmentadvice.
The AMC (including its affiliates), the Mutual Fund, the trust and any of its officers, directors, personnel and employees, shall not liable for any loss, damage
of any nature, including but not limited to direct, indirect, punitive, special, exemplary, consequential, as also any loss of profit in any way arising from the use
of this material in anymanner.
Disclaimers
Mutual Fund investments are subject to market risks, read all scheme related documents carefully

THANK YOU


![Plzog nfO{km OG:of ]/]G; sDkgL lnld6 ]8 - Asian Life Report Aa... · Plzog nfO{km OG:of ]/]G; sDkgL lnld6 ]8 o; Plzog nfO{km OG:of ]/]G; ... Life Insurance Company Plzog nfO{km OG:of](https://static.documents.pub/doc/80x56/5b5023bc7f8b9a1b6e8da854/plzog-nfokm-ogof-g-sdkgl-lnld6-8-asian-report-aa-plzog-nfokm-ogof.jpg)


