J. Serb. Chem. Soc. 74 (3) 331–347 (2009) UDC 666.942:620.193:546.226:519.87 JSCS–3835 Original scientific paper doi: 10.2298/JSC0903331M 331 (NH 4 ) 2 SO 4 corrosion of cement in concrete analyzed by an improved mathematical model SAŠA MILETIĆ 1 * , MIRJANA DJURIĆ 2 , ANDJELKA MIHAJLOV 3 , DJORDJE BAŠIĆ 3 and DJORDJE JANAĆKOVIĆ 4# 1 Galenika Fitofarmacija, Batajnički drum b.b., 11080 Zemun, 2 Faculty of Technology, University of Novi Sad, 21000 Novi Sad, Bul. Cara Lazara 1, 3 Faculty of Technical Sciences, University of Novi Sad, 21000 Novi Sad, Trg Dositeja Obradovića 6 and 4 Faculty of Technology and Metallurgy, University of Belgrade, 11000 Belgrade, Karnegijeva 4, Serbia (Received 18 July, revised 21 October 2008) Abstract: This paper gives a critical analysis of the equation that predicts and estimates the progress of degradation for various building materials, recently proposed by Matsufuji et al. 1 After the analysis, the paper suggests an improve- ed mathematical model, particularly for the modeling of sulfate corrosion. Ex- periments were performed with two samples of Portland cement and two sam- ples of Portland cement with 30 % coal ash. The samples were immersed into a 10 % (NH 4 ) 2 SO 4 solution and the concentration of - 2 4 SO in the solution and the material was measured. As a parameter that quantifies cement degradation, the quantity of bonded - 2 4 SO was suggested. According to the obtained data, ma- thematical models for the description of sulfate corrosion were defined for all the examined samples. The models were applied for the analysis of the be- havior of ash and non-ash containing samples. They allowed a better expla- nation of degradation which occurred during the investigated time period and even further they showed that ash systems were significantly more resistant to sulfate corrosion. Keywords: sulfate; corrosion; Portland cement; coal fly ash; mathematical model. INTRODUCTION Degradation of concrete is a serious problem mostly caused by various pa- rallel and/or consecutive chemical reactions and related physical changes. The term sulfate corrosion means the effect of aggressive − 2 4 SO from the environment on the concrete. The response of a concrete on this aggression depends on its composition and structure. A certain number of different compounds might ap- pear as products (such as gypsum or its anhydrite, ettringite, calcium silicate sul- * Corresponding author. E-mail: [email protected]# Serbian Chemical Society member. 2009 Copyright (CC) SCS
Transcript
J. Serb. Chem. Soc. 74 (3) 331–347 (2009) UDC 666.942:620.193:546.226:519.87 JSCS–3835 Original scientific paper
doi: 10.2298/JSC0903331M 331
(NH4)2SO4 corrosion of cement in concrete analyzed by an improved mathematical model
1Galenika Fitofarmacija, Batajnički drum b.b., 11080 Zemun, 2Faculty of Technology, University of Novi Sad, 21000 Novi Sad, Bul. Cara Lazara 1, 3Faculty of Technical Sciences, University of Novi Sad, 21000 Novi Sad, Trg Dositeja Obradovića 6 and
4Faculty of Technology and Metallurgy, University of Belgrade, 11000 Belgrade, Karnegijeva 4, Serbia
(Received 18 July, revised 21 October 2008)
Abstract: This paper gives a critical analysis of the equation that predicts and estimates the progress of degradation for various building materials, recently proposed by Matsufuji et al.1 After the analysis, the paper suggests an improve-ed mathematical model, particularly for the modeling of sulfate corrosion. Ex-periments were performed with two samples of Portland cement and two sam-ples of Portland cement with 30 % coal ash. The samples were immersed into a 10 % (NH4)2SO4 solution and the concentration of -2
4SO in the solution and the material was measured. As a parameter that quantifies cement degradation, the quantity of bonded -2
4SO was suggested. According to the obtained data, ma-thematical models for the description of sulfate corrosion were defined for all the examined samples. The models were applied for the analysis of the be-havior of ash and non-ash containing samples. They allowed a better expla-nation of degradation which occurred during the investigated time period and even further they showed that ash systems were significantly more resistant to sulfate corrosion.
Degradation of concrete is a serious problem mostly caused by various pa-rallel and/or consecutive chemical reactions and related physical changes. The term sulfate corrosion means the effect of aggressive −2
4SO from the environment on the concrete. The response of a concrete on this aggression depends on its composition and structure. A certain number of different compounds might ap-pear as products (such as gypsum or its anhydrite, ettringite, calcium silicate sul-
* Corresponding author. E-mail: [email protected] # Serbian Chemical Society member.
2009 Copyright (CC) SCS
332 MILETIĆ et al.
fate carbonate hydrate – thaumasite, etc.) which are undesirable for various re-asons.2–5 They can provoke further chemical reactions and/or undergo dissolu-tion, thus promoting degradation. The newly formed compounds can also change the volume of the system. This causes the appearance of smaller or larger cracks, due to the generated deformation stresses.
On the other hand, a description of the degradation processes by an adequate mathematical model provides a useful tool for investigating the phenomenon.6 Mathematical models enable a kind of generalization when they are applied to analogous systems. Once defined, a mathematical model can be used for nume-rical simulations of the response of a material to variable environmental condi-tions. The results of such a simulation can also be used for an optimization. For example, the quantities of a particular raw material which should be used (in the case of products obtained by blending) might be suggested in order to obtain products with desired features.
The formulation of rigorous mathematical models requires accurate know-ledge of the mechanisms of deterioration, which is not always the case. Various assumptions, simplifications and idealizations very often have to be accepted, which leads to approximate models. Typical examples are models defined by statistical processing of measured data. The necessary source of information is an experiment which simulates the degradation.7,8 Quantification of the degradation processes are obtained by employing numerous experimental techniques and me-thods. In the case of sulfate corrosion, the classical method of chemical analysis is suggested for determining the concentration of −2
4SO in the solution. The methods for characterization of the final products are also suitable. For example, a method for measuring flexural strength, when comparatively applied to corro-ded and uncorroded samples, can give essential information.
This paper gives a contribution to mathematical modeling of sulfate corro-sion of cements and also analyses the behavior of four chosen samples by apply-ing the suggested model.
THEORY
Model of Matsufuji, Koyama and Harada1
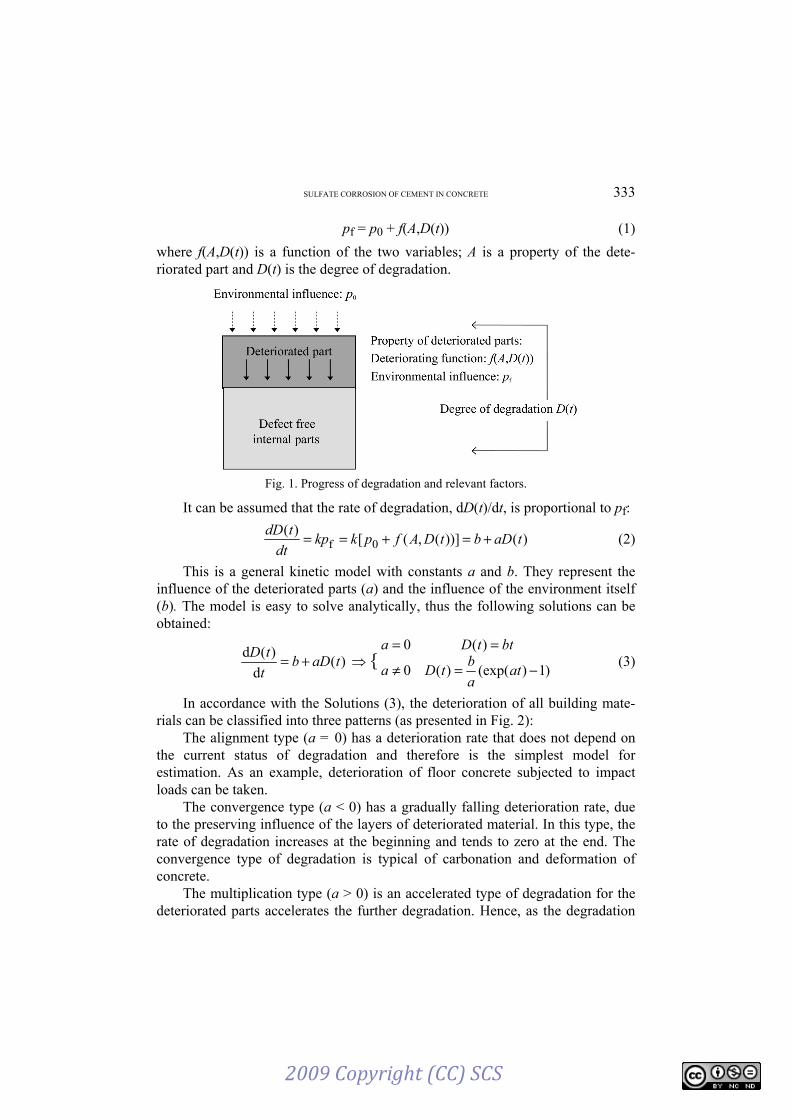
Matsufuji et al.1 recently proposed an equation that predicts and estimates the progress of degradation for various building materials. They assumed that the degradation commences at the surfaces in contact with the environment, whereby the environmental factors (pf) permeate and otherwise affect the material. There-fore, the surface of the system is covered with the deteriorating parts – the pro-ducts of degradation, as presented in Fig. 1.
The surface between the deteriorated and the defect-free internal parts is exposed to the influence of both environmental factors at the outer surface (p0) and the characteristics of the deteriorated parts between p0 and pf:
2009 Copyright (CC) SCS
SULFATE CORROSION OF CEMENT IN CONCRETE 333
pf = p0 + f(A,D(t)) (1)
where f(A,D(t)) is a function of the two variables; A is a property of the dete-riorated part and D(t) is the degree of degradation.
Fig. 1. Progress of degradation and relevant factors.
It can be assumed that the rate of degradation, dD(t)/dt, is proportional to pf:
)())](,([)(
0f taDbtDAfpkkpdt
tdD +=+== (2)
This is a general kinetic model with constants a and b. They represent the influence of the deteriorated parts (a) and the influence of the environment itself (b). The model is easy to solve analytically, thus the following solutions can be obtained:
)(d
)(dtaDb
t
tD += {)1)(exp()(0
)(0
−=≠
==
ata
btDa
bttDa (3)
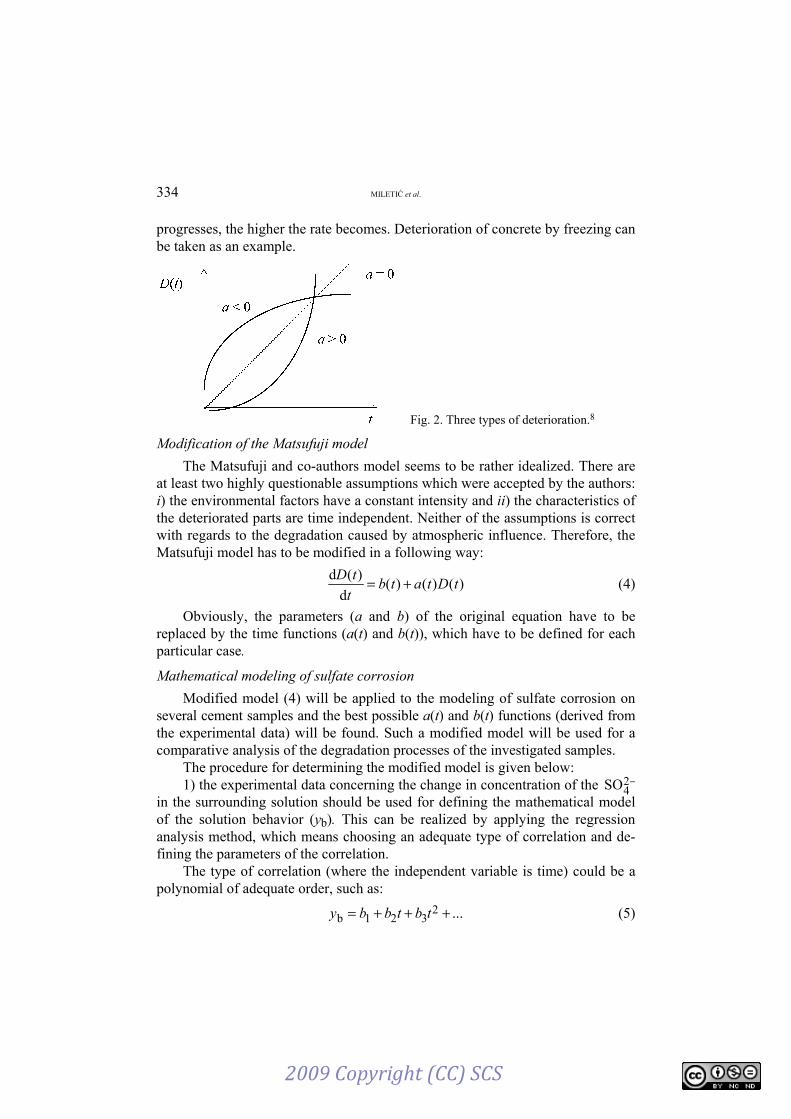
In accordance with the Solutions (3), the deterioration of all building mate-rials can be classified into three patterns (as presented in Fig. 2):
The alignment type (a = 0) has a deterioration rate that does not depend on the current status of degradation and therefore is the simplest model for estimation. As an example, deterioration of floor concrete subjected to impact loads can be taken.
The convergence type (a < 0) has a gradually falling deterioration rate, due to the preserving influence of the layers of deteriorated material. In this type, the rate of degradation increases at the beginning and tends to zero at the end. The convergence type of degradation is typical of carbonation and deformation of concrete.
The multiplication type (a > 0) is an accelerated type of degradation for the deteriorated parts accelerates the further degradation. Hence, as the degradation
2009 Copyright (CC) SCS
334 MILETIĆ et al.
progresses, the higher the rate becomes. Deterioration of concrete by freezing can be taken as an example.
Fig. 2. Three types of deterioration.8
Modification of the Matsufuji model
The Matsufuji and co-authors model seems to be rather idealized. There are at least two highly questionable assumptions which were accepted by the authors: i) the environmental factors have a constant intensity and ii) the characteristics of the deteriorated parts are time independent. Neither of the assumptions is correct with regards to the degradation caused by atmospheric influence. Therefore, the Matsufuji model has to be modified in a following way:
)()()(d
)(dtDtatb
t
tD += (4)
Obviously, the parameters (a and b) of the original equation have to be replaced by the time functions (a(t) and b(t)), which have to be defined for each particular case.
Mathematical modeling of sulfate corrosion
Modified model (4) will be applied to the modeling of sulfate corrosion on several cement samples and the best possible a(t) and b(t) functions (derived from the experimental data) will be found. Such a modified model will be used for a comparative analysis of the degradation processes of the investigated samples.
The procedure for determining the modified model is given below: 1) the experimental data concerning the change in concentration of the −2
4SO in the surrounding solution should be used for defining the mathematical model of the solution behavior (yb). This can be realized by applying the regression analysis method, which means choosing an adequate type of correlation and de-fining the parameters of the correlation.
The type of correlation (where the independent variable is time) could be a polynomial of adequate order, such as:
...2321b +++= tbtbby (5)
2009 Copyright (CC) SCS
SULFATE CORROSION OF CEMENT IN CONCRETE 335
or, very often, some of exponential decay functions, such as:
...expexp5
43
21b +
−+
−+=b
tb
b
tbby (6)
After choosing the type of correlation, their parameters (bi, i = 1,n) should be determined by processing the experimental data.
2) Now, the time dependent parameter (b(t)) of the modified differential equation can be defined. It is proportional to the function, yb:
b(t) = kyb (7)
where k is a constant. In this way, the influence of the immediate environment on the samples immersed in the aggressive solution is mathematically described.
3) The third step in the mathematical modeling of sulfate corrosion is the determination of k and a (ai, i = 1,n) parameters in the model:
)(...)(Δ
Δ
d
)(d 2321b tDtataaky
t
D
t
tD ++++=≈ (8)
using experimental data. As the experimental data, the degrees of degradation are taken. In a sulfate corrosion problem, the degradation degree is expressed as the concentration of −2
4SO reacting with the material. The derivatives (dD/dt) must be determined numerically using the mentioned database and the time increments in accordance with the experiments.
Unfortunately, Eq. (4) is difficult to solve analytically even in the cases when the a(t) and b(t) functions are extremely simple, hence a numerical procedure particularly oriented to solving the sulfate corrosion problem will be suggested.
Database obtained by measurements and calculations
It is obvious that the data necessary for deriving a sulfate corrosion model are: i) the concentrations of −2
4SO in the environment and ii) the concentrations of the −2
4SO spent by the chemical reactions occurring inside the material. Ac-tually, the quantities of the reacted −2
4SO are equal to the concentration differ-rences for the solution in particular time increments. The changes of the other product characteristics due to sulfate corrosion can also be tracked. Here, weight loss and the decrease in flexural strength were chosen. Therefore, the experi-ments were planned to give the necessary information.
EXPERIMENTAL
The investigated samples were as follows: – Portland cement 1 (PC1), – Portland cement 1 with 30 % coal ash (PAC1) added, – Portland cement 2 (PC2) and – Portland cement 2 with 30 % coal ash (PAC2) added.
2009 Copyright (CC) SCS
336 MILETIĆ et al.
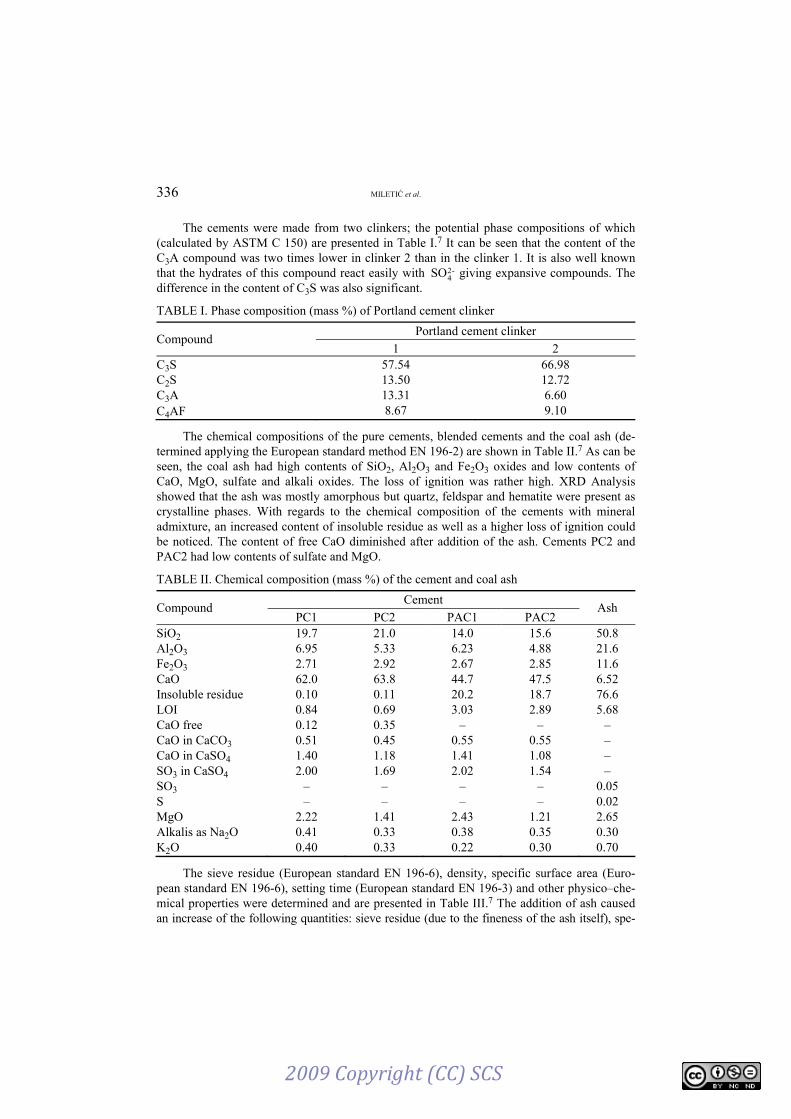
The cements were made from two clinkers; the potential phase compositions of which (calculated by ASTM C 150) are presented in Table I.7 It can be seen that the content of the C3A compound was two times lower in clinker 2 than in the clinker 1. It is also well known that the hydrates of this compound react easily with -2
4SO giving expansive compounds. The difference in the content of C3S was also significant.
TABLE I. Phase composition (mass %) of Portland cement clinker
The chemical compositions of the pure cements, blended cements and the coal ash (de-termined applying the European standard method EN 196-2) are shown in Table II.7 As can be seen, the coal ash had high contents of SiO2, Al2O3 and Fe2O3 oxides and low contents of CaO, MgO, sulfate and alkali oxides. The loss of ignition was rather high. XRD Analysis showed that the ash was mostly amorphous but quartz, feldspar and hematite were present as crystalline phases. With regards to the chemical composition of the cements with mineral admixture, an increased content of insoluble residue as well as a higher loss of ignition could be noticed. The content of free CaO diminished after addition of the ash. Cements PC2 and PAC2 had low contents of sulfate and MgO.
TABLE II. Chemical composition (mass %) of the cement and coal ash
Compound Cement
Ash PC1 PC2 PAC1 PAC2
SiO2 19.7 21.0 14.0 15.6 50.8 Al2O3 6.95 5.33 6.23 4.88 21.6 Fe2O3 2.71 2.92 2.67 2.85 11.6 CaO 62.0 63.8 44.7 47.5 6.52 Insoluble residue 0.10 0.11 20.2 18.7 76.6 LOI 0.84 0.69 3.03 2.89 5.68 CaO free 0.12 0.35 – – – CaO in CaCO3 0.51 0.45 0.55 0.55 – CaO in CaSO4 1.40 1.18 1.41 1.08 – SO3 in CaSO4 2.00 1.69 2.02 1.54 – SO3 – – – – 0.05 S – – – – 0.02 MgO 2.22 1.41 2.43 1.21 2.65 Alkalis as Na2O 0.41 0.33 0.38 0.35 0.30 K2O 0.40 0.33 0.22 0.30 0.70
The sieve residue (European standard EN 196-6), density, specific surface area (Euro-pean standard EN 196-6), setting time (European standard EN 196-3) and other physico–che-mical properties were determined and are presented in Table III.7 The addition of ash caused an increase of the following quantities: sieve residue (due to the fineness of the ash itself), spe-
2009 Copyright (CC) SCS
SULFATE CORROSION OF CEMENT IN CONCRETE 337
cific surface area and the water demand for a standard consistency. On the other hand, other characteristics of the cements did not change. It should also be emphasized that all the quan-tities given in Tables II and III are in compliance with the Yugoslav standard JUS B.C1.011.
TABLE III. Physico–chemical properties of the cements
Physico–chemical property Cement
PC1 PC2 PAC1 PAC2 Sieve residue at 0.09 mm sieve, mass % 1.80 2.60 5.20 6.00 Density, g/cm3 3.14 3.17 2.88 2.85 Specific surface area (after Blain), cm2/g 3320 3100 3720 3710 Standard consistence, mass % 25.8 23.8 28 27.5 Initial time, min 165 165 240 255 Final time, min 225 225 330 360 Le Chatelier test, mm 1.0 1.5 1.0 1.0
Also, flexural and compressive strengths of the cements (European standard EN 196-1) were obtained as given in Table IV.8 The addition of ash did not significantly change the strengths during the first four weeks.
The sulfate corrosion of the cements was investigated according to the Koch–Steinegger method.6,8 Mortar prisms of the samples were prepared from the standard sand of the former German cement standard DIN 1164 (1958), with a water/cement ratio 0.6. Before the prisms were exposed to the aggressive solutions, they were cured for 1 day in the mould and for 20 days in water. Instead of the 4.4 % Na2SO4 solution, suggested in the original Koch–Stein-egger method, a 10 % (NH4)2SO4 solution was used. This provided intensive aggression and enabled successful simulation of the real conditions typical for a polluted environment. The samples were immersed into the aggressive solution for 9 month. Simultaneously, the same number of samples was stored in distilled water for possible comparisons.
Measurements of the mass and flexural strength of the corroded samples, as well as the samples exposed to water, were performed after 7, 14, 28, 56, 90, 180 and 270 days. Also, the concentration of -2
4SO in the solution was determined.
Quantification of sulfate corrosion
The following parameters that quantify cement degradation are suggested: i) bonded -2
4SO , ii) mass change and iii) a degradation factor based on changes in the flexural strength, as given by the Eqs. (9)–(11):
2009 Copyright (CC) SCS
338 MILETIĆ et al.
solution inactual-2
4initial-2
4bonded-2
4 )SOSO()(SO −= (9)
initial
actualinitial100 Δm
mmm
−= (10)
[ ]sample uncorroded of strength Flexural
sample corroded of strength Flexural11 −=DFlex (11)
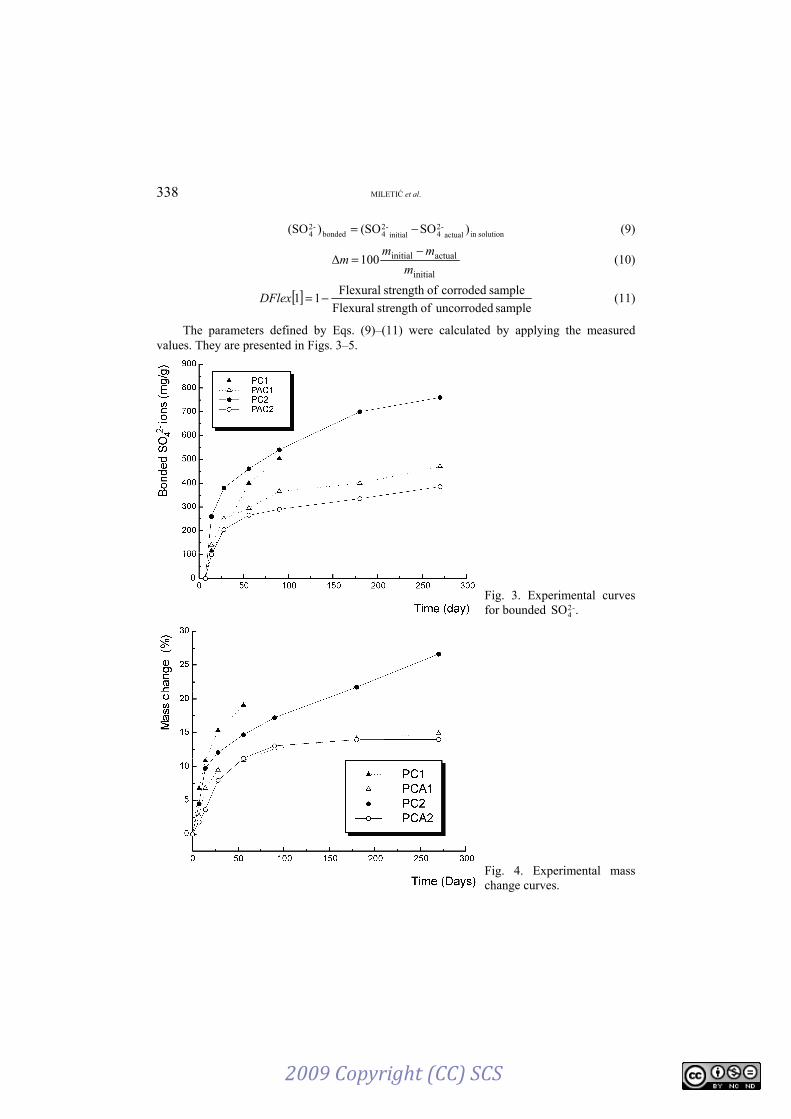
The parameters defined by Eqs. (9)–(11) were calculated by applying the measured values. They are presented in Figs. 3–5.
Fig. 3. Experimental curves for bounded -2
4SO .
Fig. 4. Experimental mass change curves.
2009 Copyright (CC) SCS
SULFATE CORROSION OF CEMENT IN CONCRETE 339
RESULTS
Mathematical models of sulfate corrosion of the examined systems
According to the algorithm suggested in this paper, sulfate corrosion of the examined samples was mathematically described. While applying the derived model, interesting facts were noticed. They concern the corrosion caused by the variable influence of the atmosphere and the already degraded material.
The mathematical model was defined in following steps: 1) By applying the regression analysis method on the experimental data, i.e.,
the concentrations of −24SO in the solution, the behavior of the solutions in con-
tact with four samples (PC1, PC2, PAC1 and PAC2) was mathematically des-cribed.
The decrease of −24SO concentration in the solution surrounding PC1 sam-
ples is described quite adequately by the polynomial:
21PCb 0583.051.116.1126)( tty +−= (12)
which is graphically presented in Fig. 6. As for other three groups of samples (PC2, PAC1 and PAC2), two decay
times exponential functions proved suitable. In the case of the sample PCA1, it has the following form:
−+
−+=
94.275exp350
10exp420450)( PAC1b
tty (13)
The function given by Eq. (13) is graphically presented in Fig. 6 as dotted line.
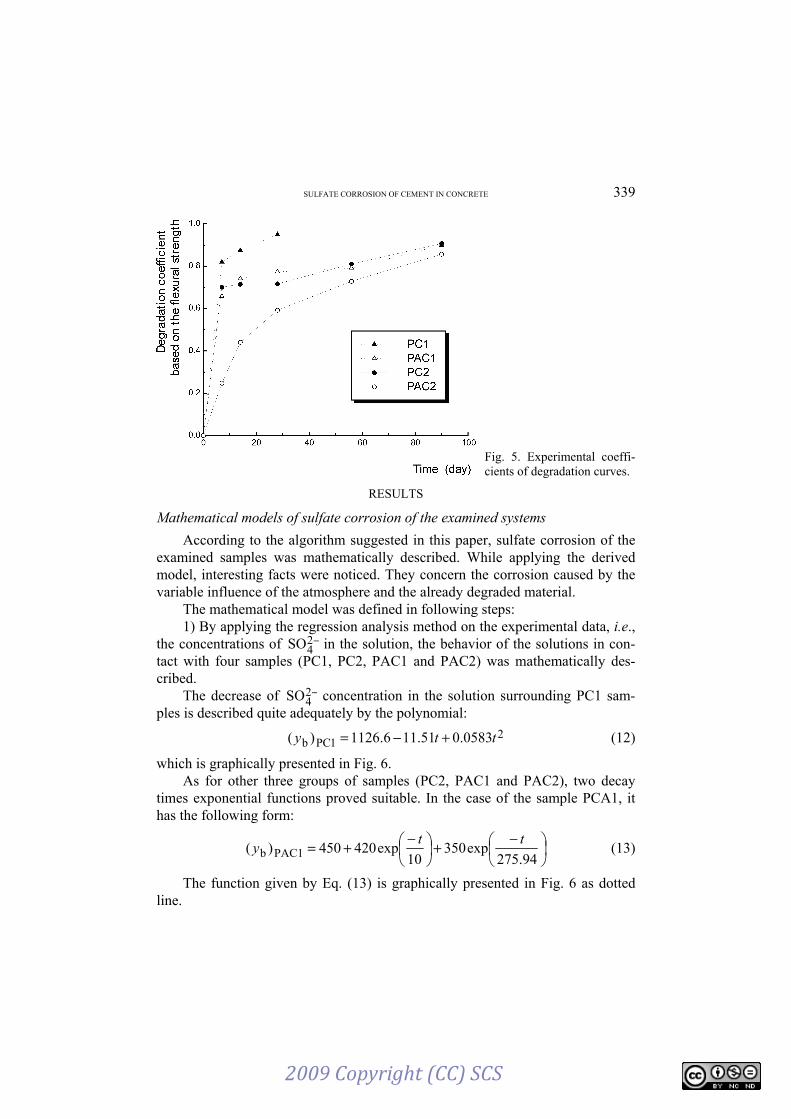
Fig. 5. Experimental coeffi-cients of degradation curves.
2009 Copyright (CC) SCS
340 MILETIĆ et al.
Fig. 6. Decrease of -24SO con-
centration in the solutions.
The mathematical models describing the behavior of the solutions in contact with the samples PC2 and PAC2 are given by the functions:
−+
−+=
2.140exp575
7.4exp1340370)( PC2b
tty (14)
and
−+
−+−=
75.10607exp5500
14exp4204460)( PAC2b
tty (15)
The functions given by Eqs. (14) and (15) are graphically presented in Fig. 6 as dotted curves.
2) After defining the yb functions, it is possible to express the b(t) functions as given by Eq. (7).
3) Finally, the b(t) functions should be introduced into the modified mathe-matical model (8). In this way, four correlations (16–19) were obtained:
)(...)()0583.051.116.1126( 2321
2 tDtataattct
D +++++−=ΔΔ
(16)
)(...)(94.275
exp35010
exp420450 2321 tDtataa
ttc
t
D ++++
−+
−+=
ΔΔ
(17)
)(...)(2.140
exp5757.4
exp1340370 2321 tDtataa
ttc
t
D ++++
−+
−+=
ΔΔ
(18)
)(...)(
75.10607exp5500
14exp4204460
2321 tDtataa
ttc
t
D
++++
+
−+
−+−=
ΔΔ
(19)
2009 Copyright (CC) SCS
SULFATE CORROSION OF CEMENT IN CONCRETE 341
Their c and a (ai, i = 1,n) parameters can be obtained by applying the re-gression analysis method over the experimental data. As the experimental data, the D(t) ≡ ( −2
4SO )bonded values were taken. Their derivatives (ΔD/Δt) might be determined by dividing the −2
4SO concentration differences by the time incre-ments, in accordance with the experiments. For example, for the first time incre-ment (0–7 days), the numerically expressed derivative might be:
7
]SO[
7
)]SO[]SO([ bonded24bonded1
242
24
−−− Δ=
−=
ΔΔ
t
D (20)
Off course, there are better methods for the determination of derivatives. Mostly, they are parts of software packages developed for a graphical presenta-tion and mathematical processing of measured data (such as Origin and others).
Hence, the sulfate corrosion models are defined when b(t) and a(t) are deter-mined. For the examined series of samples, the mentioned parameters are as follows.
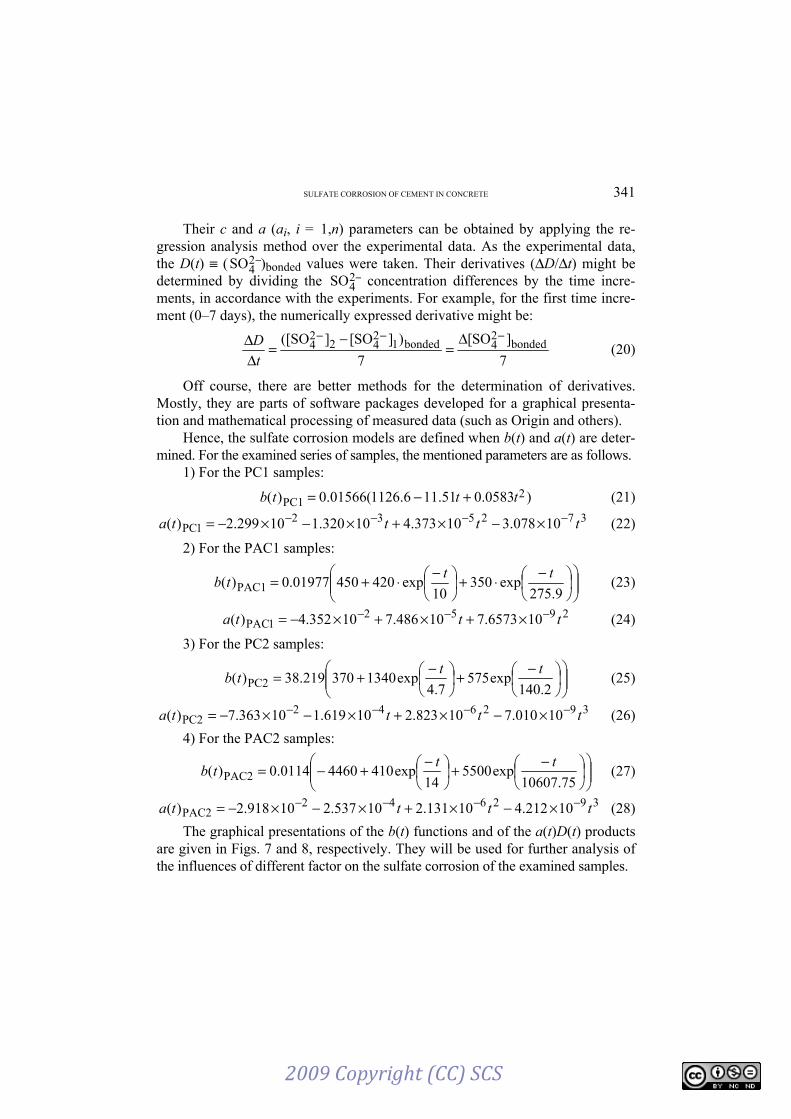
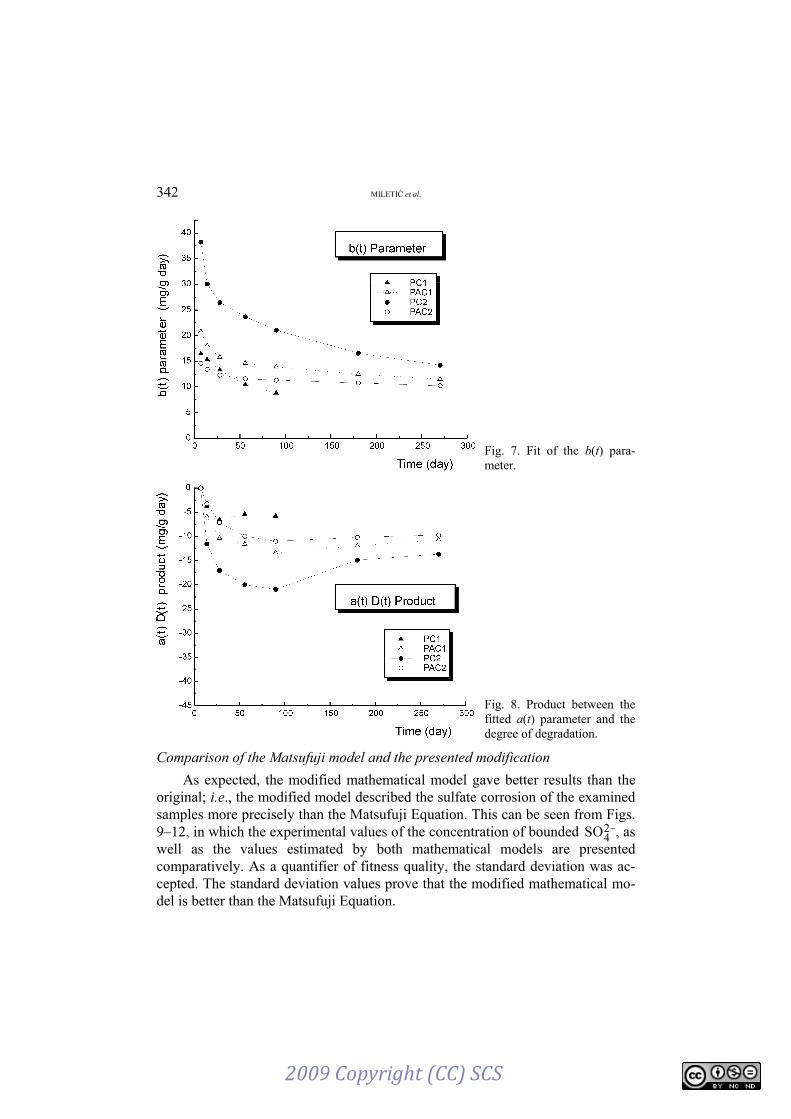
The graphical presentations of the b(t) functions and of the a(t)D(t) products are given in Figs. 7 and 8, respectively. They will be used for further analysis of the influences of different factor on the sulfate corrosion of the examined samples.
2009 Copyright (CC) SCS
342 MILETIĆ et al.
Fig. 7. Fit of the b(t) para-meter.
Fig. 8. Product between the fitted a(t) parameter and the degree of degradation.
Comparison of the Matsufuji model and the presented modification
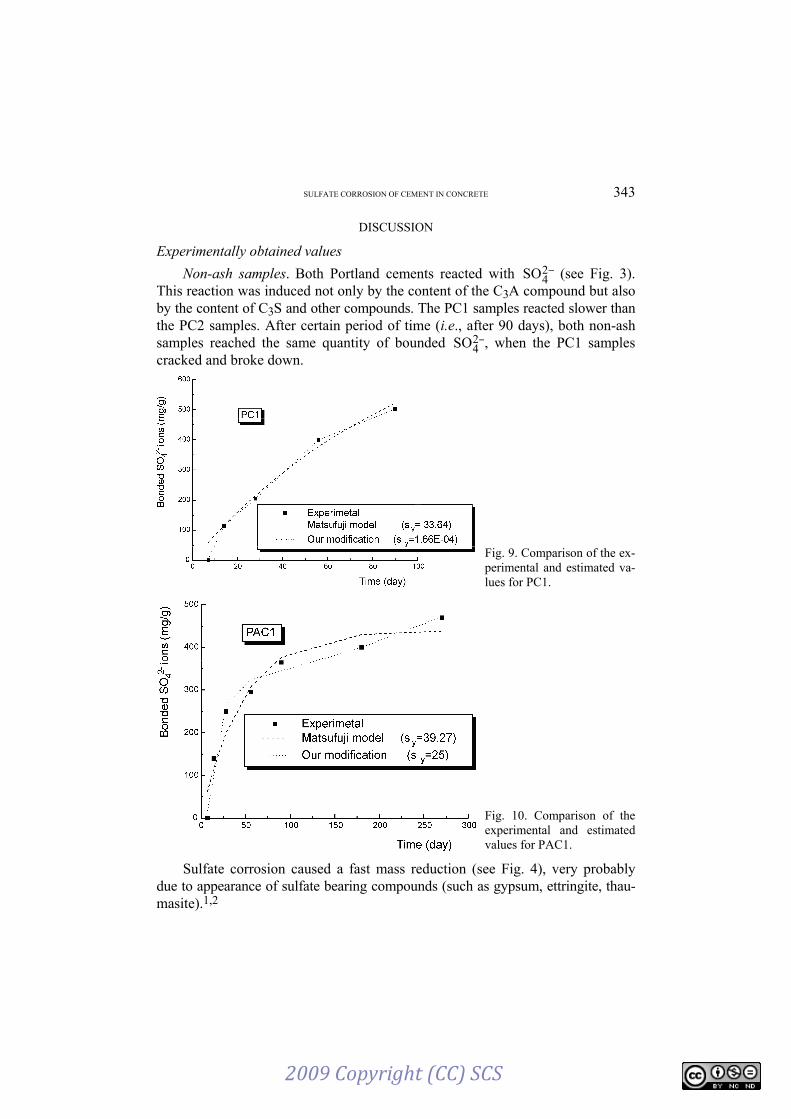
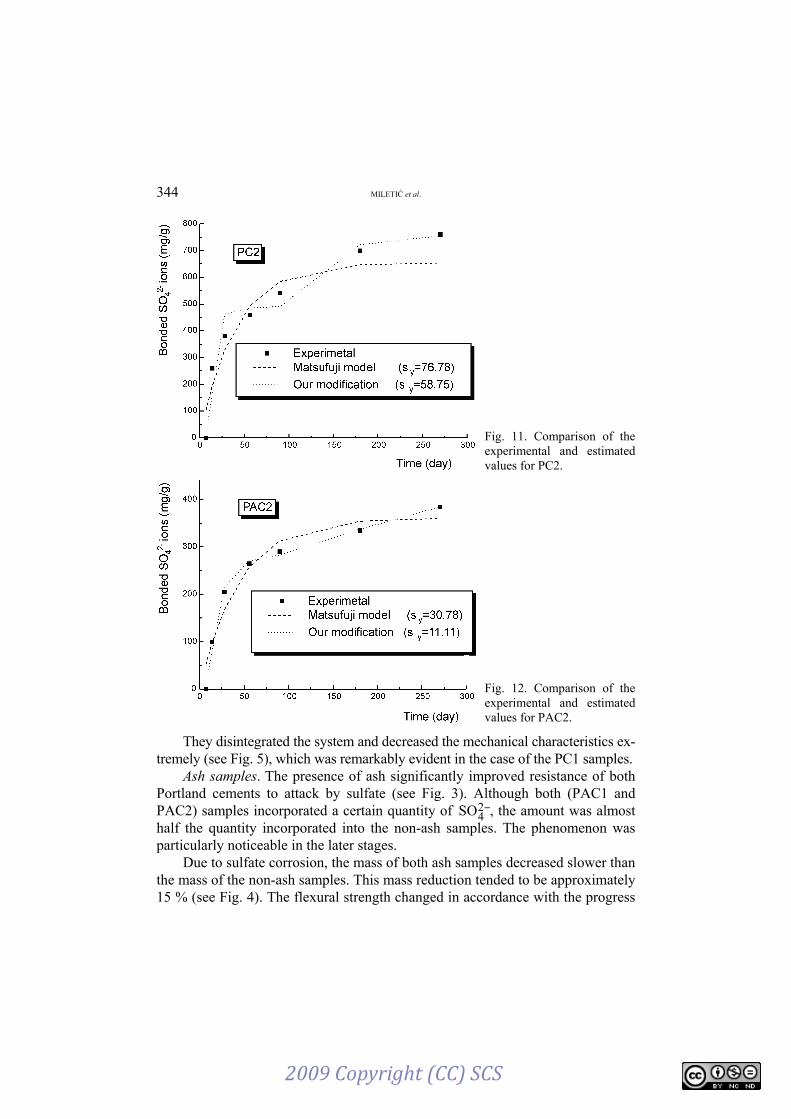
As expected, the modified mathematical model gave better results than the original; i.e., the modified model described the sulfate corrosion of the examined samples more precisely than the Matsufuji Equation. This can be seen from Figs. 9–12, in which the experimental values of the concentration of bounded −2
4SO , as well as the values estimated by both mathematical models are presented comparatively. As a quantifier of fitness quality, the standard deviation was ac-cepted. The standard deviation values prove that the modified mathematical mo-del is better than the Matsufuji Equation.
2009 Copyright (CC) SCS
SULFATE CORROSION OF CEMENT IN CONCRETE 343
DISCUSSION
Experimentally obtained values
Non-ash samples. Both Portland cements reacted with −24SO (see Fig. 3).
This reaction was induced not only by the content of the C3A compound but also by the content of C3S and other compounds. The PC1 samples reacted slower than the PC2 samples. After certain period of time (i.e., after 90 days), both non-ash samples reached the same quantity of bounded −2
4SO , when the PC1 samples cracked and broke down.
Fig. 9. Comparison of the ex-perimental and estimated va-lues for PC1.
Fig. 10. Comparison of the experimental and estimated values for PAC1.
Sulfate corrosion caused a fast mass reduction (see Fig. 4), very probably due to appearance of sulfate bearing compounds (such as gypsum, ettringite, thau-masite).1,2
2009 Copyright (CC) SCS
344 MILETIĆ et al.
Fig. 11. Comparison of the experimental and estimated values for PC2.
Fig. 12. Comparison of the experimental and estimated values for PAC2.
They disintegrated the system and decreased the mechanical characteristics ex-tremely (see Fig. 5), which was remarkably evident in the case of the PC1 samples.
Ash samples. The presence of ash significantly improved resistance of both Portland cements to attack by sulfate (see Fig. 3). Although both (PAC1 and PAC2) samples incorporated a certain quantity of −2
4SO , the amount was almost half the quantity incorporated into the non-ash samples. The phenomenon was particularly noticeable in the later stages.
Due to sulfate corrosion, the mass of both ash samples decreased slower than the mass of the non-ash samples. This mass reduction tended to be approximately 15 % (see Fig. 4). The flexural strength changed in accordance with the progress
2009 Copyright (CC) SCS
SULFATE CORROSION OF CEMENT IN CONCRETE 345
of the physical destruction of the material. As it was slower in the presence of ash, these samples possessed greater strength; particularly the PAC2 samples (see Fig. 5).
Results obtained by the mathematical model
The model suggested in this paper allows a more detailed examination and a better explanation of the system changes during time. According to the experi-mentally determined values, the concentrations of −2
4SO in the solutions de-creased very rapidly in contact with the PC1 and PC2 samples. This change was much slower in the case of the ash samples, particularly PAC2 (see Fig. 6). The conclusion is in compliance with the fact that the non ash samples incorporated a greater quantity of −2
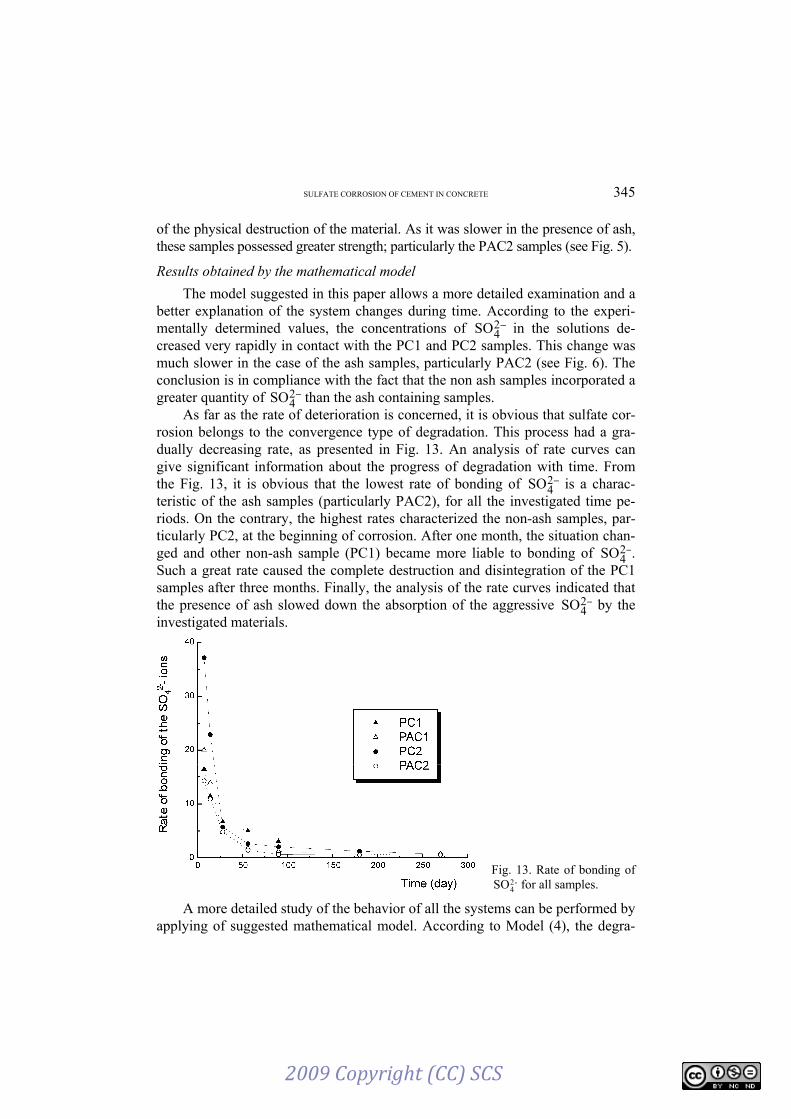
4SO than the ash containing samples. As far as the rate of deterioration is concerned, it is obvious that sulfate cor-
rosion belongs to the convergence type of degradation. This process had a gra-dually decreasing rate, as presented in Fig. 13. An analysis of rate curves can give significant information about the progress of degradation with time. From the Fig. 13, it is obvious that the lowest rate of bonding of −2
4SO is a charac-teristic of the ash samples (particularly PAC2), for all the investigated time pe-riods. On the contrary, the highest rates characterized the non-ash samples, par-ticularly PC2, at the beginning of corrosion. After one month, the situation chan-ged and other non-ash sample (PC1) became more liable to bonding of −2
4SO . Such a great rate caused the complete destruction and disintegration of the PC1 samples after three months. Finally, the analysis of the rate curves indicated that the presence of ash slowed down the absorption of the aggressive −2
4SO by the investigated materials.
Fig. 13. Rate of bonding of -2
4SO for all samples.
A more detailed study of the behavior of all the systems can be performed by applying of suggested mathematical model. According to Model (4), the degra-
2009 Copyright (CC) SCS
346 MILETIĆ et al.
dation rate is the sum of two terms; the first one, b(t), expresses the influence of the immediate environment while the second one, a(t)D(t), quantifies the be-havior of the already deteriorated parts. The first one has a positive sign while the second one has a negative sign. It is desirable that the first one has a value as low as possible while the second one must have a value as high as possible. The phy-sical meaning of both terms would be as follows: b(t) represents the aggressive-ness of the environment while the product a(t)D(t) expresses the protective be-havior of the sulfate bearing compounds already formed at the surface of the cor-roded object.
From Fig. 7 it is obvious that the aggression of the (NH4)2SO4 solution is the most intensive in the case of the PC2 samples. Fortunately, the protective charac-ter of its deteriorating parts is very strong (see Fig. 8). Still, the rate of bonding of
−24SO was large for the PC2 samples. The aggression of the (NH4)2SO4 solution
in the case of all the other samples was rather similar and not too intensive (see Fig. 7). With the ash samples, it is neutralized by the protective behavior of the degradation products. As a result, these two phenomena (aggression and protect-tion) induced a small rate of bonding of −2
4SO in the case of the ash containing samples as a result. With regards to the behavior of the PC1 system, an extremely undesirable fact can be noticed, i.e., the protective effect of the sulfate bearing layers was very weak. It decreased particularly after one month and caused the total destruction of PC1 samples after three months was very probable.
CONCLUSIONS
This paper introduces an improved model for the mathematical description of sulfate corrosion of particular systems prepared from Portland cement and Port-land cement with 30 % of coal ash. The model enables a rather exact analysis of the behavior of all the systems. According to the model, the degradation rate is considered to be the sum of two terms; the first one represents the aggressiveness of the immediate environment while the second one expresses the protective be-havior of sulfate bearing compounds already formed at the surface of corroded objects. It is concluded that the sulfate corrosion belongs to the attenuated type of deterioration. The model allowed not only better explanations of the degradation during the investigated time period, but also showed that the ash systems were significantly resistant to sulfate corrosion.
2009 Copyright (CC) SCS
SULFATE CORROSION OF CEMENT IN CONCRETE 347
И З В О Д
(NH4)2SO4 КОРОЗИЈА ЦЕМЕНТА У БЕТОНУ АНАЛИЗИРАНА ПОБОЉШАНИМ МАТЕМАТИЧКИМ МОДЕЛОМ
Novom Sadu,Bulevar Cara Lazara 1, 21000 Novi Sad, 3Fakultet tehni~kih nauka, Univerzitet u Novom
Sadu, Trg Dositeja Obradovi}a 6, Novi Sad i 4Tehnolo{ko–metalur{ki fakultet,
Univerzitet u Beogradu, Karnegijeva 4, 11000 Beograd
У раду је приказана критичка анализа једначине која предвиђа напредовање деграда-ције разних грађевинских материјала, а коју су у скорије време предложили Matsufuji и дру-ги. После анализе, у раду је предложен побољшан математички модел, посебно оријентисан ка моделовању сулфатне корозије. Изведени су експерименти на два узорка Портланд це-мента и на два узорка Портланд цемента са 30 % летећег пепела. Узорци су потопљени у 10 % раствор (NH4)2SО4 и мерена је концентрација -2
4SO у оба система – раствору и материјалу. Као параметар који квантификује деградацију цемента узет је садржај везаних -2
4SO . Ко-ришћењем добијених података дефинисан је математички модел за описивање сулфатне ко-розије четири испитивана узорка. Модели су примењени за анализу понашања узорака са летећем пепелом и без њега. Они омогућавају не само бољу интерпретацију деградације током испитиваног периода, већ и показују значајну отпорност система са летећим пепелом према сулфатној корозији.
(Примљено 18. јула, ревидирано 21. октобра 2008)
REFERENCES
1. Y. Matsufuji, T. Koyama, S. Harada, in Proceedings of Durability of Building Materials and Components 7, C. Sjostrom, Ed., E & FN Spon, London 1996, p. 45
2. U. Schneider, S.-W. Chen, in Proceedings of Durability of Building Materials and Components 7, C. Sjostrom, Ed., E & FN Spon, London, 1996, p. 383
3. M. A. Halliwell, N. J. Crammond, in Proceedings of Durability of Building Materials and Components 7, C. Sjostrom, Ed., E & FN Spon, London, 1996, p. 235
4. M. Djurić, J. Ranogajec, R. Omorjan, S. Miletić, J. Serb. Chem. Soc. 62 (1997) 1003 5. M. Djurić, J. Ranogajec, R. Omorjan, S. Miletić, Cement Concrete Res. 26 (1996) 1295 6. M. Djurić, I. Grzetić, Ceram. Silikaty 41 (1997) 152 7. A. Koch, H. Steinneger, ZKG-International 13 (1960) 317 8. S. Miletić, M. Ilić, J. Ranogajec, R. Marinković-Neducin, M. Djurić, Cement Concrete


![© Copyright€1997€A.W.€Chesterton,€All€rights · Ammonium€Sulfate[(NH4)2SO4] 111 1111111111111111112 Aqua€Regia€[(HNO3)/3(HCl)] 444 2444444424442443344 Aviation€Fuel](https://static.documents.pub/doc/80x56/5ca0dbb388c9931c188dfd66/-copyright1997awchestertonall-ammoniumsulfatenh42so4.jpg)


