25
NHS England Statistical Release Breastfeeding Initiation & Breastfeeding Prevalence 6-8 weeks Quarter 1 2015/16 24th September 2015 Crown Copyright © 2015
NHS England Statistical ReleaseBreastfeeding Initiation & Breastfeeding Prevalence6-8 weeksQuarter 1 2015/1624th September 2015
Crown Copyright © 2015

Statistical release
Breastfeeding initiation and prevalence at 6 to 8 weeks
Quarter 1 2015/16
24th September 2015
Crown Copyright © 2015
Contents
Context
Summary of results
Table 1: Initiation of breastfeeding, England Trend
Table 2: Prevalence of breastfeeding at 6 to 8 weeks, England Trend
Table 3: Drop Off rate between breastfeeding initiation & Prevalence of breastfeeding at 6 to 8 weeks, England Trend
Table 4 : Initiation of breastfeeding, by NHS Trust Quarterly
Fig 1 : Mothers initiating breastfeeding as a percentage of maternities by NHS Trusts 2015/16 Q1
Fig 2 : Mothers not known initiating breastfeeding as a percentage of maternities by NHS Trusts 2015/16 Q1
Table 5 : Initiation of breastfeeding, by CCG and Area Team Quarterly
Fig 3 : Mothers initiating breastfeeding as a percentage of maternities by CCGs 2015/16 Q1
Fig 4 : Mothers not known initiating breastfeeding as a percentage of maternities by CCGs 2015/16 Q1
Table 6 : Prevalence of breastfeeding at 6 to 8 weeks by CCG and Area Team Quarterly 2015/16 Q1
Fig 5 : Infants 6-8 week breastfeeding status as a percentage of infants due 6-8 week reviews by CCGs 2015/16 Q1
Fig 6 : Percentage Infants not known breastfeeding as a percentage of infants due 6-8 week reviews by CCGs 2015/16 Q1
Data Quality
Breastfeeding initiation definitions
6-8 week breastfeeding definitions
Contact for further enquiries

Context
There is a clear case for investing in services to support breastfeeding as part of a local child health strategy. This is particularly important for mothers from low income groups, as it is known that they are less likely to breastfeed. Breastfeeding protects the health of babies and mothers, and reduces the risk of illness (NICE, 2008).
Breast milk is the best form of nutrition for infants, and exclusive breastfeeding is recommended for the first six months (26 weeks) of an infant’s life. Thereafter, breastfeeding should continue for as long as the mother and baby wish, while gradually introducing the baby to a more varied diet.
In recent years, research has shown that infants who are not breastfed are more likely to have infections in the short-term such as gastroenteritis, respiratory and ear infections, and particularly infections requiring hospitalisation. In the longer term, evidence suggests that infants who are not breastfed are more likely to become obese in later childhood, which means they are more likely to develop type 2 diabetes, and tend to have slightly higher levels of blood pressure and blood cholesterol in adulthood. For mothers, breastfeeding is associated with a reduction in the risk of breast and ovarian cancers. A recent study also suggests a positive association between breastfeeding and parenting capability, particularly among single and low-income mothers.
Results from the UK Infant Feeding Survey 2010 showed that 83% of women in England breastfed their babies after birth, 78% after two days and 57% at six weeks. The differences between the two sets of results is likely to be due to the fact that the Infant Feeding Survey is based on self-reported information from women who agreed to take part in the survey; and the fact that breastfeeding status is not captured for all infants in the statistics covered in this report
National Institute for Health and Clinical Excellence (NICE), Improving the nutrition of pregnant and breastfeeding mothers and children in low-income households, London: NICE, 2008.
Chen A et al, Breastfeeding and the Risk of Postneonatal Death in the United States. Pediatrics 2004;113;e435-e439
World Health Organization, Global Strategy for Infant and Young Child Feeding, Geneva: World Health Organization, 2003.
Quigley MA et al, Breastfeeding and hospitalization for diarrheal and respiratory infection in the
United Kingdom Millennium Cohort Study, Pediatrics, 2007; 119(4):e837–42.
Chantry CJ et al, Full Breastfeeding Duration and Associated Decrease in Respiratory Tract Infection in US Children, Pediatrics 2006;117;425-432.
Horta B et al, Evidence on the long-term effects of breastfeeding, Geneva: World Health Organization, 2007.
Ip S et al, Breastfeeding and maternal and infant health outcomes in developed countries, Boston, Massachusetts: Agency for Healthcare Research and Quality, US Department of Health and Human Services, 2007.
WCRF/AICR (2007) Food, nutrition, physical Activity and the prevention of cancer: a global perspective. Washington DC, AICR
Gutman L et al, Nurturing parenting capability – the early years, London: Institute of Education, Centre for Research on the Wider Benefits of Learning, 2009.

Summary of results
The Q1 2013/14 onward collection of 12 week risk assessment, breastfeeding initiation and 6-8 week
breastfeeding data was collected directly from maternity service providers and child health information system
providers.
135 maternity providers should have submitted data for Q1 2015/16, with 128 maternity providers submitting
data. The level of maternity provider submissions at Q1 2015/16 was 95%.
As data submissions are above the validation limits we have sufficient data coverage to publish an England
figure for Q1 2015/16.
108 Child Health Information System (CHIS) Providers were identified for 6-8 week breastfeeding prevalence
submissions for Q1 2015/16. We received data returns covering 105 of these providers with an uptake rate of
97%.
As data submissions are above the validation limits* we have sufficient data coverage to publish an England
figure for Q1 2015/16.
Initiation of breastfeeding
In England the Q1 2015/16 rate of breastfeeding initiation was 73.8%. The annual percentage was 74.3% in
2014/15, 74.0% in 2013/14, 73.9% in 2012/13 and 2011/12 (74.0%) and was slightly higher than 2010/11
(73.7%), 2009/10 (72.7%) and 2008/09 (71.7%) (Table 1).
In England amongst the 162 CCGs that passed validation in Q1, breastfeeding initiation ranged from 46.3% in
NHS Knowsley CCG to 92.8% in NHS Richmond CCG (Table 5).
In England amongst the 114 Trusts that passed validation**, breastfeeding initiation ranged from 48.9%
Wrightington, Wigan and Leigh NHS Foundation Trust to 91.8% Homerton University Hospital NHS Foundation
Trust (Table 4).
Prevalence of breastfeeding at 6-8 weeks
The 6-8 week breastfeeding prevalence figures are based on the number of infants recorded by CCGs as
totally or partially breastfeeding, as a percentage of all infants due a 6-8 week check.
When making comparisons over time, it is best to limit this to those quarters with high and consistent levels of
coverage. There is evidence that the significant improvements in data coverage that were achieved in the early
quarters of data collection affected the comparability of the prevalence estimates over time. This is because
improvements in coverage have resulted in the inclusion in the statistics of a disproportionately higher number
of women who are not breastfeeding.
In England the breastfeeding prevalence rate at 6-8 weeks for Q1 2015/16 was 45.2%, in 2014/15 prevalence
at 6-8 weeks was 43.8%, in 2013/14 prevalence at 6-8 weeks was 45.8%, in 2012/13 prevalence at 6-8 weeks
was 47.2% and in 2011/12 47.2% of infants due a 6-8 week check were being breastfed at 6-8 weeks (Table 2).
In Q1 2015/16 107 CCGs failed to pass validation checks***. 39 failed as the number of eligible children
submitted failed to meet the -10% + 20% number of expected children.
An additional 85 CCGs failed due to more than 5% of their eligible children having no breastfeeding status
recorded.
Four CCGs failed due to the breastfeeding prevalence rate at 6-8 weeks being higher than that of the
breastfeeding initiation rate (02P NHS Barnsley CCG, 04F NHS Milton Keynes CCG, 03G NHS Leeds South
and East CCG and NHS Hounslow CCG).
Amongst the 102 CCGs that passed validation**, breastfeeding prevalence as a percentage of infants due a 6-8
week check ranged from 20.7% NHS Knowsley CCG to 82.5% NHS City & Hackney CCG (Table 6).
* The coverage target for 2013/14 onwards has been reduced to 85% for England level figures only. Feedback
was sought from the user perspective on lowering the threshold for the England figure. The change in quality
standard for the validation check does not apply at the lower levels of geography.
** Note that the maternities validation flag for RN3 Great Western Hospitals NHS Foundation Trust, RD1 Royal
United Hospitals Bath NHS Foundation Trust, RAL Royal Free London NHS Foundation Trust, R1K London
North West Healthcare NHS Trust and RDU Frimley Health NHS Foundation Trust were removed owing to the
merging or transferring of maternity services therefore there was no valid historic comparison data to validate
against.
*** Note that one CCG did not have data submitted against and was excluded from the passed validation
counts (08V NHS Tower Hamlets CCG). The values submitted for one CCG were suppressed owing to
incorrect data being submitted by the Provider (03H NHS NORTH EAST LINCOLNSHIRE CCG).
Please see Data Quality notes for trust specific explanations.

Table 1: Initiation of breastfeeding, England Trend - Commissioner based
Source: Department of Health, Integrated Performance Measure Return Source: NHS England
Crown Copyright © 2015 Crown Copyright © 2015
Year / Quarter Maternities 95%
No. No. % of maternities
confidence
interval No. % of maternities No. % of maternities
2003/04 OT 566,355 316,751 171,453 78,151 13.8%
2004/05 OT 576,935 363,549 181,655 31,731 5.5%
2005/06 OT 583,011 385,909 66.2% 66.1% - 66.3% 172,801 29.6% 24,301 4.2%
2006/07 OT 601,262 409,317 68.1% 68.0% - 68.2% 178,288 29.7% 13,657 2.3%
2007/08 OT 634,035 443,227 69.9% 69.8% - 70.0% 180,119 28.4% 10,690 1.7%
2008/09 OT 640,681 459,430 71.7% 71.6% - 71.8% 171,403 26.8% 9,848 1.5%
2009/10 OT 652,957 474,865 72.7% 72.6% - 72.8% 168,928 25.9% 9,164 1.4%
2010/11 OT 659,238 485,780 73.7% 73.6% - 73.8% 166,024 25.2% 7,434 1.1%
2011/12 OT 664,683 491,837 74.0% 73.9% - 74.1% 166,030 25.0% 6,816 1.0%
2012/13 OT 658,112 486,057 73.9% 73.7% - 74.0% 165,047 25.1% 7,008 1.1%
2013/14 OT 614,346 454,317 74.0% 73.8% - 74.1% 147,266 24.0% 12,763 2.1%
2014/15 OT 634,378 471,561 74.3% 74.2% - 74.4% 150,329 23.7% 12,488 2.0%
2013/14 Q1 149,091 110,440 74.1% 73.9% - 74.3% 35,950 24.1% 2,702 1.8% 0
2013/14 Q2 158,213 117,376 74.2% 74.0% - 74.4% 37,781 23.9% 3,056 1.9% 0
2013/14 Q3 153,514 113,161 73.7% 73.5% - 73.9% 37,494 24.4% 2,859 1.9% 0
2013/14 Q4 153,528 113,340 73.8% 73.6% - 74.0% 36,042 23.5% 4,146 2.7% 0
2014/15 Q1 158,329 117,667 74.3% 74.1% - 74.5% 36,825 23.3% 3,837 2.4% 0
2014/15 Q2 165,983 123,802 74.6% 74.4% - 74.8% 39,452 23.8% 2,729 1.6% 0
2014/15 Q3 158,087 117,235 74.2% 73.9% - 74.4% 37,780 23.9% 3,072 1.9%
2014/15 Q4 151,979 112,857 74.3% 74.0% - 74.5% 36,272 23.9% 2,850 1.9%
2015/16 Q1 150,590 111,088 73.8% 73.5% - 74.0% 36,455 24.2% 3,047 2.0% 0
2015/16 Q2
2015/16 Q3
2015/16 Q4
Notes:
1. Shaded and blank cells indicates reported data that do not pass the data quality checks. For further details of the checks, see definitions sheet.
1. Red cells mean that no. of maternities does not meet validation criteria (see definitions sheet for details). 1
Breastfeeding Not breastfeeding Not known
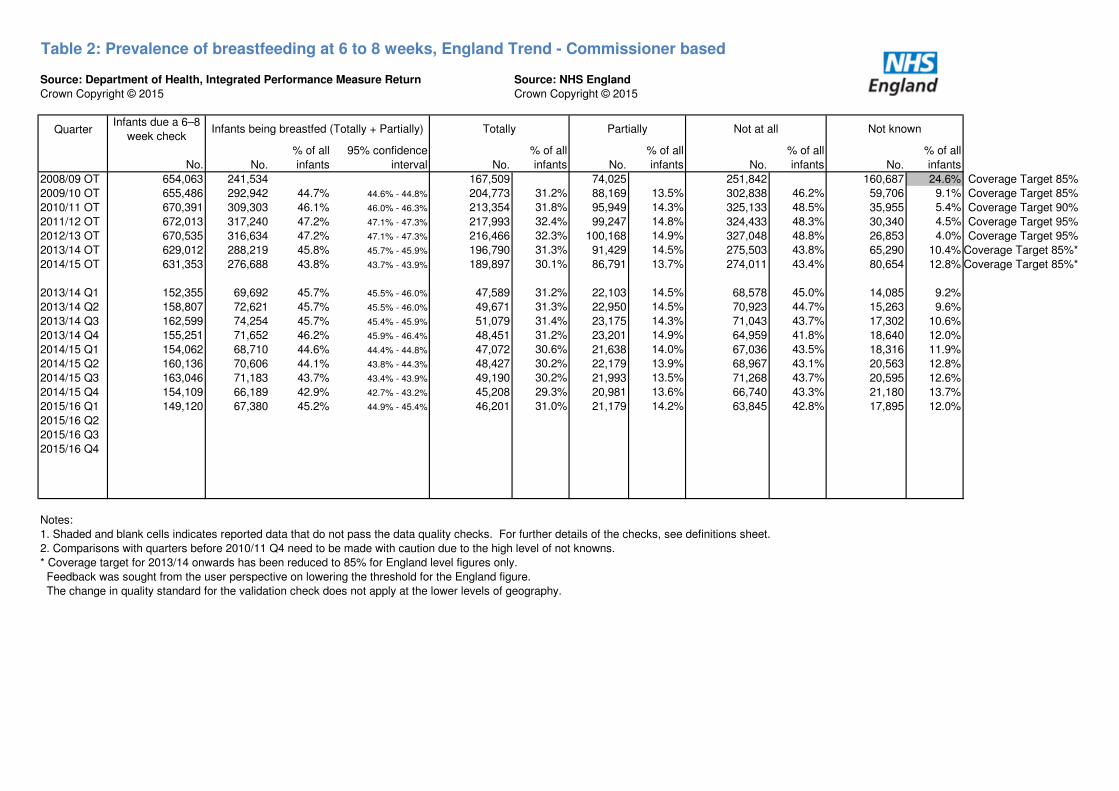
Table 2: Prevalence of breastfeeding at 6 to 8 weeks, England Trend - Commissioner based
Source: Department of Health, Integrated Performance Measure Return Source: NHS England
Crown Copyright © 2015 Crown Copyright © 2015
QuarterInfants due a 6–8
week check
No. No.
% of all
infants
95% confidence
interval No.
% of all
infants No.
% of all
infants No.
% of all
infants No.
% of all
infants
2008/09 OT 654,063 241,534 167,509 74,025 251,842 160,687 24.6% Coverage Target 85%
2009/10 OT 655,486 292,942 44.7% 44.6% - 44.8% 204,773 31.2% 88,169 13.5% 302,838 46.2% 59,706 9.1% Coverage Target 85%
2010/11 OT 670,391 309,303 46.1% 46.0% - 46.3% 213,354 31.8% 95,949 14.3% 325,133 48.5% 35,955 5.4% Coverage Target 90%
2011/12 OT 672,013 317,240 47.2% 47.1% - 47.3% 217,993 32.4% 99,247 14.8% 324,433 48.3% 30,340 4.5% Coverage Target 95%
2012/13 OT 670,535 316,634 47.2% 47.1% - 47.3% 216,466 32.3% 100,168 14.9% 327,048 48.8% 26,853 4.0% Coverage Target 95%
2013/14 OT 629,012 288,219 45.8% 45.7% - 45.9% 196,790 31.3% 91,429 14.5% 275,503 43.8% 65,290 10.4% Coverage Target 85%*
2014/15 OT 631,353 276,688 43.8% 43.7% - 43.9% 189,897 30.1% 86,791 13.7% 274,011 43.4% 80,654 12.8% Coverage Target 85%*
2013/14 Q1 152,355 69,692 45.7% 45.5% - 46.0% 47,589 31.2% 22,103 14.5% 68,578 45.0% 14,085 9.2% 0
2013/14 Q2 158,807 72,621 45.7% 45.5% - 46.0% 49,671 31.3% 22,950 14.5% 70,923 44.7% 15,263 9.6% 0
2013/14 Q3 162,599 74,254 45.7% 45.4% - 45.9% 51,079 31.4% 23,175 14.3% 71,043 43.7% 17,302 10.6% 0
2013/14 Q4 155,251 71,652 46.2% 45.9% - 46.4% 48,451 31.2% 23,201 14.9% 64,959 41.8% 18,640 12.0% 0
2014/15 Q1 154,062 68,710 44.6% 44.4% - 44.8% 47,072 30.6% 21,638 14.0% 67,036 43.5% 18,316 11.9% 0
2014/15 Q2 160,136 70,606 44.1% 43.8% - 44.3% 48,427 30.2% 22,179 13.9% 68,967 43.1% 20,563 12.8% 0
2014/15 Q3 163,046 71,183 43.7% 43.4% - 43.9% 49,190 30.2% 21,993 13.5% 71,268 43.7% 20,595 12.6%
2014/15 Q4 154,109 66,189 42.9% 42.7% - 43.2% 45,208 29.3% 20,981 13.6% 66,740 43.3% 21,180 13.7%
2015/16 Q1 149,120 67,380 45.2% 44.9% - 45.4% 46,201 31.0% 21,179 14.2% 63,845 42.8% 17,895 12.0% 0
2015/16 Q2
2015/16 Q3
2015/16 Q4
Notes:
1. Shaded and blank cells indicates reported data that do not pass the data quality checks. For further details of the checks, see definitions sheet.
2. Comparisons with quarters before 2010/11 Q4 need to be made with caution due to the high level of not knowns.
* Coverage target for 2013/14 onwards has been reduced to 85% for England level figures only.
Feedback was sought from the user perspective on lowering the threshold for the England figure.
The change in quality standard for the validation check does not apply at the lower levels of geography.
Infants being breastfed (Totally + Partially) Totally Partially Not at all Not known

Table 3: Drop Off rate between breastfeeding initiation and Prevalence of breastfeeding at 6 to 8 weeks
England Trend - Commissioner based
Source: Department of Health, Integrated Performance Measure Return Source: NHS England
Crown Copyright © 2015 Crown Copyright © 2015
Quarter Maternites QuarterInfants due a 6–8
week check
Difference between percentage of mothers
initiating breastfeeding and prevalence of
breastfeeding at 6-8 weeks (% of those
initiating)
No. No. % of maternities No. No. % of all infants %
2008/09 OT 640,681 459,430 71.7% 654,063 241,534
2009/10 OT 652,957 474,865 72.7% 655,486 292,942 44.7% 38.5%
2010/11 OT 659,238 485,780 73.7% 670,391 309,303 46.1% 37.4%
2011/12 OT 664,683 491,837 74.0% 672,013 317,240 47.2% 36.2%
2012/13 OT 658,112 486,057 73.9% 670,535 316,634 47.2% 36.1%
2013/14 OT 614,346 454,317 74.0% 630,719 287,237 45.5% 38.4%
2014/15 OT 634,378 471,561 74.3% 626,411 275,358 44.0% 40.9%
2013/14 Q1* 149,091 110,440 74.1% 2013/14 Q2 158,807 72,621 45.7% 38.3% 0
2013/14 Q2* 158,213 117,376 74.2% 2013/14 Q3 162,599 74,254 45.7% 38.4% 0
2013/14 Q3* 153,514 113,161 73.7% 2013/14 Q4 155,251 71,652 46.2% 37.4% 0
2013/14 Q4* 153,528 113,340 73.8% 2014/15 Q1 154,062 68,710 44.6% 39.6% 0
2014/15 Q1 158,329 117,667 74.3% 2014/15 Q2 160,136 70,606 44.1% 40.7% 0
2014/15 Q2 165,983 123,802 74.6% 2014/15 Q3 163,046 71,183 43.7% 41.5% 0
2014/15 Q3 158,087 117,235 74.2% 2014/15 Q4 154,109 66,189 42.9% 42.1% 0
2014/15 Q4 151,979 112,857 74.3% 2015/16 Q1 149,120 67,380 45.2% 39.2% 0
2015/16 Q1 150,590 111,088 73.8% 2015/16 Q2 0
2015/16 Q2 2015/16 Q3
2015/16 Q3 2015/16 Q4
2015/16 Q4 2016/17 Q1
Notes:
1. Shaded and blank cells indicates reported data that do not pass the data quality checks. For further details of the checks, see definitions sheet.
2. Comparisons with quarters before 2010/11 Q4 need to be made with caution due to the high level of not knowns.
3. * Comparisons with OT before 2013/14 cannot be made as there was a definition change between 2012/13 and 2013/14, from 2013/14 comparison of 6-8 week prevalence against the previous quarter's BFI
Breastfeeding
Infants being breastfed (Totally +
Partially)

Table 4 : Initiation of breastfeeding, by NHS Trust - Quarterly 2015/16
Source: NHS England
Crown Copyright © 2015
2015/16 Q1 2015/16 Q2 2015/16 Q3 2015/16 Q4
Code Name No. No. No. No.
No. not
initiated
No.
initiated %
95%
confidence
interval
No. not
initiated
No.
initiated %
95%
confidence
interval
No. not
initiated
No.
initiated %
95%
confidence
interval
No. not
initiated
No.
initiated %
95%
confidence
interval No. % No. % No. % No. %
RCF Airedale NHS Foundation Trust 568 124 444 78.2% 74.6% - 81.4% 0 0.0%
RTK Ashford and St Peter's Hospitals NHS Foundation Trust 1,028 151 877 85.3% 83.0% - 87.3% 0 0.0%
RF4 Barking, Havering and Redbridge University Hospitals NHS Trust 2,060 748 1,303 63.3% 61.1% - 65.3% 9 0.4%
RVL Barnet and Chase Farm Hospitals NHS Trust*
RFF Barnsley Hospital NHS Foundation Trust 1,032 584 445 3
R1H Barts Health NHS Trust 4,002 439 3,347 216 5.4%
RDD Basildon and Thurrock University Hospitals NHS Foundation Trust 1,086 297 788 72.6% 69.8% - 75.1% 1 0.1%
RC1 Bedford Hospital NHS Trust 708 125 583 82.3% 79.4% - 85.0% 0 0.0%
RLU Birmingham Women's NHS Foundation Trust 2,013 476 1,496 74.3% 72.4% - 76.2% 41 2.0%
RXL Blackpool Teaching Hospitals NHS Foundation Trust 724 245 479 66.2% 62.6% - 69.5% 0 0.0%
RMC Bolton NHS Foundation Trust 1,390 461 929 66.8% 64.3% - 69.3% 0 0.0%
RAE Bradford Teaching Hospitals NHS Foundation Trust 1,451 423 1,028 70.8% 68.5% - 73.1% 0 0.0%
RXH Brighton and Sussex University Hospitals NHS Trust 1,403 161 1,230 87.7% 85.8% - 89.3% 12 0.9%
RXQ Buckinghamshire Healthcare NHS Trust 1,389 263 1,034 92 6.6%
RJF Burton Hospitals NHS Foundation Trust 864 251 613 70.9% 67.8% - 73.9% 0 0.0%
RWY Calderdale and Huddersfield NHS Foundation Trust 1,155 236 919 0
RGT Cambridge University Hospitals NHS Foundation Trust
RW3 Central Manchester University Hospitals NHS Foundation Trust 2,247 703 1,544 68.7% 66.8% - 70.6% 0 0.0%
RQM Chelsea and Westminster Hospital NHS Foundation Trust 1,530 187 1,343 87.8% 86.0% - 89.3% 0 0.0%
RFS Chesterfield Royal Hospital NHS Foundation Trust 730 168 562 77.0% 73.8% - 79.9% 0 0.0%
RLN City Hospitals Sunderland NHS Foundation Trust 785 351 434 55.3% 51.8% - 58.7% 0 0.0%
RDE Colchester Hospital University NHS Foundation Trust 937 192 743 79.3% 76.6% - 81.8% 2 0.2%
RJR Countess Of Chester Hospital NHS Foundation Trust 590 195 395 66.9% 63.1% - 70.6% 0 0.0%
RXP County Durham and Darlington NHS Foundation Trust 1,288 547 741 57.5% 54.8% - 60.2% 0 0.0%
RJ6 Croydon Health Services NHS Trust 986 199 764 77.5% 74.8% - 80.0% 23 2.3%
RN7 Dartford and Gravesham NHS Trust 1,230 371 859 69.8% 67.2% - 72.3% 0 0.0%
RTG Derby Teaching Hospitals NHS Foundation Trust 1,509 381 1,128 74.8% 72.5% - 76.9% 0 0.0%
RP5 Doncaster and Bassetlaw Hospitals NHS Foundation Trust 1,252 433 819 65.4% 62.7% - 68.0% 0 0.0%
RBD Dorset County Hospital NHS Foundation Trust 472 100 367 77.8% 73.8% - 81.3% 5 1.1%
RC3 Ealing Hospital NHS Trust*
RWH East and North Hertfordshire NHS Trust 1,374 320 1,054 76.7% 74.4% - 78.9% 0 0.0%
RJN East Cheshire NHS Trust 423 95 313 74.0% 69.6% - 77.9% 15 3.5%
RVV East Kent Hospitals University NHS Foundation Trust 1,690 426 1,185 70.1% 67.9% - 72.3% 79 4.7%
RXR East Lancashire Hospitals NHS Trust 1,513 386 1,127 74.5% 72.2% - 76.6% 0 0.0%
RXC East Sussex Healthcare NHS Trust 881 283 598 67.9% 64.7% - 70.9% 0 0.0%
RVR Epsom and St Helier University Hospitals NHS Trust
RDU Frimley Health NHS Foundation Trust* 2,451 492 1,944 79.3% 77.7% - 80.9% 15 0.6%
RR7 Gateshead Health NHS Foundation Trust 463 159 304 65.7% 61.2% - 69.8% 0 0.0%
RLT George Eliot Hospital NHS Trust 482 168 310 64.3% 59.9% - 68.5% 4 0.8%
RTE Gloucestershire Hospitals NHS Foundation Trust 1,547 356 1,191 77.0% 74.8% - 79.0% 0 0.0%
RN3 Great Western Hospitals NHS Foundation Trust* 1,038 221 813 78.3% 75.7% - 80.7% 4 0.4%
RJ1 Guy's and St Thomas' NHS Foundation Trust 1,706 154 1,552 91.0% 89.5% - 92.2% 0 0.0%
RN5 Hampshire Hospitals NHS Foundation Trust 1,314 231 1,075 81.8% 79.6% - 83.8% 8 0.6%
RCD Harrogate and District NHS Foundation Trust 467 59 401 85.9% 82.4% - 88.7% 7 1.5%
RR1 Heart Of England NHS Foundation Trust 2,403 613 1,629 161 6.7%
RD7 Heatherwood and Wexham Park Hospitals NHS Foundation Trust*
RQQ Hinchingbrooke Health Care NHS Trust 567 126 441 77.8% 74.2% - 81.0% 0 0.0%
RQX Homerton University Hospital NHS Foundation Trust 1,472 120 1,352 91.8% 90.3% - 93.1% 0 0.0%
RWA Hull and East Yorkshire Hospitals NHS Trust 1,338 437 901 67.3% 64.8% - 69.8% 0 0.0%
RYJ Imperial College Healthcare NHS Trust
RGQ Ipswich Hospital NHS Trust 906 179 720 79.5% 76.7% - 82.0% 7 0.8%
R1F Isle Of Wight NHS Trust 303 101 202 66.7% 61.2% - 71.7% 0 0.0%
RGP James Paget University Hospitals NHS Foundation Trust 510 145 364 71.4% 67.3% - 75.1% 1 0.2%
RNQ Kettering General Hospital NHS Foundation Trust* 921 252 643 69.8% 66.8% - 72.7% 26 2.8%
RJZ King's College Hospital NHS Foundation Trust 1,326 89 1,214 91.6% 89.9% - 92.9% 23 1.7%
RAX Kingston Hospital NHS Foundation Trust 1,488 100 1,352 90.9% 89.3% - 92.2% 36 2.4%
RXN Lancashire Teaching Hospitals NHS Foundation Trust 1,151 378 773 67.2% 64.4% - 69.8% 0 0.0%
RR8 Leeds Teaching Hospitals NHS Trust 2,328 563 1,667 71.6% 69.7% - 73.4% 98 4.2%
RJ2 Lewisham and Greenwich NHS Trust 2,107 299 1,749 83.0% 81.3% - 84.6% 59 2.8%
REP Liverpool Women's NHS Foundation Trust 1,922 888 1,034 53.8% 51.6% - 56.0% 0 0.0%
R1K London North West Healthcare NHS Trust* 1,696 170 1,501 88.5% 86.9% - 89.9% 25 1.5%
RC9 Luton and Dunstable University Hospital NHS Foundation Trust 1,324 294 1,030 77.8% 75.5% - 80.0% 0 0.0%
RWF Maidstone and Tunbridge Wells NHS Trust 1,472 260 1,184 80.4% 78.3% - 82.4% 28 1.9%
RPA Medway NHS Foundation Trust 1,265 379 855 67.6% 65.0% - 70.1% 31 2.5%
RBT Mid Cheshire Hospitals NHS Foundation Trust 723 212 511 70.7% 67.3% - 73.9% 0 0.0%
RQ8 Mid Essex Hospital Services NHS Trust 1,170 300 848 72.5% 69.8% - 75.0% 22 1.9%
RJD Mid Staffordshire NHS Foundation Trust
RXF Mid Yorkshire Hospitals NHS Trust 1,499 507 992 66.2% 63.7% - 68.5% 0 0.0%
RD8 Milton Keynes Hospital NHS Foundation Trust 966 56 362 548 56.7%
RM1 Norfolk and Norwich University Hospitals NHS Foundation Trust 1,413 237 1,043 133 9.4%
RVJ North Bristol NHS Trust
RNL North Cumbria University Hospitals NHS Trust 714 245 469 65.7% 62.1% - 69.1% 0 0.0%
RAP North Middlesex University Hospital NHS Trust 1,253 135 1,118 89.2% 87.4% - 90.8% 0 0.0%
RVW North Tees and Hartlepool NHS Foundation Trust 738 372 366 49.6% 46.0% - 53.2% 0 0.0%
RV8 North West London Hospitals NHS Trust*
RNS Northampton General Hospital NHS Trust 1,175 278 877 74.6% 72.1% - 77.0% 20 1.7%
RBZ Northern Devon Healthcare NHS Trust 344 56 275 79.9% 75.4% - 83.8% 13 3.8%
RJL Northern Lincolnshire and Goole NHS Foundation Trust 1,072 363 709 66.1% 63.3% - 68.9% 0 0.0%
RTF Northumbria Healthcare NHS Foundation Trust 578 226 352 60.9% 56.9% - 64.8% 0 0.0%
RX1 Nottingham University Hospitals NHS Trust
RTH Oxford University Hospitals NHS Trust 2,117 393 1,723 81.4% 79.7% - 83.0% 1 0.0%
RW6 Pennine Acute Hospitals NHS Trust 2,392 771 1,567 65.5% 63.6% - 67.4% 54 2.3%
RGN Peterborough and Stamford Hospitals NHS Foundation Trust 1,271 299 797 175 13.8%
RK9 Plymouth Hospitals NHS Trust 1,045 256 783 74.9% 72.2% - 77.5% 6 0.6%
RD3 Poole Hospital NHS Foundation Trust 1,161 219 934 80.4% 78.1% - 82.6% 8 0.7%
RHU Portsmouth Hospitals NHS Trust 1,470 403 1,060 72.1% 69.8% - 74.3% 7 0.5%
RHW Royal Berkshire NHS Foundation Trust 1,340 254 1,070 79.9% 77.6% - 81.9% 16 1.2%
REF Royal Cornwall Hospitals NHS Trust 1,141 241 900 78.9% 76.4% - 81.1% 0 0.0%
RH8 Royal Devon and Exeter NHS Foundation Trust 990 161 763 66 6.7%
RAL Royal Free London NHS Foundation Trust* 2,123 348 1,747 82.3% 80.6% - 83.9% 28 1.3%
RA2 Royal Surrey County Hospital NHS Foundation Trust 753 107 646 85.8% 83.1% - 88.1% 0 0.0%
RD1 Royal United Hospitals Bath NHS Foundation Trust* 1,221 215 993 81.3% 79.0% - 83.4% 13 1.1%
RNZ Salisbury NHS Foundation Trust 560 93 467 83.4% 80.1% - 86.2% 0 0.0%
RXK Sandwell and West Birmingham Hospitals NHS Trust 1,370 270 1,018 82 6.0%
RHQ Sheffield Teaching Hospitals NHS Foundation Trust 1,732 358 1,374 79.3% 77.4% - 81.2% 0 0.0%
RK5 Sherwood Forest Hospitals NHS Foundation Trust 823 237 563 68.4% 65.2% - 71.5% 23 2.8%
2015/16 Q4
Number of maternities (1) Maternities where breastfeeding was known (2) Maternities whose breastfeeding status not known (3)
2015/16 Q1 2015/16 Q2 2015/16 Q3 2015/16 Q4 2015/16 Q1 2015/16 Q2 2015/16 Q3

Table 4 : Initiation of breastfeeding, by NHS Trust - Quarterly 2015/16
Source: NHS England
Crown Copyright © 2015
2015/16 Q1 2015/16 Q2 2015/16 Q3 2015/16 Q4
Code Name No. No. No. No.
No. not
initiated
No.
initiated %
95%
confidence
interval
No. not
initiated
No.
initiated %
95%
confidence
interval
No. not
initiated
No.
initiated %
95%
confidence
interval
No. not
initiated
No.
initiated %
95%
confidence
interval No. % No. % No. % No. %
2015/16 Q4
Number of maternities (1) Maternities where breastfeeding was known (2) Maternities whose breastfeeding status not known (3)
2015/16 Q1 2015/16 Q2 2015/16 Q3 2015/16 Q4 2015/16 Q1 2015/16 Q2 2015/16 Q3
RXW Shrewsbury and Telford Hospital NHS Trust 1,095 273 802 73.2% 70.5% - 75.8% 20 1.8%
RA9 South Devon Healthcare NHS Foundation Trust
RYQ South London Healthcare NHS Trust
RTR South Tees Hospitals NHS Foundation Trust 1,175 481 694 59.1% 56.2% - 61.8% 0 0.0%
RE9 South Tyneside NHS Foundation Trust 305 148 157 51.5% 45.9% - 57.0% 0 0.0%
RJC South Warwickshire NHS Foundation Trust 659 159 500 75.9% 72.5% - 79.0% 0 0.0%
RAJ Southend University Hospital NHS Foundation Trust 932 165 757 81.2% 78.6% - 83.6% 10 1.1%
RVY Southport and Ormskirk Hospital NHS Trust 654 248 398 60.9% 57.1% - 64.5% 8 1.2%
RJ7 St George's University Hospitals NHS Foundation Trust 1,262 78 1,153 91.4% 89.7% - 92.8% 31 2.5%
RBN St Helens and Knowsley Hospitals NHS Trust 957 456 497 51.9% 48.8% - 55.1% 4 0.4%
RWJ Stockport NHS Foundation Trust 814 262 552 67.8% 64.5% - 70.9% 0 0.0%
RTP Surrey and Sussex Healthcare NHS Trust 1,139 202 937 82.3% 79.9% - 84.4% 0 0.0%
RMP Tameside Hospital NHS Foundation Trust 583 210 373 64.0% 60.0% - 67.8% 0 0.0%
RBA Taunton and Somerset NHS Foundation Trust 801 151 649 81.0% 78.2% - 83.6% 1 0.1%
RNA The Dudley Group NHS Foundation Trust 1,091 450 596 54.6% 51.7% - 57.6% 45 4.1%
RAS The Hillingdon Hospitals NHS Foundation Trust 1,067 155 904 84.7% 82.4% - 86.8% 8 0.7%
RTD The Newcastle Upon Tyne Hospitals NHS Foundation Trust 1,848 475 1,283 69.4% 67.3% - 71.5% 90 4.9%
RQW The Princess Alexandra Hospital NHS Trust 1,090 318 772 70.8% 68.1% - 73.4% 0 0.0%
RCX The Queen Elizabeth Hospital, King's Lynn, NHS Foundation Trust 575 171 403 70.1% 66.2% - 73.7% 1 0.2%
RFR The Rotherham NHS Foundation Trust 657 266 391 59.5% 55.7% - 63.2% 0 0.0%
RDZ The Royal Bournemouth and Christchurch Hospitals NHS Foundation Trust 93 16 77 82.8% 73.9% - 89.1% 0 0.0%
RL4 The Royal Wolverhampton NHS Trust 1,128 371 757 67.1% 64.3% - 69.8% 0 0.0%
RKE The Whittington Hospital NHS Trust 887 87 800 90.2% 88.1% - 92.0% 0 0.0%
RWD United Lincolnshire Hospitals NHS Trust 1,315 361 721 233 17.7%
RRV University College London Hospitals NHS Foundation Trust 1,645 95 1,464 86 5.2%
RJE University Hospitals Of North Midlands NHS Trust 1,555 579 976 62.8% 60.3% - 65.1% 0 0.0%
RM2 University Hospital Of South Manchester NHS Foundation Trust 1,098 252 844 76.9% 74.3% - 79.3% 2 0.2%
RHM University Hospital Southampton NHS Foundation Trust 1,508 322 1,152 76.4% 74.2% - 78.5% 34 2.3%
RA7 University Hospitals Bristol NHS Foundation Trust 1,297 219 1,065 82.1% 79.9% - 84.1% 13 1.0%
RKB University Hospitals Coventry and Warwickshire NHS Trust 1,520 293 1,227 80.7% 78.7% - 82.6% 0 0.0%
RWE University Hospitals Of Leicester NHS Trust 2,588 650 1,938 74.9% 73.2% - 76.5% 0 0.0%
RTX University Hospitals Of Morecambe Bay NHS Foundation Trust 817 266 531 65.0% 61.7% - 68.2% 20 2.4%
RBK Walsall Healthcare NHS Trust 1,201 418 783 65.2% 62.5% - 67.8% 0 0.0%
RWW Warrington and Halton Hospitals NHS Foundation Trust 711 240 468 65.8% 62.3% - 69.2% 3 0.4%
RWG West Hertfordshire Hospitals NHS Trust 1,340 347 993 74.1% 71.7% - 76.4% 0 0.0%
RFW West Middlesex University Hospital NHS Trust 1,227 99 1,125 91.7% 90.0% - 93.1% 3 0.2%
RGR West Suffolk NHS Foundation Trust
RYR Western Sussex Hospitals NHS Foundation Trust 1,329 220 1,052 79.2% 76.9% - 81.3% 57 4.3%
RA3 Weston Area Health NHS Trust 62 12 48 77.4% 65.6% - 86.0% 2 3.2%
RBL Wirral University Teaching Hospital NHS Foundation Trust 816 356 460 56.4% 52.9% - 59.7% 0 0.0%
RWP Worcestershire Acute Hospitals NHS Trust 1,490 533 957 64.2% 61.8% - 66.6% 0 0.0%
RRF Wrightington, Wigan and Leigh NHS Foundation Trust 704 360 344 48.9% 45.2% - 52.6% 0 0.0%
RLQ Wye Valley NHS Trust 403 122 281 69.7% 65.1% - 74.0% 0 0.0%
RA4 Yeovil District Hospital NHS Foundation Trust 491 96 384 11
RCB York Teaching Hospital NHS Foundation Trust 1,230 307 804 119 9.7%
Notes:
1. Red cells mean that no. of maternities does not meet validation criteria (see definitions sheet for details). 1
2. Blank cells mean that data do not meet validation criteria (see definitions sheet for details).
3. Shaded cells mean that percentage of mothers' whose breastfeeding status was recorded falls short of data quality standard of 95%.
* See Data Quality note for explanation

Wrightington, Wigan & LeighN Tees & Hartlepool
S TynesideSt Helens & Knowsley
Liverpool Women'sDudley
City SunderlandWirral Uni
County Durham & DarlingtonS TeesRotherham
Southport & OrmskirkNorthumbria
Uni Of North MidlandsBarking, Havering & Redbridge Uni
TamesideWorcestershire AcuteGeorge Eliot
Uni Of Morecambe BayWalsall HealthcareDoncaster & BassetlawPennine AcuteGatesheadN Cumbria UniWarrington & HaltonNorthern Lincolnshire & GooleBlackpoolMid YorkshireIsle Of WightBoltonCountess Of ChesterRoyal WolverhamptonLancashireHull & East YorkshireMedwayStockportE Sussex HealthcareSherwood ForestCentral Manchester Uni
Newcastle Upon TyneWye ValleyKettering GeneralDartford & GraveshamQueen Elizabeth, King's Lynn,East Kent UniMid CheshirePrincess AlexandraBradfordBurtonJames Paget UniversityLeedsPortsmouthMid EssexBasildon & Thurrock Uni
Shrewsbury & TelfordEast CheshireWest HertfordshireBirmingham Women'sEast LancashireNorthampton GeneralDerbyUni Of LeicesterPlymouth
S WarwickshireUni SouthamptonEast & North HertfordshireUni Of South ManchesterChesterfield RoyalGloucestershireWeston AreaCroydonDorset CountyHinchingbrookeLuton & Dunstable UniAiredaleGreat WesternRoyal CornwallWestern SussexColchester UniFrimley HealthSheffieldIpswichRoyal BerkshireNorthern DevonMaidstone & Tunbridge WellsPooleUni Coventry & WarwickshireTaunton & SomersetSouthend UniRoyal United BathOxford UniHampshireUni BristolSurrey & Sussex HealthcareRoyal Free LondonBedfordRoyal Bournemouth & ChristchurchLewisham & GreenwichSalisbury
HillingdonAshford & St Peter'sRoyal Surrey CountyHarrogate & District
Brighton & Sussex UniChelsea & Westminster
London N W HealthcareN Middlesex Uni
WhittingtonKingstonGuy's & St Thomas'St George's HealthcareKing's CollegeWest Middlesex UniHomerton Uni
0% 10% 20% 30% 40% 50% 60% 70% 80% 90% 100%
Mothers initiating breastfeeding as a percentage of maternities by NHS Trusts in England
2015/16 Q1
NHS Trusts with < 5% not Knowns & passing maternities checks

AiredaleAshford & St Peter'sBedfordBlackpoolBoltonBradfordBurtonCentral Manchester UniChelsea & WestminsterChesterfield RoyalCity SunderlandCountess Of ChesterCounty Durham & DarlingtonDartford & GraveshamDerbyDoncaster & BassetlawEast & North HertfordshireEast LancashireE Sussex HealthcareGatesheadGloucestershireGuy's & St Thomas'HinchingbrookeHomerton UniHull & East YorkshireIsle Of WightLancashireLiverpool Women'sLuton & Dunstable UniMid CheshireMid YorkshireN Cumbria UniN Middlesex UniN Tees & HartlepoolNorthern Lincolnshire & GooleNorthumbriaRoyal CornwallRoyal Surrey CountySalisburySheffieldS TeesS TynesideS WarwickshireStockportSurrey & Sussex HealthcareTamesidePrincess AlexandraRotherhamRoyal Bournemouth & ChristchurchRoyal WolverhamptonWhittingtonUni Of North MidlandsUni Coventry & WarwickshireUni Of LeicesterWalsall HealthcareWest HertfordshireWirral UniWorcestershire AcuteWrightington, Wigan & LeighWye ValleyOxford UniBasildon & Thurrock UniTaunton & SomersetQueen Elizabeth, King's Lynn,Uni Of South ManchesterJames Paget UniversityColchester UniWest Middlesex UniGreat WesternSt Helens & KnowsleyWarrington & HaltonBarking, Havering & Redbridge UniPortsmouthPlymouthHampshireFrimley HealthPooleHillingdonIpswichGeorge EliotBrighton & Sussex UniUni BristolDorset CountyRoyal United BathSouthend UniRoyal BerkshireSouthport & OrmskirkRoyal Free LondonLondon N W HealthcareHarrogate & DistrictNorthampton GeneralKing's CollegeShrewsbury & TelfordMid EssexMaidstone & Tunbridge WellsBirmingham Women'sUni SouthamptonPennine AcuteCroydonKingstonUni Of Morecambe BayMedwaySt George's HealthcareSherwood ForestLewisham & GreenwichKettering General
Weston AreaEast CheshireNorthern Devon
DudleyLeedsWestern Sussex
East Kent UniNewcastle Upon Tyne
Uni College LondonBarts
Sandwell & West BirminghamBuckinghamshireRoyal Devon & ExeterHeart Of England
Norfolk & Norwich UniYork
Peterborough & StamfordUnited Lincolnshire
Milton Keynes
0% 10% 20% 30% 40% 50% 60%
Mothers not known initiating breastfeeding as a percentage of maternities by NHS
Trusts in England 2015/16 Q1
Q1 2015/16 Quarter Actual v Not knowns target 5%

Table 5: Initiation of breastfeeding, by CCG and Area Team - Quarterly 2015/16
Source: NHS England
Crown Copyright © 2015
2015/16 Q1 2015/16 Q2 2015/16 Q3 2015/16 Q4
Code Name Code Area Team No. No. No. No.
No. not
initiated
No.
initiated %
95%
confidence
interval
No. not
initiated
No.
initiated %
95%
confidence
interval
No. not
initiated
No.
initiated %
95%
confidence
interval
No. not
initiated
No.
initiated %
95%
confidence
interval No. % No. % No. % No. % ONS Code
Q00 England 150,590 36,455 111,088 73.8% 73.5% - 74.0% 3047 2.0%
Q44 Cheshire, Warrington And Wirral Area Team 3,214 1,041 2,157 67.1% 65.5% - 68.7% 16 0.5%
Q45 Durham, Darlington And Tees Area Team 3,154 1,428 1,716 54.4% 52.7% - 56.1% 10 0.3%
Q46 Greater Manchester Area Team 9,005 2,959 5,986 66.5% 65.5% - 67.4% 60 0.7%
Q47 Lancashire Area Team 4,098 1,272 2,818 68.8% 67.3% - 70.2% 8 0.2%
Q48 Merseyside Area Team 3,321 1,529 1,782 53.7% 52.0% - 55.3% 10 0.3%
Q49 Cumbria, Northumberland, Tyne And Wear Area Team 4,920 1,661 3,165 64.3% 63.0% - 65.7% 94 1.9%
Q50 North Yorkshire And Humber Area Team 4,142 1,185 2,826 68.2% 66.8% - 69.6% 131 3.2%
Q51 South Yorkshire And Bassetlaw Area Team 4,476 1,529 2,941 65.7% 64.3% - 67.1% 6 0.1%
Q52 West Yorkshire Area Team 7,176 1,936 5,144 71.7% 70.6% - 72.7% 96 1.3%
Q53 Arden, Herefordshire And Worcestershire Area Team 4,508 1,251 3,245 72.0% 70.7% - 73.3% 12 0.3%
Q54 Birmingham And The Black Country Area Team 8,588 2,432 5,847 68.1% 67.1% - 69.1% 309 3.6%
Q55 Derbyshire And Nottinghamshire Area Team 3,281 847 2,394 40
Q56 East Anglia Area Team 4,815 1,069 3,482 264 5.5%
Q57 Essex Area Team 4,889 1,203 3,645 74.6% 73.3% - 75.8% 41 0.8%
Q58 Hertfordshire And The South Midlands Area Team 8,642 1,860 6,183 599 6.9%
Q59 Leicestershire And Lincolnshire Area Team 4,766 1,209 3,291 266 5.6%
Q60 Shropshire And Staffordshire Area Team 3,999 1,250 2,720 68.0% 66.6% - 69.4% 29 0.7%
Q64 Bath, Gloucestershire, Swindon And Wiltshire Area Team 3,884 801 3,066 78.9% 77.6% - 80.2% 17 0.4%
Q65 Bristol, North Somerset, Somerset And South Gloucestershire Area Team 2,808 503 2,277 28
Q66 Devon, Cornwall And Isles Of Scilly Area Team 3,534 720 2,727 87
Q67 Kent And Medway Area Team 5,113 1,306 3,670 71.8% 70.5% - 73.0% 137 2.7%
Q68 Surrey And Sussex Area Team 6,878 1,145 5,656 82.2% 81.3% - 83.1% 77 1.1%
Q69 Thames Valley Area Team 6,262 1,228 4,925 78.6% 77.6% - 79.6% 109 1.7%
Q70 Wessex Area Team 7,231 1,553 5,603 77.5% 76.5% - 78.4% 75 1.0%
Q71 London Area Team 27,647 3,492 23,635 85.5% 85.1% - 85.9% 520 1.9%
01C NHS Eastern Cheshire CCG Q44 Cheshire, Warrington and Wirral Area Team 469 97 359 76.5% 72.5% - 80.2% 13 2.8% E38000056
01R NHS South Cheshire CCG Q44 Cheshire, Warrington and Wirral Area Team 472 131 341 72.2% 68.0% - 76.1% 0 0.0% E38000151
02D NHS Vale Royal CCG Q44 Cheshire, Warrington and Wirral Area Team 279 91 188 67.4% 61.7% - 72.6% 0 0.0% E38000189
02E NHS Warrington CCG Q44 Cheshire, Warrington and Wirral Area Team 568 166 399 70.2% 66.4% - 73.9% 3 0.5% E38000194
02F NHS West Cheshire CCG Q44 Cheshire, Warrington and Wirral Area Team 599 201 398 66.4% 62.6% - 70.1% 0 0.0% E38000196
12F NHS Wirral CCG Q44 Cheshire, Warrington and Wirral Area Team 827 355 472 57.1% 53.7% - 60.4% 0 0.0% E38000208
00C NHS Darlington CCG Q45 Durham, Darlington and Tees Area Team 299 116 183 61.2% 55.6% - 66.6% 0 0.0% E38000042
00D NHS Durham Dales, Easington and Sedgefield CCG Q45 Durham, Darlington and Tees Area Team 708 350 355 50.1% 46.5% - 53.8% 3 0.4% E38000047
00K NHS Hartlepool and Stockton-On-Tees CCG Q45 Durham, Darlington and Tees Area Team 984 477 504 51.2% 48.1% - 54.3% 3 0.3% E38000075
00J NHS North Durham CCG Q45 Durham, Darlington and Tees Area Team 564 225 337 59.8% 55.7% - 63.7% 2 0.4% E38000116
00M NHS South Tees CCG Q45 Durham, Darlington and Tees Area Team 599 260 337 2 E38000162
00T NHS Bolton CCG Q46 Greater Manchester Area Team 878 275 603 68.7% 65.5% - 71.7% 0 0.0% E38000016
00V NHS Bury CCG Q46 Greater Manchester Area Team 558 155 397 71.1% 67.3% - 74.8% 6 1.1% E38000024
00W NHS Central Manchester CCG Q46 Greater Manchester Area Team 778 192 586 75.3% 72.2% - 78.2% 0 0.0% E38000032
01D NHS Heywood, Middleton and Rochdale CCG Q46 Greater Manchester Area Team 696 247 427 61.4% 57.7% - 64.9% 22 3.2% E38000080
01M NHS North Manchester CCG Q46 Greater Manchester Area Team 753 259 488 64.8% 61.3% - 68.1% 6 0.8% E38000123
00Y NHS Oldham CCG Q46 Greater Manchester Area Team 833 272 542 65.1% 61.8% - 68.2% 19 2.3% E38000135
01G NHS Salford CCG Q46 Greater Manchester Area Team 867 292 573 66.1% 62.9% - 69.2% 2 0.2% E38000143
01N NHS South Manchester CCG Q46 Greater Manchester Area Team 536 168 366 68.3% 64.2% - 72.1% 2 0.4% E38000158
01W NHS Stockport CCG Q46 Greater Manchester Area Team 836 249 586 70.1% 66.9% - 73.1% 1 0.1% E38000174
01Y NHS Tameside and Glossop CCG Q46 Greater Manchester Area Team 707 258 448 63.4% 59.8% - 66.8% 1 0.1% E38000182
02A NHS Trafford CCG Q46 Greater Manchester Area Team 696 181 515 74.0% 70.6% - 77.1% 0 0.0% E38000187
02H NHS Wigan Borough CCG Q46 Greater Manchester Area Team 867 411 455 52.5% 49.2% - 55.8% 1 0.1% E38000205
00Q NHS Blackburn With Darwen CCG Q47 Lancashire Area Team 513 132 381 74.3% 70.3% - 77.9% 0 0.0% E38000014
00R NHS Blackpool CCG Q47 Lancashire Area Team 437 164 273 62.5% 57.8% - 66.9% 0 0.0% E38000015
00X NHS Chorley and South Ribble CCG Q47 Lancashire Area Team 504 191 313 62.1% 57.8% - 66.2% 0 0.0% E38000034
01A NHS East Lancashire CCG Q47 Lancashire Area Team 1,063 276 787 74.0% 71.3% - 76.6% 0 0.0% E38000050
02M NHS Fylde & Wyre CCG Q47 Lancashire Area Team 324 94 230 71.0% 65.8% - 75.7% 0 0.0% E38000060
01E NHS Greater Preston CCG Q47 Lancashire Area Team 616 190 426 69.2% 65.4% - 72.7% 0 0.0% E38000065
01K NHS Lancashire North CCG Q47 Lancashire Area Team 382 121 255 66.8% 61.9% - 71.3% 6 1.6% E38000093
02G NHS West Lancashire CCG Q47 Lancashire Area Team 259 104 153 59.1% 53.0% - 64.9% 2 0.8% E38000200
01F NHS Halton CCG Q48 Merseyside Area Team 354 182 172 48.6% 43.4% - 53.8% 0 0.0% E38000068
01J NHS Knowsley CCG Q48 Merseyside Area Team 473 253 219 46.3% 41.9% - 50.8% 1 0.2% E38000091
99A NHS Liverpool CCG Q48 Merseyside Area Team 1,379 630 746 54.1% 51.5% - 56.7% 3 0.2% E38000101
01T NHS South Sefton CCG Q48 Merseyside Area Team 382 177 204 53.4% 48.4% - 58.3% 1 0.3% E38000161
01V NHS Southport and Formby CCG Q48 Merseyside Area Team 237 88 147 62.0% 55.7% - 68.0% 2 0.8% E38000170
01X NHS St Helens CCG Q48 Merseyside Area Team 496 199 294 59.3% 54.9% - 63.5% 3 0.6% E38000172
01H NHS Cumbria CCG Q49 Cumbria, Northumberland, Tyne and Wear Area Team 1,191 403 773 64.9% 62.1% - 67.6% 15 1.3% E38000041
00F NHS Gateshead CCG Q49 Cumbria, Northumberland, Tyne and Wear Area Team 588 187 392 66.7% 62.8% - 70.4% 9 1.5% E38000061
00G NHS Newcastle North and East CCG Q49 Cumbria, Northumberland, Tyne and Wear Area Team 357 89 252 70.6% 65.7% - 75.1% 16 4.5% E38000111
00H NHS Newcastle West CCG Q49 Cumbria, Northumberland, Tyne and Wear Area Team 480 126 328 26 5.4% E38000112
99C NHS North Tyneside CCG Q49 Cumbria, Northumberland, Tyne and Wear Area Team 556 182 357 64.2% 60.1% - 68.1% 17 3.1% E38000127
00L NHS Northumberland CCG Q49 Cumbria, Northumberland, Tyne and Wear Area Team 663 210 446 67.3% 63.6% - 70.7% 7 1.1% E38000130
00N NHS South Tyneside CCG Q49 Cumbria, Northumberland, Tyne and Wear Area Team 368 161 204 55.4% 50.3% - 60.4% 3 0.8% E38000163
00P NHS Sunderland CCG Q49 Cumbria, Northumberland, Tyne and Wear Area Team 717 303 413 57.6% 54.0% - 61.2% 1 0.1% E38000176
02Y NHS East Riding Of Yorkshire CCG Q50 North Yorkshire and Humber Area Team 623 175 430 69.0% 65.3% - 72.5% 18 2.9% E38000052
03D NHS Hambleton, Richmondshire and Whitby CCG Q50 North Yorkshire and Humber Area Team 280 77 202 1 E38000069
03E NHS Harrogate and Rural District CCG Q50 North Yorkshire and Humber Area Team 366 41 319 87.2% 83.3% - 90.2% 6 1.6% E38000073
03F NHS Hull CCG Q50 North Yorkshire and Humber Area Team 916 335 579 63.2% 60.0% - 66.3% 2 0.2% E38000085
03H NHS North East Lincolnshire CCG Q50 North Yorkshire and Humber Area Team 423 156 266 62.9% 58.2% - 67.4% 1 0.2% E38000119
03K NHS North Lincolnshire CCG Q50 North Yorkshire and Humber Area Team 451 148 299 66.3% 61.8% - 70.5% 4 0.9% E38000122
03M NHS Scarborough and Ryedale CCG Q50 North Yorkshire and Humber Area Team 270 73 154 43 15.9% E38000145
03Q NHS Vale Of York CCG Q50 North Yorkshire and Humber Area Team 813 180 577 56 6.9% E38000188
02P NHS Barnsley CCG Q51 South Yorkshire and Bassetlaw Area Team 984 516 464 4 E38000006
02Q NHS Bassetlaw CCG Q51 South Yorkshire and Bassetlaw Area Team 277 94 183 66.1% 60.3% - 71.4% 0 0.0% E38000008
02X NHS Doncaster CCG Q51 South Yorkshire and Bassetlaw Area Team 911 323 587 64.4% 61.3% - 67.5% 1 0.1% E38000044
03L NHS Rotherham CCG Q51 South Yorkshire and Bassetlaw Area Team 706 259 447 63.3% 59.7% - 66.8% 0 0.0% E38000141
03N NHS Sheffield CCG Q51 South Yorkshire and Bassetlaw Area Team 1,598 337 1,260 78.8% 76.8% - 80.8% 1 0.1% E38000146
02N NHS Airedale, Wharfedale and Craven CCG Q52 West Yorkshire Area Team 438 92 341 77.9% 73.7% - 81.5% 5 1.1% E38000001
02W NHS Bradford City CCG Q52 West Yorkshire Area Team 537 144 390 72.6% 68.7% - 76.2% 3 0.6% E38000018
02R NHS Bradford Districts CCG Q52 West Yorkshire Area Team 1,095 318 774 70.7% 67.9% - 73.3% 3 0.3% E38000019
02T NHS Calderdale CCG Q52 West Yorkshire Area Team 540 123 417 77.2% 73.5% - 80.6% 0 0.0% E38000025
03A NHS Greater Huddersfield CCG Q52 West Yorkshire Area Team 576 132 441 3 E38000064
02V NHS Leeds North CCG Q52 West Yorkshire Area Team 604 115 474 78.5% 75.0% - 81.6% 15 2.5% E38000094
03G NHS Leeds South and East CCG Q52 West Yorkshire Area Team 848 266 549 64.7% 61.5% - 67.9% 33 3.9% E38000095
03C NHS Leeds West CCG Q52 West Yorkshire Area Team 976 232 715 73.3% 70.4% - 75.9% 29 3.0% E38000096
03J NHS North Kirklees CCG Q52 West Yorkshire Area Team 566 139 424 3 E38000121
03R NHS Wakefield CCG Q52 West Yorkshire Area Team 996 375 619 62.1% 59.1% - 65.1% 2 0.2% E38000190
05A NHS Coventry and Rugby CCG Q53 Arden, Herefordshire and Worcestershire Area Team 1,484 304 1,176 79.2% 77.1% - 81.2% 4 0.3% E38000038
05F NHS Herefordshire CCG Q53 Arden, Herefordshire and Worcestershire Area Team 423 124 299 70.7% 66.2% - 74.8% 0 0.0% E38000078
05J NHS Redditch and Bromsgrove CCG Q53 Arden, Herefordshire and Worcestershire Area Team 460 168 291 63.3% 58.8% - 67.5% 1 0.2% E38000139
05R NHS South Warwickshire CCG Q53 Arden, Herefordshire and Worcestershire Area Team 646 160 484 74.9% 71.4% - 78.1% 2 0.3% E38000164
05T NHS South Worcestershire CCG Q53 Arden, Herefordshire and Worcestershire Area Team 745 230 515 69.1% 65.7% - 72.3% 0 0.0% E38000166
05H NHS Warwickshire North CCG Q53 Arden, Herefordshire and Worcestershire Area Team 455 146 304 5 E38000195
06D NHS Wyre Forest CCG Q53 Arden, Herefordshire and Worcestershire Area Team 295 119 176 59.7% 54.0% - 65.1% 0 0.0% E38000211
13P NHS Birmingham Crosscity CCG Q54 Birmingham and The Black Country Area Team 2,492 627 1,748 70.1% 68.3% - 71.9% 117 4.7% E38000012
04X NHS Birmingham South and Central CCG Q54 Birmingham and The Black Country Area Team 934 220 692 74.1% 71.2% - 76.8% 22 2.4% E38000013
05C NHS Dudley CCG Q54 Birmingham and The Black Country Area Team 876 350 496 56.6% 53.3% - 59.9% 30 3.4% E38000046
05L NHS Sandwell and West Birmingham CCG Q54 Birmingham and The Black Country Area Team 1,859 504 1,266 68.1% 65.9% - 70.2% 89 4.8% E38000144
05P NHS Solihull CCG Q54 Birmingham and The Black Country Area Team 653 152 455 46 7.0% E38000149
05Y NHS Walsall CCG Q54 Birmingham and The Black Country Area Team 919 299 619 67.4% 64.3% - 70.3% 1 0.1% E38000191
06A NHS Wolverhampton CCG Q54 Birmingham and The Black Country Area Team 855 280 571 66.8% 63.6% - 69.9% 4 0.5% E38000210
03X NHS Erewash CCG Q55 Derbyshire and Nottinghamshire Area Team 119 35 84 0 E38000058
03Y NHS Hardwick CCG Q55 Derbyshire and Nottinghamshire Area Team 258 71 183 70.9% 65.1% - 76.1% 4 1.6% E38000071
04E NHS Mansfield and Ashfield CCG Q55 Derbyshire and Nottinghamshire Area Team 486 139 333 14 E38000103
04H NHS Newark & Sherwood CCG Q55 Derbyshire and Nottinghamshire Area Team 265 73 173 19 7.2% E38000109
04J NHS North Derbyshire CCG Q55 Derbyshire and Nottinghamshire Area Team 675 154 521 77.2% 73.9% - 80.2% 0 0.0% E38000115
04K NHS Nottingham City CCG Q55 Derbyshire and Nottinghamshire Area Team 16 4 11 1 6.3% E38000132
04L NHS Nottingham North and East CCG Q55 Derbyshire and Nottinghamshire Area Team 15 3 11 1 6.7% E38000133
04M NHS Nottingham West CCG Q55 Derbyshire and Nottinghamshire Area Team 10 3 7 0 E38000134
04N NHS Rushcliffe CCG Q55 Derbyshire and Nottinghamshire Area Team 4 0 4 0 E38000142
04R NHS Southern Derbyshire CCG Q55 Derbyshire and Nottinghamshire Area Team 1,433 365 1,067 74.5% 72.1% - 76.6% 1 0.1% E38000169
06H NHS Cambridgeshire and Peterborough CCG Q56 East Anglia Area Team 1,588 380 1,085 123 7.7% E38000026
06M NHS Great Yarmouth and Waveney CCG Q56 East Anglia Area Team 569 158 402 70.7% 66.8% - 74.2% 9 1.6% E38000063
06L NHS Ipswich and East Suffolk CCG Q56 East Anglia Area Team 909 182 720 79.2% 76.4% - 81.7% 7 0.8% E38000086
06V NHS North Norfolk CCG Q56 East Anglia Area Team 335 67 240 28 8.4% E38000124
06W NHS Norwich CCG Q56 East Anglia Area Team 544 79 424 41 7.5% E38000131
06Y NHS South Norfolk CCG Q56 East Anglia Area Team 473 82 337 54 11.4% E38000159
07J NHS West Norfolk CCG Q56 East Anglia Area Team 381 115 264 69.3% 64.5% - 73.7% 2 0.5% E38000203
07K NHS West Suffolk CCG Q56 East Anglia Area Team 13 6 7 0 E38000204
99E NHS Basildon and Brentwood CCG Q57 Essex Area Team 669 185 480 4 E38000007
99F NHS Castle Point and Rochford CCG Q57 Essex Area Team 569 140 426 3 E38000030
06Q NHS Mid Essex CCG Q57 Essex Area Team 996 252 722 72.5% 69.6% - 75.2% 22 2.2% E38000106
06T NHS North East Essex CCG Q57 Essex Area Team 883 181 700 79.3% 76.5% - 81.8% 2 0.2% E38000117
99G NHS Southend CCG Q57 Essex Area Team 523 81 437 83.6% 80.1% - 86.5% 5 1.0% E38000168
07G NHS Thurrock CCG Q57 Essex Area Team 397 119 276 2 E38000185
07H NHS West Essex CCG Q57 Essex Area Team 852 245 604 70.9% 67.8% - 73.8% 3 0.4% E38000197
2015/16 Q4
Number of maternities (1) Maternities where breastfeeding was known (2) Maternities whose breastfeeding status not known (3)
2015/16 Q1 2015/16 Q2 2015/16 Q3 2015/16 Q4 2015/16 Q1 2015/16 Q2 2015/16 Q3
Breastfeeding_1516Q1 T5_CCGBFI_201516 Standards and Quality Analytical Team (SAT)

Table 5: Initiation of breastfeeding, by CCG and Area Team - Quarterly 2015/16
Source: NHS England
Crown Copyright © 2015
2015/16 Q1 2015/16 Q2 2015/16 Q3 2015/16 Q4
Code Name Code Area Team No. No. No. No.
No. not
initiated
No.
initiated %
95%
confidence
interval
No. not
initiated
No.
initiated %
95%
confidence
interval
No. not
initiated
No.
initiated %
95%
confidence
interval
No. not
initiated
No.
initiated %
95%
confidence
interval No. % No. % No. % No. % ONS Code
2015/16 Q4
Number of maternities (1) Maternities where breastfeeding was known (2) Maternities whose breastfeeding status not known (3)
2015/16 Q1 2015/16 Q2 2015/16 Q3 2015/16 Q4 2015/16 Q1 2015/16 Q2 2015/16 Q3
06F NHS Bedfordshire CCG Q58 Hertfordshire and The South Midlands Area Team 1,315 276 1,001 76.1% 73.7% - 78.3% 38 2.9% E38000010
03V NHS Corby CCG Q58 Hertfordshire and The South Midlands Area Team 275 85 182 66.2% 60.4% - 71.5% 8 2.9% E38000037
06K NHS East and North Hertfordshire CCG Q58 Hertfordshire and The South Midlands Area Team 1,565 379 1,180 75.4% 73.2% - 77.5% 6 0.4% E38000049
06N NHS Herts Valleys CCG Q58 Hertfordshire and The South Midlands Area Team 1,858 431 1,419 76.4% 74.4% - 78.2% 8 0.4% E38000079
06P NHS Luton CCG Q58 Hertfordshire and The South Midlands Area Team 834 172 662 79.4% 76.5% - 82.0% 0 0.0% E38000102
04F NHS Milton Keynes CCG Q58 Hertfordshire and The South Midlands Area Team 876 57 347 472 53.9% E38000107
04G NHS Nene CCG Q58 Hertfordshire and The South Midlands Area Team 1,919 460 1,392 72.5% 70.5% - 74.5% 67 3.5% E38000108
03W NHS East Leicestershire and Rutland CCG Q59 Leicestershire and Lincolnshire Area Team 759 176 576 75.9% 72.7% - 78.8% 7 0.9% E38000051
04C NHS Leicester City CCG Q59 Leicestershire and Lincolnshire Area Team 1,290 318 972 75.3% 72.9% - 77.6% 0 0.0% E38000097
03T NHS Lincolnshire East CCG Q59 Leicestershire and Lincolnshire Area Team 556 158 336 62 11.2% E38000099
04D NHS Lincolnshire West CCG Q59 Leicestershire and Lincolnshire Area Team 605 172 361 72 11.9% E38000100
99D NHS South Lincolnshire CCG Q59 Leicestershire and Lincolnshire Area Team 396 93 243 60 15.2% E38000157
04Q NHS South West Lincolnshire CCG Q59 Leicestershire and Lincolnshire Area Team 269 60 145 64 23.8% E38000165
04V NHS West Leicestershire CCG Q59 Leicestershire and Lincolnshire Area Team 891 232 658 73.8% 70.9% - 76.6% 1 0.1% E38000201
04Y NHS Cannock Chase CCG Q60 Shropshire and Staffordshire Area Team 325 111 214 65.8% 60.5% - 70.8% 0 0.0% E38000028
05D NHS East Staffordshire CCG Q60 Shropshire and Staffordshire Area Team 389 108 281 72.2% 67.6% - 76.5% 0 0.0% E38000053
05G NHS North Staffordshire CCG Q60 Shropshire and Staffordshire Area Team 492 167 323 65.7% 61.3% - 69.7% 2 0.4% E38000126
05N NHS Shropshire CCG Q60 Shropshire and Staffordshire Area Team 609 142 460 7 E38000147
05Q NHS South East Staffordshire and Seisdon Peninsula CCG Q60 Shropshire and Staffordshire Area Team 526 145 375 71.3% 67.3% - 75.0% 6 1.1% E38000153
05V NHS Stafford and Surrounds CCG Q60 Shropshire and Staffordshire Area Team 308 91 217 70.5% 65.1% - 75.3% 0 0.0% E38000173
05W NHS Stoke On Trent CCG Q60 Shropshire and Staffordshire Area Team 853 348 505 59.2% 55.9% - 62.5% 0 0.0% E38000175
05X NHS Telford and Wrekin CCG Q60 Shropshire and Staffordshire Area Team 497 138 345 69.4% 65.2% - 73.3% 14 2.8% E38000183
11E NHS Bath and North East Somerset CCG Q64 Bath, Gloucestershire, Swindon and Wiltshire Area Team 461 67 390 84.6% 81.0% - 87.6% 4 0.9% E38000009
11M NHS Gloucestershire CCG Q64 Bath, Gloucestershire, Swindon and Wiltshire Area Team 1,597 365 1,230 77.0% 74.9% - 79.0% 2 0.1% E38000062
12D NHS Swindon CCG Q64 Bath, Gloucestershire, Swindon and Wiltshire Area Team 691 162 528 76.4% 73.1% - 79.4% 1 0.1% E38000181
99N NHS Wiltshire CCG Q64 Bath, Gloucestershire, Swindon and Wiltshire Area Team 1,135 207 918 80.9% 78.5% - 83.1% 10 0.9% E38000206
11H NHS Bristol CCG Q65 Bristol, North Somerset, Somerset and South Gloucestershire Area Team 859 125 723 11 E38000022
11T NHS North Somerset CCG Q65 Bristol, North Somerset, Somerset and South Gloucestershire Area Team 400 81 317 2 E38000125
11X NHS Somerset CCG Q65 Bristol, North Somerset, Somerset and South Gloucestershire Area Team 1,438 274 1,150 80.0% 77.8% - 82.0% 14 1.0% E38000150
12A NHS South Gloucestershire CCG Q65 Bristol, North Somerset, Somerset and South Gloucestershire Area Team 111 23 87 1 E38000155
11N NHS Kernow CCG Q66 Devon, Cornwall and Isles Of Scilly Area Team 1,367 287 1,077 78.8% 76.5% - 80.9% 3 0.2% E38000089
99P NHS Northern, Eastern and Western Devon CCG Q66 Devon, Cornwall and Isles Of Scilly Area Team 2,094 423 1,591 76.0% 74.1% - 77.8% 80 3.8% E38000129
99Q NHS South Devon and Torbay CCG Q66 Devon, Cornwall and Isles Of Scilly Area Team 73 10 59 4 5.5% E38000152
09C NHS Ashford CCG Q67 Kent and Medway Area Team 364 98 248 68.1% 63.2% - 72.7% 18 4.9% E38000002
09E NHS Canterbury and Coastal CCG Q67 Kent and Medway Area Team 460 100 329 31 6.7% E38000029
09J NHS Dartford, Gravesham and Swanley CCG Q67 Kent and Medway Area Team 798 241 557 69.8% 66.5% - 72.9% 0 0.0% E38000043
09W NHS Medway CCG Q67 Kent and Medway Area Team 957 272 665 69.5% 66.5% - 72.3% 20 2.1% E38000104
10A NHS South Kent Coast CCG Q67 Kent and Medway Area Team 474 119 331 24 5.1% E38000156
10D NHS Swale CCG Q67 Kent and Medway Area Team 347 120 215 62.0% 56.7% - 66.9% 12 3.5% E38000180
10E NHS Thanet CCG Q67 Kent and Medway Area Team 380 107 266 70.0% 65.2% - 74.4% 7 1.8% E38000184
99J NHS West Kent CCG Q67 Kent and Medway Area Team 1,333 249 1,059 79.4% 77.2% - 81.5% 25 1.9% E38000199
09D NHS Brighton and Hove CCG Q68 Surrey and Sussex Area Team 696 86 602 86.5% 83.8% - 88.8% 8 1.1% E38000021
09G NHS Coastal West Sussex CCG Q68 Surrey and Sussex Area Team 1,184 195 942 79.6% 77.2% - 81.8% 47 4.0% E38000036
09H NHS Crawley CCG Q68 Surrey and Sussex Area Team 450 93 355 78.9% 74.9% - 82.4% 2 0.4% E38000039
09L NHS East Surrey CCG Q68 Surrey and Sussex Area Team 530 92 437 82.5% 79.0% - 85.5% 1 0.2% E38000054
09F NHS Eastbourne, Hailsham and Seaford CCG Q68 Surrey and Sussex Area Team 476 136 339 71.2% 67.0% - 75.1% 1 0.2% E38000055
09N NHS Guildford and Waverley CCG Q68 Surrey and Sussex Area Team 507 74 433 85.4% 82.1% - 88.2% 0 0.0% E38000067
09P NHS Hastings and Rother CCG Q68 Surrey and Sussex Area Team 449 151 297 66.1% 61.6% - 70.4% 1 0.2% E38000076
99K NHS High Weald Lewes Havens CCG Q68 Surrey and Sussex Area Team 350 44 302 86.3% 82.3% - 89.5% 4 1.1% E38000081
09X NHS Horsham and Mid Sussex CCG Q68 Surrey and Sussex Area Team 575 59 510 88.7% 85.8% - 91.0% 6 1.0% E38000083
09Y NHS North West Surrey CCG Q68 Surrey and Sussex Area Team 1,050 140 910 86.7% 84.5% - 88.6% 0 0.0% E38000128
99H NHS Surrey Downs CCG Q68 Surrey and Sussex Area Team 341 30 307 4 E38000177
10C NHS Surrey Heath CCG Q68 Surrey and Sussex Area Team 270 45 222 82.2% 77.2% - 86.3% 3 1.1% E38000178
10Y NHS Aylesbury Vale CCG Q69 Thames Valley Area Team 606 105 447 54 8.9% E38000003
10G NHS Bracknell and Ascot CCG Q69 Thames Valley Area Team 385 76 307 79.7% 75.4% - 83.5% 2 0.5% E38000017
10H NHS Chiltern CCG Q69 Thames Valley Area Team 922 199 689 74.7% 71.8% - 77.4% 34 3.7% E38000033
10M NHS Newbury and District CCG Q69 Thames Valley Area Team 276 50 225 81.5% 76.5% - 85.7% 1 0.4% E38000110
10N NHS North & West Reading CCG Q69 Thames Valley Area Team 330 64 264 80.0% 75.4% - 84.0% 2 0.6% E38000114
10Q NHS Oxfordshire CCG Q69 Thames Valley Area Team 1,906 354 1,550 81.3% 79.5% - 83.0% 2 0.1% E38000136
10T NHS Slough CCG Q69 Thames Valley Area Team 592 153 438 74.0% 70.3% - 77.4% 1 0.2% E38000148
10W NHS South Reading CCG Q69 Thames Valley Area Team 465 91 367 78.9% 75.0% - 82.4% 7 1.5% E38000160
11C NHS Windsor, Ascot and Maidenhead CCG Q69 Thames Valley Area Team 390 64 325 83.3% 79.3% - 86.7% 1 0.3% E38000207
11D NHS Wokingham CCG Q69 Thames Valley Area Team 390 72 313 80.3% 76.0% - 83.9% 5 1.3% E38000209
11J NHS Dorset CCG Q70 Wessex Area Team 1,816 347 1,452 80.0% 78.1% - 81.7% 17 0.9% E38000045
10K NHS Fareham and Gosport CCG Q70 Wessex Area Team 508 115 387 76.2% 72.3% - 79.7% 6 1.2% E38000059
10L NHS Isle Of Wight CCG Q70 Wessex Area Team 304 101 203 66.8% 61.3% - 71.8% 0 0.0% E38000087
99M NHS North East Hampshire and Farnham CCG Q70 Wessex Area Team 660 120 532 80.6% 77.4% - 83.4% 8 1.2% E38000118
10J NHS North Hampshire CCG Q70 Wessex Area Team 609 117 486 79.8% 76.4% - 82.8% 6 1.0% E38000120
10R NHS Portsmouth CCG Q70 Wessex Area Team 649 178 466 71.8% 68.2% - 75.1% 5 0.8% E38000137
10V NHS South Eastern Hampshire CCG Q70 Wessex Area Team 518 151 363 70.1% 66.0% - 73.9% 4 0.8% E38000154
10X NHS Southampton CCG Q70 Wessex Area Team 860 200 643 74.8% 71.8% - 77.6% 17 2.0% E38000167
11A NHS West Hampshire CCG Q70 Wessex Area Team 1,307 224 1,071 81.9% 79.8% - 83.9% 12 0.9% E38000198
07L NHS Barking and Dagenham CCG Q71 London Area Team 930 281 630 67.7% 64.7% - 70.7% 19 2.0% E38000004
07M NHS Barnet CCG Q71 London Area Team 1,285 181 1,088 84.7% 82.6% - 86.5% 16 1.2% E38000005
07N NHS Bexley CCG Q71 London Area Team 568 125 436 7 E38000011
07P NHS Brent CCG Q71 London Area Team 772 78 685 9 E38000020
07Q NHS Bromley CCG Q71 London Area Team 133 25 107 1 E38000023
07R NHS Camden CCG Q71 London Area Team 616 38 549 89.1% 86.4% - 91.3% 29 4.7% E38000027
09A NHS Central London (Westminster) CCG Q71 London Area Team 236 16 217 3 E38000031
07T NHS City and Hackney CCG Q71 London Area Team 1,161 78 1,076 92.7% 91.0% - 94.0% 7 0.6% E38000035
07V NHS Croydon CCG Q71 London Area Team 1,202 205 972 80.9% 78.5% - 83.0% 25 2.1% E38000040
07W NHS Ealing CCG Q71 London Area Team 834 72 747 15 E38000048
07X NHS Enfield CCG Q71 London Area Team 1,133 152 974 86.0% 83.8% - 87.9% 7 0.6% E38000057
08A NHS Greenwich CCG Q71 London Area Team 1,121 162 923 82.3% 80.0% - 84.5% 36 3.2% E38000066
08C NHS Hammersmith and Fulham CCG Q71 London Area Team 310 37 272 1 E38000070
08D NHS Haringey CCG Q71 London Area Team 1,015 88 919 90.5% 88.6% - 92.2% 8 0.8% E38000072
08E NHS Harrow CCG Q71 London Area Team 749 95 649 86.6% 84.0% - 88.9% 5 0.7% E38000074
08F NHS Havering CCG Q71 London Area Team 850 312 531 62.5% 59.2% - 65.7% 7 0.8% E38000077
08G NHS Hillingdon CCG Q71 London Area Team 930 141 781 84.0% 81.5% - 86.2% 8 0.9% E38000082
07Y NHS Hounslow CCG Q71 London Area Team 949 83 859 90.5% 88.5% - 92.2% 7 0.7% E38000084
08H NHS Islington CCG Q71 London Area Team 747 73 654 87.6% 85.0% - 89.7% 20 2.7% E38000088
08J NHS Kingston CCG Q71 London Area Team 611 54 543 88.9% 86.1% - 91.1% 14 2.3% E38000090
08K NHS Lambeth CCG Q71 London Area Team 1,255 90 1,158 92.3% 90.7% - 93.6% 7 0.6% E38000092
08L NHS Lewisham CCG Q71 London Area Team 1,089 129 942 86.5% 84.3% - 88.4% 18 1.7% E38000098
08R NHS Merton CCG Q71 London Area Team 576 41 522 13 E38000105
08M NHS Newham CCG Q71 London Area Team 1,606 100 1,413 93 5.8% E38000113
08N NHS Redbridge CCG Q71 London Area Team 1,147 234 883 77.0% 74.5% - 79.3% 30 2.6% E38000138
08P NHS Richmond CCG Q71 London Area Team 635 39 589 92.8% 90.5% - 94.5% 7 1.1% E38000140
08Q NHS Southwark CCG Q71 London Area Team 1,140 100 1,029 90.3% 88.4% - 91.9% 11 1.0% E38000171
08T NHS Sutton CCG Q71 London Area Team 90 13 76 1 E38000179
08V NHS Tower Hamlets CCG Q71 London Area Team 1,127 155 935 83.0% 80.7% - 85.0% 37 3.3% E38000186
08W NHS Waltham Forest CCG Q71 London Area Team 1,114 154 923 82.9% 80.5% - 85.0% 37 3.3% E38000192
08X NHS Wandsworth CCG Q71 London Area Team 1,348 107 1,220 90.5% 88.8% - 92.0% 21 1.6% E38000193
08Y NHS West London CCG Q71 London Area Team 368 34 333 1 E38000202
X24 Military Practices X24 NHS England 239 46 187 78.2% 72.6% - 83.0% 6 2.5%
12H Durham, Darlington & Tees Commissioning Hub Q45 Durham, Darlington & Tees 0 0 0 0
12K Lancashire Commissioning Hub Q47 Lancashire 0 0 0 0
12M Cumbria, Northumberland, Tyne & Wear Commissioning Hub Q49 Cumbria, Northumberland, Tyne & Wear 0 0 0 0
12Q West Yorkshire Commissioning Hub Q52 West Yorkshire 0 0 0 0
12V Derbyshire & Nottinghamshire Commissioning Hub Q55 Derbyshire & Nottinghamshire 0 0 0 0
12W East Anglia Commissioning Hub Q56 East Anglia 3 0 3 100.0% 43.8% - 100.0% 0 0.0%
13C Shropshire & Staffordshire Commissioning Hub Q60 Shropshire & Staffordshire 0 0 0 0
13D North East London Commissioning Hub Q71 London 0 0 0 0
13F South London Commissioning Hub Q71 London 0 0 0 0
13H Bristol, N Somerset, Somerset & S Gloucestershire Commissioning HubQ65 Bristol, N Somerset, Somerset & S Gloucestershire 0 0 0 0
13K Kent & Medway Commissioning Hub Q67 Kent & Medway 0 0 0 0
13M Thames Valley Commissioning Hub Q69 Thames Valley 0 0 0 0
13A Leicesterhire & Lincolnshire Commissioning Hub Q59 Leicestershire And Lincolnshire Area Team 0 0 0 0
13R London Commissioning Hub Q71 London 0 0 0 0
Notes:
1. Red cells mean that no. of maternities does not meet validation criteria (see definitions sheet for details). 100.0%
2. Blank cells mean that data do not meet validation criteria (see definitions sheet for details).
3. Shaded cells mean that percentage of mothers' whose breastfeeding status was recorded falls short of data quality standard of 95%.
4. Area Team and England actuals and percentages are calculated including the data from those CCGs who have failed the validation criteria.
Breastfeeding_1516Q1 T5_CCGBFI_201516 Standards and Quality Analytical Team (SAT)

KnowsleyHalton
Durham Dales, Easington & SedgefieldHartlepool & Stockton-On-Tees
Wigan BoroughS Sefton
LiverpoolS Tyneside
DudleyWirral
SunderlandW LancashireStoke On TrentSt HelensWyre ForestN Durham
DarlingtonHeywood, Middleton & Rochdale
SwaleSouthport & FormbyChorley & S RibbleWakefieldHaveringBlackpoolN E LincolnshireHullRedditch & BromsgroveRotherhamTameside & Glossop
N TynesideDoncasterLeeds S & EastN ManchesterCumbriaOldham
N StaffordshireCannock ChaseBassetlawSalfordHastings & RotherCorbyN LincolnshireW CheshireGatesheadLancashire NorthIsle Of WightWolverhampton
NorthumberlandWalsallVale RoyalBarking & DagenhamSandwell & W BirminghamAshfordS ManchesterBoltonE Riding of YorkshireS WorcestershireGreater PrestonW NorfolkTelford & WrekinMedwayDartford, Gravesham & SwanleyThanetS Eastern HampshireStockportBirmingham CrosscityWarringtonStafford & SurroundsNewcastle N & EGreat Yarmouth & WaveneyBradford DistrictsHerefordshireW EssexHardwickFylde & WyreBuryEastbourne, Hailsham & SeafordSe Staffordshire & Seisdon Peninsula
PortsmouthE StaffordshireS CheshireMid EssexNeneBradford City
Leeds WestW LeicestershireSloughTraffordE LancashireBirmingham S & CentralBlackburn with DarwenSouthern DerbyshireChilternSouthamptonS WarwickshireCentral ManchesterLeicester CityE & N Hertfordshire
E Leicestershire & RutlandNorthern, Eastern & Western DevonBedfordshireFareham & GosportHerts ValleysSwindonEastern CheshireRedbridgeGloucestershireN DerbyshireCalderdale
Airedale, Wharfedale & CravenLeeds NorthKernowSheffieldCrawleyS ReadingIpswich & E SuffolkCoventry & RugbyN E EssexLutonW KentCoastal W SussexBracknell & AscotN HampshireDorsetSomersetN & W ReadingWokinghamN E Hampshire & FarnhamCroydonWiltshireOxfordshireNewbury & DistrictW HampshireSurrey HeathGreenwichE SurreyWaltham ForestTower HamletsWindsor, Ascot & MaidenheadSouthendHillingdon
Bath & N E SomersetBarnet
Guildford & WaverleyEnfieldHigh Weald Lewes HavensBrighton & HoveLewishamHarrowN W Surrey
Harrogate & Rural DistrictIslington
Horsham & Mid SussexKingstonCamden
SouthwarkWandsworthHounslowHaringey
LambethCity & HackneyRichmond
0% 10% 20% 30% 40% 50% 60% 70% 80% 90% 100%
Mothers initiating breastfeeding as a percentage of maternities by CCGs in England
2015/16 Q1
CCGs with < 5% not Knowns & passing maternities checks

Stoke On TrentHaltonWyre ForestBlackpoolVale RoyalRotherhamBoltonDartford, Gravesham & SwanleyDarlingtonW CheshireChorley & S RibbleGreater PrestonS WorcestershireLeicester CityCentral ManchesterE LancashireBlackburn with DarwenE StaffordshireN DerbyshireTraffordLutonCalderdaleIsle Of WightN W SurreyGuildford & WaverleyHerefordshireWirralCannock ChaseS CheshireBassetlawFylde & WyreStafford & SurroundsSheffieldSouthern DerbyshireOxfordshireWalsallDoncasterW LeicestershireWigan BoroughStockportGloucestershireSunderlandTameside & GlossopSwindonSloughE SurreyWakefieldEastbourne, Hailsham & SeafordKnowsleyRedditch & BromsgroveLiverpoolHullKernowHastings & RotherN E EssexSalfordN E LincolnshireWindsor, Ascot & MaidenheadS SeftonCoventry & RugbyBradford DistrictsHartlepool & Stockton-On-TeesS WarwickshireW EssexN DurhamNewbury & DistrictS ManchesterE & N HertfordshireN StaffordshireDurham Dales, Easington & SedgefieldHerts ValleysCrawleyWolverhamptonBracknell & AscotW NorfolkWarringtonLambethBradford CityCity & HackneySt HelensN & W ReadingEnfieldHarrowHounslowIpswich & E SuffolkPortsmouthW LancashireS Eastern HampshireHaringeyN ManchesterS TynesideHaveringSouthport & FormbyHillingdonBath & N E SomersetWiltshireN LincolnshireW HampshireE Leicestershire & RutlandDorsetSouthendSouthwarkSomersetN HampshireHorsham & Mid SussexNorthumberlandBuryRichmondSurrey HeathSe Staffordshire & Seisdon PeninsulaAiredale, Wharfedale & CravenHigh Weald Lewes HavensBrighton & HoveFareham & GosportN E Hampshire & FarnhamBarnetCumbriaWokinghamS ReadingGatesheadHardwickWandsworthLancashire NorthGreat Yarmouth & WaveneyHarrogate & Rural DistrictLewishamThanetW KentSouthamptonBarking & DagenhamCroydonMedwayMid EssexOldhamKingstonBirmingham S & CentralLeeds NorthRedbridgeIslingtonEastern CheshireTelford & WrekinE Riding of YorkshireBedfordshireCorbyLeeds WestN TynesideHeywood, Middleton & RochdaleGreenwichTower HamletsWaltham ForestDudleySwaleNeneChilternNorthern, Eastern & Western DevonLeeds S & EastCoastal W Sussex
Newcastle N & EBirmingham CrosscityCamdenSandwell & W BirminghamAshfordS Kent Coast
Newcastle WestNewham
Canterbury & CoastalVale Of YorkSolihullNewark & Sherwood
NorwichSandwell & W Birmingham
Aylesbury ValeLincolnshire East
Lincolnshire WestS Lincolnshire
Scarborough & RyedaleMilton Keynes
0% 10% 20% 30% 40% 50% 60%
Mothers not known initiating breastfeeding as a percentage of maternities by CCGs
in England 2015/16 Q1
2015/16 Q1 Quarter Actual v Not knowns target 5%
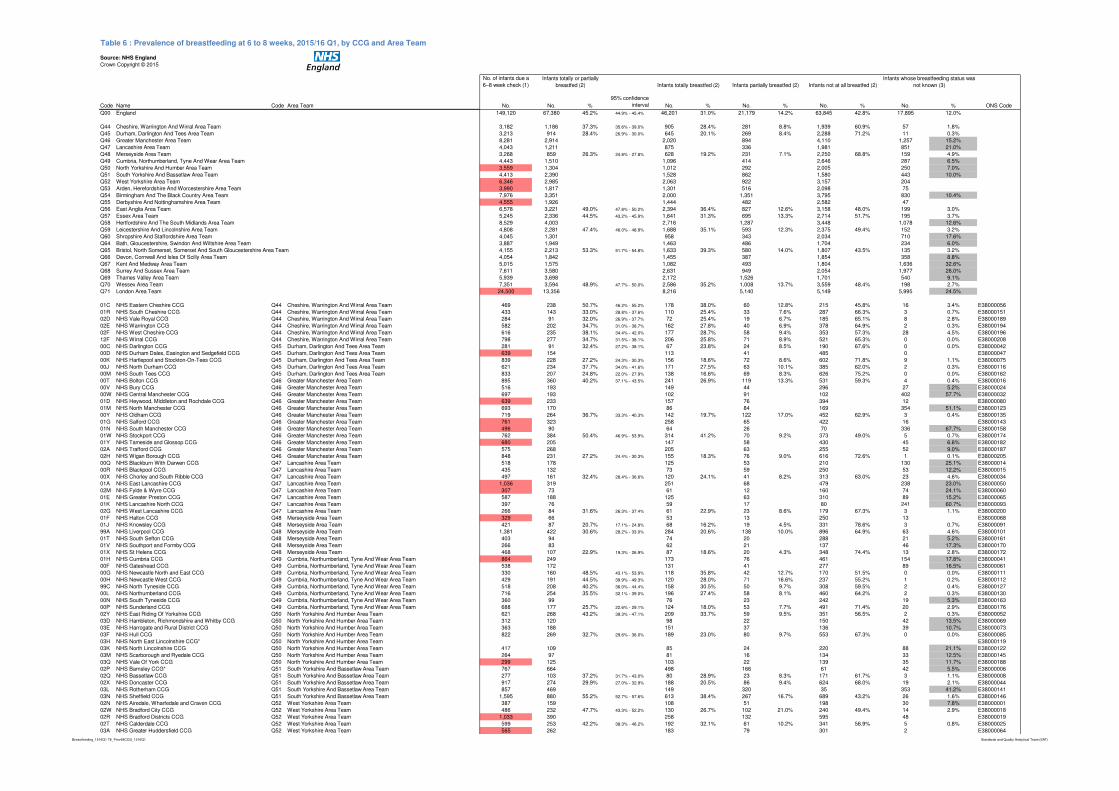
Table 6 : Prevalence of breastfeeding at 6 to 8 weeks, 2015/16 Q1, by CCG and Area Team
Source: NHS England
Crown Copyright © 2015
No. of infants due a
6–8 week check (1)
Code Name Code Area Team No. No. %
95% confidence
interval No. % No. % No. % No. % ONS Code
Q00 England 149,120 67,380 45.2% 44.9% - 45.4% 46,201 31.0% 21,179 14.2% 63,845 42.8% 17,895 12.0%
Q44 Cheshire, Warrington And Wirral Area Team 3,182 1,186 37.3% 35.6% - 39.0% 905 28.4% 281 8.8% 1,939 60.9% 57 1.8%
Q45 Durham, Darlington And Tees Area Team 3,213 914 28.4% 26.9% - 30.0% 645 20.1% 269 8.4% 2,288 71.2% 11 0.3%
Q46 Greater Manchester Area Team 8,281 2,914 2,020 894 4,110 1,257 15.2%
Q47 Lancashire Area Team 4,043 1,211 875 336 1,981 851 21.0%
Q48 Merseyside Area Team 3,268 859 26.3% 24.8% - 27.8% 628 19.2% 231 7.1% 2,250 68.8% 159 4.9%
Q49 Cumbria, Northumberland, Tyne And Wear Area Team 4,443 1,510 1,096 414 2,646 287 6.5%
Q50 North Yorkshire And Humber Area Team 3,559 1,304 1,012 292 2,005 250 7.0%
Q51 South Yorkshire And Bassetlaw Area Team 4,413 2,390 1,528 862 1,580 443 10.0%
Q52 West Yorkshire Area Team 6,346 2,985 2,063 922 3,157 204
Q53 Arden, Herefordshire And Worcestershire Area Team 3,990 1,817 1,301 516 2,098 75
Q54 Birmingham And The Black Country Area Team 7,976 3,351 2,000 1,351 3,795 830 10.4%
Q55 Derbyshire And Nottinghamshire Area Team 4,555 1,926 1,444 482 2,582 47
Q56 East Anglia Area Team 6,578 3,221 49.0% 47.8% - 50.2% 2,394 36.4% 827 12.6% 3,158 48.0% 199 3.0%
Q57 Essex Area Team 5,245 2,336 44.5% 43.2% - 45.9% 1,641 31.3% 695 13.3% 2,714 51.7% 195 3.7%
Q58 Hertfordshire And The South Midlands Area Team 8,529 4,003 2,716 1,287 3,448 1,078 12.6%
Q59 Leicestershire And Lincolnshire Area Team 4,808 2,281 47.4% 46.0% - 48.9% 1,688 35.1% 593 12.3% 2,375 49.4% 152 3.2%
Q60 Shropshire And Staffordshire Area Team 4,045 1,301 958 343 2,034 710 17.6%
Q64 Bath, Gloucestershire, Swindon And Wiltshire Area Team 3,887 1,949 1,463 486 1,704 234 6.0%
Q65 Bristol, North Somerset, Somerset And South Gloucestershire Area Team 4,155 2,213 53.3% 51.7% - 54.8% 1,633 39.3% 580 14.0% 1,807 43.5% 135 3.2%
Q66 Devon, Cornwall And Isles Of Scilly Area Team 4,054 1,842 1,455 387 1,854 358 8.8%
Q67 Kent And Medway Area Team 5,015 1,575 1,082 493 1,804 1,636 32.6%
Q68 Surrey And Sussex Area Team 7,611 3,580 2,631 949 2,054 1,977 26.0%
Q69 Thames Valley Area Team 5,939 3,698 2,172 1,526 1,701 540 9.1%
Q70 Wessex Area Team 7,351 3,594 48.9% 47.7% - 50.0% 2,586 35.2% 1,008 13.7% 3,559 48.4% 198 2.7%
Q71 London Area Team 24,500 13,356 8,216 5,140 5,149 5,995 24.5%
01C NHS Eastern Cheshire CCG Q44 Cheshire, Warrington And Wirral Area Team 469 238 50.7% 46.2% - 55.2% 178 38.0% 60 12.8% 215 45.8% 16 3.4% E38000056
01R NHS South Cheshire CCG Q44 Cheshire, Warrington And Wirral Area Team 433 143 33.0% 28.8% - 37.6% 110 25.4% 33 7.6% 287 66.3% 3 0.7% E38000151
02D NHS Vale Royal CCG Q44 Cheshire, Warrington And Wirral Area Team 284 91 32.0% 26.9% - 37.7% 72 25.4% 19 6.7% 185 65.1% 8 2.8% E38000189
02E NHS Warrington CCG Q44 Cheshire, Warrington And Wirral Area Team 582 202 34.7% 31.0% - 38.7% 162 27.8% 40 6.9% 378 64.9% 2 0.3% E38000194
02F NHS West Cheshire CCG Q44 Cheshire, Warrington And Wirral Area Team 616 235 38.1% 34.4% - 42.0% 177 28.7% 58 9.4% 353 57.3% 28 4.5% E38000196
12F NHS Wirral CCG Q44 Cheshire, Warrington And Wirral Area Team 798 277 34.7% 31.5% - 38.1% 206 25.8% 71 8.9% 521 65.3% 0 0.0% E38000208
00C NHS Darlington CCG Q45 Durham, Darlington And Tees Area Team 281 91 32.4% 27.2% - 38.1% 67 23.8% 24 8.5% 190 67.6% 0 0.0% E38000042
00D NHS Durham Dales, Easington and Sedgefield CCG Q45 Durham, Darlington And Tees Area Team 639 154 113 41 485 0 E38000047
00K NHS Hartlepool and Stockton-On-Tees CCG Q45 Durham, Darlington And Tees Area Team 839 228 27.2% 24.3% - 30.3% 156 18.6% 72 8.6% 602 71.8% 9 1.1% E38000075
00J NHS North Durham CCG Q45 Durham, Darlington And Tees Area Team 621 234 37.7% 34.0% - 41.6% 171 27.5% 63 10.1% 385 62.0% 2 0.3% E38000116
00M NHS South Tees CCG Q45 Durham, Darlington And Tees Area Team 833 207 24.8% 22.0% - 27.9% 138 16.6% 69 8.3% 626 75.2% 0 0.0% E38000162
00T NHS Bolton CCG Q46 Greater Manchester Area Team 895 360 40.2% 37.1% - 43.5% 241 26.9% 119 13.3% 531 59.3% 4 0.4% E38000016
00V NHS Bury CCG Q46 Greater Manchester Area Team 516 193 149 44 296 27 5.2% E38000024
00W NHS Central Manchester CCG Q46 Greater Manchester Area Team 697 193 102 91 102 402 57.7% E38000032
01D NHS Heywood, Middleton and Rochdale CCG Q46 Greater Manchester Area Team 639 233 157 76 394 12 E38000080
01M NHS North Manchester CCG Q46 Greater Manchester Area Team 693 170 86 84 169 354 51.1% E38000123
00Y NHS Oldham CCG Q46 Greater Manchester Area Team 719 264 36.7% 33.3% - 40.3% 142 19.7% 122 17.0% 452 62.9% 3 0.4% E38000135
01G NHS Salford CCG Q46 Greater Manchester Area Team 761 323 258 65 422 16 E38000143
01N NHS South Manchester CCG Q46 Greater Manchester Area Team 496 90 64 26 70 336 67.7% E38000158
01W NHS Stockport CCG Q46 Greater Manchester Area Team 762 384 50.4% 46.9% - 53.9% 314 41.2% 70 9.2% 373 49.0% 5 0.7% E38000174
01Y NHS Tameside and Glossop CCG Q46 Greater Manchester Area Team 680 205 147 58 430 45 6.6% E38000182
02A NHS Trafford CCG Q46 Greater Manchester Area Team 575 268 205 63 255 52 9.0% E38000187
02H NHS Wigan Borough CCG Q46 Greater Manchester Area Team 848 231 27.2% 24.4% - 30.3% 155 18.3% 76 9.0% 616 72.6% 1 0.1% E38000205
00Q NHS Blackburn With Darwen CCG Q47 Lancashire Area Team 518 178 125 53 210 130 25.1% E38000014
00R NHS Blackpool CCG Q47 Lancashire Area Team 435 132 73 59 250 53 12.2% E38000015
00X NHS Chorley and South Ribble CCG Q47 Lancashire Area Team 497 161 32.4% 28.4% - 36.6% 120 24.1% 41 8.2% 313 63.0% 23 4.6% E38000034
01A NHS East Lancashire CCG Q47 Lancashire Area Team 1,036 319 251 68 479 238 23.0% E38000050
02M NHS Fylde & Wyre CCG Q47 Lancashire Area Team 307 73 61 12 160 74 24.1% E38000060
01E NHS Greater Preston CCG Q47 Lancashire Area Team 587 188 125 63 310 89 15.2% E38000065
01K NHS Lancashire North CCG Q47 Lancashire Area Team 397 76 59 17 80 241 60.7% E38000093
02G NHS West Lancashire CCG Q47 Lancashire Area Team 266 84 31.6% 26.3% - 37.4% 61 22.9% 23 8.6% 179 67.3% 3 1.1% E38000200
01F NHS Halton CCG Q48 Merseyside Area Team 329 66 53 13 250 13 E38000068
01J NHS Knowsley CCG Q48 Merseyside Area Team 421 87 20.7% 17.1% - 24.8% 68 16.2% 19 4.5% 331 78.6% 3 0.7% E38000091
99A NHS Liverpool CCG Q48 Merseyside Area Team 1,381 422 30.6% 28.2% - 33.0% 284 20.6% 138 10.0% 896 64.9% 63 4.6% E38000101
01T NHS South Sefton CCG Q48 Merseyside Area Team 403 94 74 20 288 21 5.2% E38000161
01V NHS Southport and Formby CCG Q48 Merseyside Area Team 266 83 62 21 137 46 17.3% E38000170
01X NHS St Helens CCG Q48 Merseyside Area Team 468 107 22.9% 19.3% - 26.9% 87 18.6% 20 4.3% 348 74.4% 13 2.8% E38000172
01H NHS Cumbria CCG Q49 Cumbria, Northumberland, Tyne And Wear Area Team 864 249 173 76 461 154 17.8% E38000041
00F NHS Gateshead CCG Q49 Cumbria, Northumberland, Tyne And Wear Area Team 538 172 131 41 277 89 16.5% E38000061
00G NHS Newcastle North and East CCG Q49 Cumbria, Northumberland, Tyne And Wear Area Team 330 160 48.5% 43.1% - 53.9% 118 35.8% 42 12.7% 170 51.5% 0 0.0% E38000111
00H NHS Newcastle West CCG Q49 Cumbria, Northumberland, Tyne And Wear Area Team 429 191 44.5% 39.9% - 49.3% 120 28.0% 71 16.6% 237 55.2% 1 0.2% E38000112
99C NHS North Tyneside CCG Q49 Cumbria, Northumberland, Tyne And Wear Area Team 518 208 40.2% 36.0% - 44.4% 158 30.5% 50 9.7% 308 59.5% 2 0.4% E38000127
00L NHS Northumberland CCG Q49 Cumbria, Northumberland, Tyne And Wear Area Team 716 254 35.5% 32.1% - 39.0% 196 27.4% 58 8.1% 460 64.2% 2 0.3% E38000130
00N NHS South Tyneside CCG Q49 Cumbria, Northumberland, Tyne And Wear Area Team 360 99 76 23 242 19 5.3% E38000163
00P NHS Sunderland CCG Q49 Cumbria, Northumberland, Tyne And Wear Area Team 688 177 25.7% 22.6% - 29.1% 124 18.0% 53 7.7% 491 71.4% 20 2.9% E38000176
02Y NHS East Riding Of Yorkshire CCG Q50 North Yorkshire And Humber Area Team 621 268 43.2% 39.3% - 47.1% 209 33.7% 59 9.5% 351 56.5% 2 0.3% E38000052
03D NHS Hambleton, Richmondshire and Whitby CCG Q50 North Yorkshire And Humber Area Team 312 120 98 22 150 42 13.5% E38000069
03E NHS Harrogate and Rural District CCG Q50 North Yorkshire And Humber Area Team 363 188 151 37 136 39 10.7% E38000073
03F NHS Hull CCG Q50 North Yorkshire And Humber Area Team 822 269 32.7% 29.6% - 36.0% 189 23.0% 80 9.7% 553 67.3% 0 0.0% E38000085
03H NHS North East Lincolnshire CCG* Q50 North Yorkshire And Humber Area Team E38000119
03K NHS North Lincolnshire CCG Q50 North Yorkshire And Humber Area Team 417 109 85 24 220 88 21.1% E38000122
03M NHS Scarborough and Ryedale CCG Q50 North Yorkshire And Humber Area Team 264 97 81 16 134 33 12.5% E38000145
03Q NHS Vale Of York CCG Q50 North Yorkshire And Humber Area Team 299 125 103 22 139 35 11.7% E38000188
02P NHS Barnsley CCG* Q51 South Yorkshire And Bassetlaw Area Team 767 664 498 166 61 42 5.5% E38000006
02Q NHS Bassetlaw CCG Q51 South Yorkshire And Bassetlaw Area Team 277 103 37.2% 31.7% - 43.0% 80 28.9% 23 8.3% 171 61.7% 3 1.1% E38000008
02X NHS Doncaster CCG Q51 South Yorkshire And Bassetlaw Area Team 917 274 29.9% 27.0% - 32.9% 188 20.5% 86 9.4% 624 68.0% 19 2.1% E38000044
03L NHS Rotherham CCG Q51 South Yorkshire And Bassetlaw Area Team 857 469 149 320 35 353 41.2% E38000141
03N NHS Sheffield CCG Q51 South Yorkshire And Bassetlaw Area Team 1,595 880 55.2% 52.7% - 57.6% 613 38.4% 267 16.7% 689 43.2% 26 1.6% E38000146
02N NHS Airedale, Wharfedale and Craven CCG Q52 West Yorkshire Area Team 387 159 108 51 198 30 7.8% E38000001
02W NHS Bradford City CCG Q52 West Yorkshire Area Team 486 232 47.7% 43.3% - 52.2% 130 26.7% 102 21.0% 240 49.4% 14 2.9% E38000018
02R NHS Bradford Districts CCG Q52 West Yorkshire Area Team 1,033 390 258 132 595 48 E38000019
02T NHS Calderdale CCG Q52 West Yorkshire Area Team 599 253 42.2% 38.3% - 46.2% 192 32.1% 61 10.2% 341 56.9% 5 0.8% E38000025
03A NHS Greater Huddersfield CCG Q52 West Yorkshire Area Team 565 262 183 79 301 2 E38000064
Infants totally or partially
breastfed (2) Infants totally breastfed (2) Infants partially breastfed (2) Infants not at all breastfed (2)
Infants whose breastfeeding status was
not known (3)
Breastfeeding_1516Q1 T6_Prev68CCG_1516Q1 Standards and Quality Analytical Team (SAT)

Table 6 : Prevalence of breastfeeding at 6 to 8 weeks, 2015/16 Q1, by CCG and Area Team
Source: NHS England
Crown Copyright © 2015
No. of infants due a
6–8 week check (1)
Code Name Code Area Team No. No. %
95% confidence
interval No. % No. % No. % No. % ONS Code
Infants totally or partially
breastfed (2) Infants totally breastfed (2) Infants partially breastfed (2) Infants not at all breastfed (2)
Infants whose breastfeeding status was
not known (3)
02V NHS Leeds North CCG Q52 West Yorkshire Area Team 480 344 248 96 109 27 5.6% E38000094
03G NHS Leeds South and East CCG* Q52 West Yorkshire Area Team 569 380 260 120 172 17 E38000095
03C NHS Leeds West CCG Q52 West Yorkshire Area Team 649 425 317 108 211 13 E38000096
03J NHS North Kirklees CCG Q52 West Yorkshire Area Team 582 215 134 81 335 32 5.5% E38000121
03R NHS Wakefield CCG Q52 West Yorkshire Area Team 996 325 32.6% 29.8% - 35.6% 233 23.4% 92 9.2% 655 65.8% 16 1.6% E38000190
05A NHS Coventry and Rugby CCG Q53 Arden, Herefordshire And Worcestershire Area Team 1,128 507 320 187 585 36 E38000038
05F NHS Herefordshire CCG Q53 Arden, Herefordshire And Worcestershire Area Team 400 201 50.3% 45.4% - 55.1% 150 37.5% 51 12.8% 195 48.8% 4 1.0% E38000078
05J NHS Redditch and Bromsgrove CCG Q53 Arden, Herefordshire And Worcestershire Area Team 471 206 43.7% 39.3% - 48.2% 159 33.8% 47 10.0% 256 54.4% 9 1.9% E38000139
05R NHS South Warwickshire CCG Q53 Arden, Herefordshire And Worcestershire Area Team 581 305 52.5% 48.4% - 56.5% 220 37.9% 85 14.6% 266 45.8% 10 1.7% E38000164
05T NHS South Worcestershire CCG Q53 Arden, Herefordshire And Worcestershire Area Team 706 350 49.6% 45.9% - 53.3% 264 37.4% 86 12.2% 345 48.9% 11 1.6% E38000166
05H NHS Warwickshire North CCG Q53 Arden, Herefordshire And Worcestershire Area Team 432 147 113 34 281 4 E38000195
06D NHS Wyre Forest CCG Q53 Arden, Herefordshire And Worcestershire Area Team 272 101 37.1% 31.6% - 43.0% 75 27.6% 26 9.6% 170 62.5% 1 0.4% E38000211
13P NHS Birmingham Crosscity CCG Q54 Birmingham And The Black Country Area Team 2,180 1,013 579 434 1,068 99 E38000012
04X NHS Birmingham South and Central CCG Q54 Birmingham And The Black Country Area Team 822 511 62.2% 58.8% - 65.4% 299 36.4% 212 25.8% 294 35.8% 17 2.1% E38000013
05C NHS Dudley CCG Q54 Birmingham And The Black Country Area Team 837 283 33.8% 30.7% - 37.1% 196 23.4% 87 10.4% 533 63.7% 21 2.5% E38000046
05L NHS Sandwell and West Birmingham CCG Q54 Birmingham And The Black Country Area Team 1,870 625 320 305 587 658 35.2% E38000144
05P NHS Solihull CCG Q54 Birmingham And The Black Country Area Team 635 284 44.7% 40.9% - 48.6% 206 32.4% 78 12.3% 343 54.0% 8 1.3% E38000149
05Y NHS Walsall CCG Q54 Birmingham And The Black Country Area Team 843 313 37.1% 33.9% - 40.4% 185 21.9% 128 15.2% 529 62.8% 1 0.1% E38000191
06A NHS Wolverhampton CCG Q54 Birmingham And The Black Country Area Team 789 322 40.8% 37.4% - 44.3% 215 27.2% 107 13.6% 441 55.9% 26 3.3% E38000210
03X NHS Erewash CCG Q55 Derbyshire And Nottinghamshire Area Team 244 86 35.2% 29.5% - 41.4% 65 26.6% 21 8.6% 158 64.8% 0 0.0% E38000058
03Y NHS Hardwick CCG Q55 Derbyshire And Nottinghamshire Area Team 256 78 57 21 177 1 E38000071
04E NHS Mansfield and Ashfield CCG Q55 Derbyshire And Nottinghamshire Area Team 503 143 28.4% 24.7% - 32.5% 111 22.1% 32 6.4% 336 66.8% 24 4.8% E38000103
04H NHS Newark & Sherwood CCG Q55 Derbyshire And Nottinghamshire Area Team 312 110 35.3% 30.2% - 40.7% 78 25.0% 32 10.3% 201 64.4% 1 0.3% E38000109
04J NHS North Derbyshire CCG Q55 Derbyshire And Nottinghamshire Area Team 664 288 43.4% 39.7% - 47.2% 229 34.5% 59 8.9% 376 56.6% 0 0.0% E38000115
04K NHS Nottingham City CCG Q55 Derbyshire And Nottinghamshire Area Team 1,037 495 47.7% 44.7% - 50.8% 335 32.3% 160 15.4% 539 52.0% 3 0.3% E38000132
04L NHS Nottingham North and East CCG Q55 Derbyshire And Nottinghamshire Area Team 448 185 41.3% 36.8% - 45.9% 150 33.5% 35 7.8% 253 56.5% 10 2.2% E38000133
04M NHS Nottingham West CCG Q55 Derbyshire And Nottinghamshire Area Team 274 130 47.4% 41.6% - 53.4% 98 35.8% 32 11.7% 139 50.7% 5 1.8% E38000134
04N NHS Rushcliffe CCG Q55 Derbyshire And Nottinghamshire Area Team 267 174 65.2% 59.3% - 70.6% 138 51.7% 36 13.5% 90 33.7% 3 1.1% E38000142
04R NHS Southern Derbyshire CCG Q55 Derbyshire And Nottinghamshire Area Team 550 237 183 54 313 0 E38000169
06H NHS Cambridgeshire and Peterborough CCG Q56 East Anglia Area Team 2,550 1,377 54.0% 52.1% - 55.9% 976 38.3% 401 15.7% 1,088 42.7% 85 3.3% E38000026
06M NHS Great Yarmouth and Waveney CCG Q56 East Anglia Area Team 575 232 40.3% 36.4% - 44.4% 176 30.6% 56 9.7% 335 58.3% 8 1.4% E38000063
06L NHS Ipswich and East Suffolk CCG Q56 East Anglia Area Team 971 468 48.2% 45.1% - 51.3% 361 37.2% 107 11.0% 477 49.1% 26 2.7% E38000086
06V NHS North Norfolk CCG Q56 East Anglia Area Team 341 151 44.3% 39.1% - 49.6% 122 35.8% 29 8.5% 179 52.5% 11 3.2% E38000124
06W NHS Norwich CCG Q56 East Anglia Area Team 576 306 53.1% 49.0% - 57.2% 225 39.1% 81 14.1% 253 43.9% 17 3.0% E38000131
06Y NHS South Norfolk CCG Q56 East Anglia Area Team 595 278 46.7% 42.7% - 50.7% 225 37.8% 53 8.9% 294 49.4% 23 3.9% E38000159
07J NHS West Norfolk CCG Q56 East Anglia Area Team 405 157 38.8% 34.1% - 43.6% 121 29.9% 36 8.9% 235 58.0% 13 3.2% E38000203
07K NHS West Suffolk CCG Q56 East Anglia Area Team 565 252 44.6% 40.6% - 48.7% 188 33.3% 64 11.3% 297 52.6% 16 2.8% E38000204
99E NHS Basildon and Brentwood CCG Q57 Essex Area Team 789 302 38.3% 34.9% - 41.7% 204 25.9% 98 12.4% 457 57.9% 30 3.8% E38000007
99F NHS Castle Point and Rochford CCG Q57 Essex Area Team 472 152 113 39 267 53 11.2% E38000030
06Q NHS Mid Essex CCG Q57 Essex Area Team 986 480 48.7% 45.6% - 51.8% 331 33.6% 149 15.1% 503 51.0% 3 0.3% E38000106
06T NHS North East Essex CCG Q57 Essex Area Team 909 453 49.8% 46.6% - 53.1% 320 35.2% 133 14.6% 455 50.1% 1 0.1% E38000117
99G NHS Southend CCG Q57 Essex Area Team 560 234 174 60 292 34 6.1% E38000168
07G NHS Thurrock CCG Q57 Essex Area Team 548 259 47.3% 43.1% - 51.4% 171 31.2% 88 16.1% 285 52.0% 4 0.7% E38000185
07H NHS West Essex CCG Q57 Essex Area Team 981 456 328 128 455 70 7.1% E38000197
06F NHS Bedfordshire CCG Q58 Hertfordshire And The South Midlands Area Team 1,351 675 50.0% 47.3% - 52.6% 472 34.9% 203 15.0% 652 48.3% 24 1.8% E38000010
03V NHS Corby CCG Q58 Hertfordshire And The South Midlands Area Team 244 88 36.1% 30.3% - 42.3% 62 25.4% 26 10.7% 146 59.8% 10 4.1% E38000037
06K NHS East and North Hertfordshire CCG Q58 Hertfordshire And The South Midlands Area Team 1,594 687 446 241 570 337 21.1% E38000049
06N NHS Herts Valleys CCG Q58 Hertfordshire And The South Midlands Area Team 1,770 817 545 272 432 521 29.4% E38000079
06P NHS Luton CCG Q58 Hertfordshire And The South Midlands Area Team 816 432 52.9% 49.5% - 56.3% 294 36.0% 138 16.9% 373 45.7% 11 1.3% E38000102
04F NHS Milton Keynes CCG* Q58 Hertfordshire And The South Midlands Area Team 891 457 278 179 321 113 12.7% E38000107
04G NHS Nene CCG Q58 Hertfordshire And The South Midlands Area Team 1,863 847 45.5% 43.2% - 47.7% 619 33.2% 228 12.2% 954 51.2% 62 3.3% E38000108
03W NHS East Leicestershire and Rutland CCG Q59 Leicestershire And Lincolnshire Area Team 757 393 51.9% 48.4% - 55.5% 302 39.9% 91 12.0% 344 45.4% 20 2.6% E38000051
04C NHS Leicester City CCG Q59 Leicestershire And Lincolnshire Area Team 1,250 782 62.6% 59.8% - 65.2% 541 43.3% 241 19.3% 441 35.3% 27 2.2% E38000097
03T NHS Lincolnshire East CCG Q59 Leicestershire And Lincolnshire Area Team 547 180 32.9% 29.1% - 37.0% 139 25.4% 41 7.5% 353 64.5% 14 2.6% E38000099
04D NHS Lincolnshire West CCG Q59 Leicestershire And Lincolnshire Area Team 588 213 162 51 331 44 7.5% E38000100
99D NHS South Lincolnshire CCG Q59 Leicestershire And Lincolnshire Area Team 407 172 42.3% 37.6% - 47.1% 137 33.7% 35 8.6% 221 54.3% 14 3.4% E38000157
04Q NHS South West Lincolnshire CCG Q59 Leicestershire And Lincolnshire Area Team 320 135 42.2% 36.9% - 47.7% 93 29.1% 42 13.1% 180 56.3% 5 1.6% E38000165
04V NHS West Leicestershire CCG Q59 Leicestershire And Lincolnshire Area Team 939 406 43.2% 40.1% - 46.4% 314 33.4% 92 9.8% 505 53.8% 28 3.0% E38000201
04Y NHS Cannock Chase CCG Q60 Shropshire And Staffordshire Area Team 336 72 48 24 136 128 38.1% E38000028
05D NHS East Staffordshire CCG Q60 Shropshire And Staffordshire Area Team 379 87 67 20 133 159 42.0% E38000053
05G NHS North Staffordshire CCG Q60 Shropshire And Staffordshire Area Team 480 192 40.0% 35.7% - 44.4% 143 29.8% 49 10.2% 287 59.8% 1 0.2% E38000126
05N NHS Shropshire CCG Q60 Shropshire And Staffordshire Area Team 680 317 46.6% 42.9% - 50.4% 239 35.1% 78 11.5% 348 51.2% 15 2.2% E38000147
05Q NHS South East Staffordshire and Seisdon Peninsula CCG Q60 Shropshire And Staffordshire Area Team 520 124 94 30 179 217 41.7% E38000153
05V NHS Stafford and Surrounds CCG Q60 Shropshire And Staffordshire Area Team 350 91 71 20 115 144 41.1% E38000173
05W NHS Stoke On Trent CCG Q60 Shropshire And Staffordshire Area Team 809 269 33.3% 30.1% - 36.6% 188 23.2% 81 10.0% 540 66.7% 0 0.0% E38000175
05X NHS Telford and Wrekin CCG Q60 Shropshire And Staffordshire Area Team 491 149 108 41 296 46 9.4% E38000183
11E NHS Bath and North East Somerset CCG Q64 Bath, Gloucestershire, Swindon And Wiltshire Area Team 431 181 146 35 117 133 30.9% E38000009
11M NHS Gloucestershire CCG Q64 Bath, Gloucestershire, Swindon And Wiltshire Area Team 1,629 854 52.4% 50.0% - 54.8% 658 40.4% 196 12.0% 741 45.5% 34 2.1% E38000062
12D NHS Swindon CCG Q64 Bath, Gloucestershire, Swindon And Wiltshire Area Team 733 371 50.6% 47.0% - 54.2% 255 34.8% 116 15.8% 343 46.8% 19 2.6% E38000181
99N NHS Wiltshire CCG Q64 Bath, Gloucestershire, Swindon And Wiltshire Area Team 1,094 543 404 139 503 48 E38000206
11H NHS Bristol CCG Q65 Bristol, North Somerset, Somerset And South Gloucestershire Area Team 1,564 918 648 270 551 95 6.1% E38000022
11T NHS North Somerset CCG Q65 Bristol, North Somerset, Somerset And South Gloucestershire Area Team 515 267 51.8% 47.5% - 56.1% 207 40.2% 60 11.7% 244 47.4% 4 0.8% E38000125
11X NHS Somerset CCG Q65 Bristol, North Somerset, Somerset And South Gloucestershire Area Team 1,343 671 50.0% 47.3% - 52.6% 523 38.9% 148 11.0% 641 47.7% 31 2.3% E38000150
12A NHS South Gloucestershire CCG Q65 Bristol, North Somerset, Somerset And South Gloucestershire Area Team 733 357 48.7% 45.1% - 52.3% 255 34.8% 102 13.9% 371 50.6% 5 0.7% E38000155
11N NHS Kernow CCG Q66 Devon, Cornwall And Isles Of Scilly Area Team 1,310 503 404 99 533 274 20.9% E38000089
99P NHS Northern, Eastern and Western Devon CCG Q66 Devon, Cornwall And Isles Of Scilly Area Team 2,119 1,049 49.5% 47.4% - 51.6% 814 38.4% 235 11.1% 1,010 47.7% 60 2.8% E38000129
99Q NHS South Devon and Torbay CCG Q66 Devon, Cornwall And Isles Of Scilly Area Team 625 290 46.4% 42.5% - 50.3% 237 37.9% 53 8.5% 311 49.8% 24 3.8% E38000152
09C NHS Ashford CCG Q67 Kent And Medway Area Team 373 99 64 35 125 149 39.9% E38000002
09E NHS Canterbury and Coastal CCG Q67 Kent And Medway Area Team 440 119 95 24 137 184 41.8% E38000029
09J NHS Dartford, Gravesham and Swanley CCG Q67 Kent And Medway Area Team 785 259 158 101 338 188 23.9% E38000043
09W NHS Medway CCG Q67 Kent And Medway Area Team 926 204 122 82 283 439 47.4% E38000104
10A NHS South Kent Coast CCG Q67 Kent And Medway Area Team 452 120 91 29 179 153 33.8% E38000156
10D NHS Swale CCG Q67 Kent And Medway Area Team 311 80 50 30 136 95 30.5% E38000180
10E NHS Thanet CCG Q67 Kent And Medway Area Team 410 131 98 33 214 65 15.9% E38000184
99J NHS West Kent CCG Q67 Kent And Medway Area Team 1,318 563 404 159 392 363 27.5% E38000199
09D NHS Brighton and Hove CCG Q68 Surrey And Sussex Area Team 835 659 78.9% 76.0% - 81.6% 450 53.9% 209 25.0% 140 16.8% 36 4.3% E38000021
09G NHS Coastal West Sussex CCG Q68 Surrey And Sussex Area Team 1,200 222 165 57 181 797 66.4% E38000036
09H NHS Crawley CCG Q68 Surrey And Sussex Area Team 439 77 53 24 72 290 66.1% E38000039
09L NHS East Surrey CCG Q68 Surrey And Sussex Area Team 576 325 56.4% 52.3% - 60.4% 240 41.7% 85 14.8% 224 38.9% 27 4.7% E38000054
09F NHS Eastbourne, Hailsham and Seaford CCG Q68 Surrey And Sussex Area Team 446 204 177 27 129 113 25.3% E38000055
09N NHS Guildford and Waverley CCG Q68 Surrey And Sussex Area Team 496 323 65.1% 60.8% - 69.2% 234 47.2% 89 17.9% 153 30.8% 20 4.0% E38000067
Breastfeeding_1516Q1 T6_Prev68CCG_1516Q1 Standards and Quality Analytical Team (SAT)
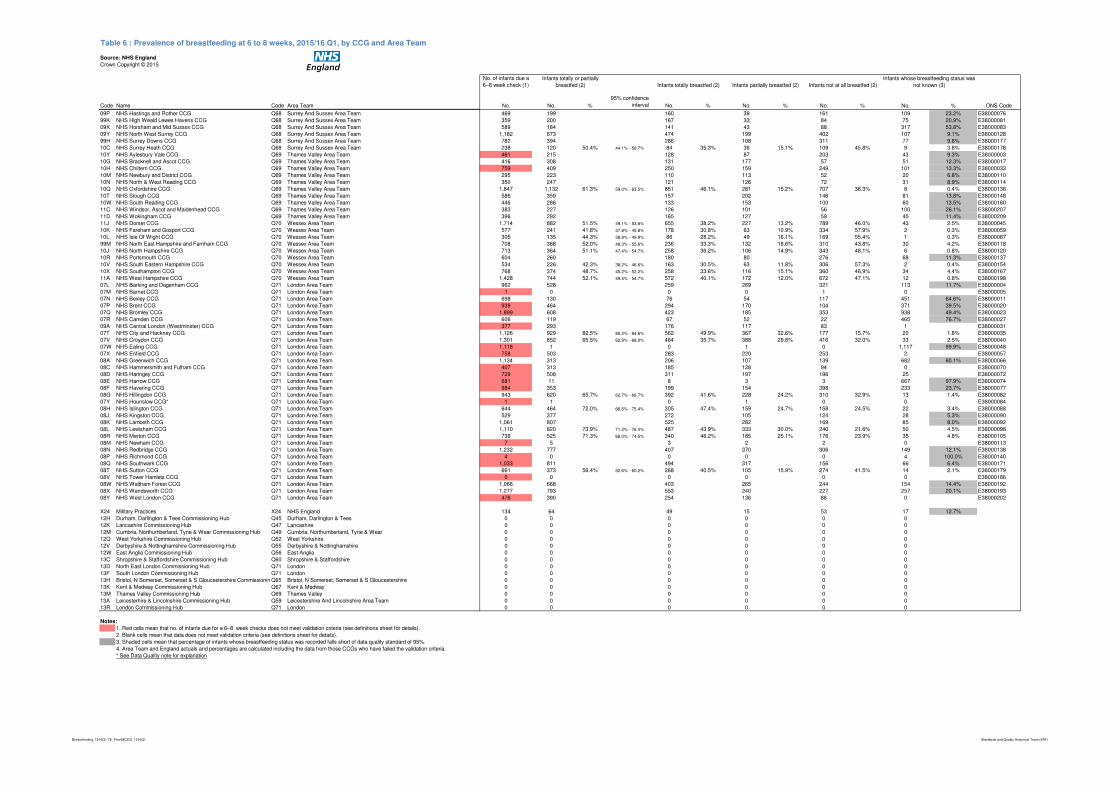
Table 6 : Prevalence of breastfeeding at 6 to 8 weeks, 2015/16 Q1, by CCG and Area Team
Source: NHS England
Crown Copyright © 2015
No. of infants due a
6–8 week check (1)
Code Name Code Area Team No. No. %
95% confidence
interval No. % No. % No. % No. % ONS Code
Infants totally or partially
breastfed (2) Infants totally breastfed (2) Infants partially breastfed (2) Infants not at all breastfed (2)
Infants whose breastfeeding status was
not known (3)
09P NHS Hastings and Rother CCG Q68 Surrey And Sussex Area Team 469 199 160 39 161 109 23.2% E38000076
99K NHS High Weald Lewes Havens CCG Q68 Surrey And Sussex Area Team 359 200 167 33 84 75 20.9% E38000081
09X NHS Horsham and Mid Sussex CCG Q68 Surrey And Sussex Area Team 589 184 141 43 88 317 53.8% E38000083
09Y NHS North West Surrey CCG Q68 Surrey And Sussex Area Team 1,182 673 474 199 402 107 9.1% E38000128
99H NHS Surrey Downs CCG Q68 Surrey And Sussex Area Team 782 394 286 108 311 77 9.8% E38000177
10C NHS Surrey Heath CCG Q68 Surrey And Sussex Area Team 238 120 50.4% 44.1% - 56.7% 84 35.3% 36 15.1% 109 45.8% 9 3.8% E38000178
10Y NHS Aylesbury Vale CCG Q69 Thames Valley Area Team 461 215 128 87 203 43 9.3% E38000003
10G NHS Bracknell and Ascot CCG Q69 Thames Valley Area Team 416 308 131 177 57 51 12.3% E38000017
10H NHS Chiltern CCG Q69 Thames Valley Area Team 759 409 250 159 249 101 13.3% E38000033
10M NHS Newbury and District CCG Q69 Thames Valley Area Team 295 223 110 113 52 20 6.8% E38000110
10N NHS North & West Reading CCG Q69 Thames Valley Area Team 350 247 121 126 72 31 8.9% E38000114
10Q NHS Oxfordshire CCG Q69 Thames Valley Area Team 1,847 1,132 61.3% 59.0% - 63.5% 851 46.1% 281 15.2% 707 38.3% 8 0.4% E38000136
10T NHS Slough CCG Q69 Thames Valley Area Team 586 359 157 202 146 81 13.8% E38000148
10W NHS South Reading CCG Q69 Thames Valley Area Team 446 286 133 153 100 60 13.5% E38000160
11C NHS Windsor, Ascot and Maidenhead CCG Q69 Thames Valley Area Team 383 227 126 101 56 100 26.1% E38000207
11D NHS Wokingham CCG Q69 Thames Valley Area Team 396 292 165 127 59 45 11.4% E38000209
11J NHS Dorset CCG Q70 Wessex Area Team 1,714 882 51.5% 49.1% - 53.8% 655 38.2% 227 13.2% 789 46.0% 43 2.5% E38000045
10K NHS Fareham and Gosport CCG Q70 Wessex Area Team 577 241 41.8% 37.8% - 45.8% 178 30.8% 63 10.9% 334 57.9% 2 0.3% E38000059
10L NHS Isle Of Wight CCG Q70 Wessex Area Team 305 135 44.3% 38.8% - 49.9% 86 28.2% 49 16.1% 169 55.4% 1 0.3% E38000087
99M NHS North East Hampshire and Farnham CCG Q70 Wessex Area Team 708 368 52.0% 48.3% - 55.6% 236 33.3% 132 18.6% 310 43.8% 30 4.2% E38000118
10J NHS North Hampshire CCG Q70 Wessex Area Team 713 364 51.1% 47.4% - 54.7% 258 36.2% 106 14.9% 343 48.1% 6 0.8% E38000120
10R NHS Portsmouth CCG Q70 Wessex Area Team 604 260 180 80 276 68 11.3% E38000137
10V NHS South Eastern Hampshire CCG Q70 Wessex Area Team 534 226 42.3% 38.2% - 46.6% 163 30.5% 63 11.8% 306 57.3% 2 0.4% E38000154
10X NHS Southampton CCG Q70 Wessex Area Team 768 374 48.7% 45.2% - 52.2% 258 33.6% 116 15.1% 360 46.9% 34 4.4% E38000167
11A NHS West Hampshire CCG Q70 Wessex Area Team 1,428 744 52.1% 49.5% - 54.7% 572 40.1% 172 12.0% 672 47.1% 12 0.8% E38000198
07L NHS Barking and Dagenham CCG Q71 London Area Team 962 528 259 269 321 113 11.7% E38000004
07M NHS Barnet CCG Q71 London Area Team 1 0 0 0 1 0 E38000005
07N NHS Bexley CCG Q71 London Area Team 698 130 76 54 117 451 64.6% E38000011
07P NHS Brent CCG Q71 London Area Team 939 464 294 170 104 371 39.5% E38000020
07Q NHS Bromley CCG Q71 London Area Team 1,899 608 423 185 353 938 49.4% E38000023
07R NHS Camden CCG Q71 London Area Team 606 119 67 52 22 465 76.7% E38000027
09A NHS Central London (Westminster) CCG Q71 London Area Team 377 293 176 117 83 1 E38000031
07T NHS City and Hackney CCG Q71 London Area Team 1,126 929 82.5% 80.2% - 84.6% 562 49.9% 367 32.6% 177 15.7% 20 1.8% E38000035
07V NHS Croydon CCG Q71 London Area Team 1,301 852 65.5% 62.9% - 68.0% 464 35.7% 388 29.8% 416 32.0% 33 2.5% E38000040
07W NHS Ealing CCG Q71 London Area Team 1,118 1 0 1 0 1,117 99.9% E38000048
07X NHS Enfield CCG Q71 London Area Team 758 503 283 220 253 2 E38000057
08A NHS Greenwich CCG Q71 London Area Team 1,134 313 206 107 139 682 60.1% E38000066
08C NHS Hammersmith and Fulham CCG Q71 London Area Team 407 313 185 128 94 0 E38000070
08D NHS Haringey CCG Q71 London Area Team 729 508 311 197 196 25 E38000072
08E NHS Harrow CCG Q71 London Area Team 681 11 8 3 3 667 97.9% E38000074
08F NHS Havering CCG Q71 London Area Team 984 353 199 154 398 233 23.7% E38000077
08G NHS Hillingdon CCG Q71 London Area Team 943 620 65.7% 62.7% - 68.7% 392 41.6% 228 24.2% 310 32.9% 13 1.4% E38000082
07Y NHS Hounslow CCG* Q71 London Area Team 1 1 0 1 0 0 E38000084
08H NHS Islington CCG Q71 London Area Team 644 464 72.0% 68.5% - 75.4% 305 47.4% 159 24.7% 158 24.5% 22 3.4% E38000088
08J NHS Kingston CCG Q71 London Area Team 529 377 272 105 124 28 5.3% E38000090
08K NHS Lambeth CCG Q71 London Area Team 1,061 807 525 282 169 85 8.0% E38000092
08L NHS Lewisham CCG Q71 London Area Team 1,110 820 73.9% 71.2% - 76.4% 487 43.9% 333 30.0% 240 21.6% 50 4.5% E38000098
08R NHS Merton CCG Q71 London Area Team 736 525 71.3% 68.0% - 74.5% 340 46.2% 185 25.1% 176 23.9% 35 4.8% E38000105
08M NHS Newham CCG Q71 London Area Team 7 5 3 2 2 0 E38000113
08N NHS Redbridge CCG Q71 London Area Team 1,232 777 407 370 306 149 12.1% E38000138
08P NHS Richmond CCG Q71 London Area Team 4 0 0 0 0 4 100.0% E38000140
08Q NHS Southwark CCG Q71 London Area Team 1,033 811 494 317 156 66 6.4% E38000171
08T NHS Sutton CCG Q71 London Area Team 661 373 56.4% 52.6% - 60.2% 268 40.5% 105 15.9% 274 41.5% 14 2.1% E38000179
08V NHS Tower Hamlets CCG Q71 London Area Team 0 0 0 0 0 0 E38000186
08W NHS Waltham Forest CCG Q71 London Area Team 1,066 668 403 265 244 154 14.4% E38000192
08X NHS Wandsworth CCG Q71 London Area Team 1,277 793 553 240 227 257 20.1% E38000193
08Y NHS West London CCG Q71 London Area Team 476 390 254 136 86 0 E38000202
X24 Military Practices X24 NHS England 134 64 49 15 53 17 12.7%
12H Durham, Darlington & Tees Commissioning Hub Q45 Durham, Darlington & Tees 0 0 0 0 0 0
12K Lancashire Commissioning Hub Q47 Lancashire 0 0 0 0 0 0
12M Cumbria, Northumberland, Tyne & Wear Commissioning Hub Q49 Cumbria, Northumberland, Tyne & Wear 0 0 0 0 0 0
12Q West Yorkshire Commissioning Hub Q52 West Yorkshire 0 0 0 0 0 0
12V Derbyshire & Nottinghamshire Commissioning Hub Q55 Derbyshire & Nottinghamshire 0 0 0 0 0 0
12W East Anglia Commissioning Hub Q56 East Anglia 0 0 0 0 0 0
13C Shropshire & Staffordshire Commissioning Hub Q60 Shropshire & Staffordshire 0 0 0 0 0 0
13D North East London Commissioning Hub Q71 London 0 0 0 0 0 0
13F South London Commissioning Hub Q71 London 0 0 0 0 0 0
13H Bristol, N Somerset, Somerset & S Gloucestershire Commissioning HubQ65 Bristol, N Somerset, Somerset & S Gloucestershire 0 0 0 0 0 0
13K Kent & Medway Commissioning Hub Q67 Kent & Medway 0 0 0 0 0 0
13M Thames Valley Commissioning Hub Q69 Thames Valley 0 0 0 0 0 0
13A Leicesterhire & Lincolnshire Commissioning Hub Q59 Leicestershire And Lincolnshire Area Team 0 0 0 0 0 0
13R London Commissioning Hub Q71 London 0 0 0 0 0 0
Notes:
1. Red cells mean that no. of infants due for a 6–8 week checks does not meet validation criteria (see definitions sheet for details).
2. Blank cells mean that data does not meet validation criteria (see definitions sheet for details).
3. Shaded cells mean that percentage of infants whose breastfeeding status was recorded falls short of data quality standard of 95%.
4. Area Team and England actuals and percentages are calculated including the data from those CCGs who have failed the validation criteria.
* See Data Quality note for explanation
Breastfeeding_1516Q1 T6_Prev68CCG_1516Q1 Standards and Quality Analytical Team (SAT)

0% 10% 20% 30% 40% 50% 60% 70% 80% 90% 100%
Knowsley
S Tees
St Helens
Wigan Borough
Hartlepool & Stockton-On-Tees
Sunderland
Doncaster
Darlington
W Lancashire
Hull
Mansfield & Ashfield
Stoke On Trent
S Cheshire
Wakefield
Wirral
Vale Royal
Warrington
Liverpool
Erewash
Lincolnshire East
Newark & Sherwood
Northumberland
Dudley
Chorley & S Ribble
Oldham
Walsall
Wyre Forest
N Durham
Bassetlaw
Corby
N Staffordshire
N Tyneside
Bolton
Great Yarmouth & Waveney
W Norfolk
Basildon & Brentwood
Fareham & Gosport
W Cheshire
S Eastern Hampshire
Calderdale
N Derbyshire
E Riding of Yorkshire
Nottingham N & East
S W Lincolnshire
Wolverhampton
Isle Of Wight
Newcastle West
Redditch & Bromsgrove
S Lincolnshire
Solihull
W Leicestershire
W Suffolk
N Norfolk
Thurrock
Nottingham City
Newcastle N & E
Nene
Shropshire
Mid Essex
Nottingham West
S Gloucestershire
N E Essex
S Devon & Torbay
S Norfolk
Bradford City
Ipswich & E Suffolk
Stockport
S Worcestershire
Herefordshire
Bedfordshire
N Hampshire
Somerset
Northern, Eastern & Western Devon
N Somerset
W Hampshire
Southampton
Swindon
Dorset
Eastern Cheshire
Surrey Heath
S Warwickshire
Luton
Gloucestershire
E Leicestershire & Rutland
Norwich
N E Hampshire & Farnham
Sheffield
Cambridgeshire & Peterborough
Sutton
E Surrey
Oxfordshire
Birmingham S & Central
Leicester City
Rushcliffe
Hillingdon
Croydon
Guildford & Waverley
Islington
Merton
Lewisham
Brighton & Hove
City & Hackney
Infants 6-8 week breastfeeding status as a percentage of infants due 6-8 week reviews by
CCGs in England 2015/16 Q1
Qtr % totally breastfed at 6-8 weeks
Qtr % partially breastfed at 6-8 weeks
Qtr % not at all breastfed at 6-8 weeks
Qtr % Not Known BF 6-8 Weeks

0.0%
10.0%
20.0%
30.0%
40.0%
50.0%
60.0%
70.0%
80.0%
90.0%S
tok
e O
n T
ren
t
Isle
Of
Wig
ht
Hu
ll
Ne
wa
rk &
Sh
erw
oo
d
N N
orf
olk
Ga
tesh
ea
d
Co
ve
ntr
y &
Ru
gb
y
W L
an
cash
ire
No
rth
ern
, E
ast
ern
& W
est
ern
De
vo
n
Du
dle
y
No
rwic
h
E S
urr
ey
Ma
nsf
ield
& A
shfi
eld
Do
rse
t
N K
irk
lee
s
Hig
h W
ea
ld L
ew
es
Ha
ve
ns
N E
Ha
mp
shir
e &
Fa
rnh
am
So
lih
ull
Mil
ton
Ke
yne
s
Gre
ate
r P
rest
on
Ch
ilte
rn
Da
rtfo
rd,
Gra
vesh
am
& S
wa
nle
y
Sa
nd
we
ll &
W B
irm
ing
ha
m
S M
an
che
ste
r
E &
N H
ert
ford
shir
e
Cro
yd
on
Qtr % Not Known BF 6-8 Weeks
Qtr % Not Known BF 6-8 Weeks
S TeesHullStoke On TrentDarlingtonN DerbyshireNewcastle N & EWirralErewashN E EssexWigan BoroughWalsallN StaffordshireNewcastle WestNorthumberlandNottingham CityMid EssexNewark & SherwoodN DurhamE Riding of YorkshireIsle Of WightWarringtonFareham & GosportWyre ForestS Eastern HampshireN TynesideOldhamOxfordshireBoltonStockportS GloucestershireS CheshireKnowsleyThurrockN SomersetCalderdaleW HampshireN HampshireHerefordshireHartlepool & Stockton-On-TeesBassetlawRushcliffeW LancashireSolihullLutonHillingdonGreat Yarmouth & WaveneyS WorcestershireS W LincolnshireWakefieldSheffieldS WarwickshireCity & HackneyBedfordshireNottingham WestRedditch & BromsgroveBirmingham S & CentralDoncasterGloucestershireSuttonLeicester CityShropshireNottingham N & EastSomersetDorsetDudleyCroydonLincolnshire EastSwindonE Leicestershire & RutlandIpswich & E SuffolkSt HelensVale RoyalNorthern, Eastern & Western DevonW SuffolkBradford CitySunderlandNorwichW LeicestershireW NorfolkN NorfolkWolverhamptonNeneCambridgeshire & PeterboroughEastern CheshireIslingtonS LincolnshireSurrey HeathBasildon & BrentwoodS Devon & TorbayS NorfolkGuildford & WaverleyCorbyN E Hampshire & FarnhamBrighton & HoveSouthamptonLewishamW CheshireLiverpoolChorley & S RibbleE SurreyMertonMansfield & AshfieldS SeftonBuryS TynesideKingston
SouthendBristol
Newbury & DistrictW EssexLincolnshire WestAiredale, Wharfedale & CravenLambeth
N & W ReadingTraffordN W SurreyTelford & WrekinSurrey Downs
Harrogate & Rural DistrictCastle Point & RochfordPortsmouthWokinghamBarking & DagenhamRedbridgeBlackpoolBracknell & AscotScarborough & Ryedale
S ReadingHambleton, Richmondshire & WhitbySlough
Waltham ForestGreater Preston
ThanetGateshead
Southport & FormbyWandsworth
High Weald Lewes HavensKernowN LincolnshireE & N Hertfordshire
Hastings & RotherDartford, Gravesham & Swanley
Blackburn with DarwenEastbourne, Hailsham & Seaford
Windsor, Ascot & MaidenheadW Kent
Herts ValleysSwaleBath & N E Somerset
S Kent CoastSandwell & W Birmingham
Cannock ChaseAshford
Stafford & SurroundsRotherham
Se Staffordshire & Seisdon PeninsulaCanterbury & CoastalE Staffordshire
MedwayN Manchester
Horsham & Mid SussexCentral Manchester
GreenwichLancashire North
BexleyCrawleyCoastal W Sussex
Camden
0% 10% 20% 30% 40% 50% 60% 70% 80% 90% 100%
Percentage Infants not known breastfeeding as a percentage of infants due 6-8 week
reviews by CCGs in England 2015/16 Q1
actual V Not knowns target 5%
Data Quality
Non Data Submissions
Maternity Providers:
Q1 2015/16 Non submissions from:
RGT CAMBRIDGE UNIVERSITY HOSPITALS NHS FOUNDATION TRUST
RVR EPSOM AND ST HELIER UNIVERSITY HOSPITALS NHS TRUST
RYJ IMPERIAL COLLEGE HEALTHCARE NHS TRUST
RVJ NORTH BRISTOL NHS TRUST
RX1 NOTTINGHAM UNIVERSITY HOSPITALS NHS TRUST
RA9 SOUTH DEVON HEALTHCARE NHS FOUNDATION TRUST
RGR WEST SUFFOLK NHS FOUNDATION TRUST
6-8 week Breastfeeding Providers:
Q1 2015/16 Non submissions from:
RWK EAST LONDON NHS FOUNDATION TRUST
RFS CHESTERFIELD ROYAL HOSPITAL NHS FOUNDATION TRUST and RBN ST HELENS AND
KNOWSLEY HOSPITALS NHS TRUST as CHIS do not hold 6-8 week breastfeeding prevalence data
RY9 HOUNSLOW AND RICHMOND COMMUNITY HEALTHCARE NHS TRUST and R1H BARTS
HEALTH NHS TRUST submitted null data i.e. submission was all zeros
Data Submission Issues
Q1 2015/16 Maternity Providers:
RNQ KETTERING GENERAL HOSPITAL NHS FOUNDATION TRUST only has paper based systems for
12 week risk assessment so they do not have the GP level of data. This will be submitted under V81999
and under CCG code 04G (as they do not have this level of data either). This is their main commissioners
but only covers 50/60% of their activity.
As of the 01/07/2014 RVL BARNET AND FARM CHASE HOSPITALS merged with RAL ROYAL FREE
LONDON NHS FOUNDATION TRUST to form a larger trust, hence the data validation flag for Q1 2015/16
maternities was removed.
As of the 01/10/2014 RD7 HEATHERWOOD & WEXHAM PARK HOSPITALS NHS FOUNDATION
TRUST merged into RDU FRIMLEY HEALTH NHS FOUNDATION TRUST, hence the data validation flag
for Q1 2015/16 maternities was removed.
As of the 01/10/2014 RV8 NORTH WEST LONDON HOSPITALS NHS TRUST and RC3 EALING
HOSPITALS NHS TRUST merged to become R1K LONDON NORTH WEST HEALTHCARE NHS
TRUST, hence the data validation flag for Q1 2015/16 maternities was removed.
RN3 GREAT WESTERN HOSPITALS NHS FOUNDATION TRUST as of 01/06/2014 some of the
Maternity services were transferred to RD1 ROYAL UNITED HOSPITALS BATH NHS FOUNDATION
TRUST, hence the data validation flag for Q1 2015/16 maternities was removed to account for this.
RD1 ROYAL UNITED HOSPITALS BATH NHS FOUNDATION TRUST as of the 01/06/2014 some of the
Maternity services transferred from RN3 GREAT WESTERN HOSPITALS NHS FOUNDATION TRUST to
RD1 ROYAL UNITED HOSPITALS BATH NHS FOUNDATION TRUST. Data for this Trust has not been
subject to validation as validation is compared against historic data and there will not be any data for this
yet. Therefore, validation flag for Q1 2015/16 maternities was removed.

Q1 2015/16 6-8 week Breastfeeding Providers:
02P NHS Barnsley CCG, 04F NHS Milton Keynes CCG, 03G NHS Leeds South and East CCG and 07Y
NHS Hounslow CCG data for Q1 2015/16 reported a higher breastfeeding percentage rate at 6-8 weeks
than that of the breastfeeding initiation percentage rate and as such failed validation.
R1H BARTS HEALTH submitting data for Q1 2015/16 onwards on behalf of 711 TOWER HAMLETS.
216 NORTH EAST LINCOLNSHIRE UA informed that incorrect data had been submitted for Q1 2015/16.
Their main submission contribution was for 03H NHS NORTH EAST LINCOLNSHIRE CCG. Therefore,
the values for this CCG have been suppressed.
Organisation name changes:
NL8 LOCALA COMMUNITY PARTNERSHIPS to LOCALA COMMUNITY PARTNERSHIPS CIC
Q65 BRISTOL, NORTH SOMERSET, SOMERSET AND SOUTH GLOUCESTERSHIRE AREA TEAM is a
former organisation code, data for Q1 2015/16 submitted under organisation code Q80 NHS ENGLAND
SOUTH (SOUTH WEST)
Q47 LANCASHIRE AREA TEAM is a former organisation code, data for Q1 2015/16 submitted under
organisation code Q73 NHS ENGLAND NORTH (LANCASHIRE AND GREATER MANCHESTER)
0AE NHS CENTRAL SOUTHERN COMMISSIONING SUPPORT UNIT is a former organisation code,
data for Q1 2015/16 submitted under organisation code 0DF NHS SOUTH, CENTRAL AND WEST
COMMISSIONING SUPPORT UNIT
Data Failing Validation
Maternity Providers:
Q1 2015/16 data quality:
• 125 Trusts that submitted data passed the -10% / +20% validation standards when compared against HES maternities figure
• 117 out of the 128 Trusts that submitted data met the required 95% recording coverage standard, this is where there are less than 5% of the eligible maternities for whom a breastfeeding status is not known
• 114 out of the 128 Trusts that submitted data passed both validation checks • Data aggregated to the CCG level; 177 out of the 211 CCGs passed the -10% / +20% validation
standards when compared against recorded ONS births figures • Data aggregated to the CCG level; 190 out of the 211 CCGs met the required 95% recording
coverage standard, this is where there are less than 5% of the eligible maternities for whom a breastfeeding status is not known
• Data aggregated to the CCG level; 162 out of the 211 CCGs passed both validation checks
6-8 week Breastfeeding Providers:
Q1 2015/16 data quality:
• Data aggregated to the CCG level; 171 out of the 211 CCGs met the -10% / +20% validation standards when compared against recorded ONS births figures
• Data aggregated to the CCG level; 125 out of the 211 CCGs met the required 95% recording coverage standard, this is where less than 5% of eligible children’s 6-8 week breastfeeding status is not being recorded on the CHIS
• Data aggregated to the CCG level; 4 out of the 211 CCGs reported a higher breastfeeding initiation percentage rate than that of the breastfeeding percentage rate at 6-8 weeks
• Data aggregated to the CCG level; 102 of the 211 CCGs passed all validation checks*
* Note that one CCG (08V NHS Tower Hamlets CCG) did not have data submitted against and was
excluded from the passed validation counts. The values submitted for one CCG were suppressed owing
to incorrect data being submitted by the Provider (03H NHS NORTH EAST LINCOLNSHIRE CCG).
The coverage target for 2013/14 onwards has been reduced to 85% for England level figures only. Feedback was sought from the user perspective on lowering the threshold for the England figure. The change in quality standard for the validation check does not apply at the lower levels of geography.
Data collection and definition
Breastfeeding initiation
Since April 2003, data on the local breastfeeding initiation has been requested on a quarterly basis, historically from all PCTs. This information provides more timely, frequent and local information on breastfeeding initiation than the Infant Feeding Survey.
Since April 2013 this data is now being collected directly from providers via the data collection tool that is part of Unify2, a web based system set up to collect performance and other central returns directly from the NHS. The figures are obtained from maternity providers from midwives in acute trusts and information recorded at deliveries.
For breastfeeding initiation, each provider is required to submit actual figures for the quarter and year end out turn figures for the following three items:
� the number of maternities.� the number of mothers initiating breastfeeding.� the number of mothers not initiating breastfeeding.
Data validation
The following validation rules are applied to the data
All numbers must be submitted as integers.
All validation checks must be passed by Providers in order for the data to meet departmental statistical requirements. Where information has not passed these validation checks, this is identified in the tables in this report by conditional formatting.
Number initiating Breastfeeding
+ Number not initiating Breastfeeding
<= Number of Maternities
Number of Maternities
< Maximum Office of National Statistics (ONS) reported number of maternities for last year PLUS 20%
Number of Maternities
> Minimum Office of National Statistics (ONS) reported number of maternities for last year MINUS 10%
Number initiating Breastfeeding
+ Number not initiating Breastfeeding
> 95% of Number of Maternities

Data collection and definition
Breastfeeding at 6-8 weeks
Since April 2008, data on the local prevalence of breastfeeding at 6-8 weeks has been requested on a quarterly basis, historically from all PCTs. This is in addition to data collected on initiation of breastfeeding. This information provides more timely, frequent and local information on breastfeeding prevalence after the mother and baby have been discharged from hospital than the Infant Feeding Survey.
Since April 2013 this data is now being collected directly from child health information system providers via the data collection tool that is part of Unify2, a web based system set up to collect performance and other central returns directly from the NHS. The figures are typically derived by child health records from information recorded at infants’ 6-8 week check.
For breastfeeding prevalence, each child health information system is required to submit actual figures for the quarter and the year end out turn figures for the following four items:
� The number of infants due a 6–8 week check in each quarter.� The number of infants being “totally” breastfed (defined as infants who are exclusively receiving breast milk at 6-8 weeks of age - that is, they are NOT receiving formula milk, any other liquids or food).� The number of infants being “partially” breastfed (defined as infants who are currently receiving breast milk at 6-8 weeks of age and who are also receiving formula milk or any other liquids or food). � The number of infants being “not at all” breastfed (defined as infants who are not currently receiving any breast milk at 6-8 weeks of age).
Data validation
The following validation rules are applied to the data:
All four numbers must be submitted as integers.
All validation checks must be passed in order for the data to meet departmental statistical requirements. Where information hasnot passed these validation checks, this is identified in the tables in this report by conditional formatting.
Number of infants due a 6–8 week check
>= Number of infants “totally” breastfed +
Number of infants “partially” breastfed +
Number of infants “not at all” breastfed
Number of infants due a 6–8 week check
< Maximum National Statistics (ONS) reported number of live births for the last year PLUS 20.0%
Number of infants due a 6–8 week check
> Minimum National Statistics (ONS) reported number of live births for the last year MINUS 10.0%
Percentage of infants being breastfed at 6-8 week
< Percentage of mothers initiating breastfeeding
Contacts
For media enquiries only please contact the Department of Health press office on 020 7210 5221.
For other enquiries relating to the statistics and to offer feedback on the report, please contact:
Uzma Ishaq or Julie Douglas NHS EnglandEmail: [email protected]


