Harte Gold Corp. – Sugar Zone Project Page i Preliminary Economic Assessment, May 31, 2012 NI 43‐101 TECHNICAL REPORT ON THE PRELIMINARY ECONOMIC ASSESSMENT OF THE SUGAR ZONE PROJECT, NORTH‐WESTERN ONTARIO, CANADA, FOR HARTE GOLD CORP. Effective Date: May 31, 2012 Signing Date: July 12, 2012
Transcript
Harte Gold Corp. – Sugar Zone Project Page i Preliminary Economic Assessment, May 31, 2012
NI 43‐101 TECHNICAL REPORT ON THE PRELIMINARY ECONOMIC ASSESSMENT OF THE
SUGAR ZONE PROJECT, NORTH‐WESTERN ONTARIO, CANADA, FOR HARTE GOLD CORP.
Effective Date: May 31, 2012 Signing Date: July 12, 2012
Harte Gold Corp. – Sugar Zone Project Page ii Preliminary Economic Assessment, May 31, 2012
Prepared by NordPro Mine & Project Management Services Ltd.
TABLE OF CONTENTS Page
1.0 EXECUTIVE SUMMARY 1
1.1 MINERAL RESOURCE ESTIMATE 1
1.2 PRELIMINARY ECONOMIC ASSESSMENT 1
1.3 RECOMMENDATIONS 5
2.0 INTRODUCTION 6
2.1 TERMS OF REFERENCE 6
2.2 SOURCES OF INFORMATION 7
2.3 RESOURCES 7
2.4 MARGIN OF ERROR 8
2.5 SITE VISITS 8
2.6 UNITS AND CURRENCY 8
2.7 GLOSSARY OF TERMS 8
3.0 RELIANCE ON OTHER EXPERTS 11
4.0 PROPERTY DESCRIPTION AND LOCATION 12
4.1 PROPERTY LOCATION 12
4.2 PROPERTY DESCRIPTION AND OWNERSHIP 12
4.3 PROPERTY AGREEMENTS 15
5.0 ACCESS, CLIMATE, LOCAL RESOURCES, INFRASTRUCTURE AND PHYSIOGRAPHY 17
5.1 ACCESSIBILITY 17
5.2 CLIMATE 17
5.3 LOCAL RESOURCES AND INFRASTRUCTURE 18
5.4 PHYSIOGRAPHY 18
6.0 HISTORY 19
6.1 HISTORIC PRODUCTION 21
7.0 GEOLOGICAL SETTING AND MINERALIZATION 22
7.1 REGIONAL, LOCAL AND PROPERTY GEOLOGY 22
7.1.1 Regional Geology 22
Harte Gold Corp. – Sugar Zone Project Page iii Preliminary Economic Assessment, May 31, 2012
7.2. PROPERTY GEOLOGY 24
7.3 MINERALIZATION 27
7.3.1 Sugar Zone 27
7.3.2 Wolf Zone 28
8.0 DEPOSIT TYPES 29
9.0 EXPLORATION 30
10.0 DRILLING 33
10.1 GENERAL 33
10.2 PRE‐1993 DRILLING 37
10.3 HEMLO GOLD MINES INC. 1993 TO 1994 DRILLING 37
10.4 CORONA‐HARTE 1998 TO 2009 DRILLING 37
10.4.1 General 37
10.4.2 1998 Diamond Drill Program 38
10.4.3 2003‐2004 Diamond Drill Program 38
10.4.4 2004 Diamond Drill Program 38
10.4.5 2009 Diamond Drill Program 39
10.5 HARTE GOLD 2009 TO 2011 DRILLING 39
10.5.1 2010 Diamond Drill Program 40
10.5.2 2011 Diamond Drill Program 41
10.5.3 Surveys 42
10.6 WGM COMMENT ON HARTE DRILLING PROGRAMS 42
11.0 SAMPLE PREPARATION, ANALYSIS AND SECURITY 44
11.1 FIELD SAMPLING AND PREPARATION 44
11.1.1 Pre‐1993 Drilling Programs 44
11.1.2 1993 To 2011 Core Handling and Logging Procedures 44
11.1.3 1993 TO 2011 Core Sampling Procedures 45
11.1.4 2008 Core Storage and Security 45
11.1.5 WGM Comment on Logging and Sampling 46
11.2 LABORATORY SAMPLE PREPARATION AND ANALYSIS 46
11.2.1 Pre‐1993 Drilling Program Laboratory Analysis 46
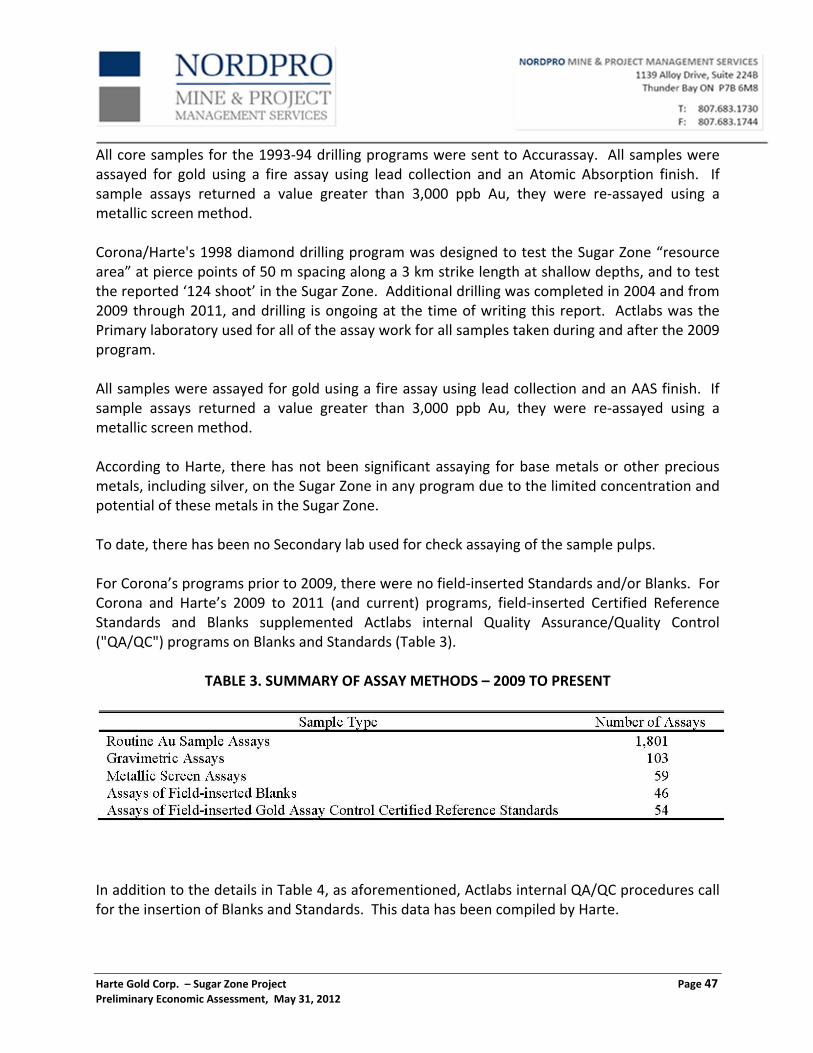
11.2.2 Laboratory Sample Preparation and Analysis 46
11.2.3 Laboratory Quality Assurance and Quality Control 48
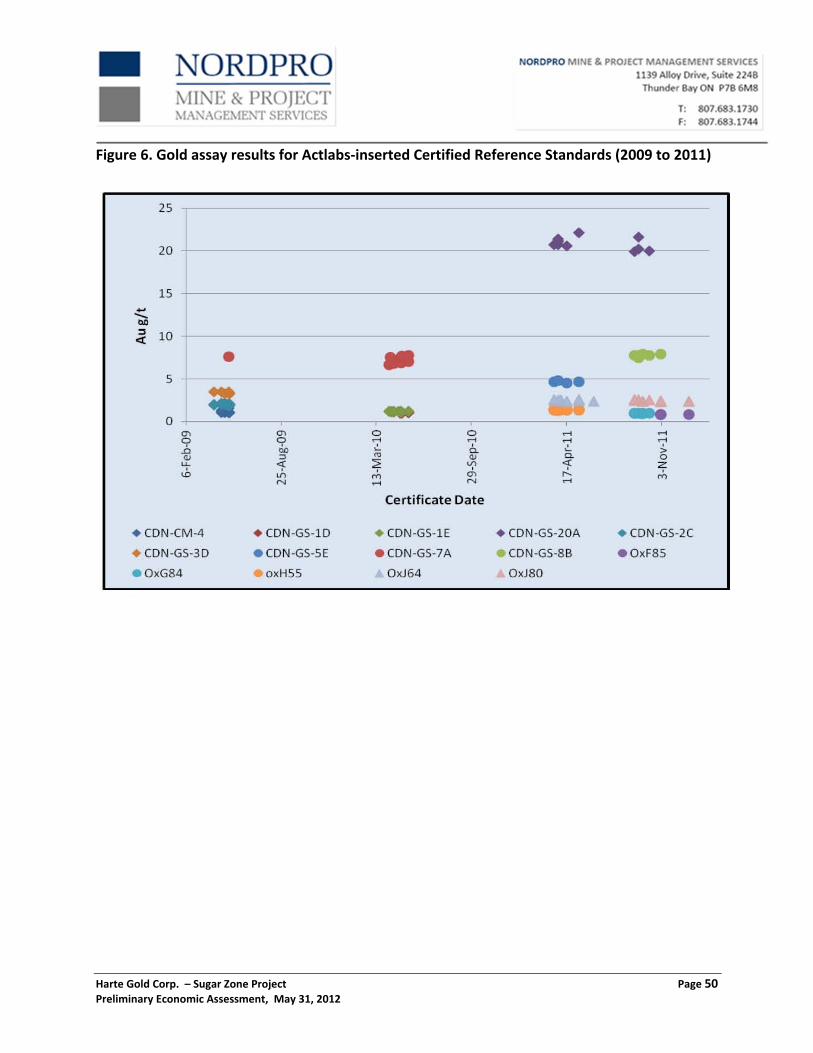
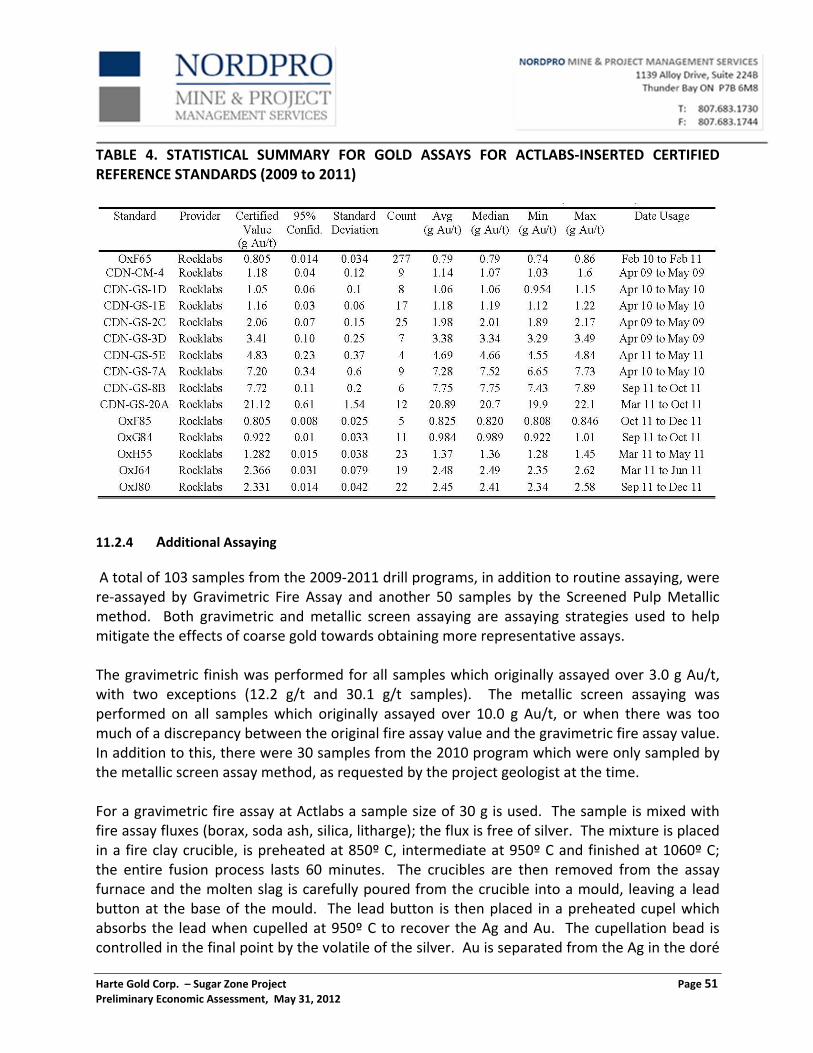
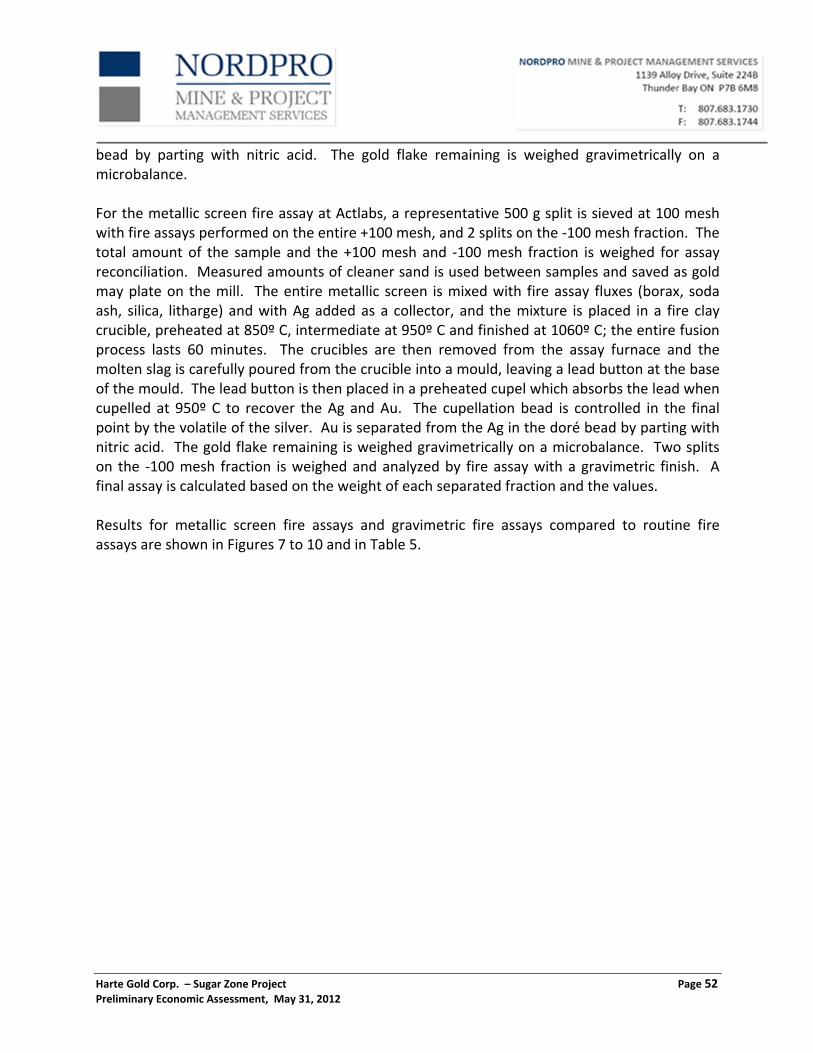
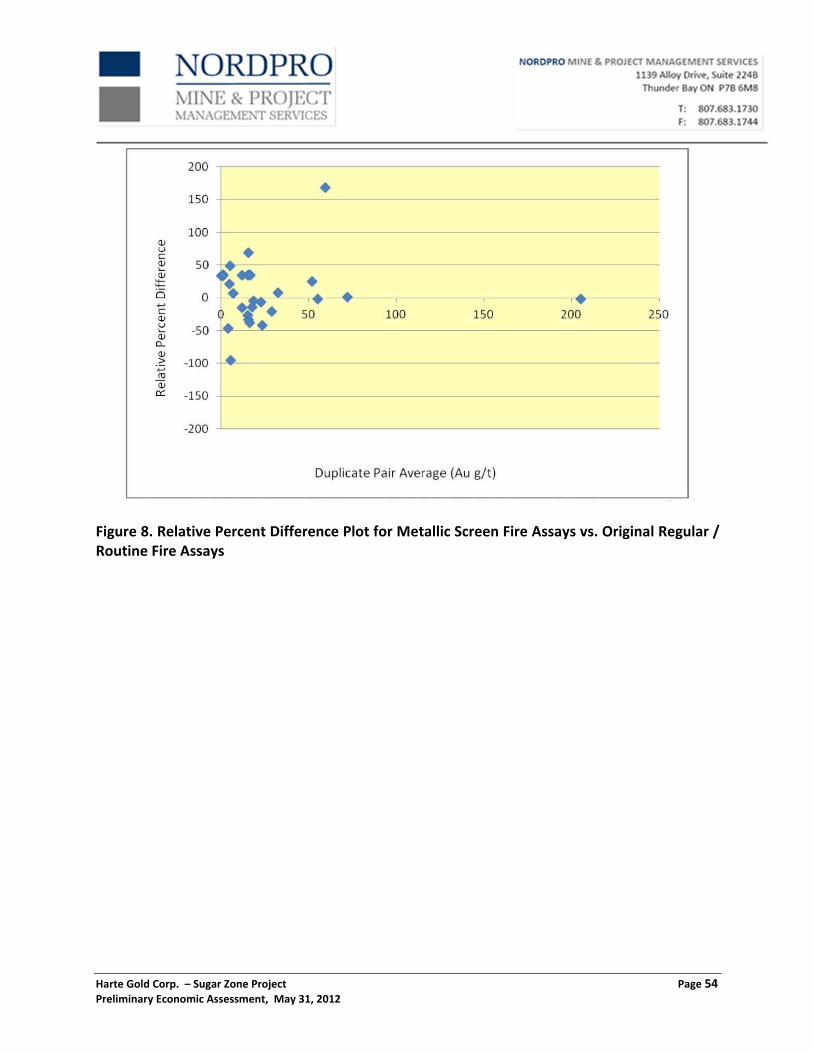
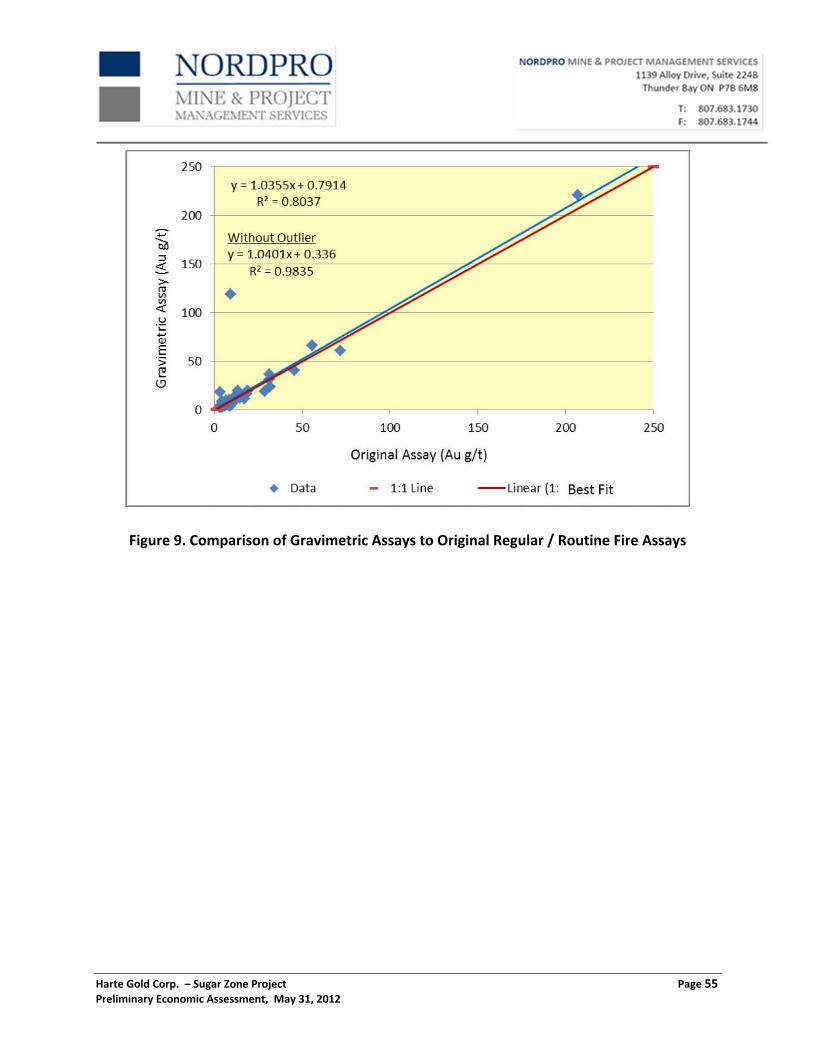
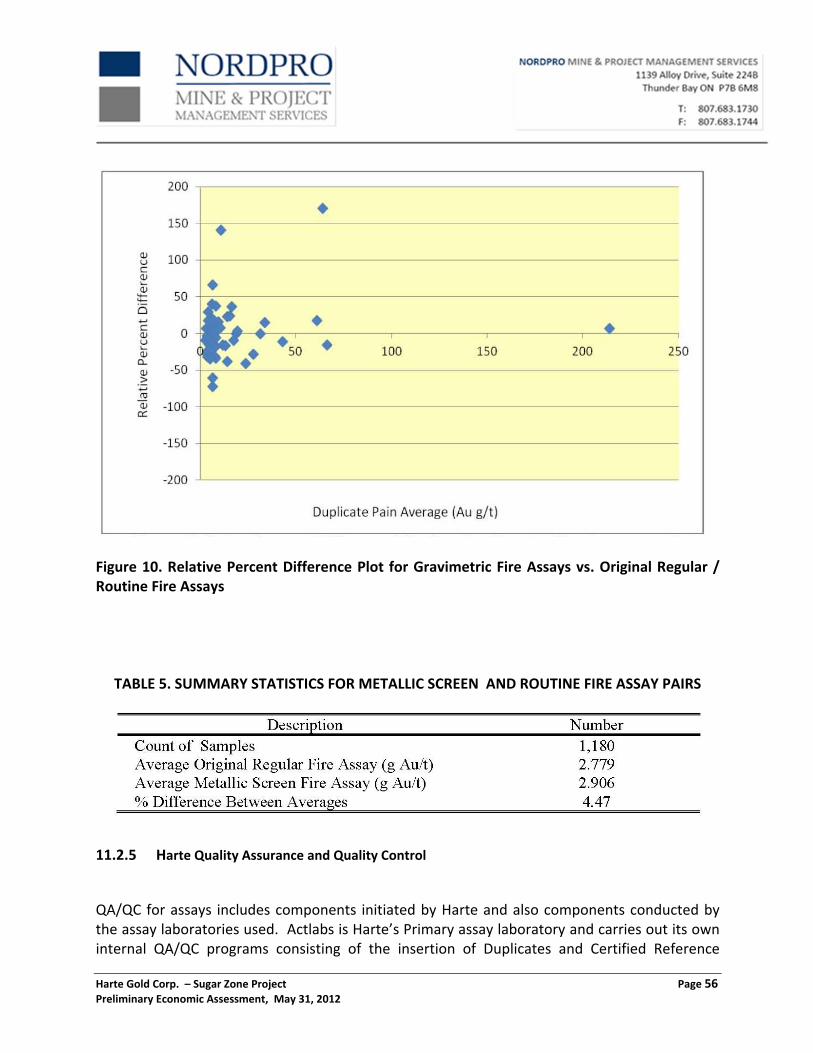
11.2.4 Additional Assaying 51
Harte Gold Corp. – Sugar Zone Project Page iv Preliminary Economic Assessment, May 31, 2012
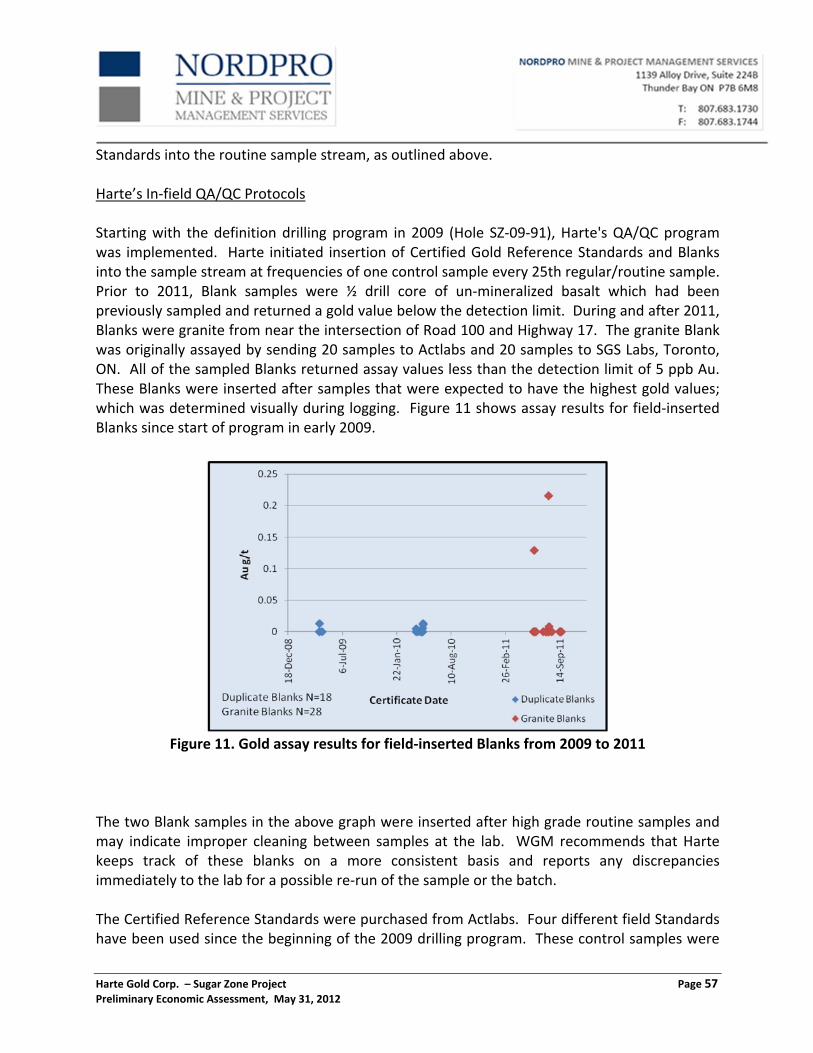
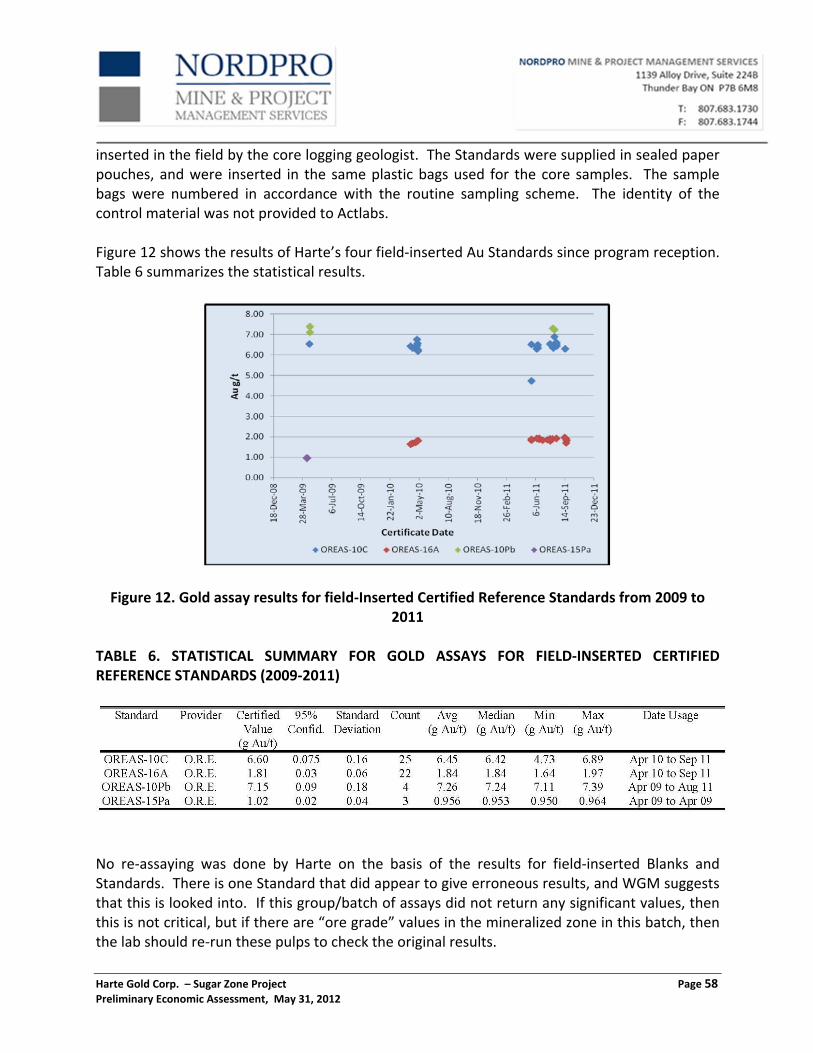
11.2.5 Harte Quality Assurance and Quality Control 56
11.2.6 Sample Shipping and Security 59
11.2.7 WGM Comments on Sampling, Assaying and QA/QC 59
12.0 DATA VERIFICATION 61
12.1 GENERAL 61
12.2 COLLAR COORDINATE VALIDATION 61
13.0 MINERAL PROCESSING AND METALLURGICAL TESTING 66
13.1 GENERAL 66
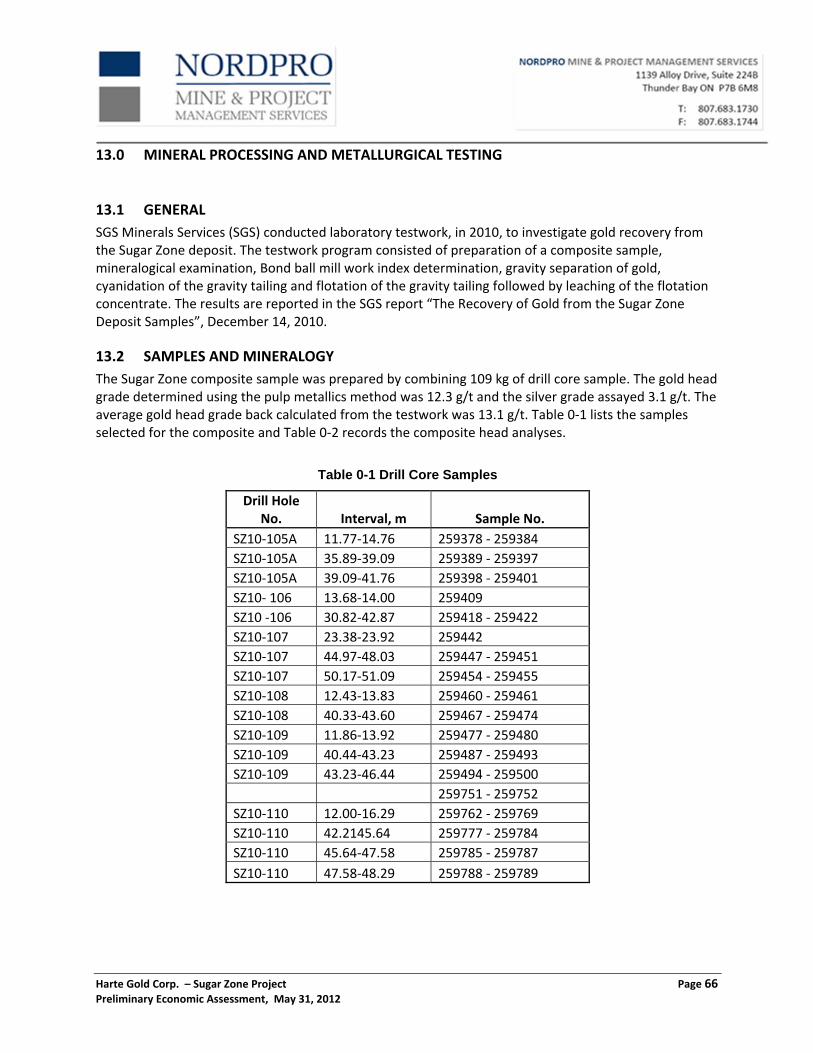
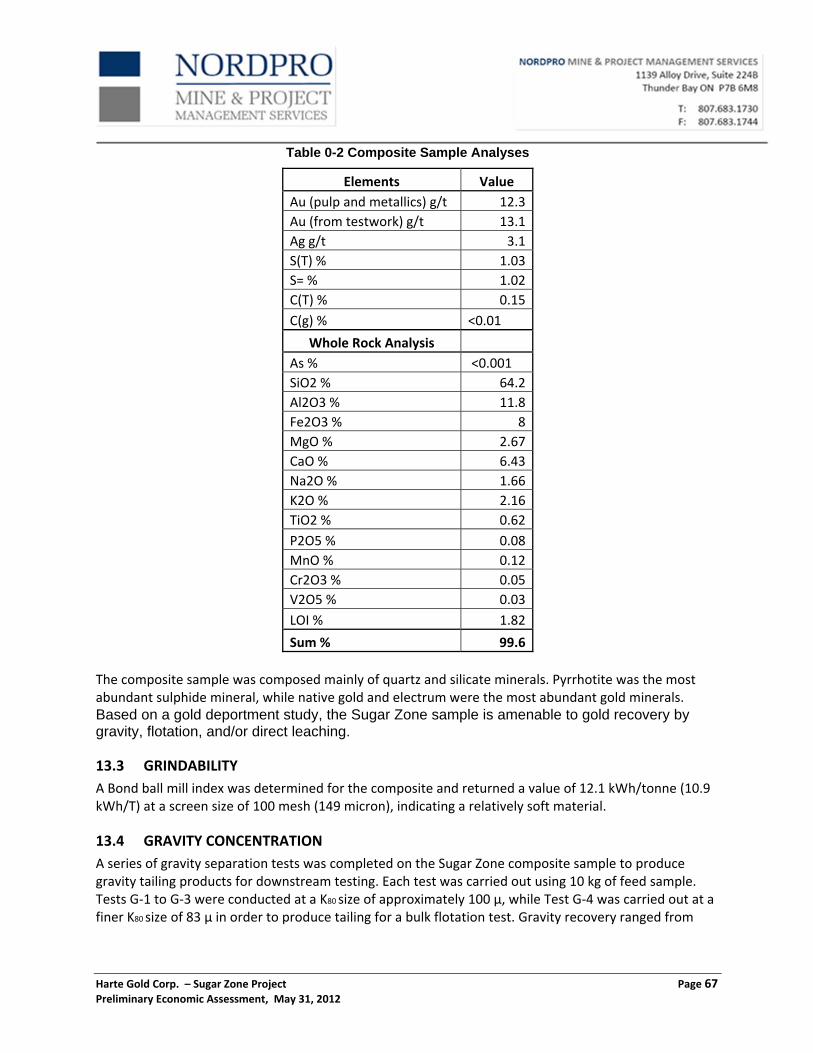
13.2 SAMPLES AND MINERALOGY 66
13.3 GRINDABILITY 67
13.4 GRAVITY CONCENTRATION 67
13.5 CYANIDATION 68
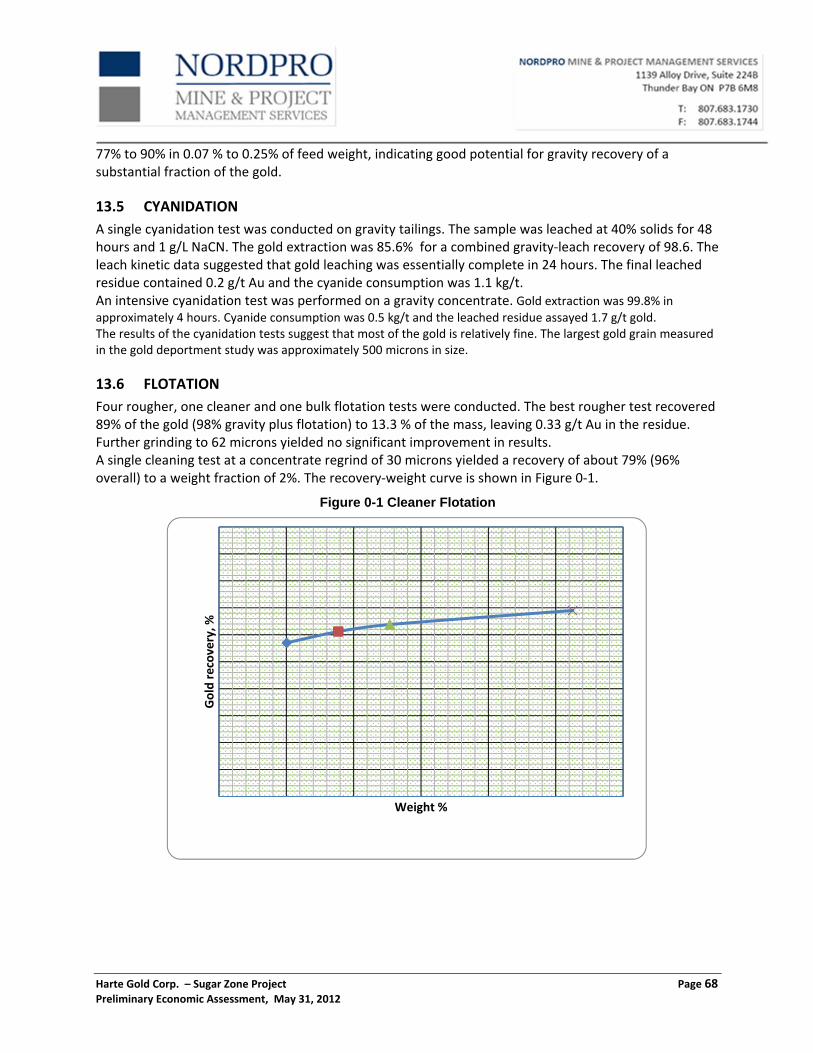
13.6 FLOTATION 68
13.7 CYANIDATION OF FLOTATION CONCENTRATE 69
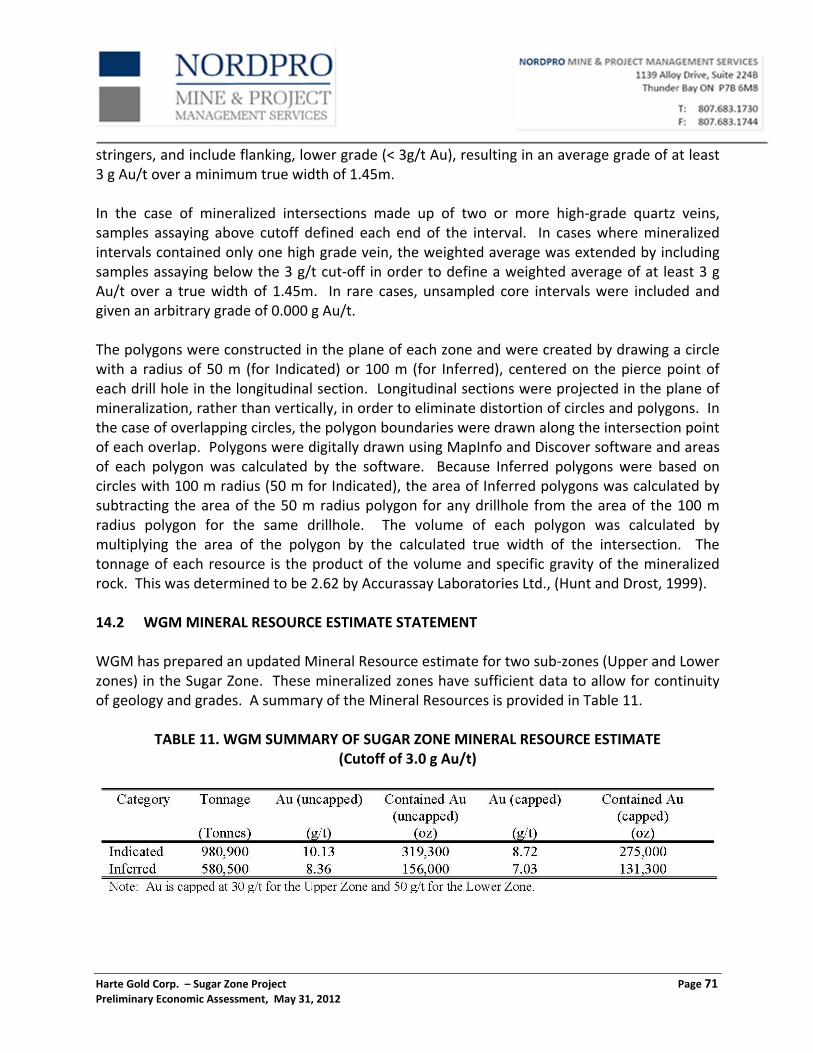
14.0 MINERAL RESOURCE AND MINERAL RESERVE ESTIMATES 70
14.1 PREVIOUS MINERAL RESOURCE/RESERVE ESTIMATES 70
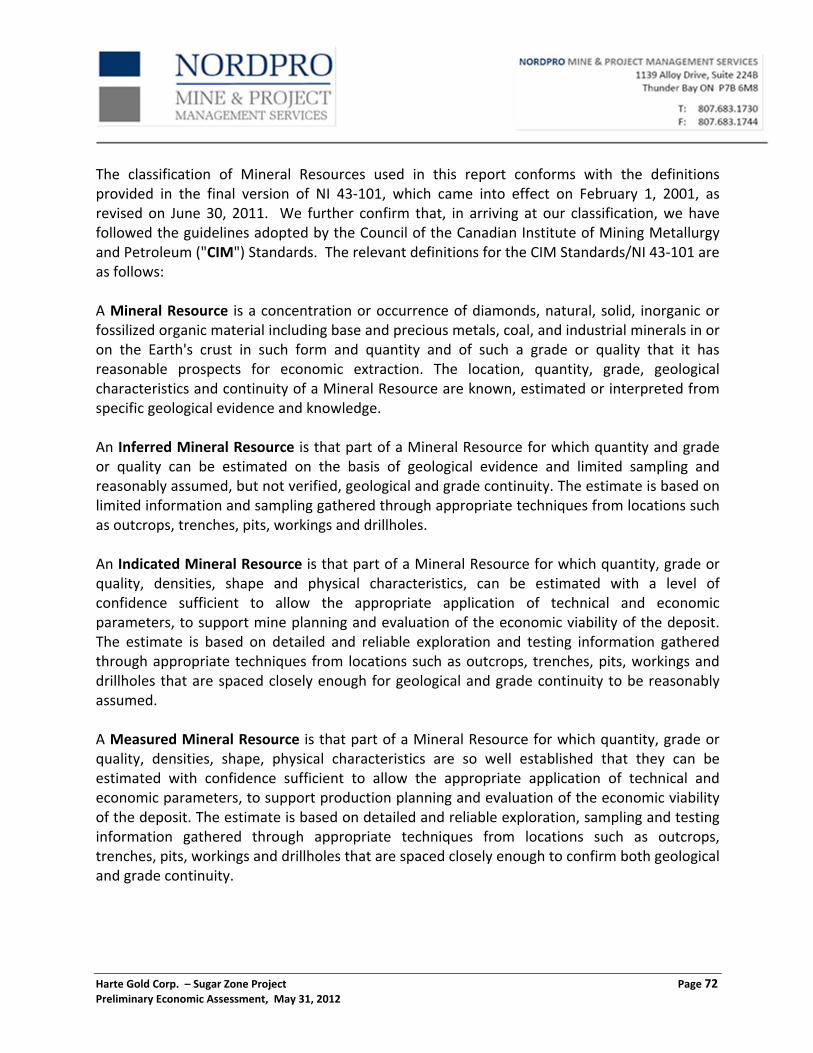
14.2 WGM MINERAL RESOURCE ESTIMATE STATEMENT 71
14.3 GENERAL MINERAL RESOURCE ESTIMATION PROCEDURES 73
14.4 DATABASE 74
14.4.1 Data Validation 74
14.4.2 Database Management 75
14.5 GEOLOGICAL MODELLING PROCEDURES 75
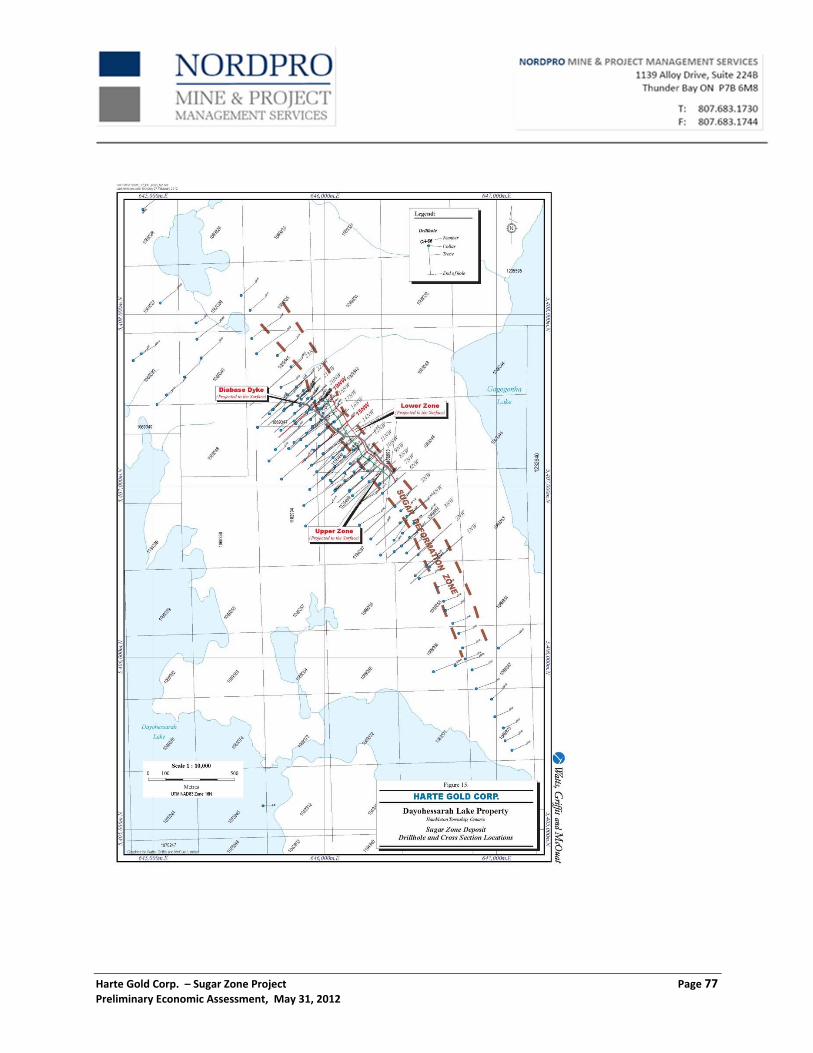
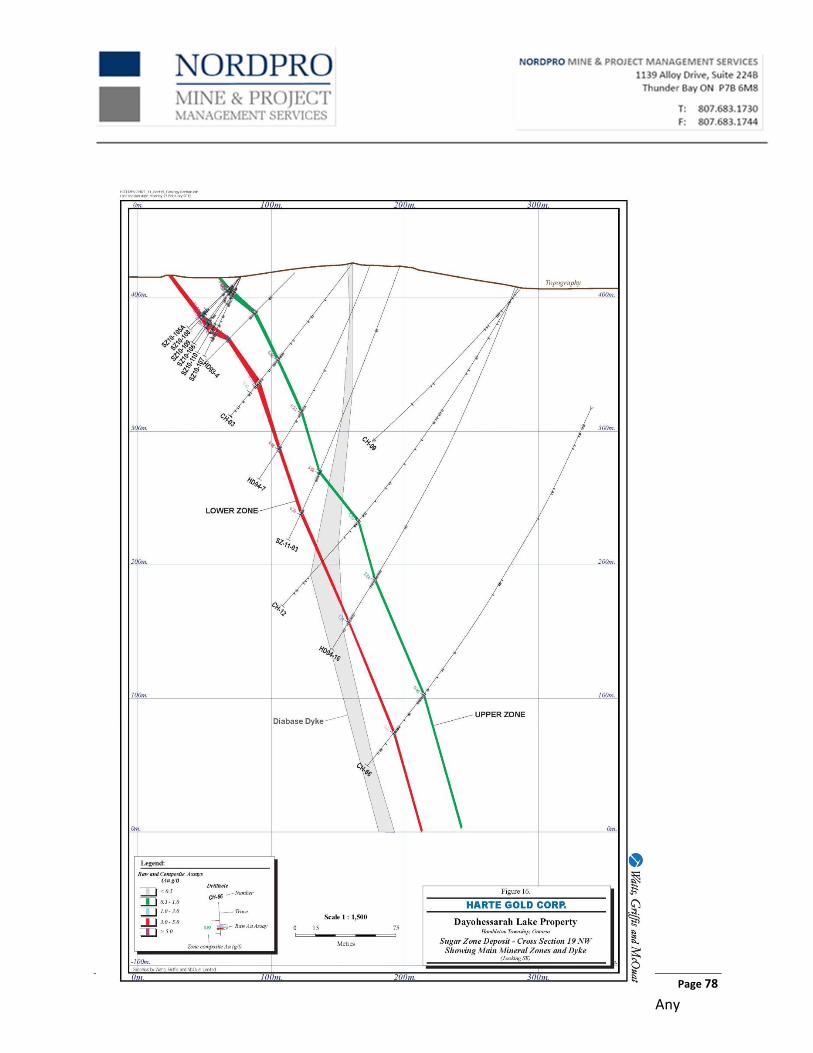
14.5.1 Cross Section Definition 75
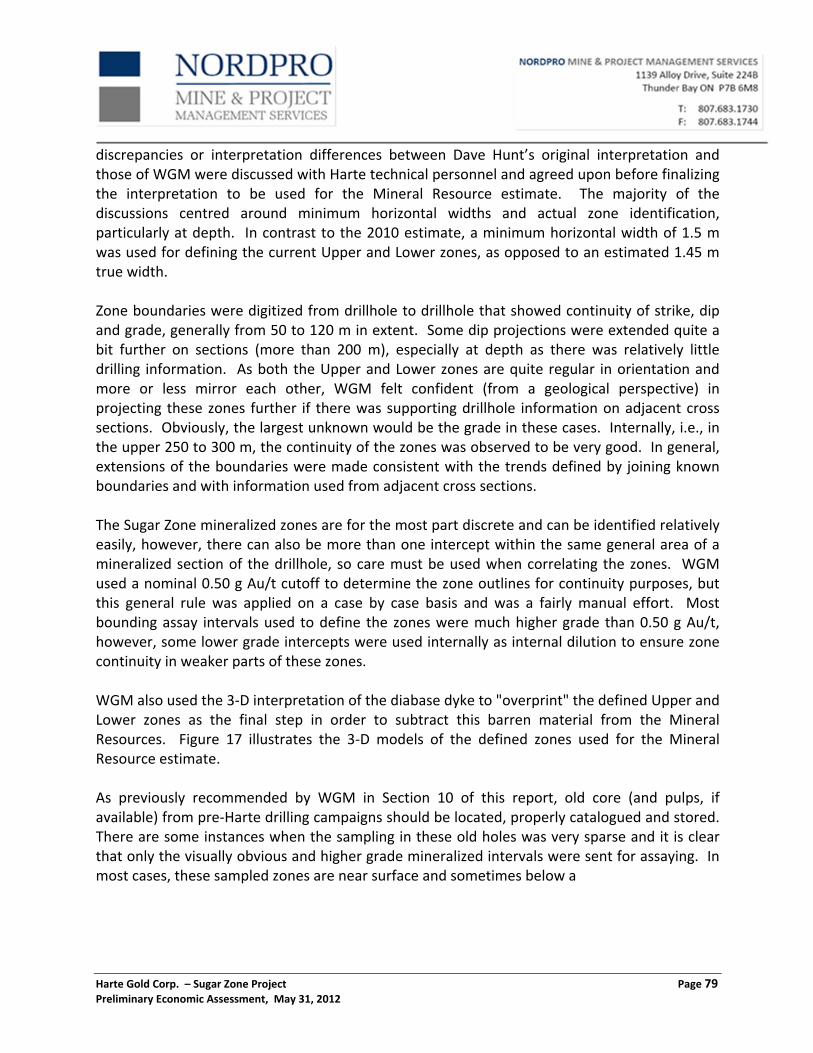
14.5.2 Geological Interpretation 76
14.5.3 Topographic Surface Creation 80
14.6 STATISTICAL ANALYSIS, COMPOSITING, CAPPING AND SPECIFIC GRAVITY 81
14.6.1 Back‐coding of Rock Code Field 81
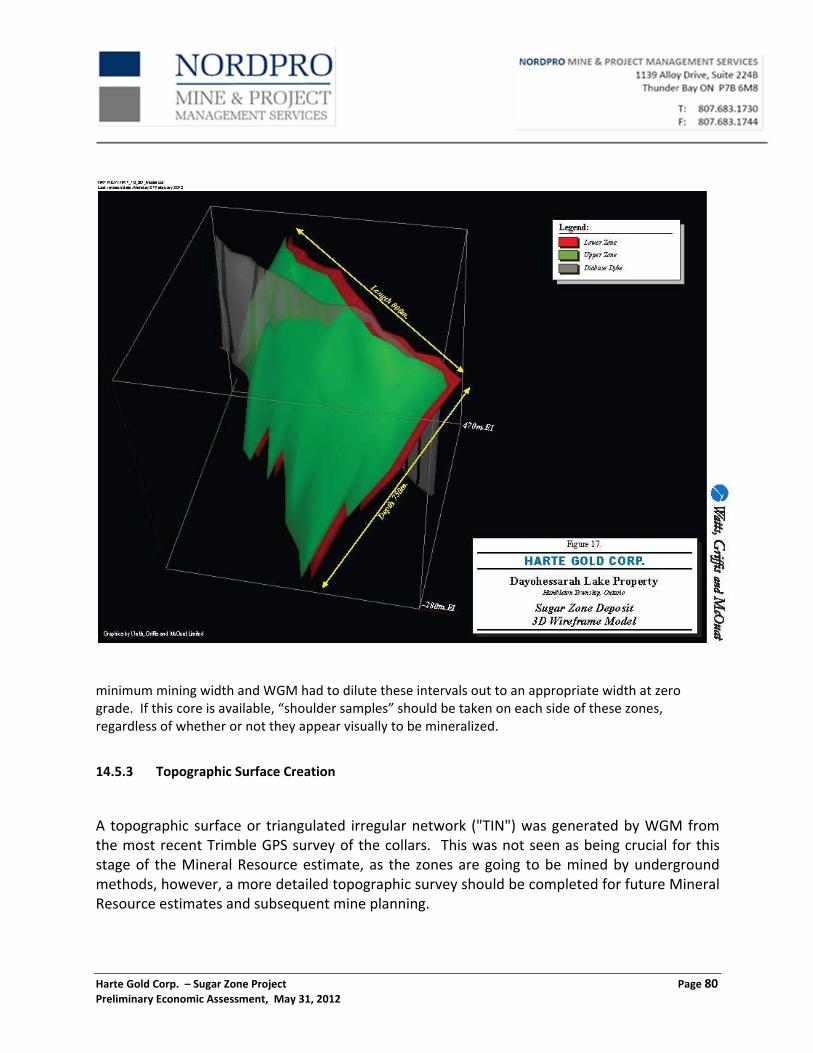
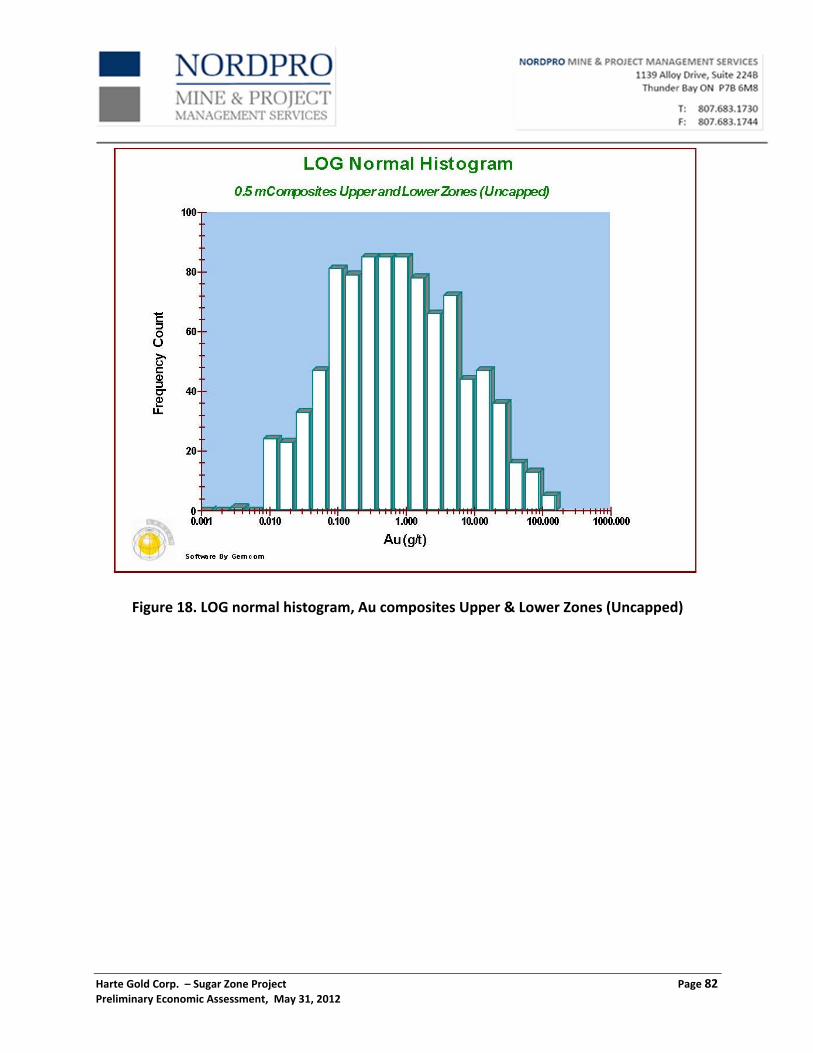
14.6.2 Statistical Analysis and Compositing 81
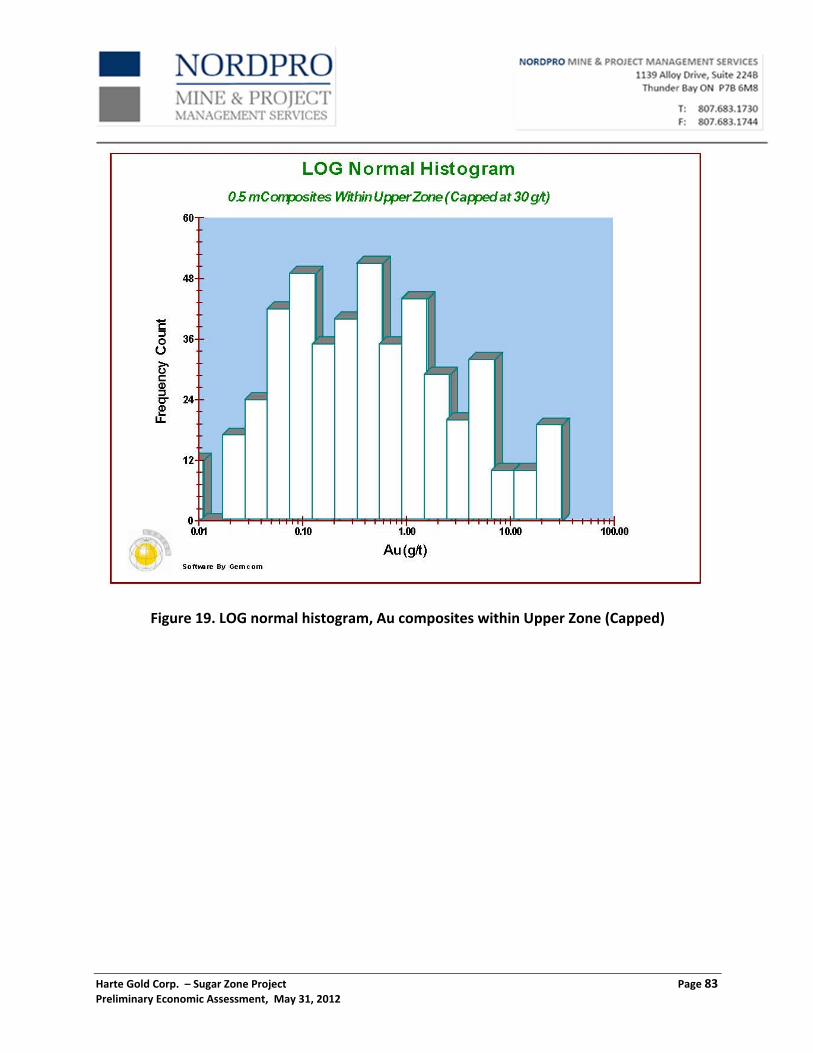
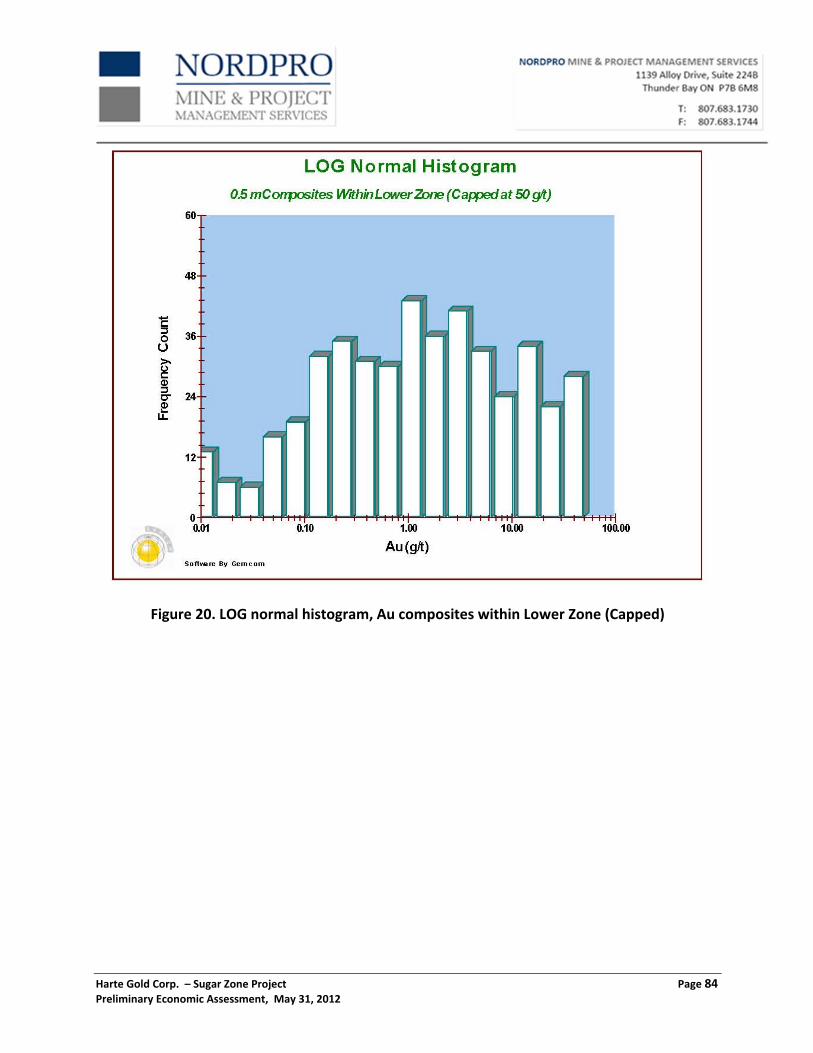
14.6.3 Grade Capping 85
14.6.4 Density/Specific Gravity 86
14.7 BLOCK MODEL PARAMETERS, GRADE INTERPOLATION AND CATEGORIZATION OF MINERAL RESOURCES 86
14.7.1 Block Model Setup/Parameters 87
Harte Gold Corp. – Sugar Zone Project Page v Preliminary Economic Assessment, May 31, 2012
14.7.2 Grade Interpolation and Variography 87
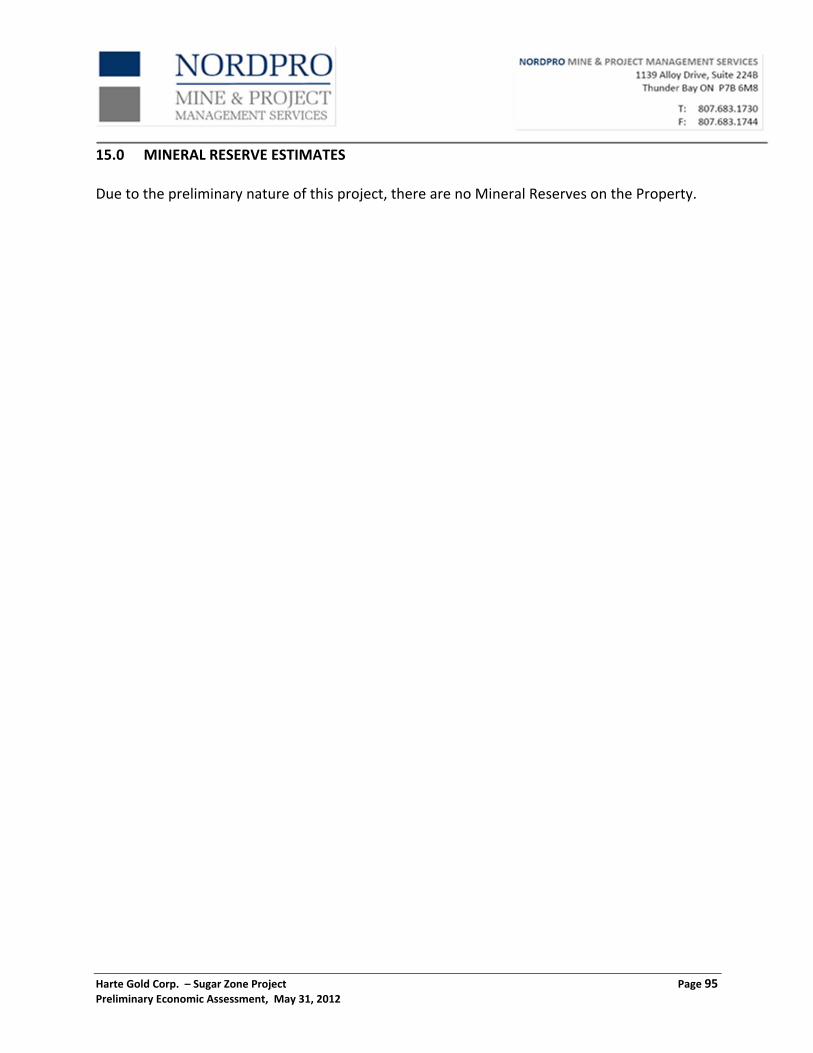
14.7.3 Cutoff Grade and Minimum Width 89
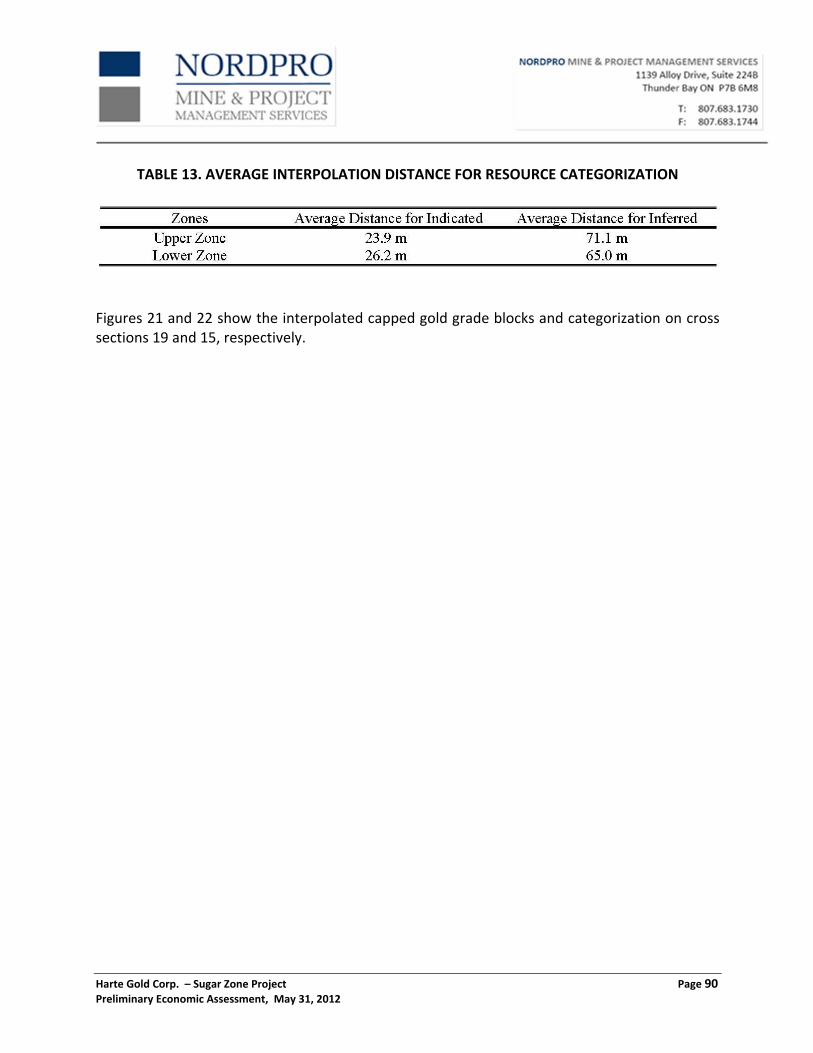
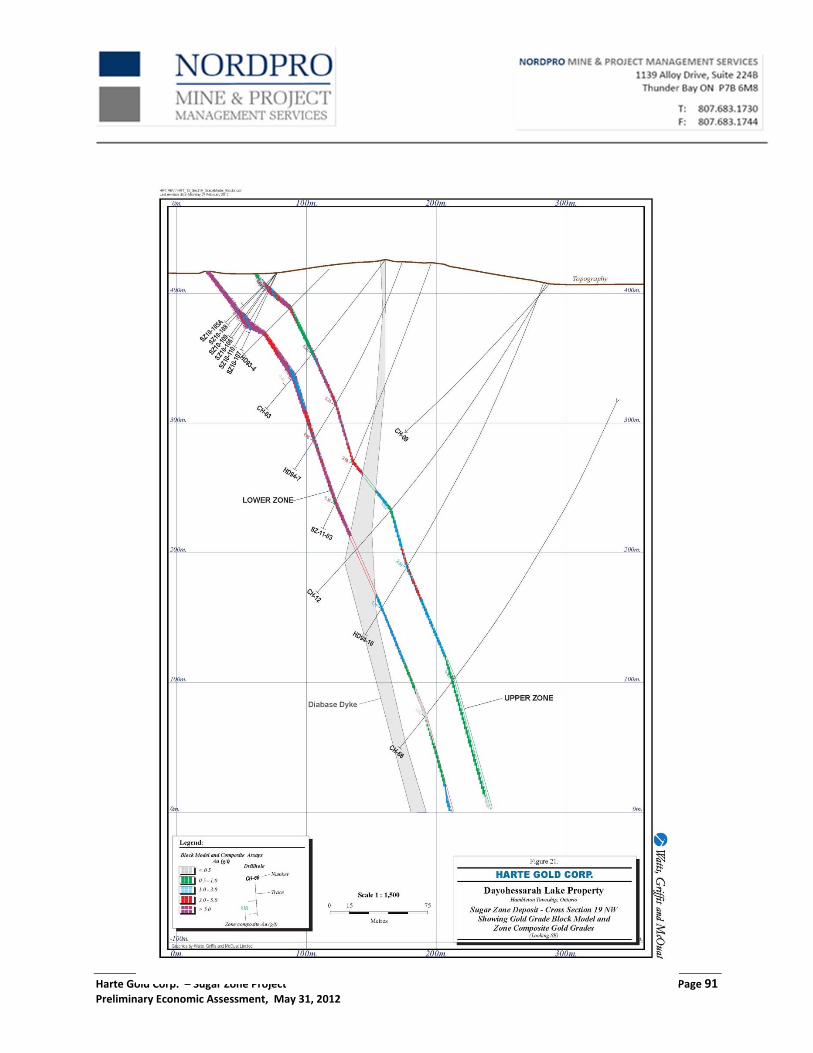
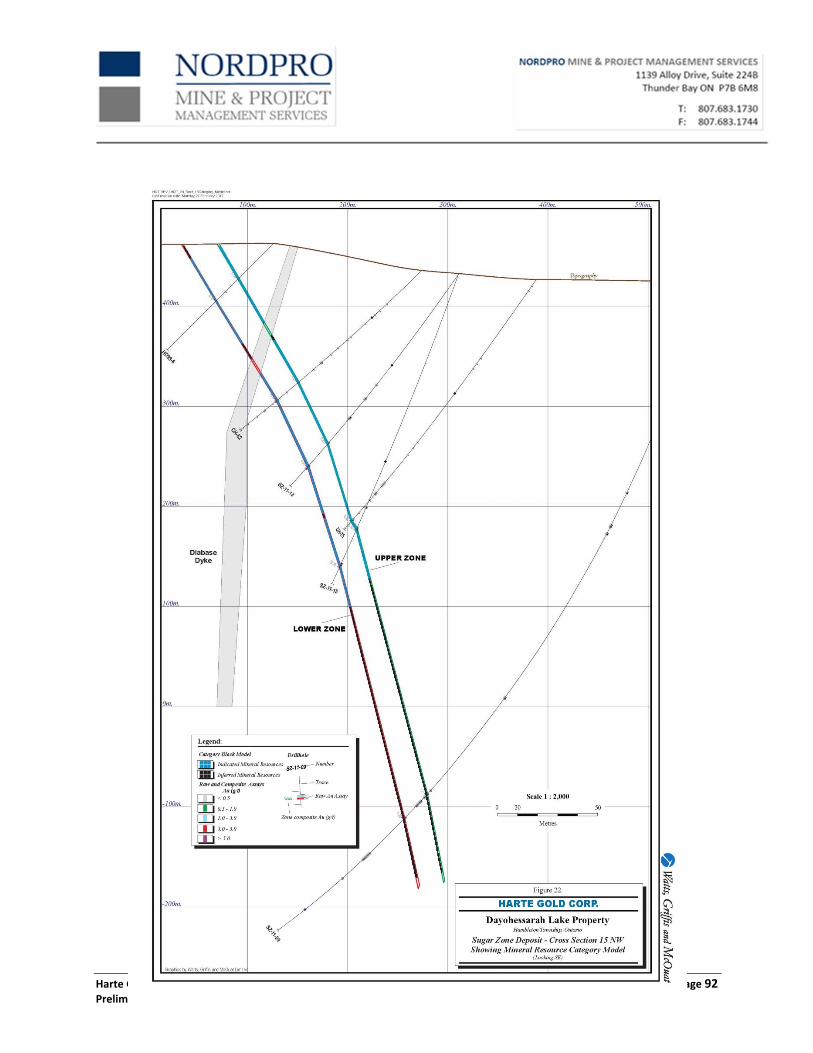
14.7.4 Mineral Resource Categorization 89
15.0 MINERAL RESERVE ESTIMATES 95
16.0 MINING METHODS 96
16.1 UNDERGROUND MINE DESIGN 96
16.2 GEOTECHNICAL 96
16.3 MINE ACCESS AND INFRASTRUCTURE 98
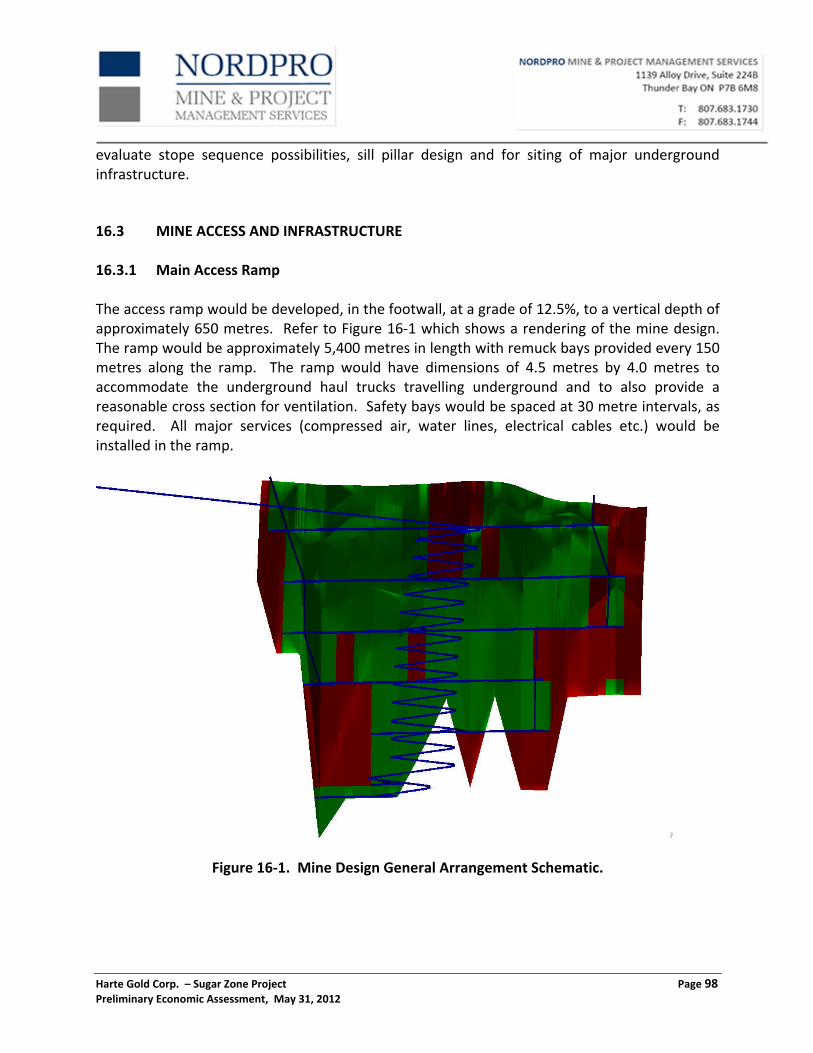
16.3.1 Main Access Ramp 98
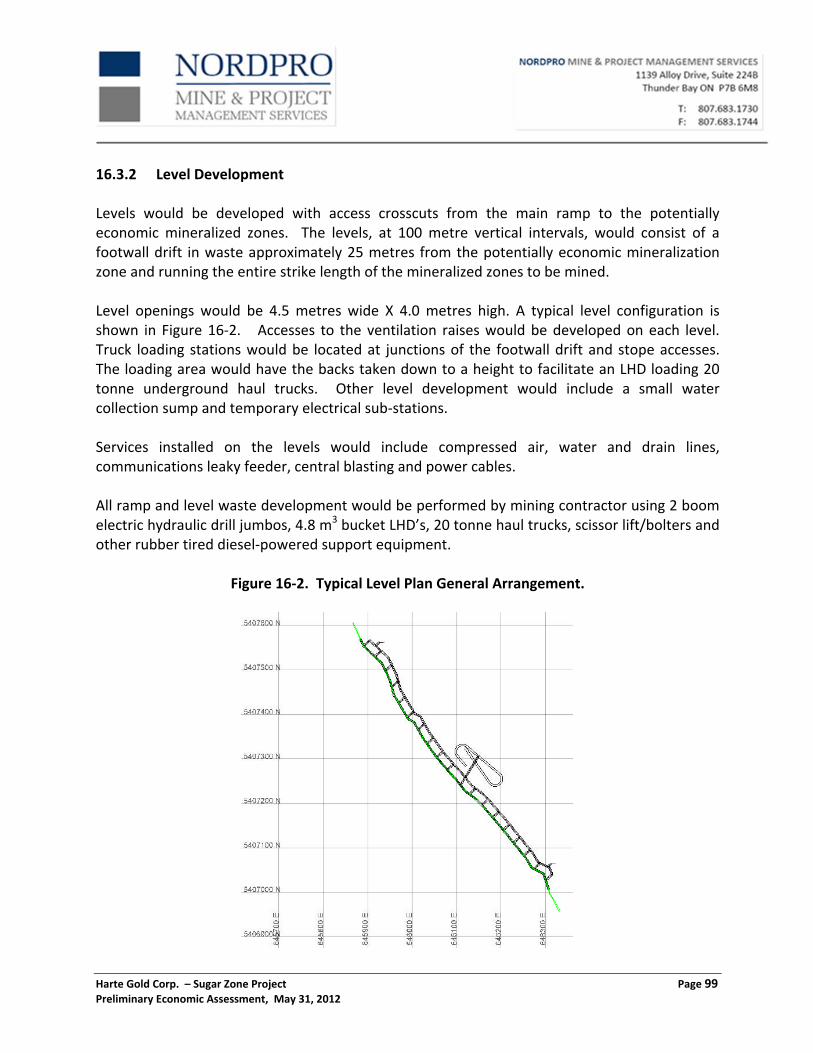
16.3.2 Level Development 99
16.3.3 Rock Handling 100
16.3.4 Manpower and Materials Handling 100
16.4 MINE SUPPORT FACILITIES 100
16.4.1 Mine Dewatering 100
16.4.2 Maintenance Shop 101
16.4.3 Fuel Stations 101
16.4.4 Refuge Station 101
16.4.5 Explosives Storage 101
16.4.6 Detonator Magazine 102
16.4.7 Materials Storage Areas 102
16.4.8 Washrooms 102
16.5 SERVICES 102
16.5.1 Electrical Distribution 102
16.5.2 Compressed Air 103
16.5.3 Service Water 103
16.5.4 Mine Communications and Control Systems 103
16.6 VENTILATION 103
16.7 MINING METHOD 104
16.7.1 Alimak Narrow Vein Mining 104
16.7.2 Shrinkage Mining 105
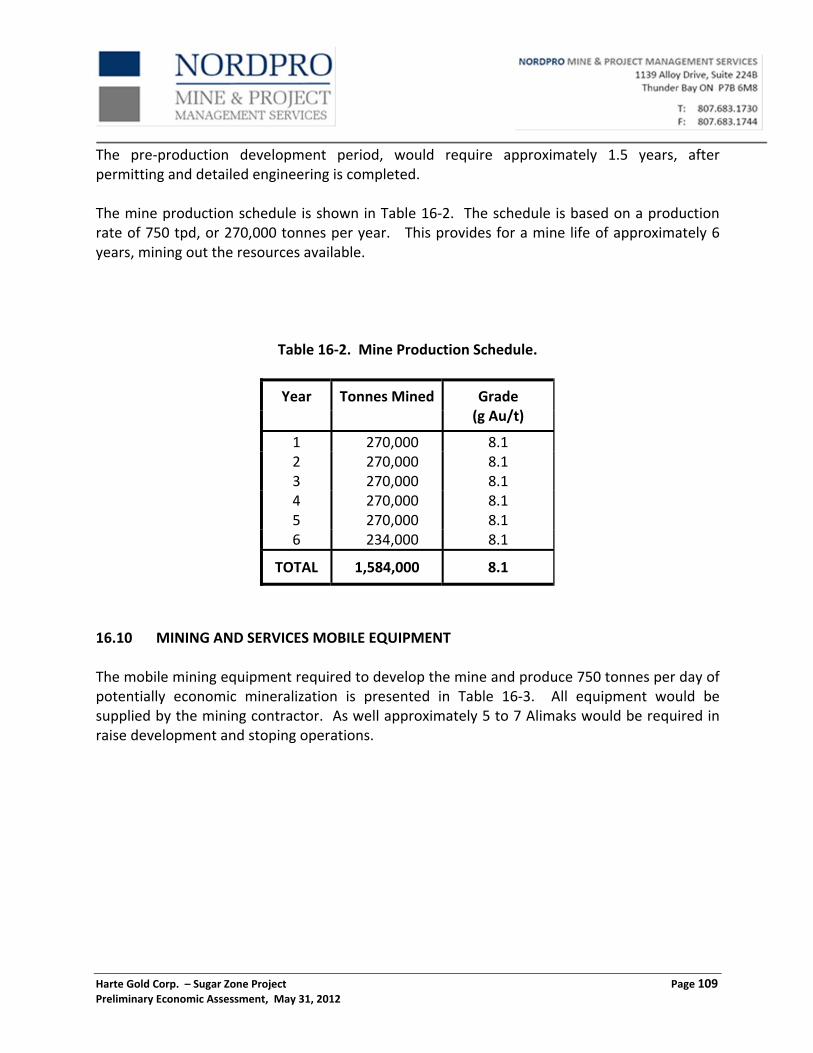
16.8 POTENTIALLY MINEABLE RESOURCE 106
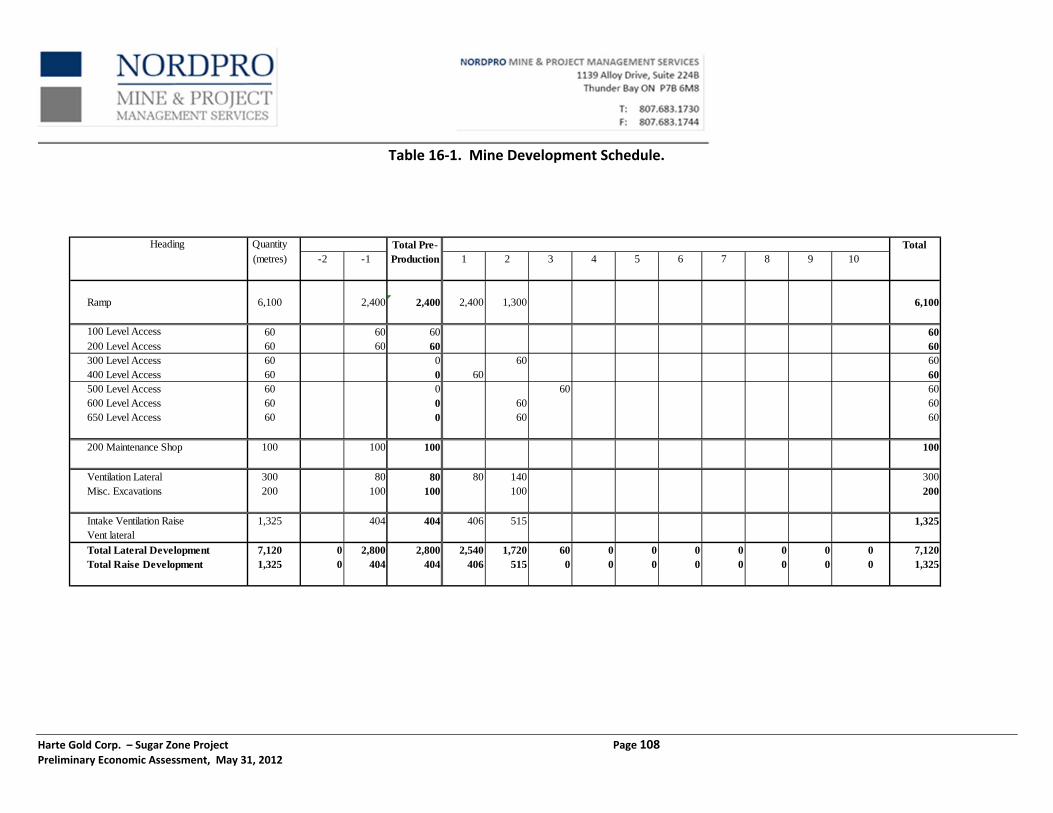
16.9 DEVELOPMENT AND PRODUCTION SCHEDULES 107
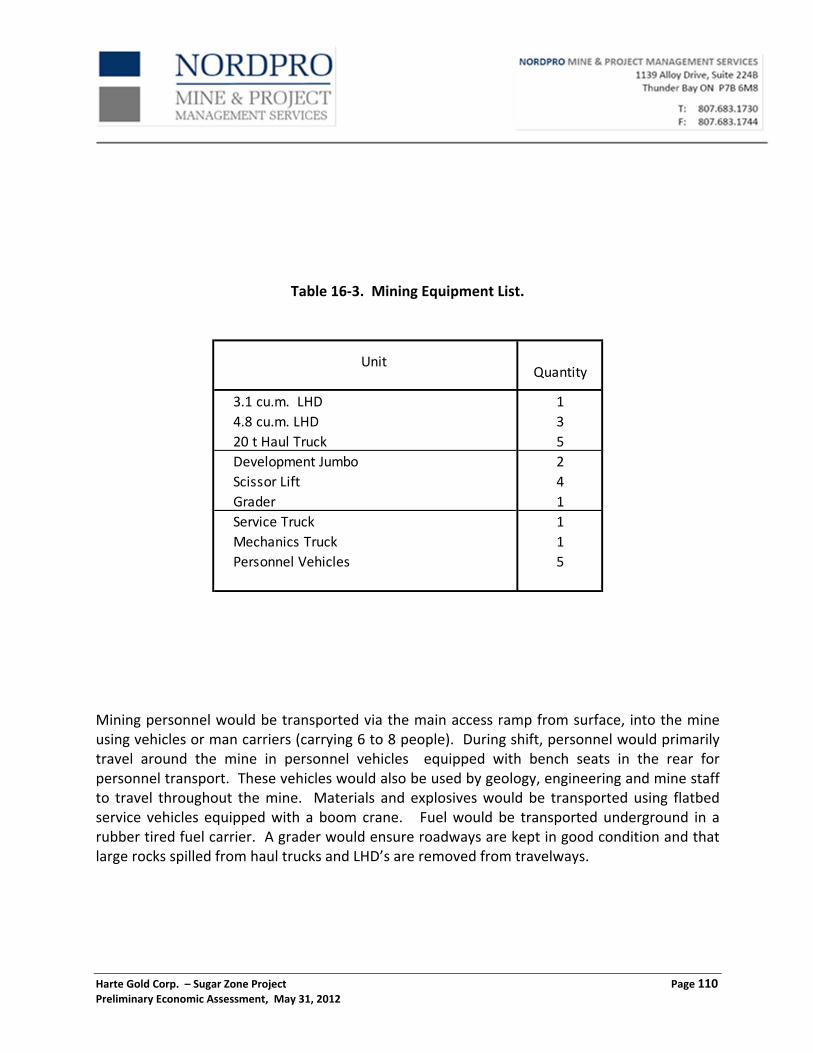
16.10 MINING AND SERVICES MOBILE EQUIPMENT 109
Harte Gold Corp. – Sugar Zone Project Page vi Preliminary Economic Assessment, May 31, 2012
16.11 MINE SURFACE SUPPORT FACILITIES 111
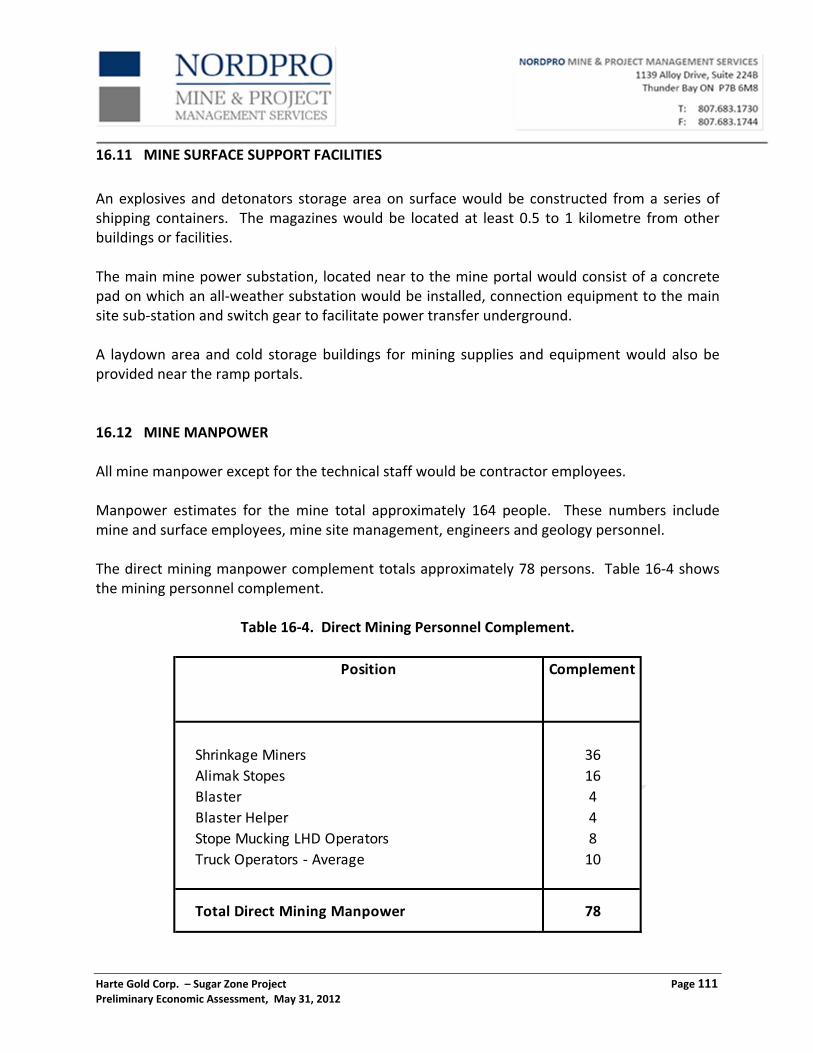
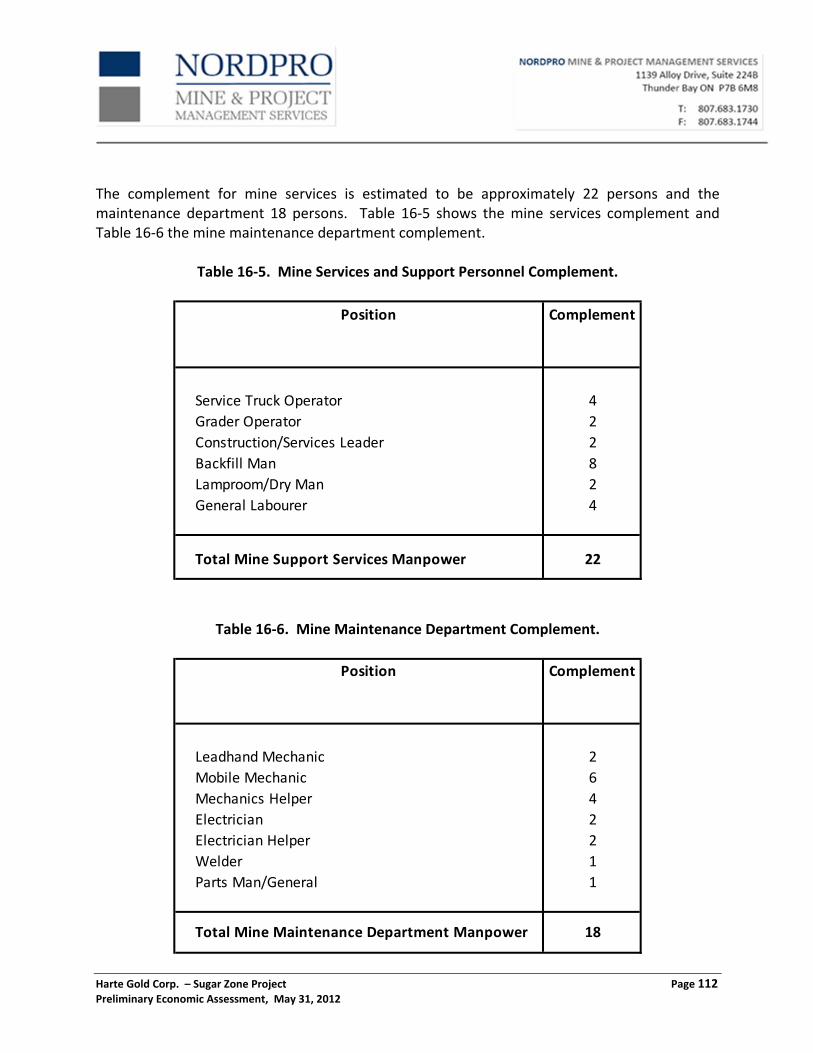
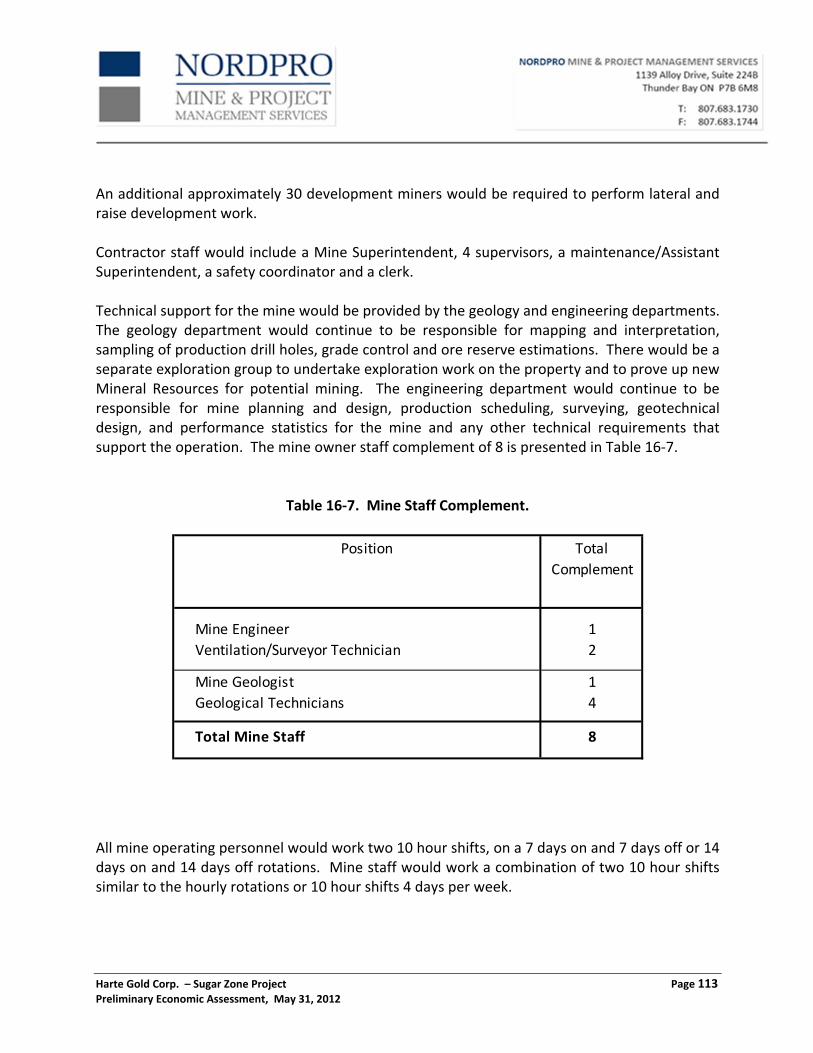
16.12 MINE MANPOWER 111
17.0 RECOVERY METHODS 114
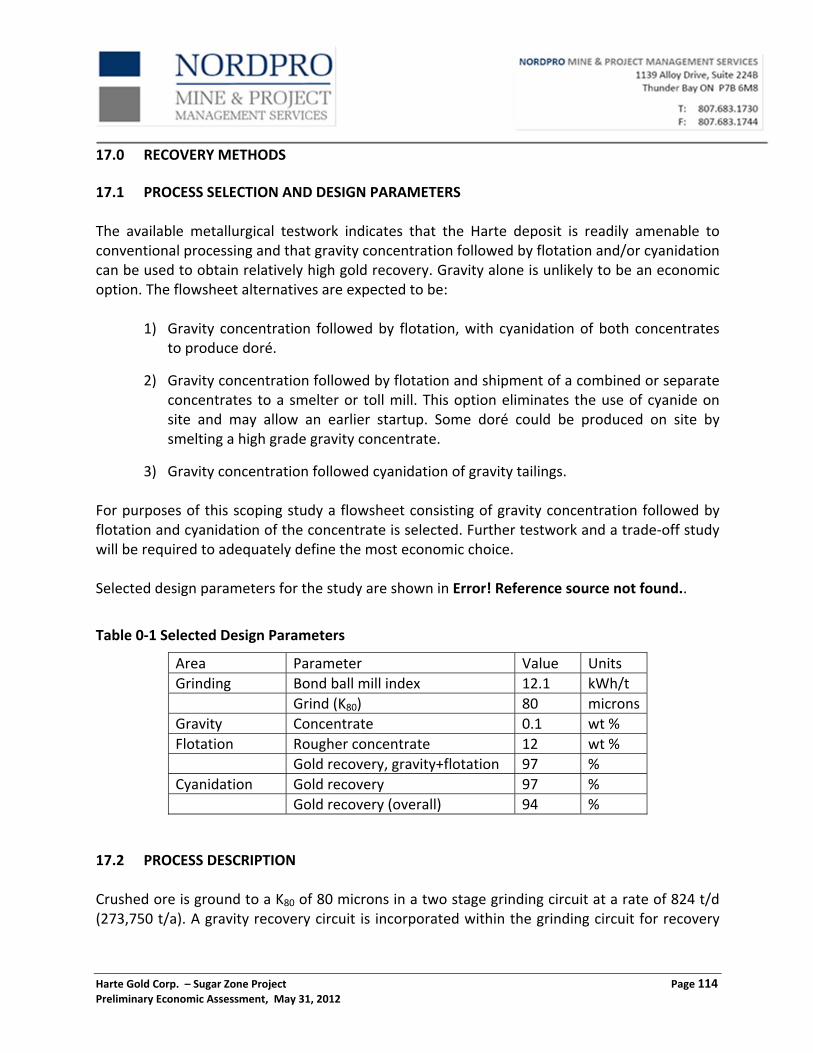
17.1 PROCESS SELECTION AND DESIGN PARAMETERS 114
17.2 PROCESS DESCRIPTION 114
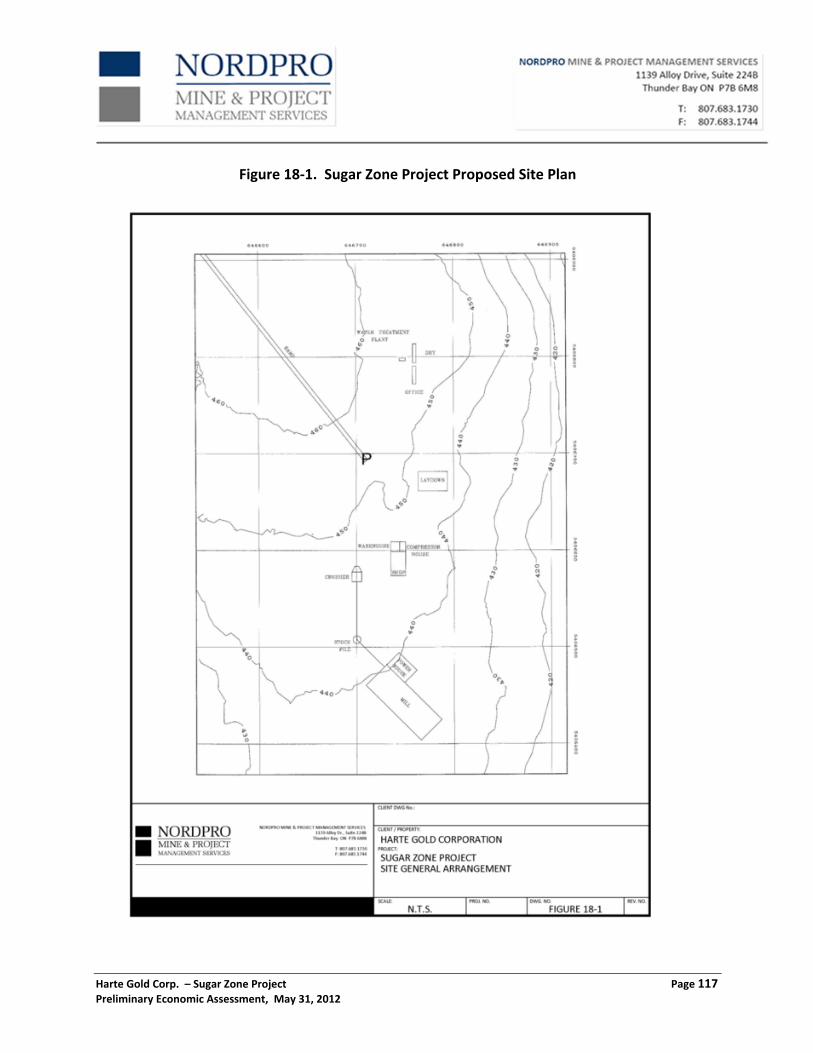
18.0 PROJECT INFRASTRUCTURE 116
18.1 MINE ROAD ACCESS 116
18.2 POWERLINE TO SITE 116
18.3 WATER SUPPLY 118
18.3.1 Plant and Process Water 118
18.3.2 Fire Water 118
18.3.3 Potable Water 118
18.4 WATER TREATMENT PLANT 119
18.5 MULTI‐USE COMPLEX 119
18.6 REFUSE AND WASTE DISPOSAL 119
18.7 TELECOMMUNICATIONS AND COMPUTER NETWORKING 120
18.7.1 Computer LAN’s and Networking 120
18.8 PROJECT MANAGEMENT 120
18.9 GENERAL & ADMINISTRATIVE 120
18.9.1 Administration 121
18.9.2 Procurement 121
18.9.3 Human Resources 121
18.9.4 Security 122
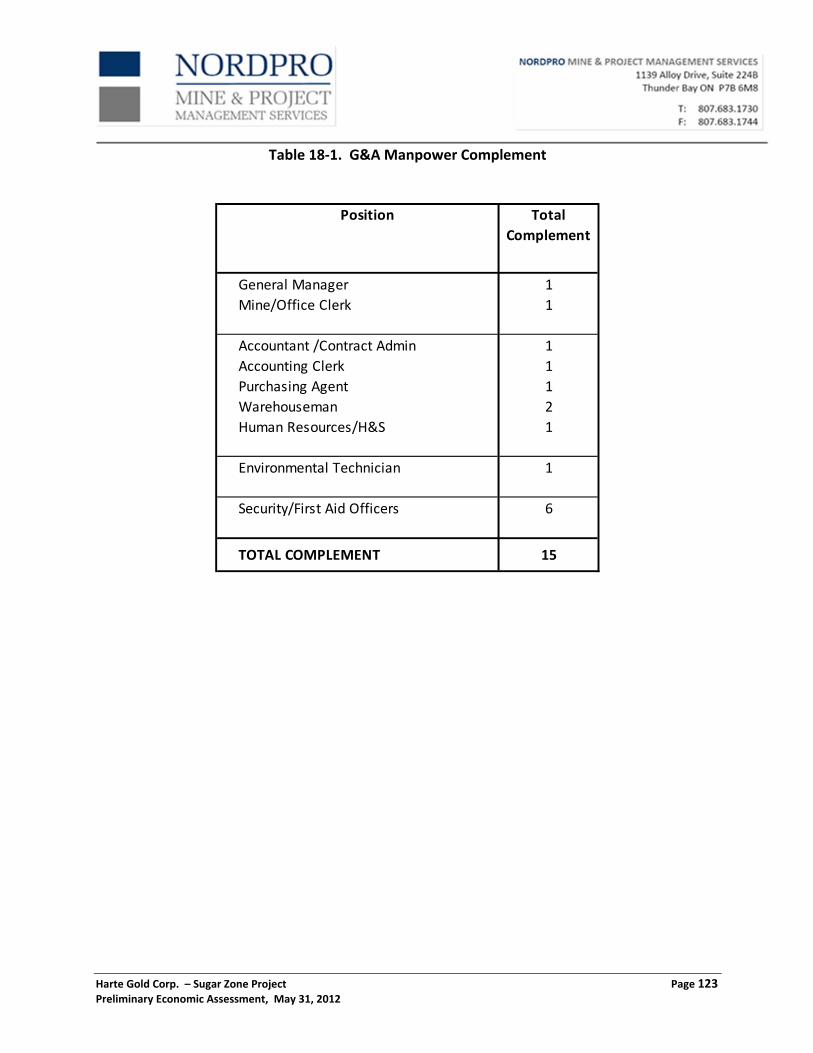
18.9.5 Manpower 122
19.0 MARKET STUDIES AND CONTRACTS 124
20.0 ENVIRONMENTAL STUDY, PERMITTING AND SOCIAL OR COMMUNITY IMPACT 125
21.0 CAPITAL EXPENDITURES AND OPERATING COSTS 126
21.1 CAPITAL EXPENDITURES ESTIMATES 126
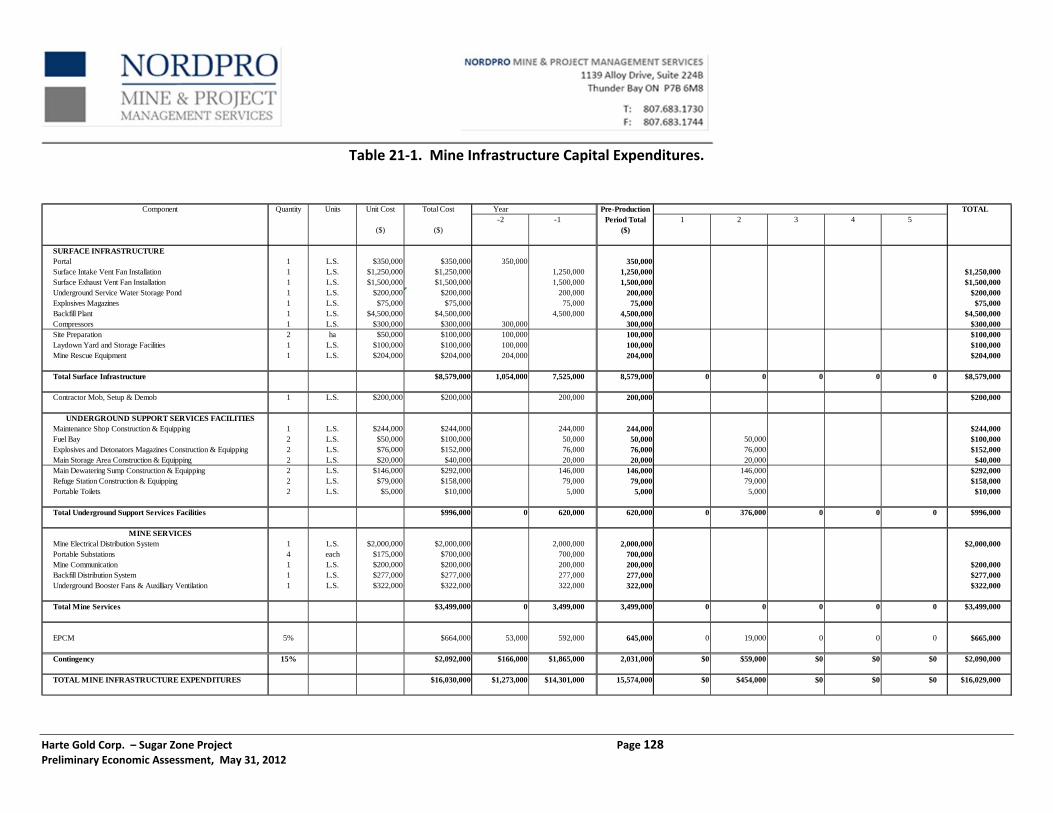
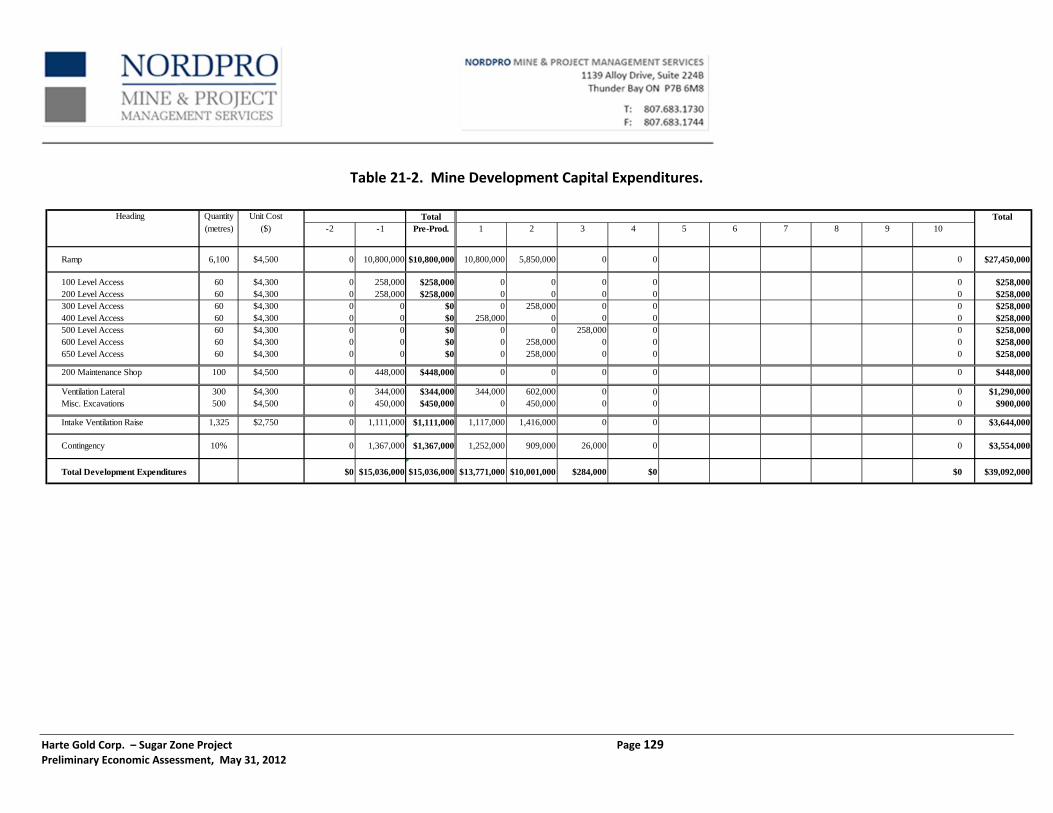
21.1.1 Mining 126
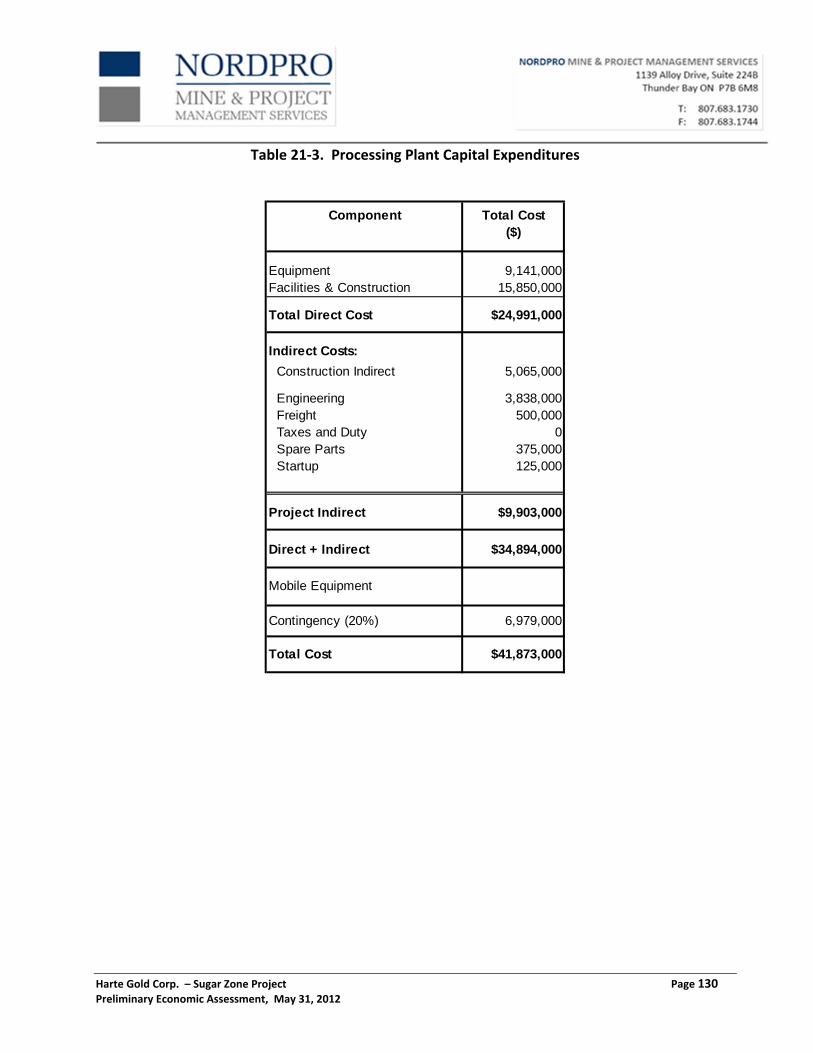
21.1.2 Processing Plant & Tailings Management 126
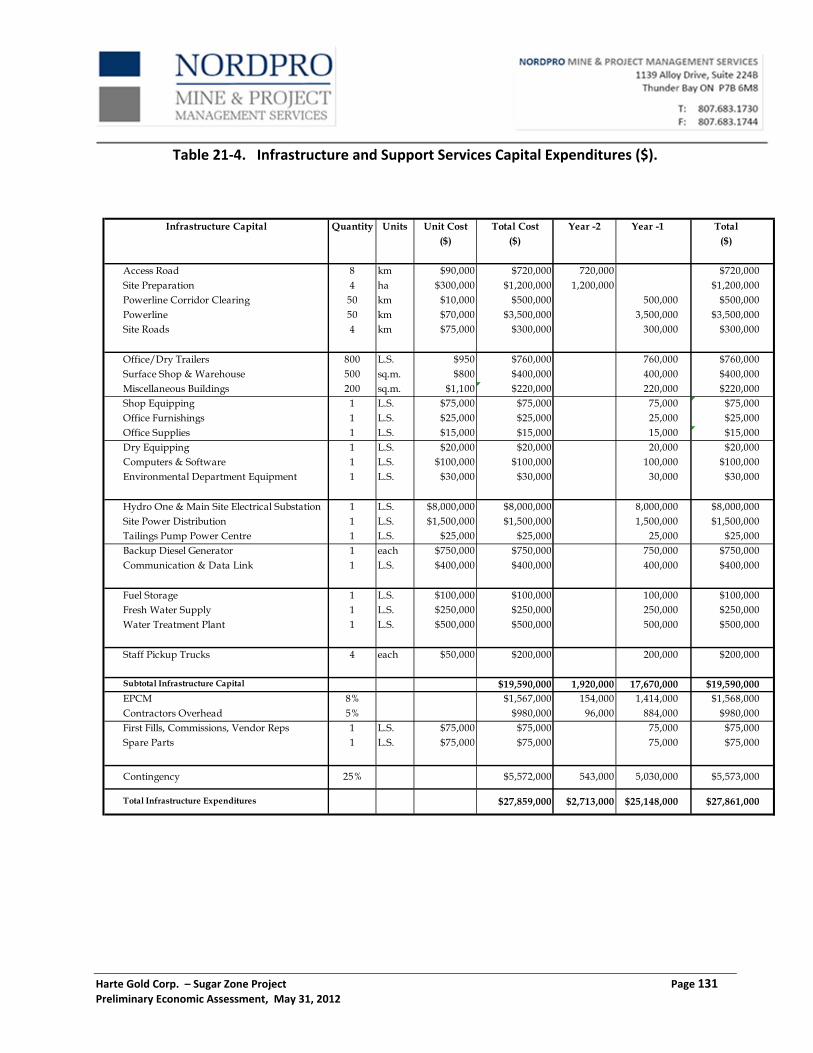
21.1.3 Infrastructure and Support Facilities 127
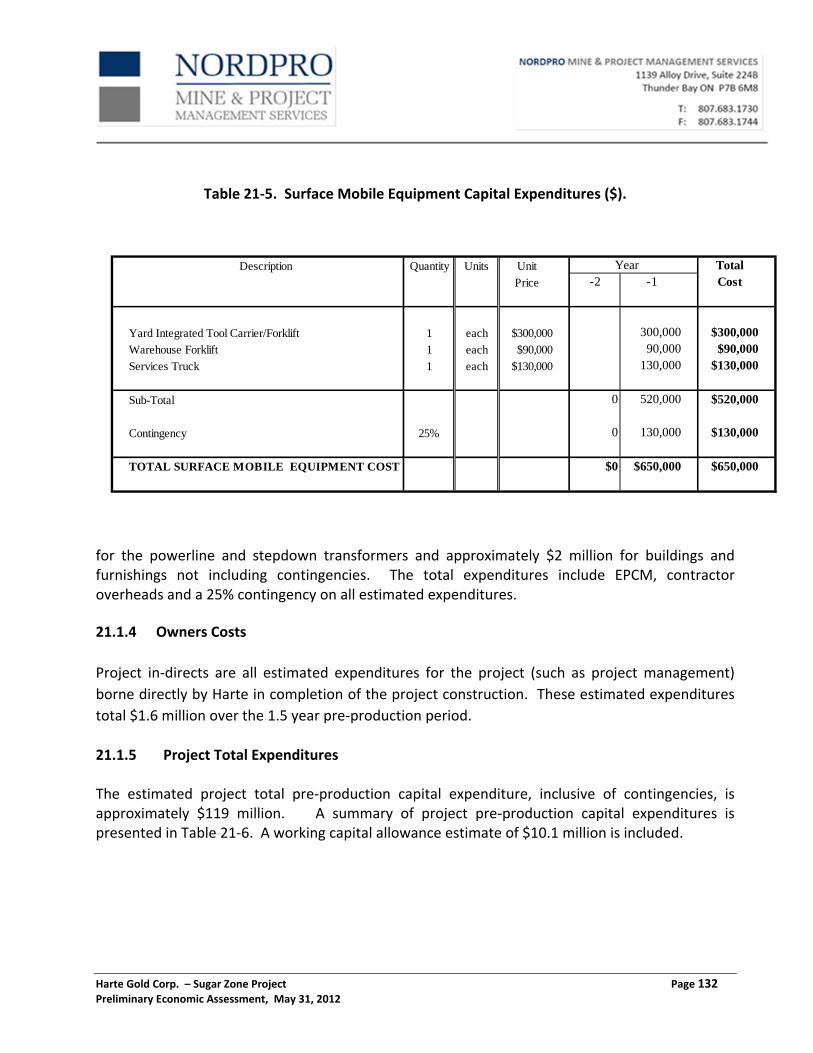
21.1.4 Owners Costs 132
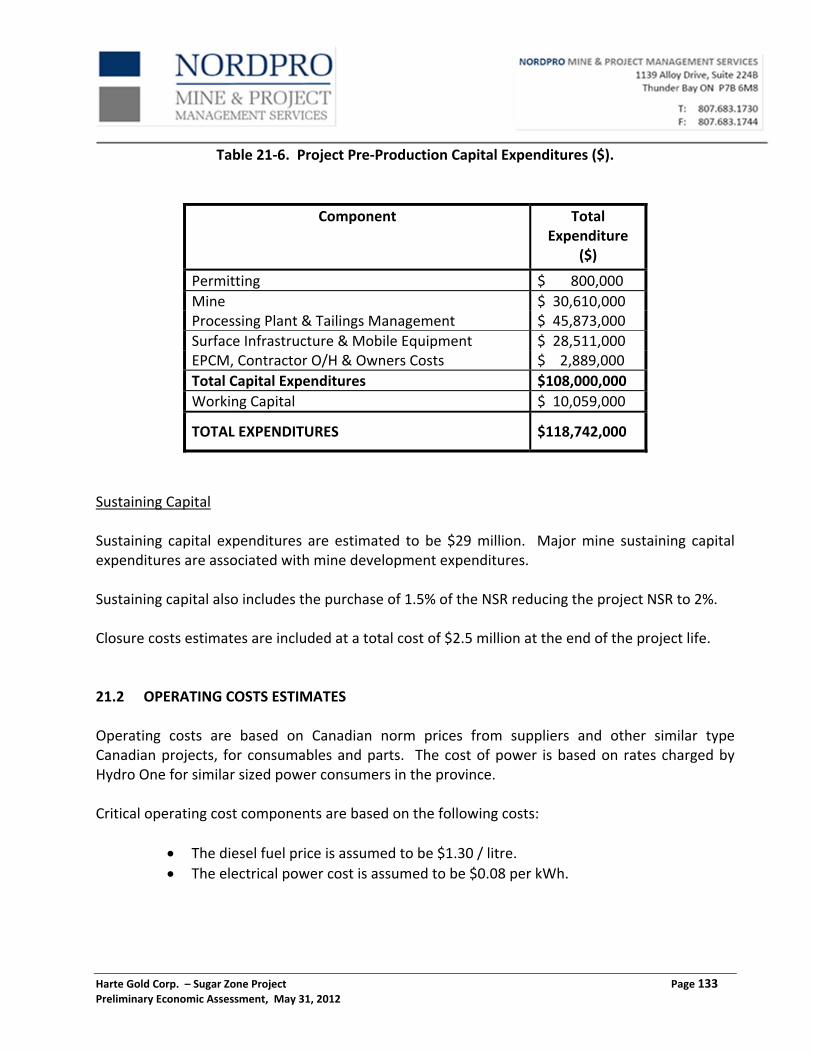
21.1.5 Project Total Expenditures 132
Harte Gold Corp. – Sugar Zone Project Page vii Preliminary Economic Assessment, May 31, 2012
21.2 OPERATING COSTS ESTIMATES 133
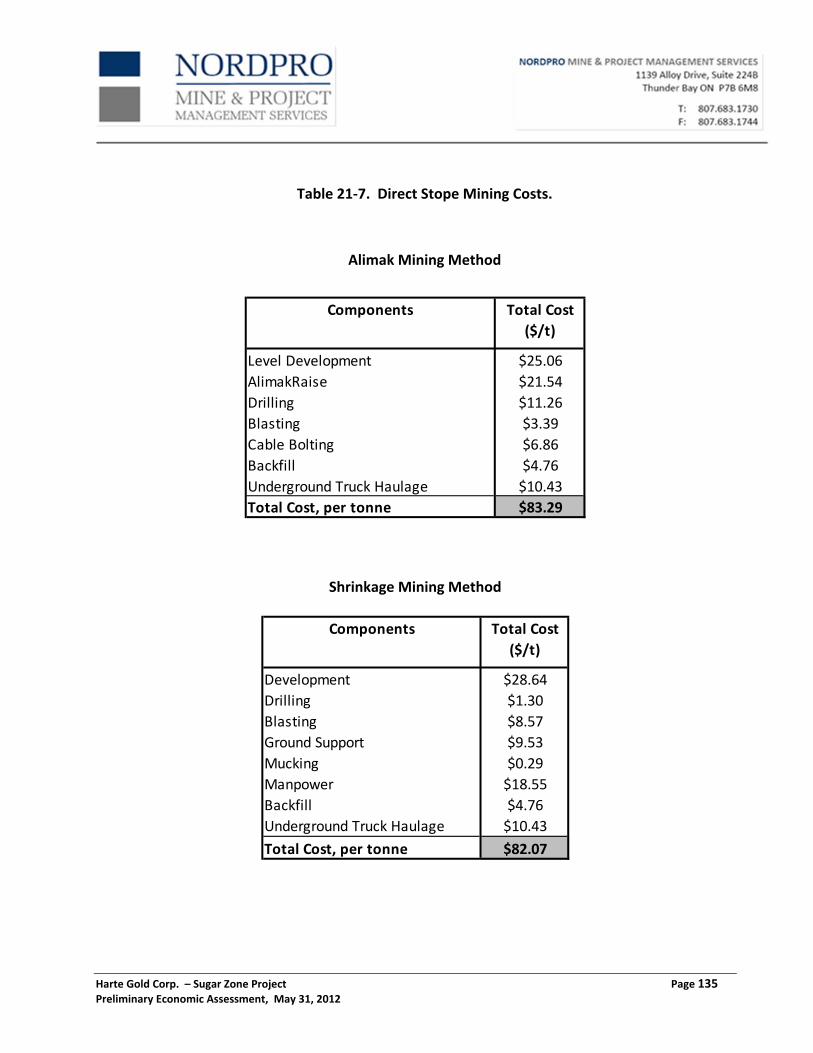
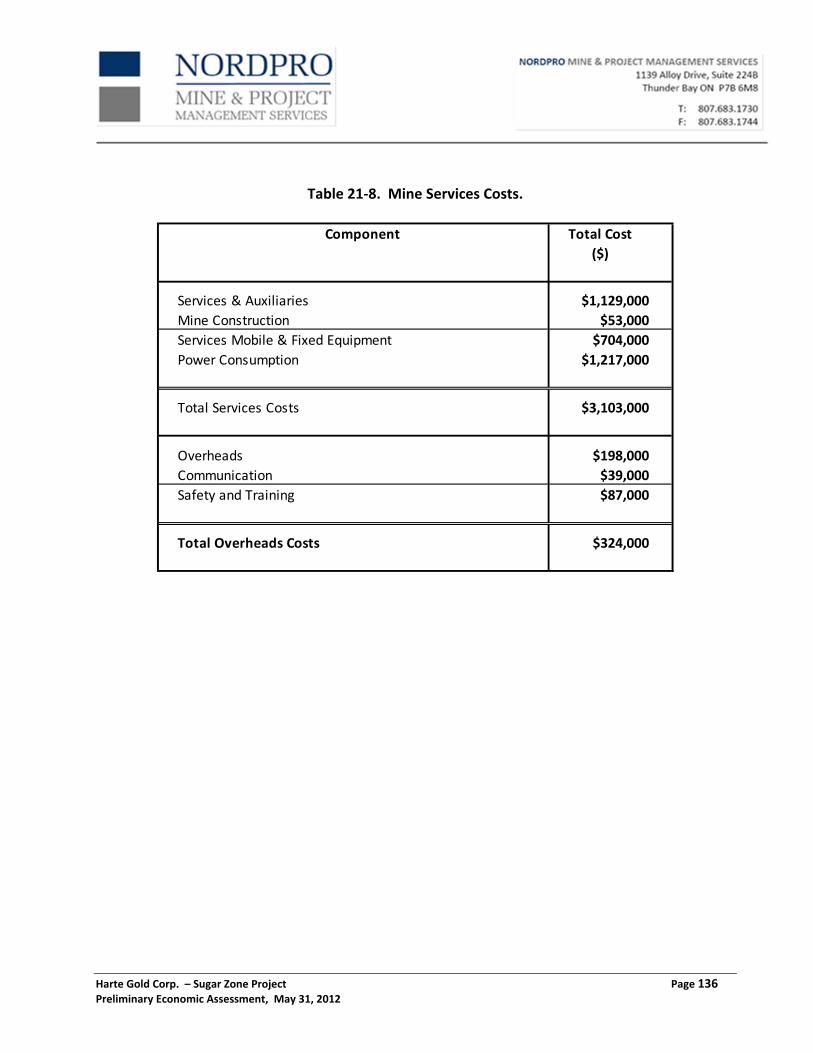
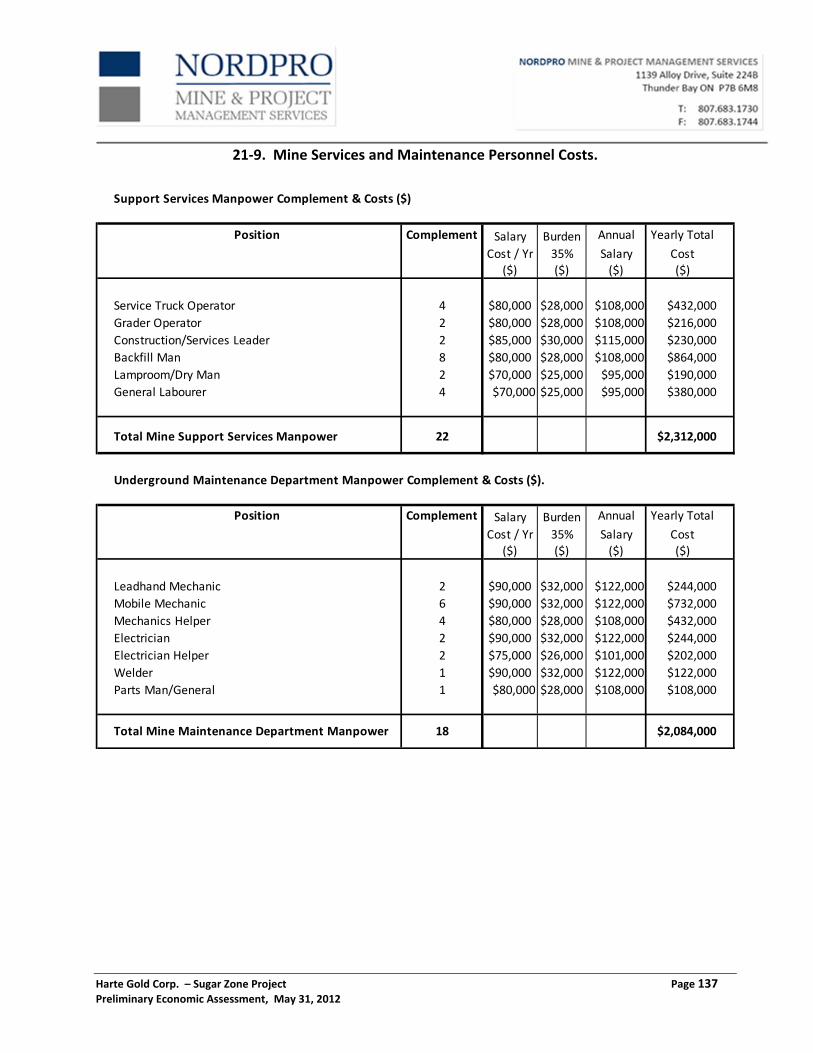
21.2.1 Mining 134
21.2.2 Processing and Tailings Management 134
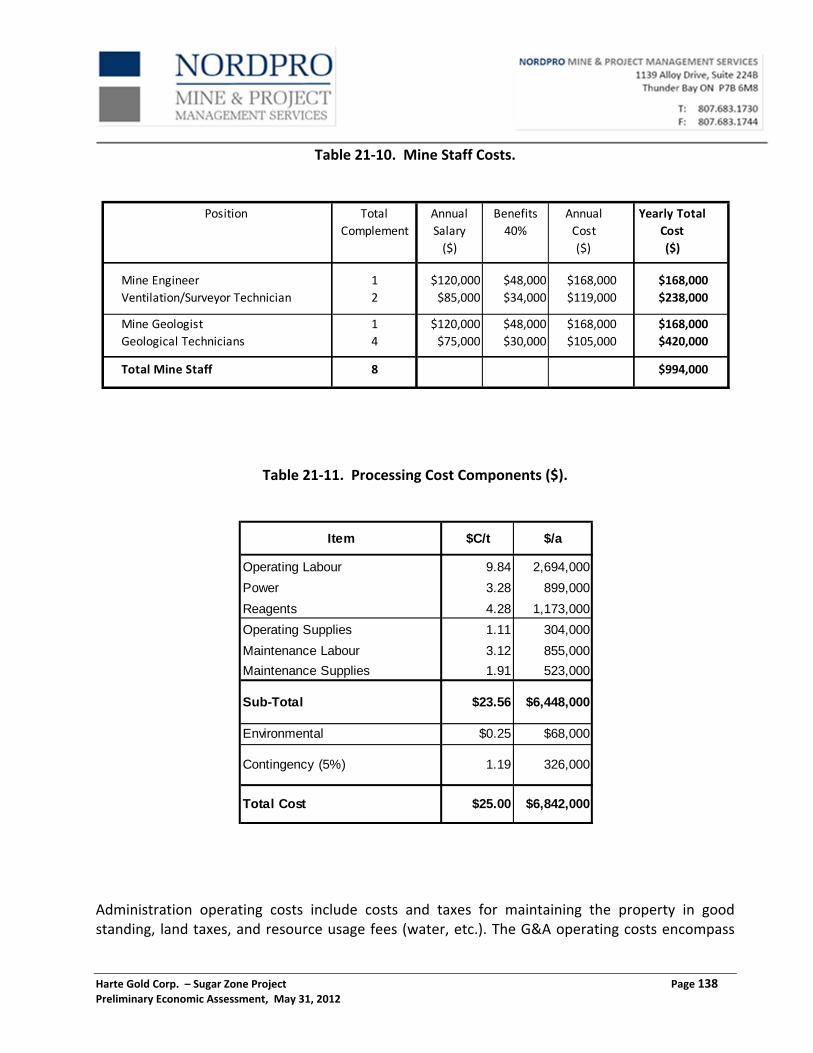
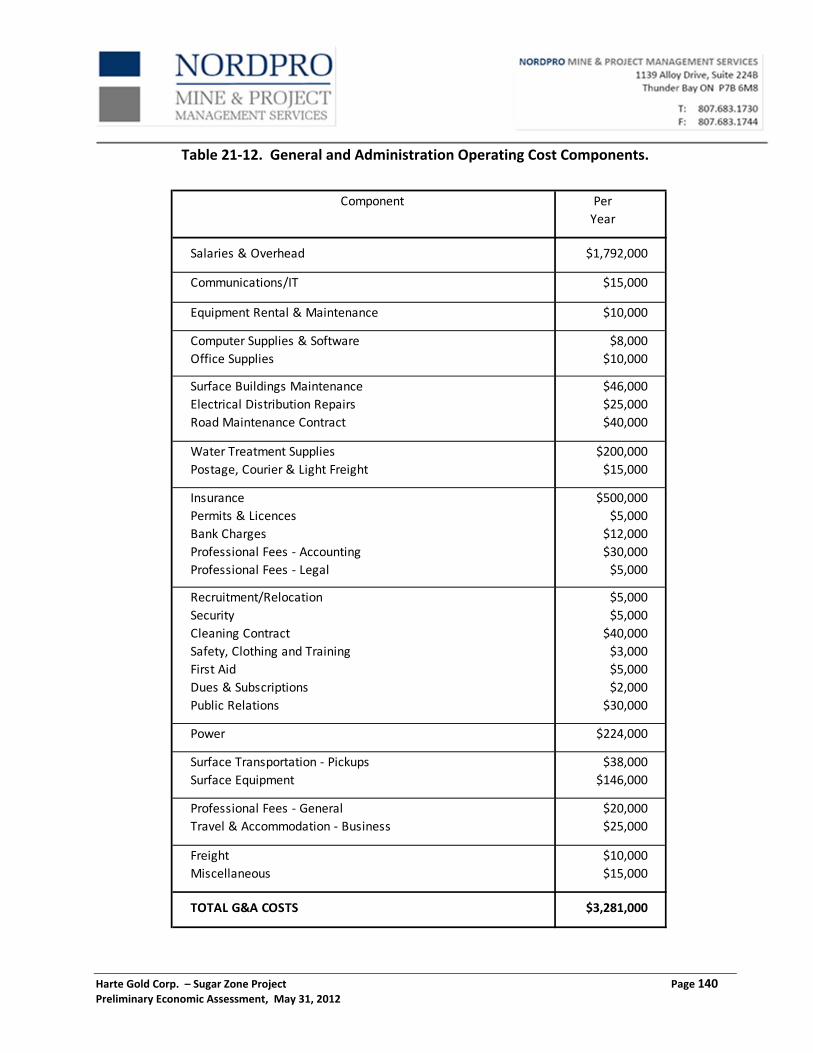
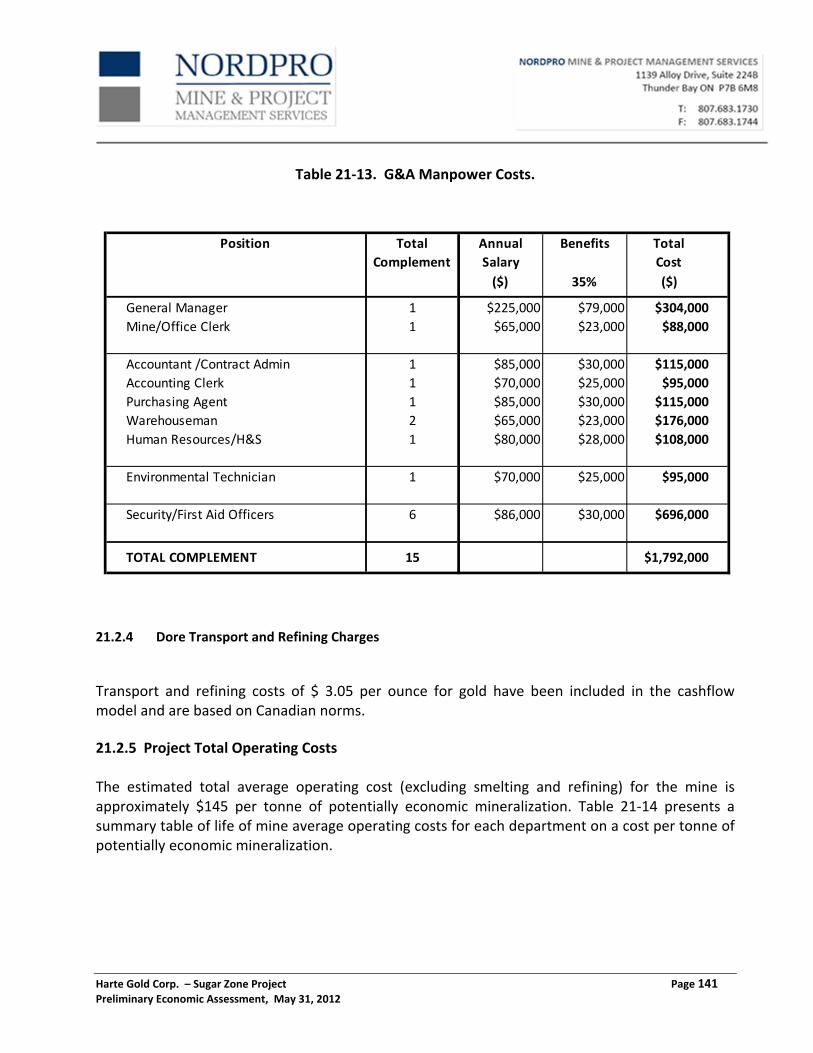
21.2.3 General & Administration Operating Costs 134
21.2.4 Dore Transport and Refining Charges 141
21.2.5 Project Total Operating Costs 141
22.0 ECONOMIC ANALYSIS 143
22.1 FINANCIAL RETURNS 144
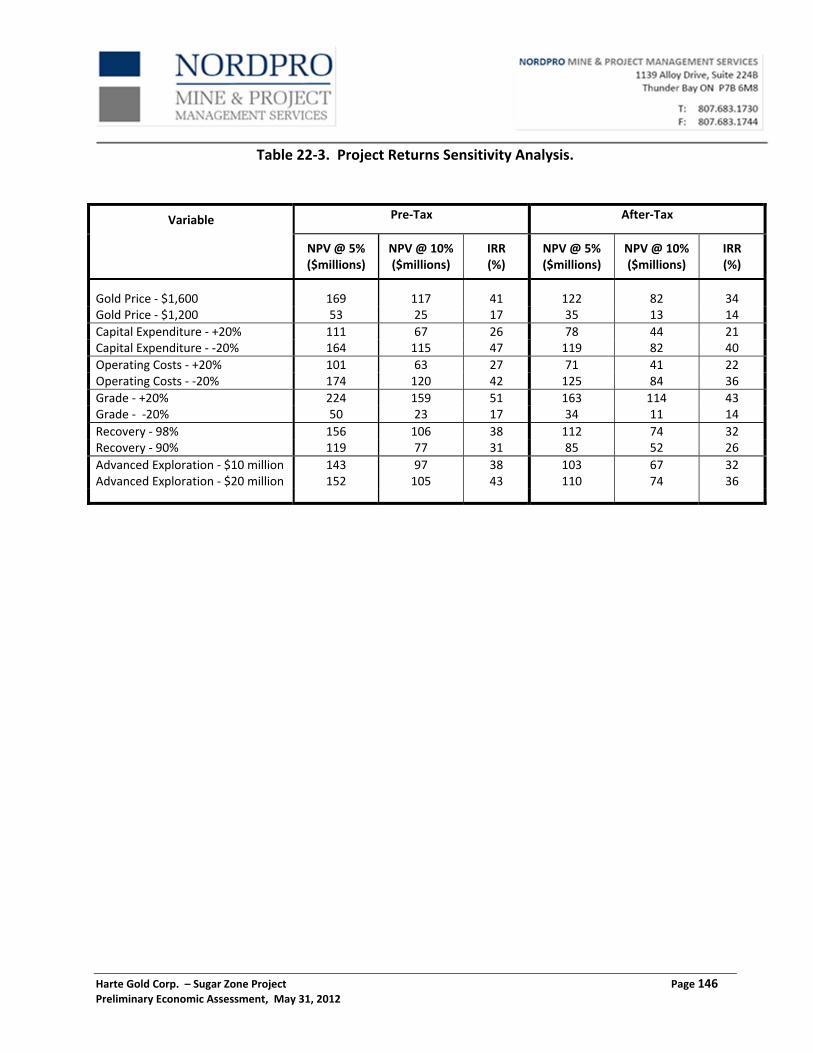
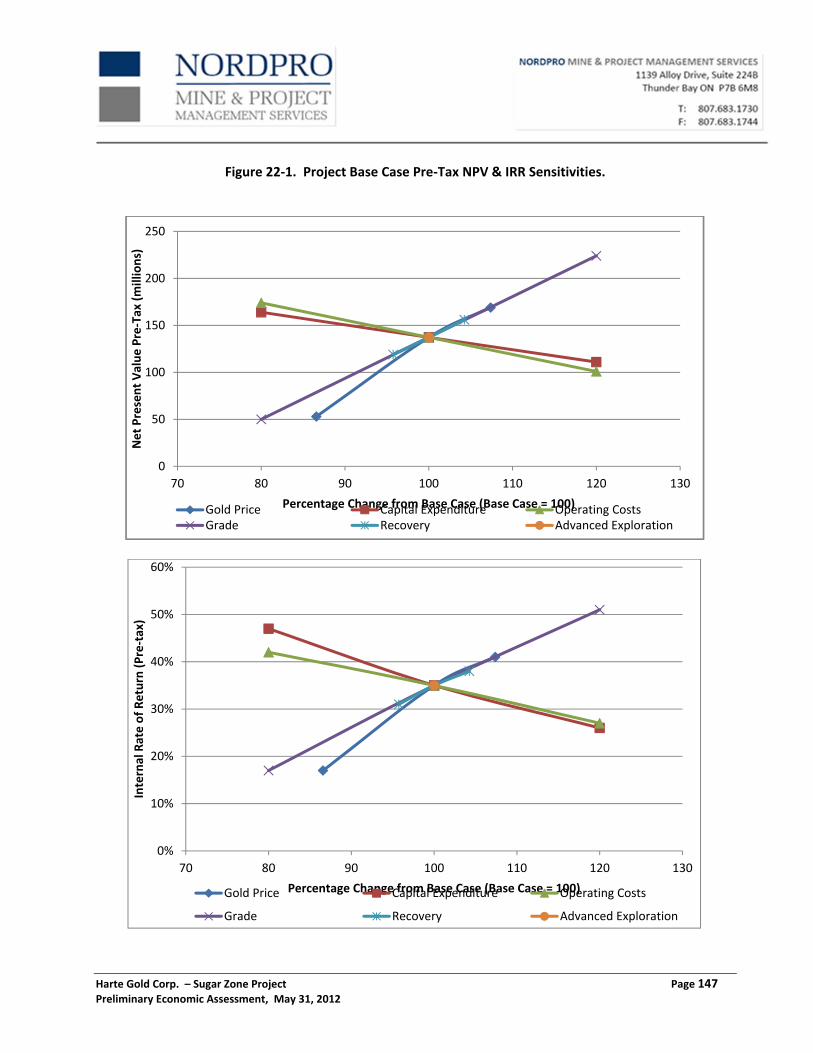
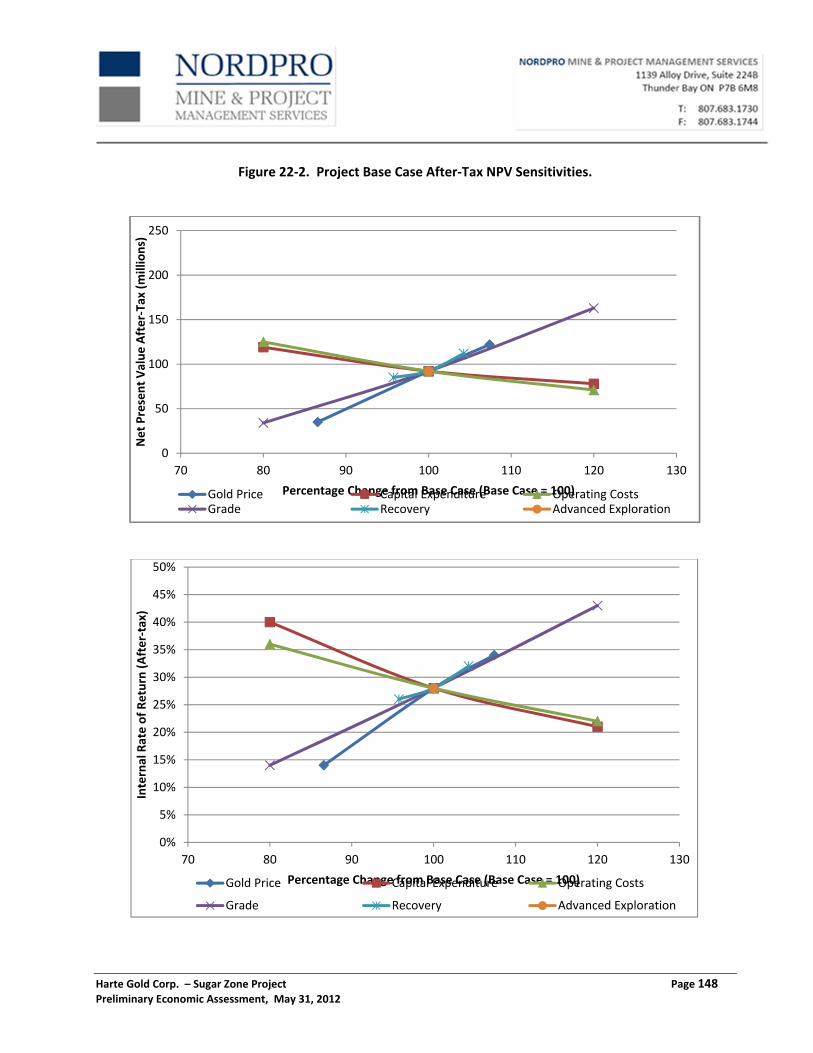
22.1.1 Sensitivity Analysis 145
23.0 ADJACENT PROPERTIES 149
24.0 OTHER RELEVANT DATA AND INFORMATION 150
25.0 INTERPRETATION AND CONCLUSIONS 151
25.1 RISK ASSESSMENT 152
26.0 RECOMMENDATIONS 154
27.0 REFERENCES 155
28.0 SIGNATURES AND CERTIFICATES 156
Harte Gold Corp. – Sugar Zone Project Page 1 Preliminary Economic Assessment, May 31, 2012
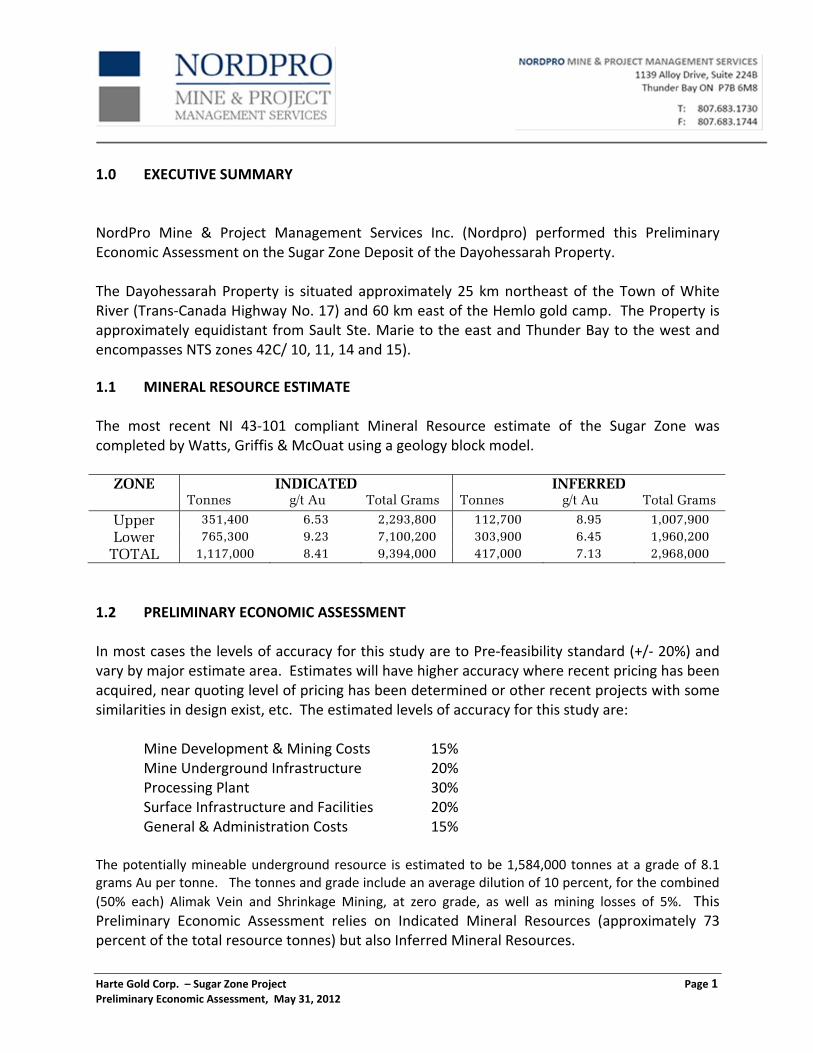
1.0 EXECUTIVE SUMMARY NordPro Mine & Project Management Services Inc. (Nordpro) performed this Preliminary Economic Assessment on the Sugar Zone Deposit of the Dayohessarah Property. The Dayohessarah Property is situated approximately 25 km northeast of the Town of White River (Trans‐Canada Highway No. 17) and 60 km east of the Hemlo gold camp. The Property is approximately equidistant from Sault Ste. Marie to the east and Thunder Bay to the west and encompasses NTS zones 42C/ 10, 11, 14 and 15).
1.1 MINERAL RESOURCE ESTIMATE The most recent NI 43‐101 compliant Mineral Resource estimate of the Sugar Zone was completed by Watts, Griffis & McOuat using a geology block model.
TOTAL 1,117,000 8.41 9,394,000 417,000 7.13 2,968,000
1.2 PRELIMINARY ECONOMIC ASSESSMENT In most cases the levels of accuracy for this study are to Pre‐feasibility standard (+/‐ 20%) and vary by major estimate area. Estimates will have higher accuracy where recent pricing has been acquired, near quoting level of pricing has been determined or other recent projects with some similarities in design exist, etc. The estimated levels of accuracy for this study are:
Mine Development & Mining Costs 15% Mine Underground Infrastructure 20% Processing Plant 30% Surface Infrastructure and Facilities 20%
General & Administration Costs 15% The potentially mineable underground resource is estimated to be 1,584,000 tonnes at a grade of 8.1 grams Au per tonne. The tonnes and grade include an average dilution of 10 percent, for the combined
(50% each) Alimak Vein and Shrinkage Mining, at zero grade, as well as mining losses of 5%. This Preliminary Economic Assessment relies on Indicated Mineral Resources (approximately 73 percent of the total resource tonnes) but also Inferred Mineral Resources.
Harte Gold Corp. – Sugar Zone Project Page 2 Preliminary Economic Assessment, May 31, 2012
It should be noted that the Inferred Mineral Resources are considered too speculative geologically to have economic considerations applied to them that would enable them to be categorized as Mineral Reserves. For the PEA the metallurgical recovery is based on early stage test work. Also the cost projections range in accuracy from PEA to Feasibility level. Therefore, there is no guarantee that the economic projections contained in this Preliminary Economic Assessment would be realized. Mill recovery rates are estimated to be 96% resulting in recoverable gold of 387,800 ounces based on currently defined resources. The project is located close to a number of towns which could support and provide services to the mine workforce. Project infrastructure required includes:
● Upgrade Access Road ● Powerline ● Electrical Substations and Distribution ● Site Roads ● Haul Roads ● Maintenance Shop/Offices/Dry/Warehouse Complex ● Water Supply System and Water Treatment Plant ● Landfill Site ● Sewage Disposal Site
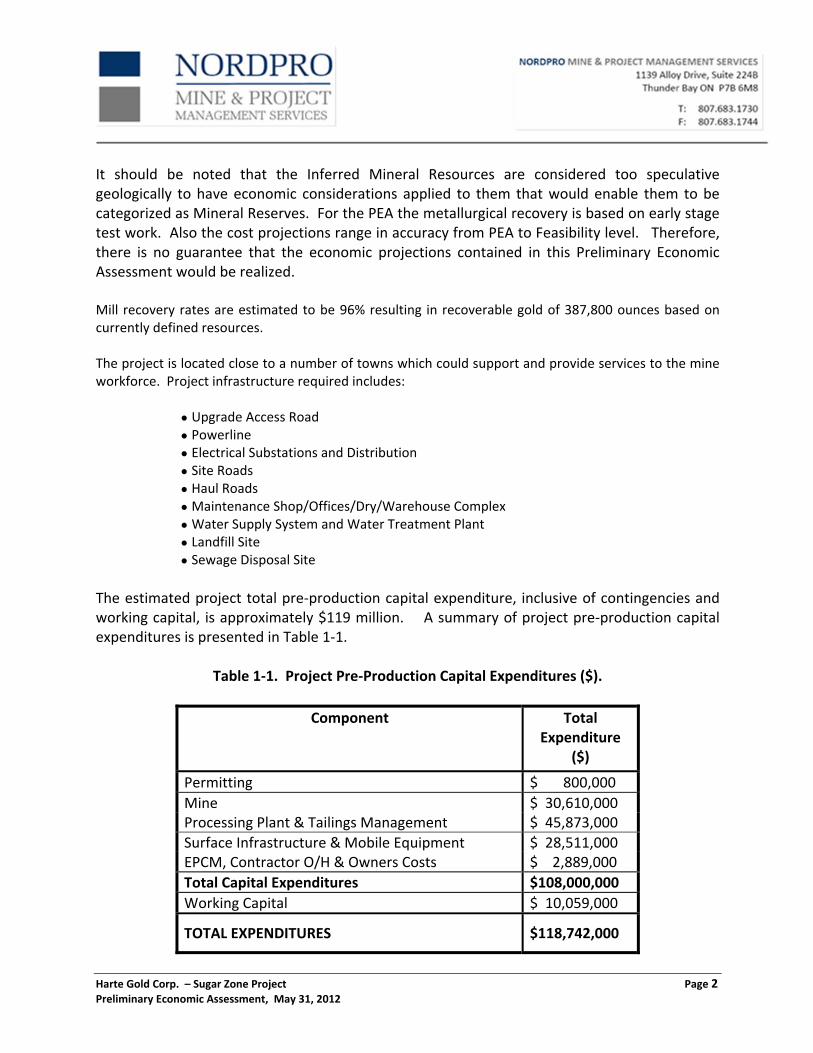
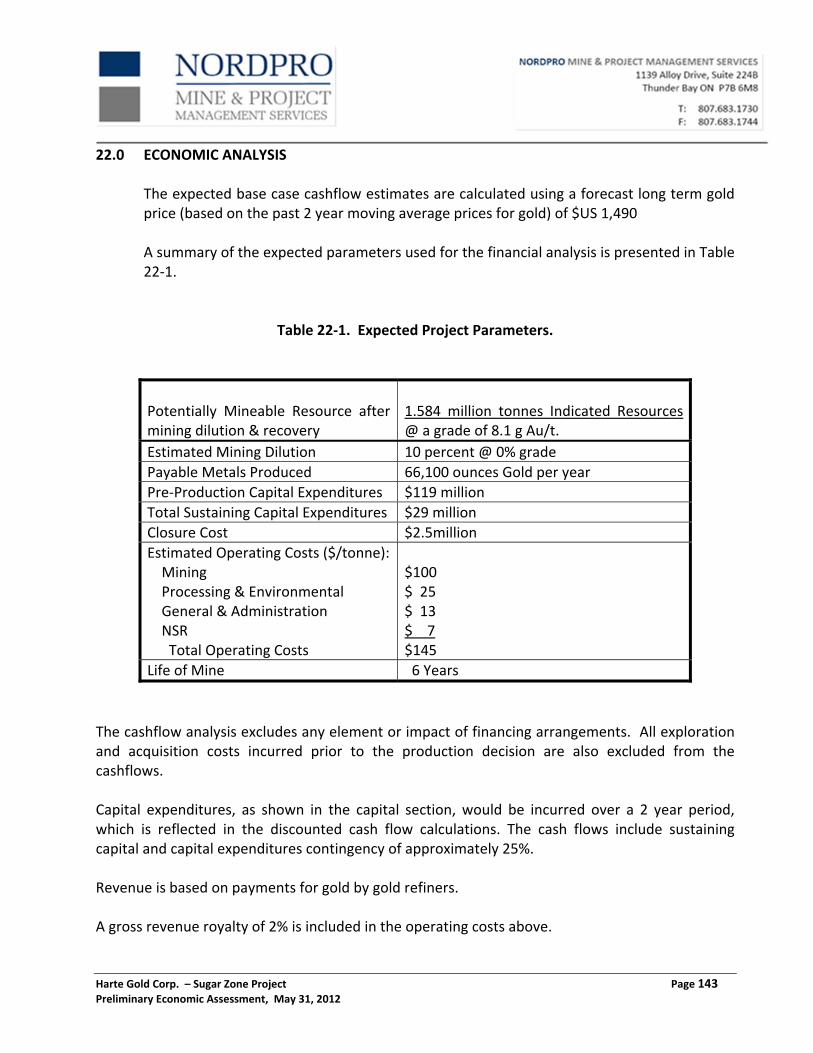
The estimated project total pre‐production capital expenditure, inclusive of contingencies and working capital, is approximately $119 million. A summary of project pre‐production capital expenditures is presented in Table 1‐1.
Table 1‐1. Project Pre‐Production Capital Expenditures ($).
Harte Gold Corp. – Sugar Zone Project Page 3 Preliminary Economic Assessment, May 31, 2012
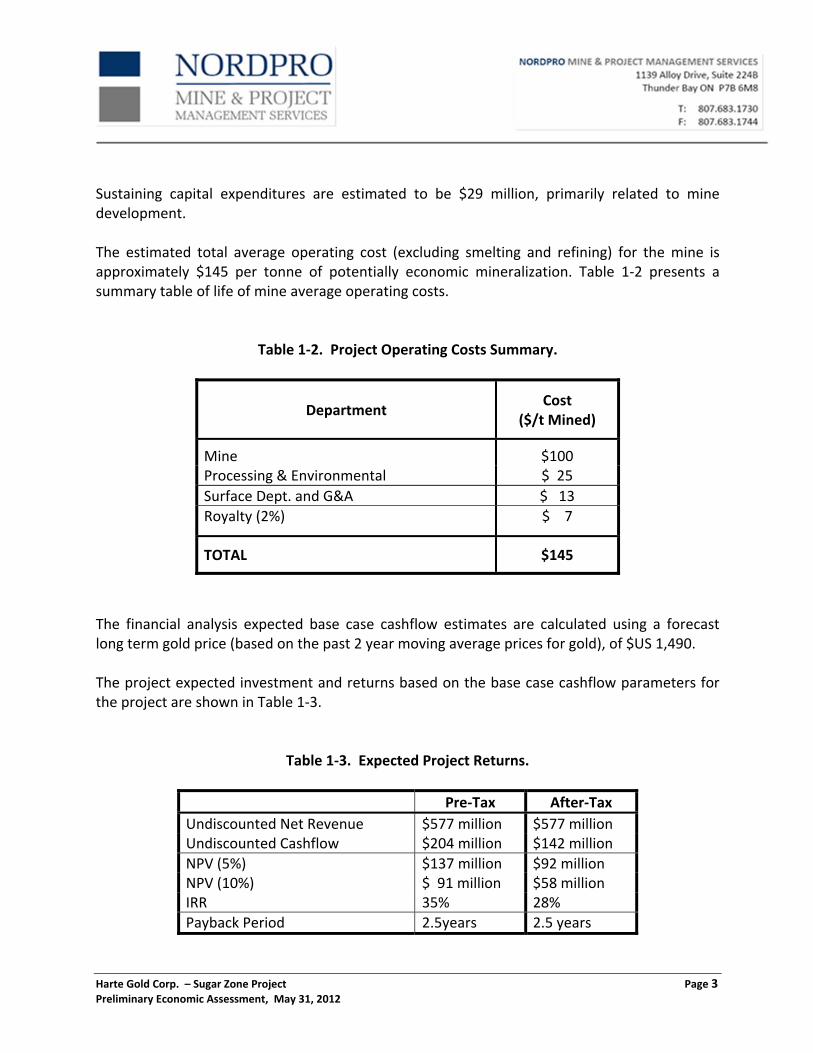
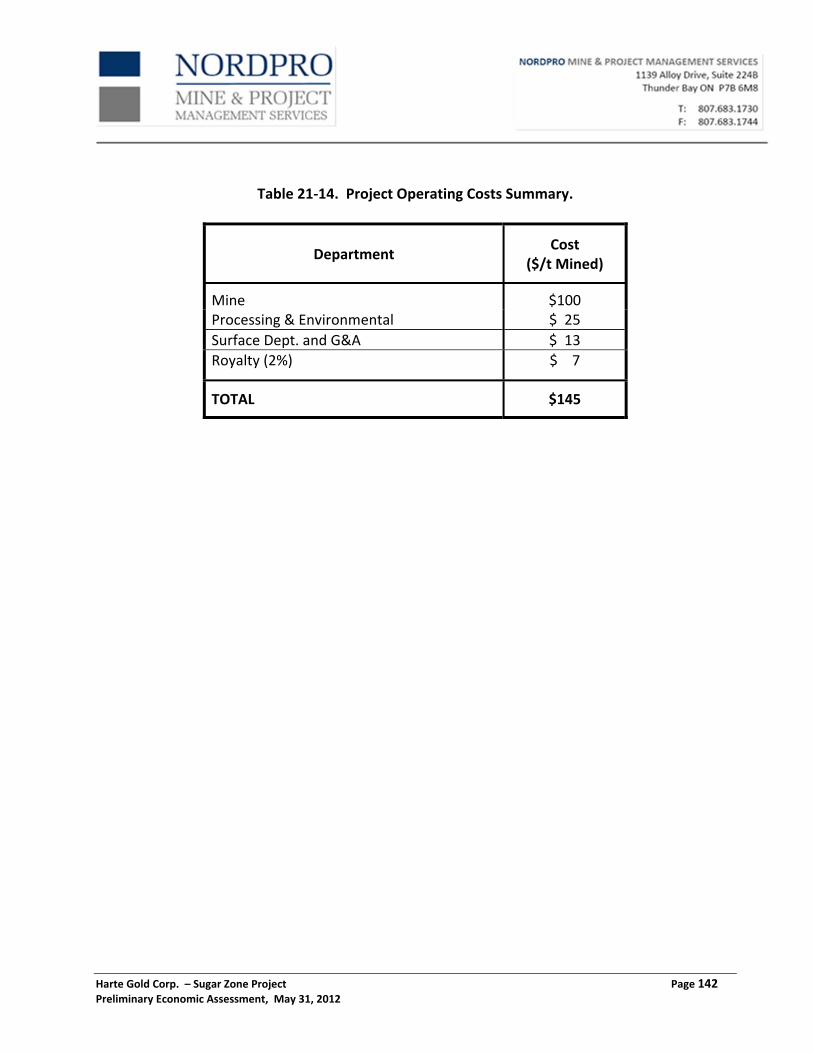
Sustaining capital expenditures are estimated to be $29 million, primarily related to mine development. The estimated total average operating cost (excluding smelting and refining) for the mine is approximately $145 per tonne of potentially economic mineralization. Table 1‐2 presents a summary table of life of mine average operating costs.
Table 1‐2. Project Operating Costs Summary.
Department Cost
($/t Mined)
Mine $100 Processing & Environmental $ 25
Surface Dept. and G&A $ 13
Royalty (2%) $ 7
TOTAL $145
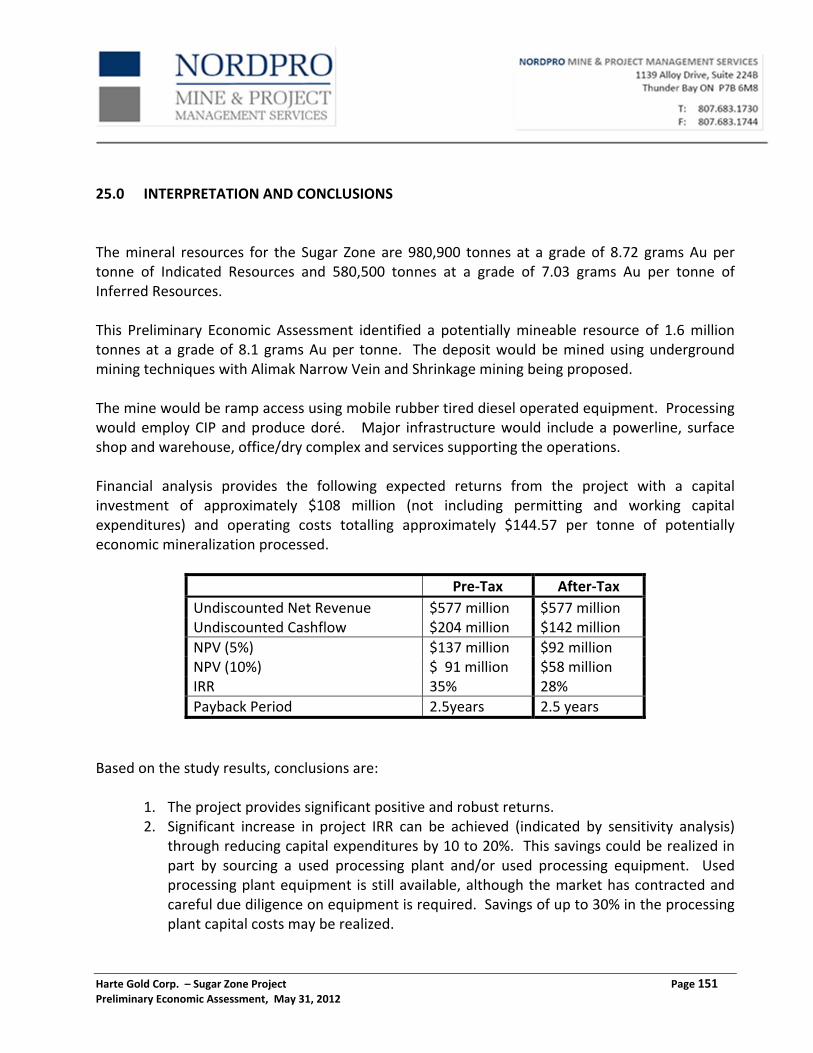
The financial analysis expected base case cashflow estimates are calculated using a forecast long term gold price (based on the past 2 year moving average prices for gold), of $US 1,490. The project expected investment and returns based on the base case cashflow parameters for the project are shown in Table 1‐3.
Table 1‐3. Expected Project Returns.
Pre‐Tax After‐Tax
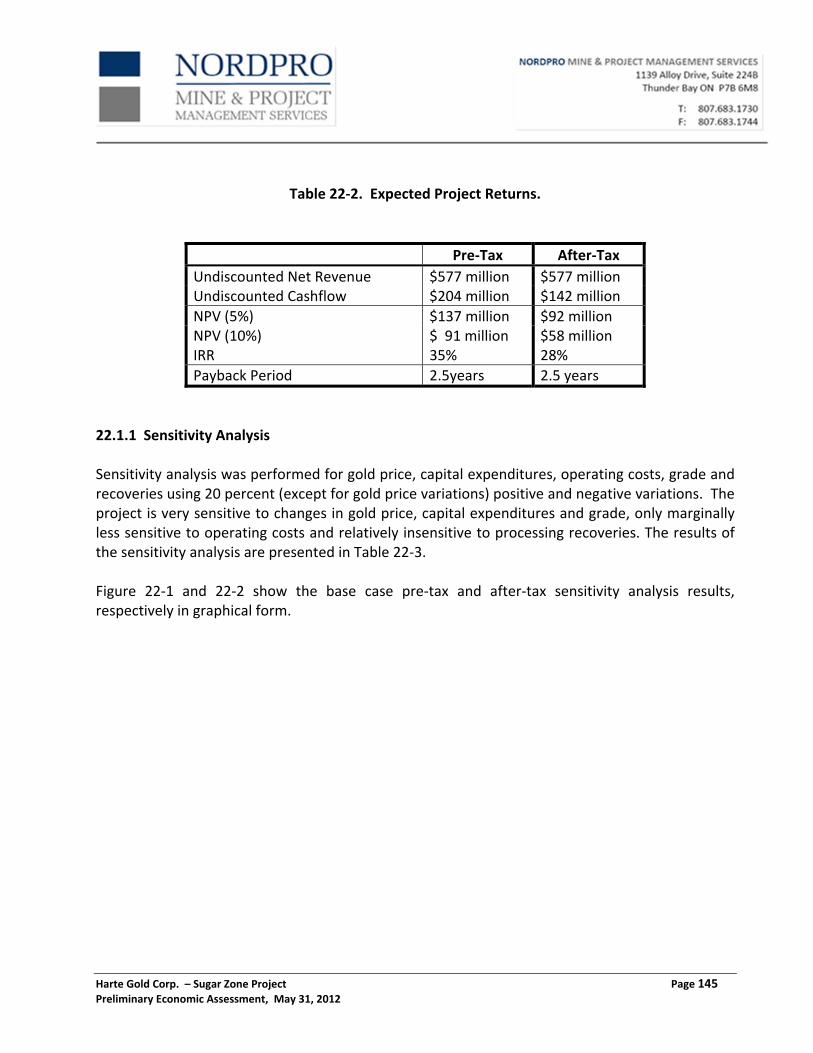
Undiscounted Net Revenue $577 million $577 million Undiscounted Cashflow $204 million $142 million
NPV (5%) $137 million $92 million NPV (10%) $ 91 million $58 million IRR 35% 28%
Payback Period 2.5years 2.5 years
Harte Gold Corp. – Sugar Zone Project Page 4 Preliminary Economic Assessment, May 31, 2012
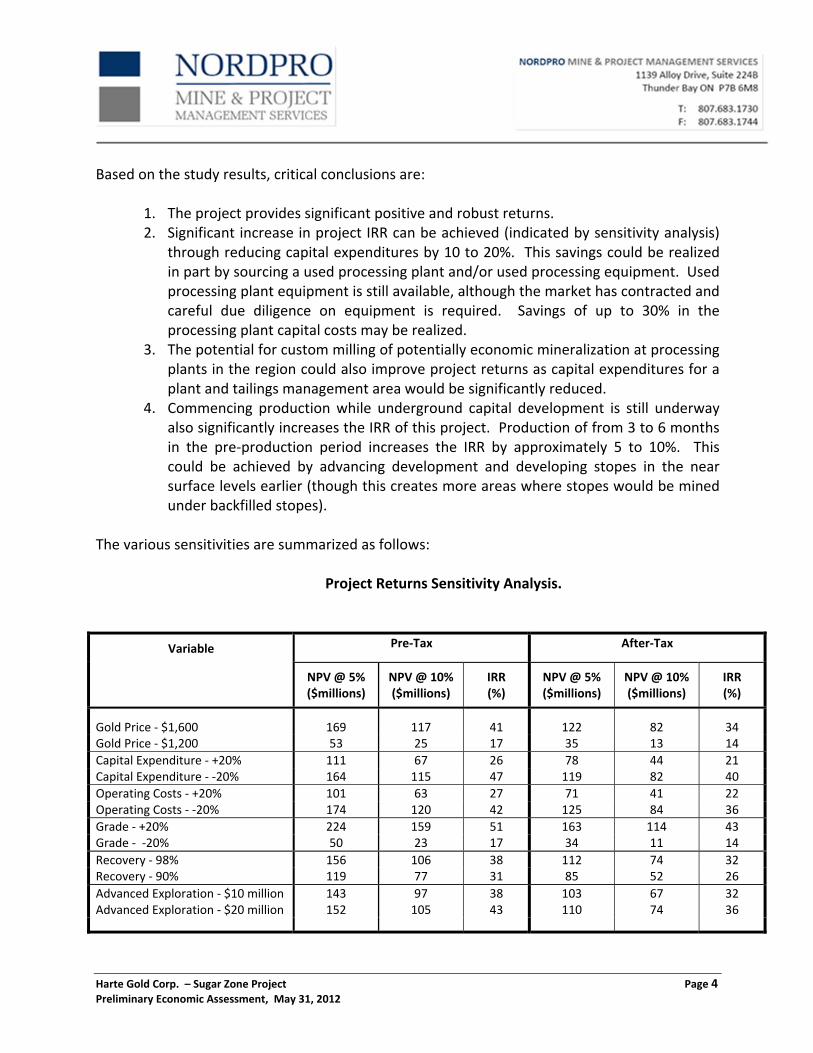
Based on the study results, critical conclusions are:
1. The project provides significant positive and robust returns. 2. Significant increase in project IRR can be achieved (indicated by sensitivity analysis)
through reducing capital expenditures by 10 to 20%. This savings could be realized in part by sourcing a used processing plant and/or used processing equipment. Used processing plant equipment is still available, although the market has contracted and careful due diligence on equipment is required. Savings of up to 30% in the processing plant capital costs may be realized.
3. The potential for custom milling of potentially economic mineralization at processing plants in the region could also improve project returns as capital expenditures for a plant and tailings management area would be significantly reduced.
4. Commencing production while underground capital development is still underway also significantly increases the IRR of this project. Production of from 3 to 6 months in the pre‐production period increases the IRR by approximately 5 to 10%. This could be achieved by advancing development and developing stopes in the near surface levels earlier (though this creates more areas where stopes would be mined under backfilled stopes).
The various sensitivities are summarized as follows:
Advanced Exploration ‐ $10 million Advanced Exploration ‐ $20 million
143152
97105
3843
103 110
6774
3236
Harte Gold Corp. – Sugar Zone Project Page 5 Preliminary Economic Assessment, May 31, 2012
1.3 RECOMMENDATIONS Based on the results of this Preliminary Economic Assessment, recommendations are:
1. Advance the project to production by undertaking an advanced exploration programme in parallel with finalizing the project design and capital requirements.
2. The goal of the Advanced Exploration Programme will be to confirm resources with the objective of converting Mineral Resources to Mineral Reserves.
3. Plan and environmentally permit a bulk sample programme for the Sugar Zone with
development of the ramp to the 100 metre vertical depth elevation.
4. Develop a detailed and optimized Advanced Exploration programme budget in the range of $10 to $20 million.
5. Process a bulk sample to confirm gravity concentration recoveries.
6. Undertake a comprehensive confirmation of the specific gravities for the potentially economic mineralization and waste rock types.
7. Perform a detailed rock mechanics analysis for stope geometry and mine design including oriented core geotechnical drilling.
8. Investigate potential project expenditure reductions through sourcing of a used mill or processing equipment and the potential for custom milling.
Harte Gold Corp. – Sugar Zone Project Page 6 Preliminary Economic Assessment, May 31, 2012
2.0 INTRODUCTION
2.1 TERMS OF REFERENCE This Report was prepared at the request of Harte Gold Corp. (“Harte”). Harte is a Canadian based publicly held company trading on the TSX under the symbol of “HRT” with its corporate offices at:
8 King Street East, Suite 1700, Toronto, Ontario, M5C 1B5 CANADA Tel: 416‐368‐0999 Fax: 416‐368‐5146
This report represents the Preliminary Economic Assessment for the Sugar Zone Project near White River, Ontario, Canada (the “Property”), as completed by Nordpro Mine & Project Management Services Ltd. (Nordpro). This technical report has been prepared in compliance with the requirements of Canadian National Instrument (“NI”) 43‐101 and in accordance with the guidelines of the Canadian Institute of Mining, Metallurgy and Petroleum (“CIM”) Standards on Mineral Resources and Reserves, Definitions and Guidelines prepared by the CIM Standing Committee on Reserve Definitions and adopted by CIM Council December 11, 2005. The resource estimate used in this Technical Report and Preliminary Economic Assessment was prepared in compliance with NI 43‐101 and CIM standards. This resource estimate was undertaken by Michael W. Kociumbas, B.Sc., P.Geo., Senior Geologist and Vice‐President and David Power‐Fardy, B.Sc, P.Geo., Senior Geologist of Watts, Griffis & McOuat of Toronto, Ontario and presented in a report entitled “Technical Report and Mineral Resource Estimate Update for the Dayohessarah Lake Property, Ontario for Harte Gold Corp.” , with an effective date of February 27, 2012. This PEA report is intended to be used by Harte Gold Corp. subject to the terms and conditions of their contract with Nordpro. This permits Harte to file this report on SEDAR (www.sedar.com) as an NI 43‐101 Technical Report with the Canadian Securities Regulatory Authorities pursuant to provincial securities legislation. Nordmin understands that Harte may use the report for a variety of corporate purposes including financings. Except for the purposes legislated under provincial securities laws, any other use of this report, by any third party, is at that party’s sole risk.
Harte Gold Corp. – Sugar Zone Project Page 7 Preliminary Economic Assessment, May 31, 2012
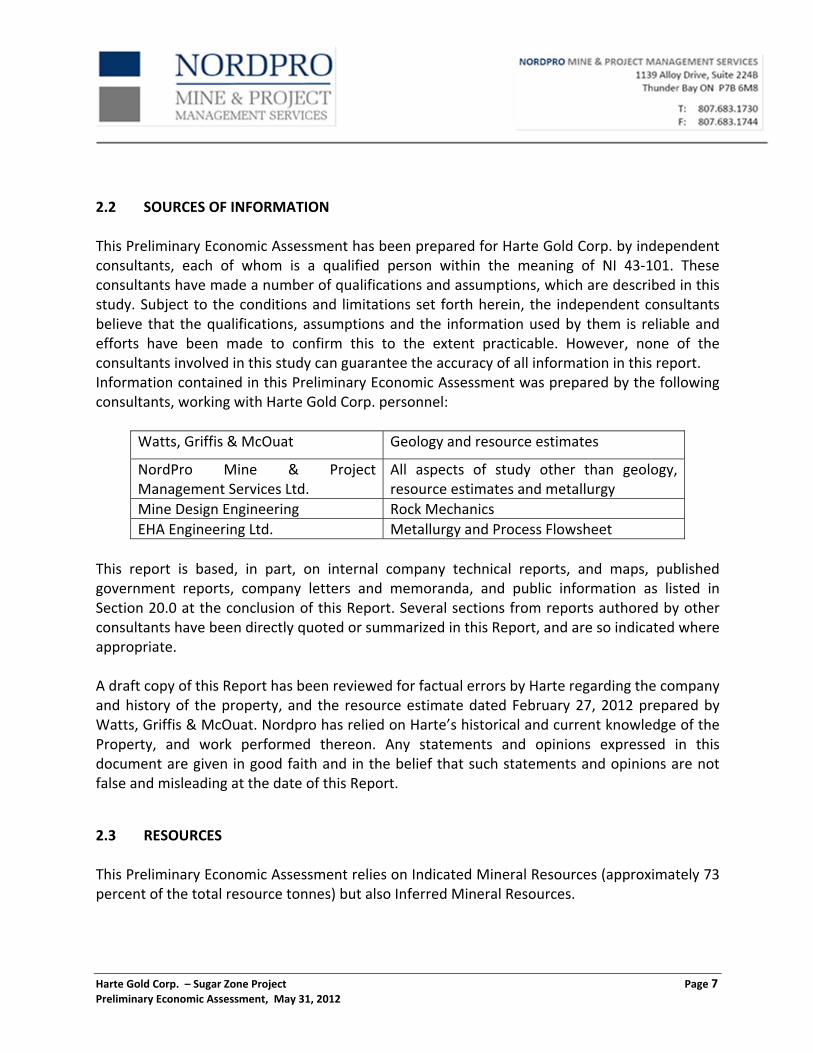
2.2 SOURCES OF INFORMATION This Preliminary Economic Assessment has been prepared for Harte Gold Corp. by independent consultants, each of whom is a qualified person within the meaning of NI 43‐101. These consultants have made a number of qualifications and assumptions, which are described in this study. Subject to the conditions and limitations set forth herein, the independent consultants believe that the qualifications, assumptions and the information used by them is reliable and efforts have been made to confirm this to the extent practicable. However, none of the consultants involved in this study can guarantee the accuracy of all information in this report. Information contained in this Preliminary Economic Assessment was prepared by the following consultants, working with Harte Gold Corp. personnel:
Watts, Griffis & McOuat Geology and resource estimates
NordPro Mine & Project Management Services Ltd.
All aspects of study other than geology, resource estimates and metallurgy
Mine Design Engineering Rock Mechanics
EHA Engineering Ltd. Metallurgy and Process Flowsheet
This report is based, in part, on internal company technical reports, and maps, published government reports, company letters and memoranda, and public information as listed in Section 20.0 at the conclusion of this Report. Several sections from reports authored by other consultants have been directly quoted or summarized in this Report, and are so indicated where appropriate. A draft copy of this Report has been reviewed for factual errors by Harte regarding the company and history of the property, and the resource estimate dated February 27, 2012 prepared by Watts, Griffis & McOuat. Nordpro has relied on Harte’s historical and current knowledge of the Property, and work performed thereon. Any statements and opinions expressed in this document are given in good faith and in the belief that such statements and opinions are not false and misleading at the date of this Report.
2.3 RESOURCES This Preliminary Economic Assessment relies on Indicated Mineral Resources (approximately 73 percent of the total resource tonnes) but also Inferred Mineral Resources.
Harte Gold Corp. – Sugar Zone Project Page 8 Preliminary Economic Assessment, May 31, 2012
The Inferred Mineral Resources are considered too speculative geologically to have economic considerations applied to them that would enable them to be categorized as Mineral Reserves. Therefore, there is no certainty that the results predicted by this Preliminary Economic Assessment would be realized.
2.4 MARGIN OF ERROR In most cases the levels of accuracy for this study are to Pre‐feasibility standard (+/‐ 20%) and vary by major estimate area. Estimates will have higher accuracy where recent pricing has been acquired, near quoting level of pricing has been determined or other recent projects with some similarities in design exist, etc. The estimated levels of accuracy for this study are:
Mine Development & Mining Costs 15% Mine Underground Infrastructure 20% Processing Plant 30% Surface Infrastructure and Facilities 20%
General & Administration Costs 15% 2.5 SITE VISITS Site visits were conducted to the Property in September 2010 by Mr. Brian LeBlanc, P.Eng. Mr. LeBlanc is a qualified person under the terms of NI 43‐101 and has overseen and contributed to the preparation of this study.
2.6 UNITS AND CURRENCY Metal values are reported in, grams per metric tonne (“g/t”). Costs are reported in Canadian dollars (“$CAD”) unless otherwise stated. Grid coordinates are given in the UTM NAD 83 (Zone 14), latitude / longitude system or local mine grid; maps are either in UTM coordinate, latitude / longitude or local mine grid.
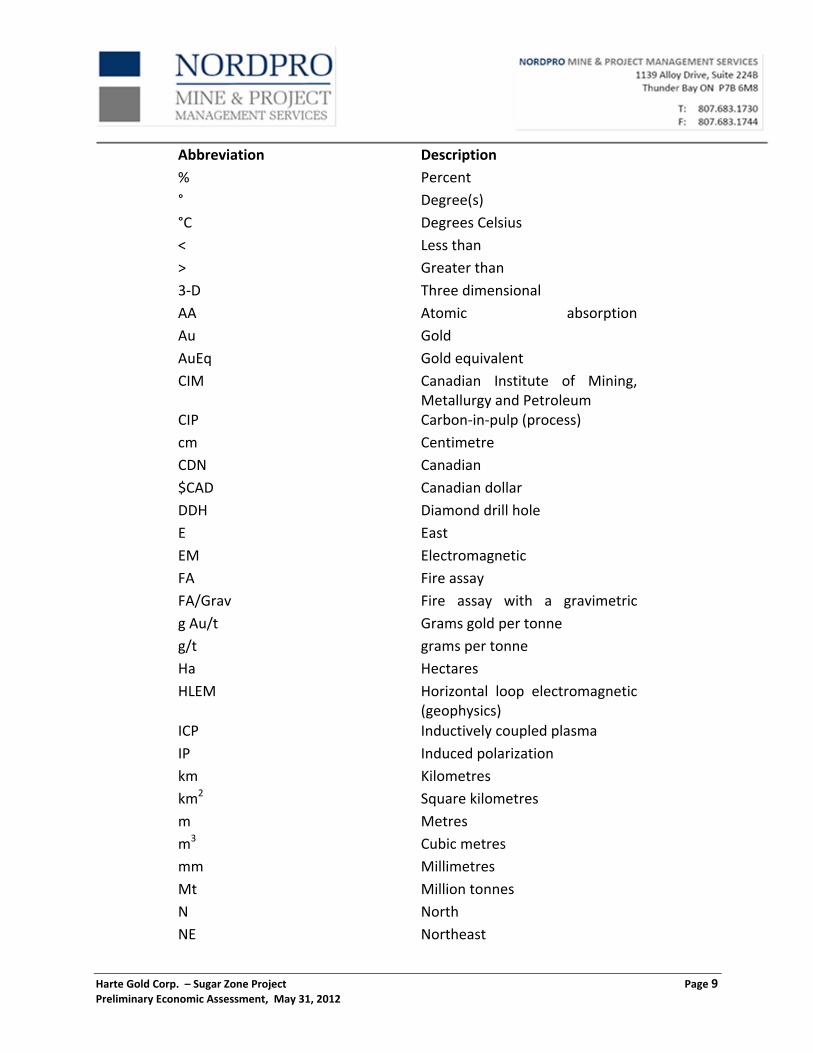
2.7 GLOSSARY OF TERMS
Abbreviation Description
$ Dollars
± Plus or minus
+ Plus
‐ Minus
Harte Gold Corp. – Sugar Zone Project Page 9 Preliminary Economic Assessment, May 31, 2012
Abbreviation Description
% Percent
° Degree(s)
°C Degrees Celsius
< Less than
> Greater than
3‐D Three dimensional
AA Atomic absorption
Au Gold
AuEq Gold equivalent
CIM Canadian Institute of Mining, Metallurgy and Petroleum
CIP Carbon‐in‐pulp (process)
cm Centimetre
CDN Canadian
$CAD Canadian dollar
DDH Diamond drill hole
E East
EM Electromagnetic
FA Fire assay
FA/Grav Fire assay with a gravimetric
g Au/t Grams gold per tonne
g/t grams per tonne
Ha Hectares
HLEM Horizontal loop electromagnetic (geophysics)
ICP Inductively coupled plasma
IP Induced polarization
km Kilometres
km2 Square kilometres
m Metres
m3 Cubic metres
mm Millimetres
Mt Million tonnes
N North
NE Northeast
Harte Gold Corp. – Sugar Zone Project Page 10 Preliminary Economic Assessment, May 31, 2012
Abbreviation Description
NI National Instrument (43‐101)
NSR Net Smelter Return
NW Northwest
Oz Ounce
PEA Preliminary Economic
ppb Parts per billion
QA Quality assurance
QC Quality control
S South
SE Southeast
SEDAR System for Electronic Document Analysis and Retrieval
SW Southwest
t Tonnes (metric)
t/m3 Tonnes per cubic metre
tpd Tonnes per day
$US United States Dollar
UTM Universal Transverse Mercator
VLM‐EM Very low frequency electromagnetic survey
W West
Harte Gold Corp. – Sugar Zone Project Page 11 Preliminary Economic Assessment, May 31, 2012
3.0 RELIANCE ON OTHER EXPERTS Nordpro Mine & Project Management Services Ltd. has assumed, and relied on the fact, that all the information and existing technical documents listed in the References section of this Report are accurate and complete, in all material aspects. While we carefully reviewed all the available information presented to us, we cannot guarantee its accuracy and completeness. We reserve the right, but will not be obligated to revise our Report and conclusions if additional information becomes known to us subsequent to the date of this Report. Although copies of the tenure documents, operating licenses, permits, and work contracts were reviewed, an independent verification of land title and tenure was not performed. Nordpro did not independently verify the legality of any underlying agreement(s) that may exist concerning the licenses or other agreement(s) between third parties but has relied on the client’s solicitor to have conducted the proper legal due diligence. Information on tenure and permits was obtained from Harte.
Harte Gold Corp. – Sugar Zone Project Page 12 Preliminary Economic Assessment, May 31, 2012
4.0 PROPERTY DESCRIPTION AND LOCATION The Dayohessarah Lake Project is a gold deposit located in northwestern Ontario, Canada.
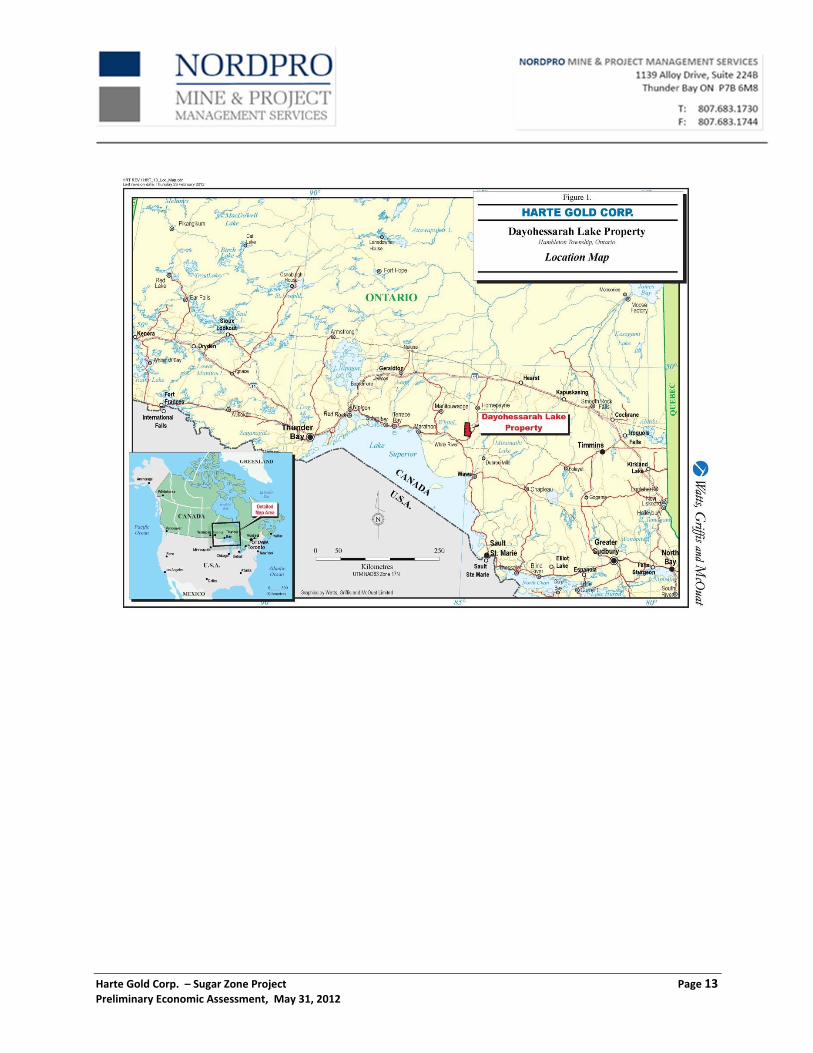
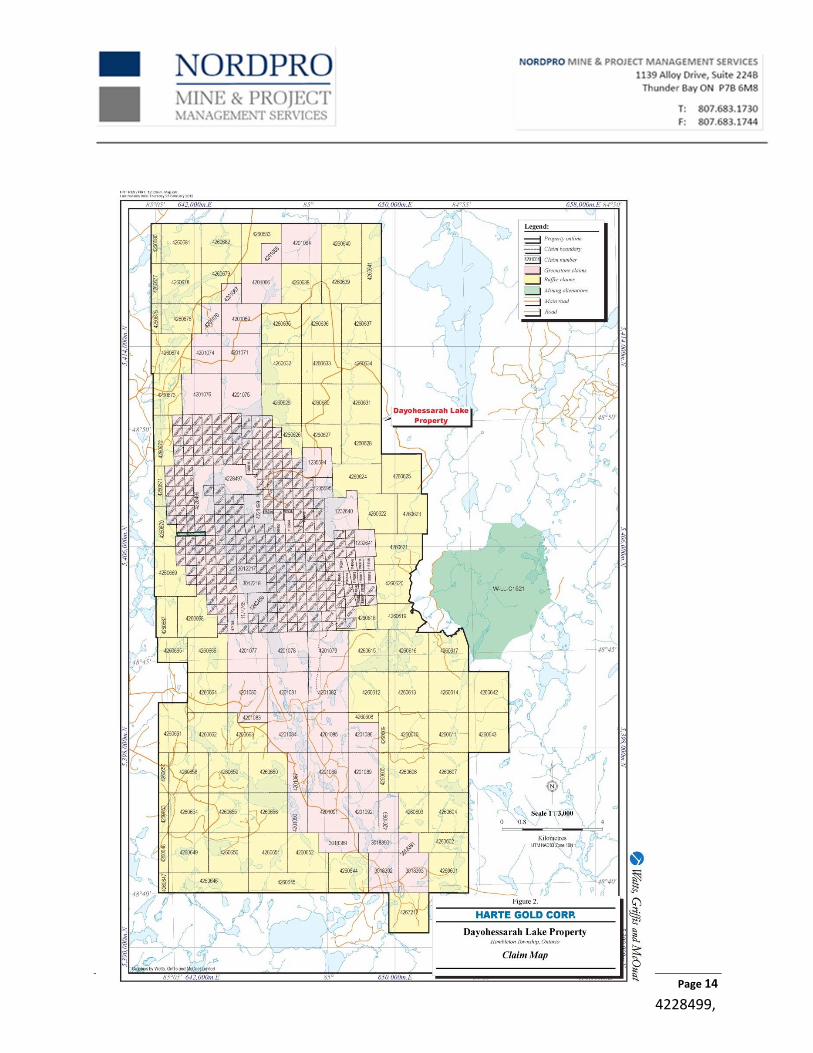
4.1 PROPERTY LOCATION The Dayohessarah Lake Project is situated approximately 25 km northeast of the Town of White River (Trans Canada Highway No. 17) and 60 km east of the Hemlo gold camp. The Property is approximately equidistant from Sault Ste. Marie to the east and Thunder Bay to the west (Figure 4‐1). The overall Property encompasses NTS zones 42C/ 10, 11, 14 and 15 and the gold mineralized occurrences are exposed at Latitude 48°48’ North, Longitude 85°10’ West and covers portions of Odlum, Strickland, Gourlay, Tedder and Hambleton Townships and falls within the Sault Ste. Marie Mining Division.
4.2 PROPERTY DESCRIPTION AND OWNERSHIP The Dayohessarah Lake Property consists of 413 unpatented, unsurveyed, contiguous mining claims comprising 1,840 claim units, and covering approximately 28,600 hectares (Appendix 1). All claims are held in the name of Harte Gold Corp., except for SSM 4228496, 4228497 and 4228499, which are held in the name of Lloyd Joseph Halverson and are subject to an option agreement, as described in Section 4.3. The Property boundaries are marked by claim lines but have not been surveyed (Figure 4‐2). There are two mining alienations which border parts of Harte’s current claim block. The largest (W‐LL‐C1521) lies to the east of the current claim area and shortly borders claim 4260617 on the east, and Hwy 631 on the west. The second alienation (No. 2847) lies completely within Harte’s current claim block, west of Dayohessarah Lake. Surface rights are held by the Crown and timber cutting rights are held by White River Forest Products Ltd. The Property comprises the following unpatented mining claims: SSM 937765 – 768, SSM 937770 – 772, SSM 1043698, SSM 1043701 – 712, SSM 1043715 – 717, SSM 1043803, SSM 1043806 – 812, SSM 1043814 – 828, SSM 1044094 – 097, SSM 1044100 – 103, SSM 1055500 – 543, SSM 1055576 – 589, SSM 1069100, SSM 1069120 and 121, SSM 1069186 – 194, SSM 1069196 – 199, SSM 1069300 – 350, SSM 1069352 – 376, SSM 1069378 – 391, SSM 1078243 – 259, SSM 1078265 – 277, SSM 1078314 – 319, SSM 1135498 and 499, SSM 1140638 – 649, SSM 1140658 – 660, SSM 1174765 – 766, SSM 1182993 and 994, SSM 1183012 – 021, SSM 1194337, SSM 1194339 and 340, SSM 1232640 and 641, SSM 1235594 and 595, SSM 3012217 – 218, SSM 3018389 – 393, SSM 4201064 – 067, SSM 4201069 – 071, SSM 4201074 – 081, SSM 4201082 – 093, SSM 4228496 and 497, SSM 4260601 – 683, and SSM 4267212. All claims are within the Sault Ste Marie Mining Division of Ontario.
Harte Gold Corp. – Sugar Zone Project Page 13 Preliminary Economic Assessment, May 31, 2012
Harte Gold Corp. – Sugar Zone Project Page 14 Preliminary Economic Assessment, May 31, 2012 4228499,
Harte Gold Corp. – Sugar Zone Project Page 15 Preliminary Economic Assessment, May 31, 2012
4.3 PROPERTY AGREEMENTS In 1998, Harte entered into an option agreement with John E. Ternowesky, Lloyd Halverson, Ernie Beaven, Eino Ranta, The Estate of Omer L. Belisle, Broad Horizons Trust and Broad Horizons Inc. on most of the unpatented mining claims comprising the Property. Harte subsequently entered into an Option and Joint Venture Agreement with Corona Gold Corporation (“Corona”) dated July 10, 1998 (the “Sugar Zone Joint Venture”). Under the Sugar Zone Joint Venture, Corona was granted the right to acquire a 51% interest in, and become the Operator of, the Property upon the payment on Closing of $50,000 to Harte and the payment of $1 million in exploration expenditures within forty‐eight (48) months of the Agreement. Corona also had the right to increase its interest in the Property to 75% on payment of an additional $200,000 to Harte and an additional $700,000 in exploration expenditures within forty‐eight (48) months of the date of the Sugar Zone Joint Venture. Pursuant to a Letter Agreement dated March 5, 2010 between Harte and Corona, the parties entered into an Option Agreement (the “Corona Option”) dated May 28, 2010, entitling Harte to acquire Corona’s 51% interest in the Sugar Zone Joint Venture on completion of certain conditions, including:
• an initial cash payment to Corona of $10,000 and 7,180,000 Harte common shares, whereupon Harte became the operator of the project;
• Pursuant to the Corona Option agreement, Harte made a further cash payment to Corona of $2,000,000 and an additional 4,331,638 common shares; and
• $90,000 in cash on or before the six month anniversary of the Corona Option agreement, and $2,500,000 on or before the second anniversary of the option, or $3,000,000 on or before the third anniversary of the option agreement.
Effective March 10, 2010, Harte became the Operator of the Joint Venture and subsequently, on May 23, 2012, Harte made the payment of $2,500,000 to Corona, thus becoming the 100% owner of the Property. The original 313 claims are subject to 3.5% net smelter royalty (“NSR”). Harte has the option of acquiring 1.5% of the 3.5% NSR for $1.5 million and has, in addition, the right of first refusal on the remaining 2.0% NSR.
Harte Gold Corp. – Sugar Zone Project Page 16 Preliminary Economic Assessment, May 31, 2012
On June 28, 2010, Harte entered into an option agreement to acquire three mining claims (the Halverson Claims, SSM 4228496, 4228497 and 4228499) situated in the central part of the Property from vendors Lloyd Halverson, Eugene Belisle and John E. Ternowesky. Terms of the agreement are as follows: to earn 100% interest in the claims, Harte must make cash payments of $225,000 and incur work commitments of $300,000 over five years and issue 200,000 common shares over three years, subject to a 3% NSR, which NSR can be reduced to 1.5% on payment of $1,500,000. In addition to the above and after the five year option period, if an economically viable deposit is found on the claims as defined by an independent feasibility study, Harte will make annual payments of $20,000 against future NSR payments. In the event an economically viable deposit is not found, Harte may make annual payments of $20,000 for a period of five years to complete its purchase of the claims (Option Agreement, June 28, 2010). In November 2010, eighty‐three unpatented mining claims were staked around the Property in order to provide a buffer zone around the core mining claims. Originally staked in the name of Dan Patrie Exploration Ltd., the claims were transferred into the name of Harte effective March 3, 2011. As of the date hereof, Harte holds a total of 413 mining claims covering an area of approximately 28,600 hectares. Current exploration at the Property is focused on the Sugar Zone Deposit. Roads extending onto the Property from the west are gated and designated as Restricted Access by the Ontario Ministry of Natural Resources (“MNR”), in order to limit access to two remote tourist operations lying within the Property boundary. Access to the Property is governed by the issuance of road access permits by the Ministry of Natural Resources which permits aredesigned to limit public access No mine workings, waste rock piles, tailings ponds or other environmental liabilities are known to occur on the Property. Historically, the names for this Property, ‘Dayohessarah Lake’, Dayohessarah’, ‘Dayo’ and ‘Sugar Zone’, have been used interchangeably. ‘Dayohessarah’ refers to Dayohessarah Lake, a large body of water occupying the centre of the Property, while ‘Sugar Zone’ refers to the sugary nature of quartz veining hosting gold mineralization on the Property.
Harte Gold Corp. – Sugar Zone Project Page 17 Preliminary Economic Assessment, May 31, 2012
5.0 ACCESS, CLIMATE, LOCAL RESOURCES, INFRASTRUCTURE AND PHYSIOGRAPHY
5.1 ACCESSIBILITY The Project can be accessed via a series of logging roads and drill trails extending north from the community of White River. Access is also available by way of float plane, based in White River via Dayohessarah Lake or Hambleton Lake, and by helicopter based in Wawa or Marathon. The western and southern portions of the Property are accessible via a series of logging roads controlled by White River Forest Products Limited. Road No. 100 extends north from the western end of White River. Road No. 200 intersects Road No. 100 20 km from Highway 17 and provides access to the western and southern portions of the property. Road No. 300 intersects Road No. 100 36 km from Highway 17 and provides access to the very northern portion of the Property. Road No. 305 intersects Road No. 300 6 km from Road No. 100 and provides access to northern and eastern parts of the Property. Road access to within 400 m of the Sugar Zone is available via a small road heading south and southwest from Road No. 305 for 8.8 km. From there, access to the Sugar Zone is available via all‐terrain or tracked vehicles in the summer, and snowmobiles, tracked vehicles and trucks in the winter. The distance from White River to the Sugar Zone is approximately 60 km by road. Areas surrounding Dayohessarah and Hambleton Lakes are designated by the Ontario Ministry of Natural Resources as ‘Restricted Access’. Locked gates on Road No. 200 and Road No. 305 control vehicular access in order to prevent access to remote lodge operations on two lakes. Permits are required for road access to most of the Sugar Zone property for mineral exploration purposes. Harte has entered into an agreement with the Remote Lodge Operator which agreement provides a framework for access by Harte and its employees, contractors and others associated with the exploration and development of the Property. The agreement governs the parties’ working relationship through advanced exploration, productions and mine closure of mining activities on the Property, subject to early termination should Harte cease exploration, production or otherwise abandon the Property .
5.2 CLIMATE The climate is northern boreal, with short hot summers and cold, snowy winters. Some field operations, such as drilling, can be carried out year‐round while other operations, such as
Harte Gold Corp. – Sugar Zone Project Page 18 Preliminary Economic Assessment, May 31, 2012
prospecting and mapping, can only be carried out during the late spring, summer and early autumn months. The temperatures can range from ‐35ºC in the winter to +30ºC in the summer; though the mean temperatures are around ‐21ºC to +20ºC. Rainfall is about 727 mm annual average, with the wettest month being September (120 mm average). Snow is abundant, often reaching several metres with December and January having the heaviest snowfall (about 80 cm). Snow is on the ground by late October and the ice begins to thaw on the lakes by April.
5.3 LOCAL RESOURCES AND INFRASTRUCTURE The Project is located approximately 25 km northeast of the town of White River (population of between 500 and 800 people, depending on activity in the area), Ontario. The cities of Sault Ste. Marie and Thunder Bay are located 311 km south and 383 km west of White River, respectively, along Highway 17. Highway 631, a secondary paved highway, extends north from White River through Hornpayne to Highway 11, and passes approximately 11 km east of the Property. A Hydro One electrical transmission line passes through White River. Canadian Pacific’s transcontinental main line also passes through White River. Mining infrastructure and competent workers are present in the two communities serving the Hemlo mining camp, Marathon and Manitouwadge, about 65 km west of White River. The main commercial centres for the area are Sault Ste. Marie and Thunder Bay, as well as, to a lesser extent, Wawa and Marathon. Surface rights over the entire Property are held by the Crown. Local lakes and minor streams should provide adequate water for future mining and milling operations.
5.4 PHYSIOGRAPHY The topography on the Property varies from moderate to rugged, with lake levels generally at 390 m above sea level, and occasional hills up to 480 m elevation. The overburden is generally between 0 to 20 m deep on the Property, with occasional bouldered terrain, and normally approximately 2 to 3 m overlying the Sugar Zone. Vegetation is boreal, with jack pine, fir, poplar and birch occupying dry uplands and cedar, tamarack and spruce growth on more poorly drained terrain.
Harte Gold Corp. – Sugar Zone Project Page 19 Preliminary Economic Assessment, May 31, 2012
6.0 HISTORY Exploration for gold and base metals has been performed on the Property since 1969. WGM believes the historical descriptions presented are generally accurate, but we have not independently verified the data. This historic information is drawn heavily from Sharpstone’s 2010 NI 43‐101 Report and is summarized below: 1969 Canex Aerial Exploration Ltd. drilled three diamond drillholes in the vicinity of the mafic/ultramafic intrusives and flows near the north end of Dayohessarah Lake. Results included an intersection of 0.326% Ni and 0.08% Cu over 5 ft. in metagabbroic rocks. 1983‐1986 Pezamerica Resources Limited conducted an exploration program which included an airborne Mag and EM survey that outlined thirty‐one geophysical anomalies in the area. Twenty‐four of these anomalies were investigated by Teck Exploration on behalf of Pezamerica. Teck Exploration drilled nine airborne geophysical targets based on coincidental soil gold anomaly trends. In all cases, the airborne anomalies were explained by pyrite/pyrrhotite rich horizons within felsic volcanics. Hole PZ‐6 returned appreciable amounts of sphalerite mineralization (0.47% Zn over 2.8 feet). None of the assayed core returned significant gold values. 1990 Most of the Dayohessarah Greenstone Belt was staked by a prospecting syndicate. 1991 The Property was optioned from the prospectors by Hemlo Gold Mines Inc. Initial prospecting uncovered the gold‐bearing Sugar Zone deposit. Based on bedrock exposure and trenching, the Sugar Zone was traced for 750 m, and a ground IP survey outlined the Sugar Zone structure extending for 1,500 m. 1993 Hemlo Gold conducted a preliminary diamond drill program to test the Sugar Zone for economic gold mineralization. A grid was cut with a 6 km baseline and tie‐lines ranging in spacing between 100 m and 1,000 m. Six diamond drillholes were completed totalling 800 m. All drillholes intersected significant gold mineralization in the Sugar Zone. A small trenching program was initiated on the Sugar Zone. 1994 Hemlo Gold proceeded with initial geological mapping, prospecting and a follow‐up drill program. Fifteen diamond drillholes were completed on the Property, totalling 2,416 m. Eight of the drillholes intersected the Sugar Zone. An I.P. survey was completed over the southern portion of the Property, and a Mag survey was completed over the entire grid. After the exploration program, the Property was returned to the prospecting syndicate who initially staked the ground, due to legal reasons.
Harte Gold Corp. – Sugar Zone Project Page 20 Preliminary Economic Assessment, May 31, 2012
1998‐1999 Most of the Property was optioned from the prospectors syndicate. The mining claims were subject to a Joint Venture agreement between Corona Gold Corporation (51%) and Harte Gold Corp. (49%). Corona was the operator. The initial 313 claims are subject to a 3.5% net smelter royalty (“NSR”), and the Joint Venture participants have the option to acquire 1.5% of the 3.5% NSR for $1.5 million, and have the right of first refusal on the remaining 2.0% NSR. Corona carried out an extensive exploration program. The existing grid was rehabilitated and new grid lines established east of Dayohessarah Lake. In total, 96.1 km of grid lines with 100 m spacing oriented at 320º azimuth were cut over the Sugar Zone area. An oriented soil sampling program was carried out on the grid, as well as mapping and sampling. Prospecting was limited to the Sugar Zone and extensions of the Sugar Zone to the south and to the north. A surface power trenching program was conducted on parts of the Sugar Zone and six trenches were excavated, washed, channel sampled and mapped in detail. A detailed Mag‐VLF and reconnaissance gradient I.P. survey was performed on the Property. A diamond drilling program totalling 9,937 m of NQ core in 53 holes was completed, mostly into and around the Sugar Zone. The drillholes covered 3 km of strike length, and intersected the zone at approximately 50 m spacing at shallow depths. A secondary purpose of the program was to follow‐up low grade mineralization encountered in previous drilling by Hemlo Gold and to test previously untested/poorly tested I.P. anomalies west of the Sugar Zone and east of Dayohessarah Lake. Preliminary Mineral Resource estimates of the Sugar Zone mineralization in the 12000 N to 13100 N area were prepared, based on the drilling program noted above. Another estimate was made, using revised and refined criteria and polygonal methods, in the spring of 1999, following additional data evaluation (Hunt and Drost, 1999). 2003‐2004 Corona conducted a diamond drilling program totalling 7,100 m in 26 holes. The drill program mostly intersected the Sugar Zone and was successful in its purpose of expanding the strike and dip extent of the zone, as well as increasing the level of confidence in the continuity of mineralization by in‐fill drilling. 2004 Corona conducted another diamond drilling program totalling 3,588 m in 11 holes. The program was successful in increasing the mineralization extent of the Sugar Zone, as well as increasing the defined Sugar Zone depth to a vertical depth of 300 m. A new Mineral Resource estimate was completed. 2008 A helicopter airborne geophysical survey was flown over the Property by Fugro Airborne Surveys Corp., under contract from Corona. The survey used a DIGHEM multi‐coil, multi‐frequency electromagnetic system along with a high sensitivity cesium magnetometer. A total of 1,917 line km were flown. It was recommended by Hunt that compilation of historic
Harte Gold Corp. – Sugar Zone Project Page 21 Preliminary Economic Assessment, May 31, 2012
exploration data on the remainder of the Property be followed by a program of reconnaissance mapping and prospecting to evaluate the Fugro airborne conductor axes on the ground, as well as to identify additional target areas extending both north and south of existing Sugar Zone mineralization and elsewhere on the property. 2009 During March, Corona undertook a drilling program totalling 2,020 m in 10 holes. The purpose of the program was to test airborne electromagnetic conductors, magnetic anomalies, induced polarization chargeability anomalies and geologically defined possible extensions to the north and the south of the known Sugar Zone mineralization. During July to September, a prospecting, reconnaissance geological mapping and channel sampling program was undertaken on geophysical targets outlined by the Fugro airborne geophysical anomalies. Highlights included sampling of a float rock returning a value of 87.80 g Au/t, as well as grab samples from quartz veining east of the Sugar Zone returning values of 30.40 and 9.04 g Au/t. 2010 Harte Gold Corp. initiated its first drilling program. During March, a diamond drill program totalling 2,097.31 m in 12 holes was completed, two holes of which were aborted before reaching the Sugar Zone. The program was successful in locating a high grade area of the Sugar Zone located near surface and directly under a series of surface trenches. The drill program was also successful in determining that the Sugar Zone has significant mineralization below 300 m depth.
6.1 HISTORIC PRODUCTION There is no historic production from within the Dayohessarah Greenstone Belt.
Harte Gold Corp. – Sugar Zone Project Page 22 Preliminary Economic Assessment, May 31, 2012
7.0 GEOLOGICAL SETTING AND MINERALIZATION WGM has relied for our geological descriptions and program results solely on the basis of historic reports, notes and communications with Harte and Sharpstone. Additional results and descriptions have been summarized in previous Sharpstone NI 43‐101 Technical Reports.
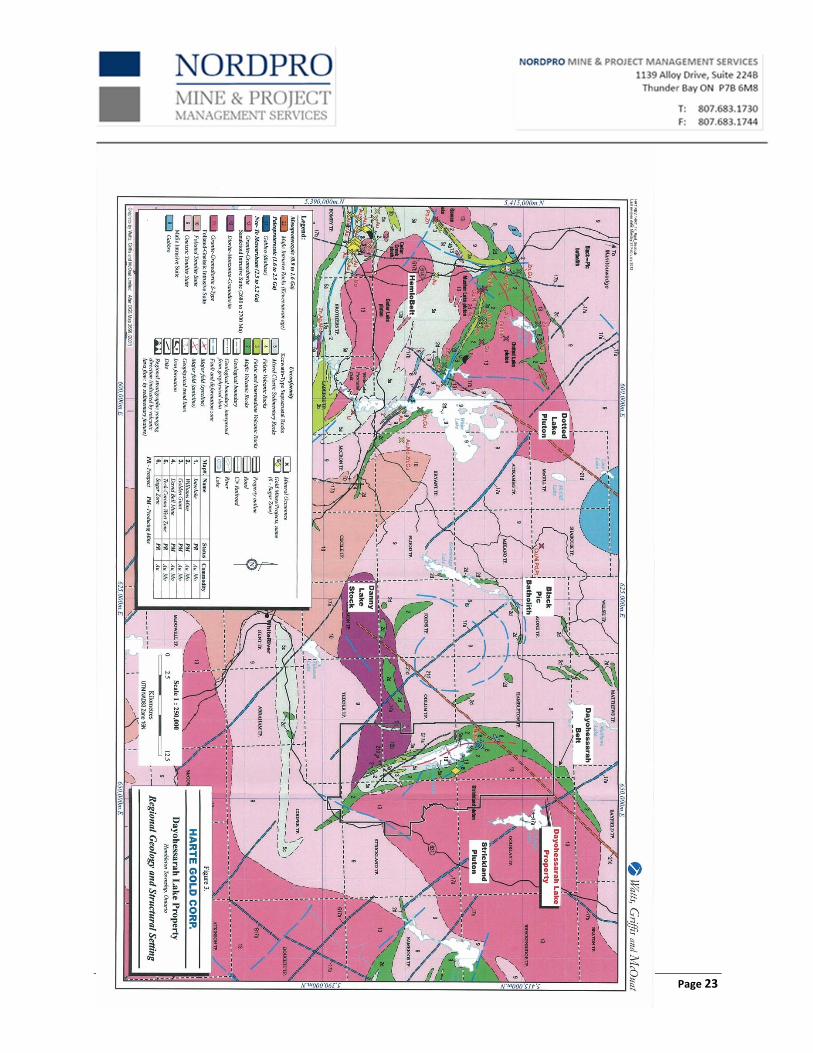
7.1 REGIONAL, LOCAL AND PROPERTY GEOLOGY 7.1.1 Regional Geology The Dayohessarah Greenstone Belt is situated between two larger greenstone belts; the Hemlo Greenstone Belt to the west and the Kabinakagami Greenstone Belt to the east. These greenstone belts are part of the larger, east trending Schrieber‐White River Belt of the Wawa Subprovince of the Superior Craton. The Late Archean Dayohessarah Greenstone Belt trends northwest and forms a narrow, eastward concave crescent (Figure 3). The belt is approximately 36 km in length and varies in width from 1.5 to 5.5 km. Principal lithologies in the belt are moderately to highly deformed metamorphosed volcanics, volcanoclastics and sediments that have been enclosed and intruded by tonalitic to granodioritic quartz‐porphyry plutons. The greenstone belt is bordered to the east by the Strickland Pluton and to the west by the Black Pic Batholith. The Danny Lake Stock borders the south western edge of the Dayohessarah Greenstone Belt. The Strickland Pluton is characterized by a granodioritic composition, quartz phenocrysts, fine grained titanite, and hematitic fractures. The Black Pic Batholith is similar to the Strickland Pluton, but locally more potasic. The Black Pic Batholith also contains interlayers of monzogranite. The Danny Lake Stock is characterized by hornblende porphyritic quartz monzonite to quartz monzodiorite (G. M. Stott, 1999). The Dayohessarah Greenstone Belt has been metamorphosed to upper greenschist to amphibolite facies. The Strickland Pluton seems to have squeezed the greenstone belt and imposed upon it a thermal metamorphism. Most of the mafic volcanics are composed primarily of plagioclase and hornblende. Almandine garnets are widely observed in the clastic metasediments and locally, along with pyrope garnets, in the mafic volcanics (G.M. Stott, 1996). Alteration throughout the belt consists of diopsidation, albatization, weak magnesium biotization, weak carbonatization and moderate to strong silicification which accompanied the emplacement of the porphyry dykes/sills and quartz veining. The belt has been strongly foliated, flattened and strained. Deformation seen in the supracrustal rocks has been interpreted to be related to the emplacement of the Strickland Pluton. Strongly developed metamorphic mineral lineations in the supracrustal rocks closely compare with the orientations of the quartz phenocryst lineations seen in the Strickland Pluton. This probably reflects a constant strain aureole imposed by the pluton upon the belt (G.M. Stott, 1996). The strain
Harte Gold Corp. – Sugar Zone Project Page 23 Preliminary Economic Assessment, May 31, 2012
Harte Gold Corp. – Sugar Zone Project Page 24 Preliminary Economic Assessment, May 31, 2012
fabric is best observed a few hundred meters from the Strickland Pluton in the Sugar Zone, which has been characterized as the most severely strained part of the belt. The Sugar Zone is defined by sets of parallel mineralized quartz veining, quartz flooding of strongly altered wallrock, thin intermediate porphyry lenses and dykes/sills parallel to stratigraphy and foliation, and gold mineralization. Foliations and numerous top indicators define a synclinal fold in the central portion of the belt. The synclinal fold has been strongly flattened and stands upright with the fold hinge open to the south and centered along Dayohessarah Lake.
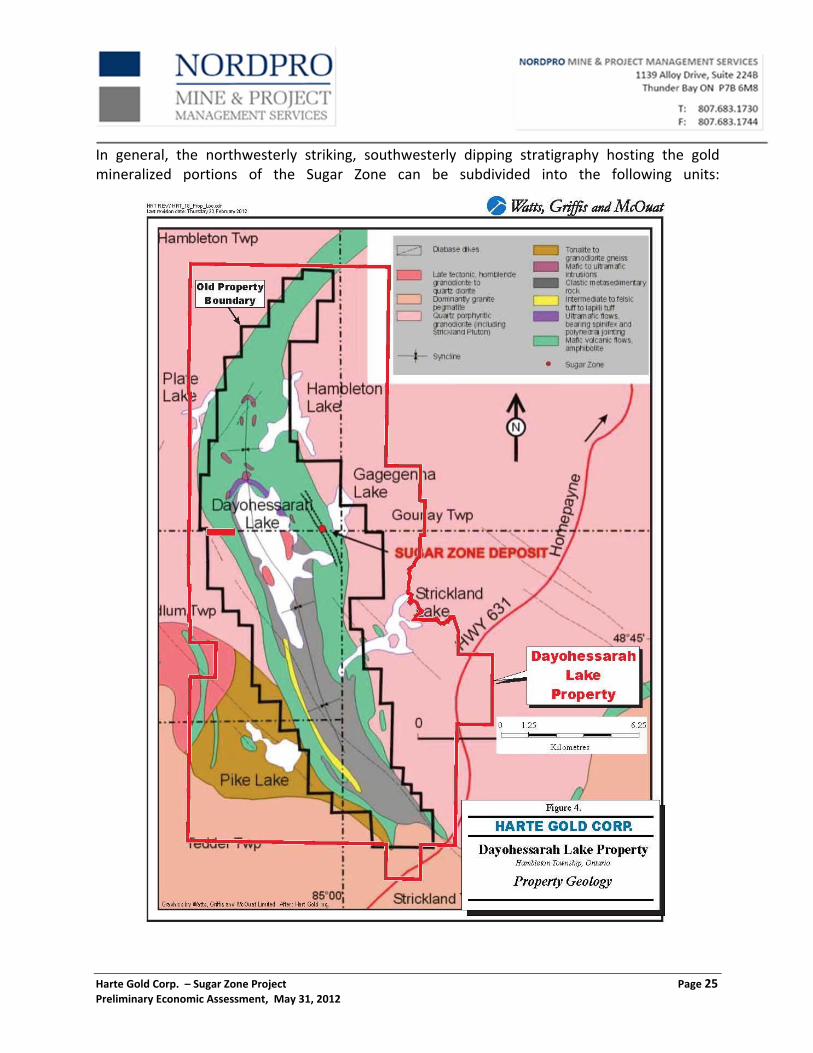
7.2. PROPERTY GEOLOGY Near Dayohessarah Lake, the belt is dominated by a basal sequence of massive to pillowed mafic volcanics, commonly with ellipsoidal, bleached alteration pods, overlain by intermediate tuff and lapilli tuff. The tuffaceous units rapidly grade upwards to a sedimentary sequence consisting of greywacke and conglomerates derived from volcanics, sediments and felsic intrusive sources (G. M. Stott, 1996). Several thin, continuous cherty sulphide facies iron formations are found in the mafic volcanic sequence. Spinifex textured komatiitic flows stratigraphically underlie the main sedimentary sequence and can be traced around the north end of Dayohessarah Lake. Also at the north end of Dayohessarah Lake, mafic and ultramafic sills and stocks underlie the komatiites (Figure 4). Several fine to medium grained, intermediate feldspar porphyry dykes/sills have intruded and swarmed the belt. Swarming of the intermediate porphyry dykes is more intense east of Dayohessarah Lake. Stott has interpreted the porphyry sills and associated porphyry bodies to be related to the Strickland Pluton. A smaller granitic quartz porphyry body containing some sulphide mineralization is located northwest of Dayohessarah Lake. The porphyritic texture of the dykes/sills is often nearly, or completely, obliterated by the degree of foliation in the greenstone belt, or by the degree of shear in the Sugar Zone. These intermediate dykes/sills vary in abundance across the Property, but increase in regularity within, and around, the Sugar Zone. There is also a consistent, weak pervasive silicic alteration in the intermediate intrusives, as well as consistently trace amounts of very fine grained disseminated pyrite. The major linear structure recognized on the Property is the Sugar Deformation Zone (SDZ) that trends northwest‐southeast for approximately 3.5 km and dips southwest between 65° and 75°. The SDZ appears to be spatially related to the Strickland Pluton and is a complex system with strain intensities varying from strongly deformed‐pillow mafic volcanics to undeformed massive mafic flows to anastomising linear areas. Stratigraphically‐conformable porphyritic intermediate intrusions swarm through the SDZ. Both the mafic volcanics and the intermediate intrusives exhibit moderate linear fabrics along with hydrothermal alteration (i.e., silicification).
Harte Gold Corp. – Sugar Zone Project Page 25 Preliminary Economic Assessment, May 31, 2012
In general, the northwesterly striking, southwesterly dipping stratigraphy hosting the gold mineralized portions of the Sugar Zone can be subdivided into the following units:
Harte Gold Corp. – Sugar Zone Project Page 26 Preliminary Economic Assessment, May 31, 2012
• Hanging Wall Volcanics;
• Upper Zone (Sugar Zone mineralization);
• Interzone Volcanics;
• Lower Zone (Sugar Zone mineralization); and
• Footwall Volcanics. The Hanging Wall, Interzone and Footwall volcanic horizons consist predominantly of massive and pillowed basalt flows generally striking northwest and dipping at an average angle of 64° to the southwest. Coarse to very coarse grained, locally gabbroic‐textured phases form a significant component of the Hanging Wall mafic volcanic package. It is believed that these phases represent thick, slowly‐cooled portions of the massive mafic flows, as they commonly grade into finer grained, more recognizable basaltic flows, and eventually even pillow flows. In much of the area which drilling on the Sugar Zone was carried out, a distinctive, very coarse grained mafic volcanic flow was observed consistently about 15 m stratigraphically above the Upper Zone. Other than this unit, specific mafic flows, as well as intermediate porphyry units, are nearly impossible to interpret/distinguish between holes. The Upper and Lower zones range in thickness from 1.5 to 10 m, strike at 140° and dip between 65° and 75° with minor undulations. The auriferous Wolf Zone lies in the northern extent of the SDZ, but drilling between the two zones indicates that the zones are complexly separate from each other. Like the Sugar Zone, the Wolf Zone is north‐northwesterly striking, and southwesterly dipping. Unlike the Sugar Zone, there is only one gold mineralized zone, and not two or more parallel zones. A northerly‐striking, sub‐vertically dipping, dark grey‐black, diabase dyke intrudes the older rock types in the greenstone belt, and cuts across the SDZ. The diabase dyke obliterates the SDZ when it is encountered. The diabase dyke is aphenetic around the edges and, where thick enough to do so, grades to a coarse grained euhedral rock in the middle of the dyke. The dyke exhibits very coarse grained greenish quartz‐epidote phenocrysts up to 3 cm across throughout. The dyke is weakly pervasively magnetic. A very small amount of lateral movement of the zones has been interpreted locally on either side of the dyke, suggesting that very minor dyke‐related faulting has occurred.
Harte Gold Corp. – Sugar Zone Project Page 27 Preliminary Economic Assessment, May 31, 2012
Other than the diabase, the youngest intrusive rocks observed on the Property are white to pale grey, fine grained to medium grained and occasionally pegmatitic felsite dykes. The dykes generally consist of varying amounts of plagioclase, quartz and muscovite. These generally thin dykes strike northeast and where they intersect the SDZ, they completely wipe out the zone. These dykes are undeformed and clearly postdate the mineralization and deformation events.
7.3 MINERALIZATION
7.3.1 Sugar Zone
The auriferous Upper and Lower zones of the Sugar Zone lie within the SDZ. They are defined as highly strained packages consisting of variously altered mafic volcanic flows, intermediate porphyritic intrusions and boudinaged auriferous quartz veins. The two zones range in true thickness from about 1.5 to 10 m, and are separated by 20 to 30 m of barren volcanics. Each zone is made up of one or more porphyritic intrusions, flanked by altered basalt and hosting stratigraphically conformable quartz veins. Alteration within the mafic volcanic potions of the zones consists primarily of silicification (both pervasive and as quartz veining), diopsidation and biotization. The porphyry units of the zones exhibit biotite and silica alteration as well, but no diopside alteration. The Upper and Lower zones appear geologically consistent both down dip and along strike. The Lower Zone has consistently larger widths, as well as mostly consistently higher grades of gold mineralization, however both the width, and the gold grade within each zone seem to follow the same trends across the zone. That is to say, that where the Upper Zone exhibits larger widths and higher gold grades, the Lower Zone also exhibits larger widths and higher gold grades. The zones are observed on surface to pinch and swell over distances of 50 m or more. Gold mineralization mostly occurs in quartz veins, stringers and quartz flooded zones predominantly associated with porphyry zones, porphyry contact zones, hydrothermally altered basalts and, rarely, weakly altered or unaltered basalt within the Upper and Lower zones. Fine to coarse grained specks and blebs of visible gold are common in the Sugar Zone quartz veins, usually occurring within marginal, laminated or refractured portions of the veins. The visible gold itself is often observed to be concentrated within thin fractures, indicating some degree of remobilization. Quartz veins and floods also contain varying amounts of pyrrhotite, pyrite, chalcopyrite, galena, sphalerite, molybdenite and arsenopyrite. The presence of galena, sphalerite and/or arsenopyrite is a strong indicator of the presence of visible gold. Pyrite,
Harte Gold Corp. – Sugar Zone Project Page 28 Preliminary Economic Assessment, May 31, 2012
chalcopyrite and, rarely, molybdenite form a minor component of total sulphides and do not appear to be directly related to the presence of gold mineralization. Other mineralized zones have been observed between, above and below the Sugar Zone Upper and Lower zones, in diamond drilling. Most of these intercepts are believed to be quartz veining originating in either the Upper or Lower zone, that have been diverted from the sheared part of the zone, up to 15 m from the main bodies of mineralization. One of these zones is the historically discovered Zoe Zone, which has been recently renamed the Lynx Zone, which lies east of the southern end of the Sugar Zone.
7.3.2 Wolf Zone
The auriferous Wolf Zone lies along strike of the Sugar Zone, and may represent the northern extension of the SDZ. It is defined as highly strained packages consisting of variously altered mafic volcanic flows and gabbros. The zone ranges in true thickness from 0.5 to 8 m. The zone is made up of highly sheared mafic volcanics, and a network of intrusive, intermediate quartz‐feldspar porphyry dykes/sills. Alteration in the mafic volcanic and gabbro units consists mainly of silicification (both pervasive and quartz veining), diopside alteration and magnesium rich, brown biotite alteration. Alteration within the intermediate porphyry units consist of mostly silicification, with small amounts of magnesium‐rich brown biotite, and no diopside. The zone is observed in trenches to pinch and swell over 30 m. Gold mineralization mostly occurs in quartz veins, stringers and quartz flooded zones predominantly associated with porphyry zones, and hydrothermally altered basalts and gabbros. Fine grained specks of visible gold are occasionally observed in the Wolf Zone quartz veins. The visible gold itself is often observed to be concentrated within thin fractures, indicating some degree of remobilization. Quartz veins and floods also contain varying amounts of pyrrhotite, pyrite and occasional galena. The presence of galena is a strong indicator of the presence of visible gold. Pyrite and pyrrhotite form most of the total sulphides, but do not appear to be directly related to the presence of gold mineralization.
Harte Gold Corp. – Sugar Zone Project Page 29 Preliminary Economic Assessment, May 31, 2012
8.0 DEPOSIT TYPES The Sugar Zone is an epithermal deposit located in the Sugar Deformation Zone, or SDZ, which is an area of high strain. The Sugar Zone, along with the Wolf Zone, make up the only two known gold deposits within the relatively small SDZ, and the only two currently known gold deposits within the Dayohessarah Greenstone Belt. Stretching and foliation of all rock types, except for the later diabase and felsite dykes, increases with proximity to the SDZ. Within and adjacent to the SDZ, basalt flows are foliated and stretched to the point where features become unrecognizable. Widespread ‘mafic agglomerate’ noted in previous Hemlo diamond drill logs (Calhoun, 1994) is based on close observation of drill core and washed outcrop exposures, to be highly stretched pillow flows. Within and proximal to the mineralized zones, boudinaging of quartz veins and other brittle features is commonly observed.
Harte Gold Corp. – Sugar Zone Project Page 30 Preliminary Economic Assessment, May 31, 2012
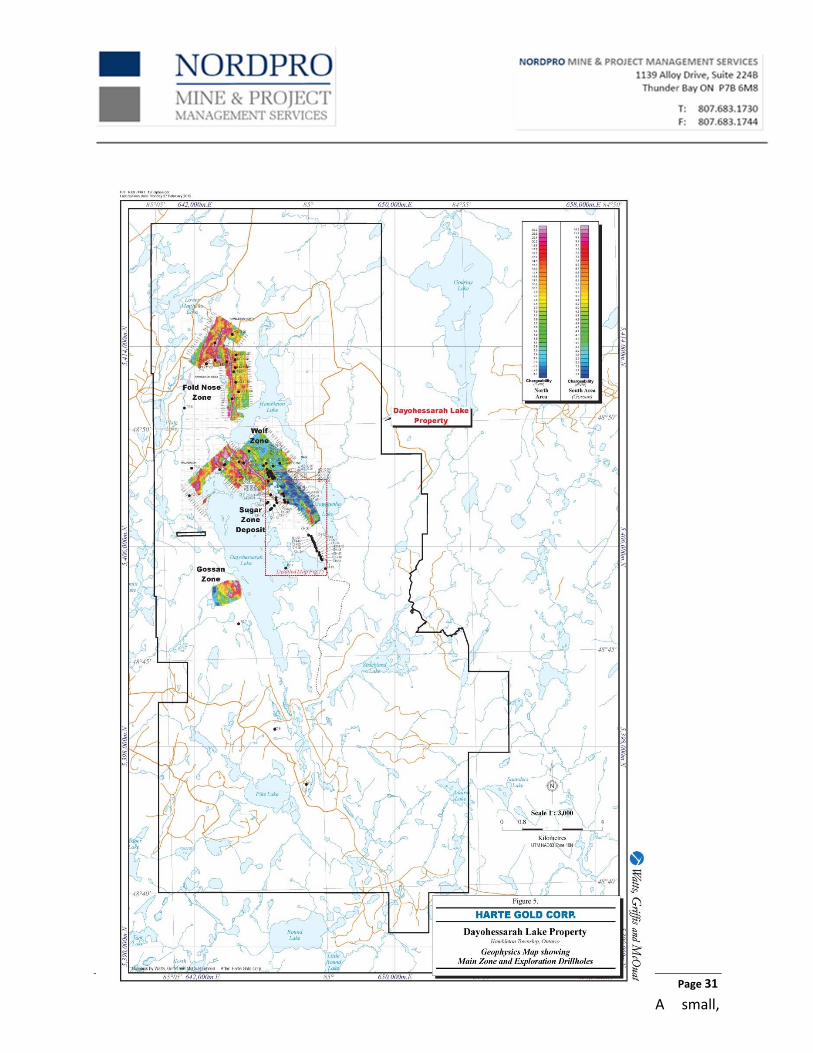
9.0 EXPLORATION WGM has relied, for our descriptions of exploration program results, solely on the basis of historic reports, notes and communications with Harte, Sharpstone and various geophysical contractors. Additional results and descriptions have been summarized in previous Sharpstone NI 43‐101 Technical Reports. Historic exploration is summarized under the History Section of this report. Harte and Corona acquired the Property in 1998. Exploration programs on the Property since 1998 have consisted mostly of diamond drilling, which is more completely summarized in Drilling Section of this report. All exploration, prior to the last NI 43‐101 Mineral Resource estimate, is summarized in the History Section of this report. In July and August of 2010, Harte Gold contracted Dan Patrie Exploration to cut a grid along the north‐eastern edge, and around the northern edge of Dayohessarah Lake, totalling 20,475 m. Ground magnetic and I.P. surveys were conducted on the grid by Dan Patrie Exploration for Harte immediately following completion of the grid. During May and June 2011, another grid totalling 60,800 m was completed over the ‘Fold Nose’ area on the northern part of the greenstone belt. Ground IP and Mag surveys were completed over this grid by JVX Ltd. for Harte. The two geophysical surveys were successful in outlining several lineal chargeable features striking parallel to the regional foliation. The chargeability results, along with the magnetic and conductivity results, were used to create targets for prospecting, as well as exploration drilling (HG holes). The main target areas are shown on Figure 5 with the location of the exploration holes drilled to date. A chargeability anomaly up‐ice of the peacock boulder was thought to be the source of the high grade gold‐bearing boulder, and lead to the discovery of the Wolf Zone. A two‐man prospecting program was undertaken between May and October 2011. A total of 180 samples were taken, including four field‐inserted gold standards, and four blanks. The prospecting focused on several targets across the Property, including a Gossan Zone on the western edge of Dayohessarah Lake, a boulder train 500 m east of the northern shore of Dayohessarah Lake, the Lynx Zone and the IP targets in the Fold Nose area. Overburden around the Fold Nose area was up to 5 m thick leaving very little outcrop and making prospecting difficult. Gold samples from the boulder train included samples of up to 14.1 g/t and 7.3 g/t.
Harte Gold Corp. – Sugar Zone Project Page 31 Preliminary Economic Assessment, May 31, 2012 A small,
Harte Gold Corp. – Sugar Zone Project Page 32 Preliminary Economic Assessment, May 31, 2012
five‐line grid was completed south of the Gossan Zone in August, 2011. The grid totalled 5,200 m running at approximately 60°. The three lines in the middle are all 1,000 m long and spaced at 100 m. The two lines on the north and south ends of the grid are 1,000 m long (north line) and 1,200 m long (south line) and are spaced at 200 m from the other lines. There is no base line in the grid. Gold samples from the Gossan Zone appeared to have high potential, and consisted of large amounts of fine grained disseminated pyrite and pyrrhotite in a strongly silicified sedimentary unit. Prospecting at the Gossan Zone returned values up to 1.1 g Au/t. Four mechanical trenches were excavated in 2010 around the discovery of the Wolf Zone. One trench was completed over the Wolf Zone and three others were made over other geophysical targets. Only the trench over the Wolf Zone uncovered significant gold mineralization. During August 30 to September 1, 2011, a helicopter‐borne geophysical survey was flown over the northern edge of Dayohessarah Lake by Geotech Ltd., at the request of Harte. The principal geophysical sensors included a versatile time domain electromagnetic (VTEM plus) system, and a caesium magnetometer. A total of 302 line km of geophysical data were acquired during the survey, and covered an area of 26.77 km2. The survey outlined five potential targets of moderate to high conductivity. The targets are mostly explained by the occurrence of large scale diabase dykes, and sedimentary systems. The survey results appear to be too large scale to pick up small discrete gold bearing systems. During August 2 to 19, 2011 a borehole detection array (pole‐dipole) and borehole directional array (gradient) IP surveys were done on the Property in the immediate area of the Sugar Zone by JVX Ltd. The surveys were conducted on 11 drillholes. A potential very large scale deep gold target was identified below 600 m vertical depth. This target is shown as a large chargeability high. The ground geophysics to date does not cover the Sugar Zone and Harte is planning on covering the Sugar Zone and across to Dayo Lake this spring with additional surface geophysical surveys.
Harte Gold Corp. – Sugar Zone Project Page 33 Preliminary Economic Assessment, May 31, 2012
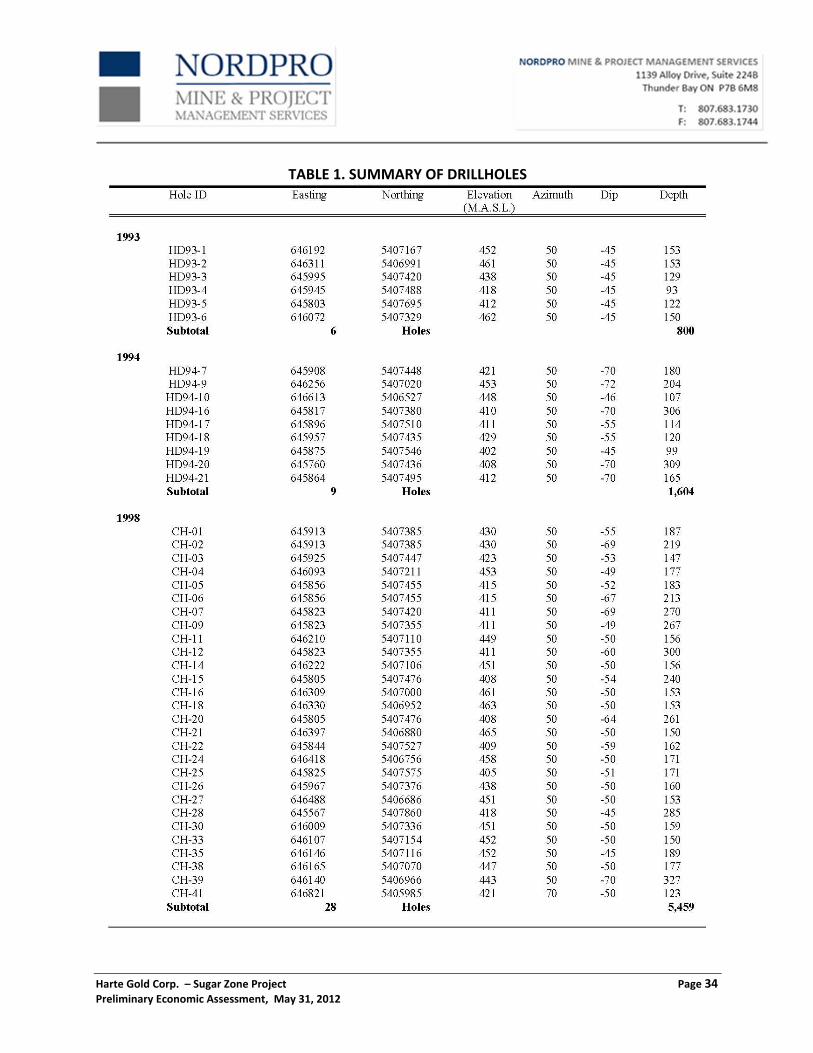
10.0 DRILLING WGM has relied for our descriptions of drilling programs and results solely on the basis of historic reports, notes and communications with Harte and Sharpstone. Additional results and descriptions have been summarized in previous Sharpstone NI 43‐101 Technical Reports. 10.1 GENERAL Drilling has primarily focused on exploration and definition of the Sugar Zone in the Dayohessarah Greenstone Belt. Drillholes were thus far designed to target the Sugar Zone based on an interpreted attitude of the vein and shear systems striking at approximately 140° and dipping between 65° and 75° to the southwest. The Sugar Zone consists of two separate gold bearing shear/vein systems called the Upper Zone and the Lower Zone. The two systems vary from 20 to 30 m apart, and are separated by barren mafic volcanic flows and mafic pillow flows. Both the Upper and Lower zones consist of sheared mafic volcanic rocks and sheared intermediate feldspar porphyry dykes. The dykes seem to run parallel or sub‐parallel to the shear. The shear zone hosts one or several dark grey quartz veinlets, often creating a quartz‐stockwork system. Most of the gold mineralization is within the quartz veinlets, and is often associated with elevated sulphide mineralization, especially galena and sphalerite. Currently, the Lower Zone hosts higher grade gold mineralization than the Upper Zone. The true widths of the zones range from less than 1 m (diluted out for the Mineral Resource estimate to 1.5 m minimum horizontal width) to about 6 m, with the Lower Zone overall averaging slightly wider than the Upper Zone. Table 10‐1 summarizes the location, azimuth, dip and depth of all diamond drillholes completed in the Sugar Zone area; the majority of which were used in the current Mineral Resource estimate. Additional drilling has been completed in separate 2010 and 2011 diamond drill programs in areas on the Property other than on the Sugar Zone. All of the drilling on the Property, from 1993 to present, is presented below.
Harte Gold Corp. – Sugar Zone Project Page 34 Preliminary Economic Assessment, May 31, 2012
TABLE 1. SUMMARY OF DRILLHOLES
Harte Gold Corp. – Sugar Zone Project Page 35 Preliminary Economic Assessment, May 31, 2012
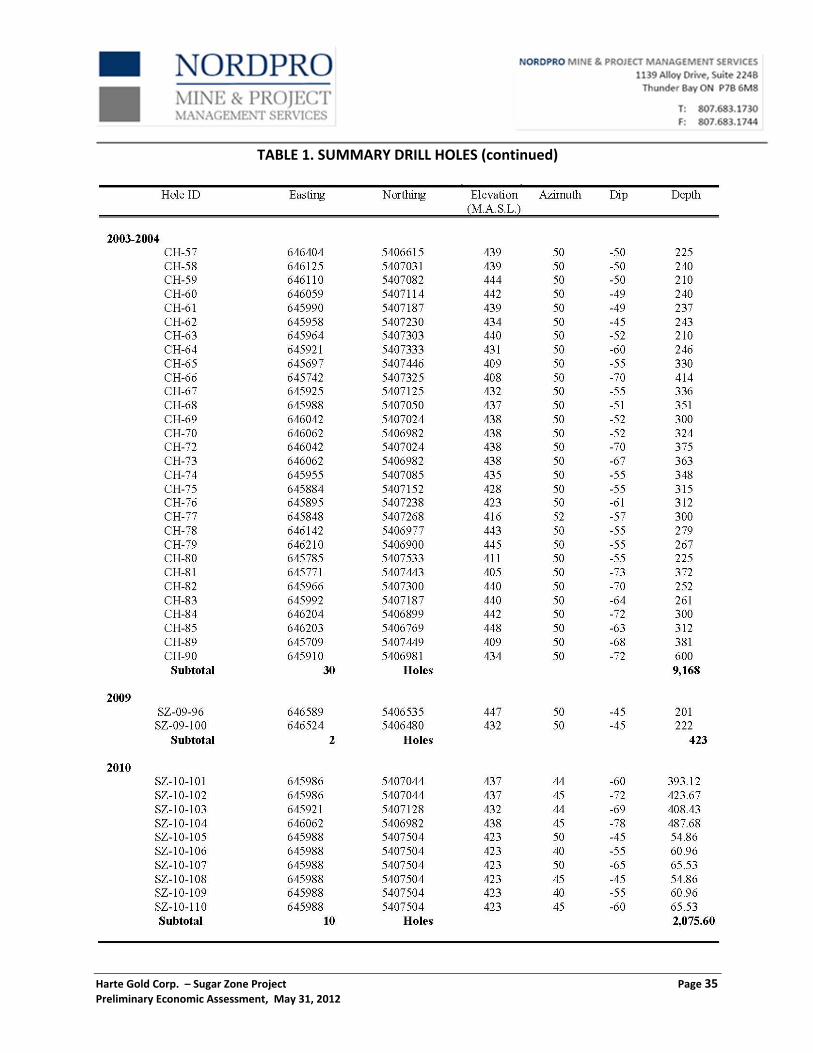
TABLE 1. SUMMARY DRILL HOLES (continued)
Harte Gold Corp. – Sugar Zone Project Page 36 Preliminary Economic Assessment, May 31, 2012
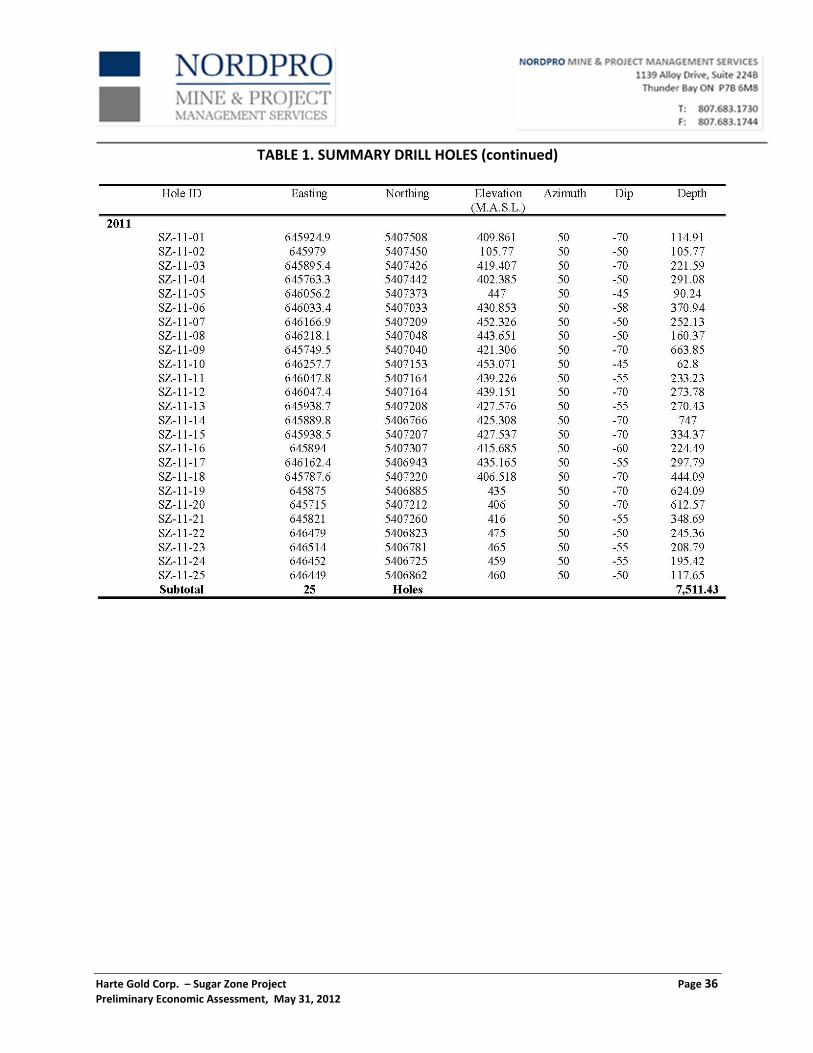
TABLE 1. SUMMARY DRILL HOLES (continued)
Harte Gold Corp. – Sugar Zone Project Page 37 Preliminary Economic Assessment, May 31, 2012
10.2 PRE‐1993 DRILLING WGM has not reviewed pre‐1993 drilling on the Property, however, this drilling is summarized in the History Section of this report. No pre‐1993 drillholes are used for the current Mineral Resource estimate.
10.3 HEMLO GOLD MINES INC. 1993 TO 1994 DRILLING Six (6) diamond drillholes were drilled by Hemlo targeting the Sugar Zone between September 17 and September 25, 1993. Fifteen (15) more diamond drillholes were completed between September and October, 1994 by Hemlo, of which nine (9) targeted the Sugar Zone. The drilling was done by Chibougamau Diamond Drilling Inc. All of the diamond drillholes are NQ sized. The diamond drill core from within the Sugar Zone is currently being stored at the Harte core logging facility in White River, ON and the rest of the core is currently stored in pallets along Road 305, north of the Sugar Zone. All core samples were sent to Chemex Laboratories Ltd., which is was changed to ALS Chemex Laboratories Ltd., and more recently to ALS Minerals Ltd. (“ALS”), Vancouver, B.C. All samples were assayed for gold using a fire assay using lead collection and an AAS finish. All drillhole collars were spotted in reference to the nearest picket on a recently cut grid of 100 m spaced lines oriented at 50°. WGM has no information on how or if down‐hole surveys were completed. The drillhole collars were located and recorded by Harte personnel with a Trimble 3000 GeoXT, in December of 2011, in order to locate the drill collars with sub‐meter accuracy.
10.4 CORONA‐HARTE 1998 TO 2009 DRILLING
10.4.1 General
A total of 100 NQ diamond drillholes were drilled by Corona over three diamond drill program phases between 1998 and 2009. All of the drilling was carried out by Chibougamau Diamond Drilling, QC. Field supervision and logging for all four diamond drill programs was mostly carried out by David S. Hunt, P. Geo., of Sharpstone. The diamond drill core prior to 2009 from the within the Sugar Zone is currently being stored at the Harte core logging facility in White River, ON. The remainder of the core is currently stored in pallets along Road 305, north of the Sugar Zone. All the diamond drill core from the 2009 program is currently stored at the core logging facility in White River. All core samples were sent to Accurassay.
Harte Gold Corp. – Sugar Zone Project Page 38 Preliminary Economic Assessment, May 31, 2012
All drillhole collars were spotted in reference to the nearest grid line picket. The drillhole collars were located and recorded by Harte personnel with a Trimble 3000 GeoXT, in December of 2011, in order to locate the drill collars with sub‐meter accuracy. The drill was oriented using a Brunton compass by the supervising geologist, and down‐hole surveys were taken at 50 m intervals using a Reflex E‐Z Shot single shot unit by the drillers. The programs are subdivided below into separate sections.
10.4.2 1998 Diamond Drill Program
During the period of October 24 to December 8, 1998, a total of 9,937.0 m of drilling was completed in 53 holes on the Dayohessarah Lake property, including 28 diamond drillholes which targeted and intersected the Sugar Zone. The purpose of the program was to test the Sugar Zone ‘Resource Area’ at pierce point spacings of 50 m, along a 3 km strike length at shallow depths and to test previously untested IP anomalies west of the Sugar Zone. An initial Mineral Resource estimate of the Sugar Zone was prepared by David Hunt after the completion of the 1998 program.
10.4.3 2003‐2004 Diamond Drill Program
During the period of November 30, 2003 to March 18, 2004, a total of 7,100 m of drilling was completed in 26 holes on the Dayohessarah Lake property, including 22 diamond drillholes which targeted and intersected the Sugar Zone. The purpose of the program was to follow up on results obtained by the extensive surface and diamond drilling exploration carried out in 1998. The program was designed to test the strike and dip extensions of mineralization in two previously defined high grade shoots, and to collect data to be used in an updated Mineral Resource estimate for the Sugar Zone. The estimate of the Sugar Zone was revised by David Hunt after the completion of the 2003‐04 drilling program.
10.4.4 2004 Diamond Drill Program
During the period of October 13 to November 26, 2004, a total of 3,588 m of drilling was completed in 11 holes on the Dayohessarah Lake property, including 8 diamond drillholes which targeted and intersected the Sugar Zone.
Harte Gold Corp. – Sugar Zone Project Page 39 Preliminary Economic Assessment, May 31, 2012
The purpose of the program was to follow up on results obtained by the extensive surface and diamond drilling exploration carried out in the 1998 and the 2003‐04 diamond drilling programs. The program was designed to improve the economics of the Sugar Zone deposit by increasing the Mineral Resources at depth to approximately 300 m, and to collect data to be used in an updated Mineral Resource estimate for the Sugar Zone. The estimate of the Sugar Zone was revised by David Hunt after the completion of the 2004 drilling program.
10.4.5 2009 Diamond Drill Program
During the period of March 26 to April 20, 2009, a total of 2,007 m of drilling was completed in 10 holes on the Dayohessarah Lake Property, including two diamond drillholes which targeted and intersected the Sugar Zone. The drilling was carried out by Chibougamau Diamond Drilling, QC. Field supervision and logging was mostly carried out by David S. Hunt, P. Geo., of Sharpstone. The purpose of the program was to test both the northern and southern extensions of the Sugar Zone in an attempt to extend the strike length of the Mineral Resource area. Diamond drillholes SZ09‐90 to SZ09‐95 were drilled north of the Sugar Zone and did not intercept any significant gold mineralization, and SZ09‐96 to SZ09‐100 were drilled south of the Sugar Zone. Only drillholes SZ09‐96 and SZ09‐100 were targeted in the Sugar Zone proper and all the other holes did not intercept strong gold mineralization and were outside the northern or southern extents of the current Mineral Resource estimate.
10.5 HARTE GOLD 2009 TO 2011 DRILLING A total of 35 diamond drillholes were completed by Harte over three diamond drill phases between 2009 and 2011. All the diamond drill core is currently being stored at the Harte core logging facility in White River, ON and the rest of the core is currently stored in pallets along Road 305, north of the Sugar Zone. All core samples were sent to Activation Laboratories Ltd. (“Actlabs”), Thunder Bay, ON. All drillhole collars were spotted using a Garmin GPSmap 76CSx. The drillhole collars were located and recorded with a Trimble 3000 GeoXT, in December of 2011, in order to record the drill collars with sub‐metre accuracy. The drill was oriented using a Brunton compass, and down hole surveys were taken at 50 m intervals by the drillers, using a Reflex E‐Z shot. The Harte drilling programs are subdivided below into separate sections.
Harte Gold Corp. – Sugar Zone Project Page 40 Preliminary Economic Assessment, May 31, 2012
10.5.1 2010 Diamond Drill Program
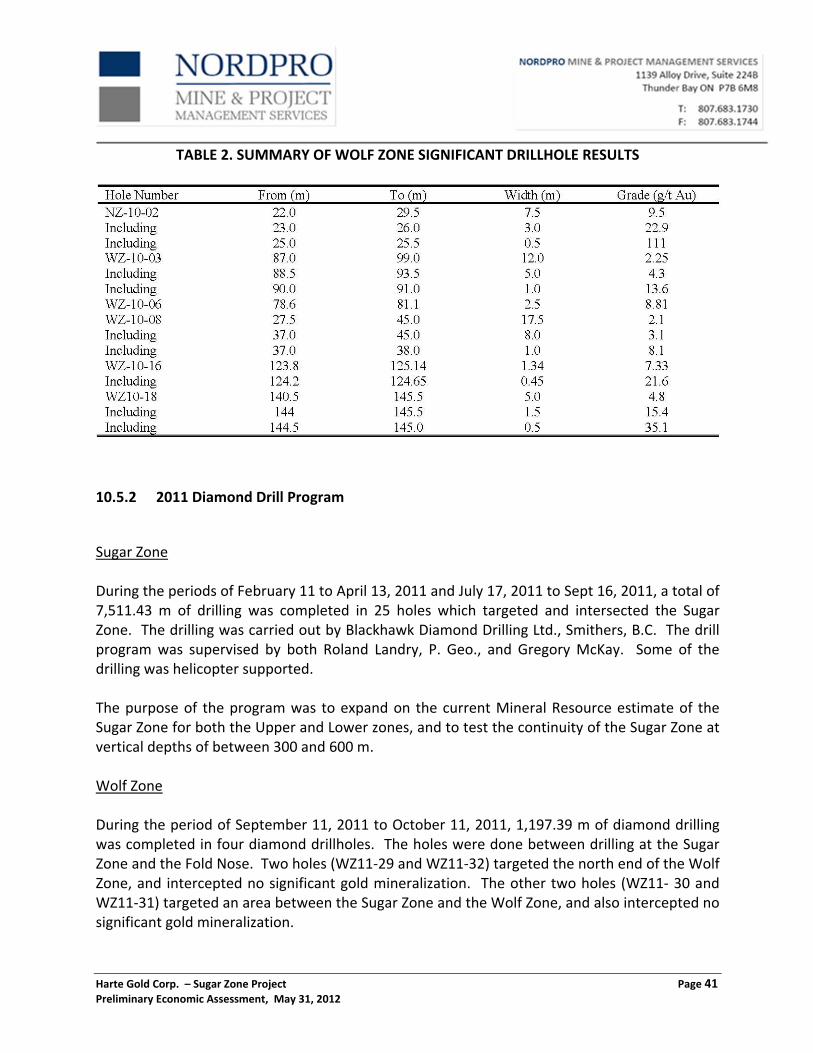
Sugar Zone During the period of March 28 to April 25, 2010, a total of 2,075.60 m of drilling was completed in 10 holes which targeted and intersected the Sugar Zone. Two additional holes were abandoned before they intersected the Sugar Zone. The drilling was carried out by More Core Diamond Drilling Services Ltd. (“More Core”), Prince George, B.C. The drill program was supervised by David Hunt, P. Geo., of Sharpstone. The drilling was helicopter supported. The purpose of the program was to test previously untested areas of the mineralized zones between 300 and 600 m depth in four (4) long holes, and to test both the Upper and Lower zones a short distance below the surface; beneath surface trenches from a 1998 surface program. The Mineral Resource estimate of the Sugar Zone was revised again by D. Hunt after the completion of the 2010 program. Wolf Zone During the period of October 17 to December 12, 2010, 5,387.94 m of diamond drilling was completed in 33 diamond drillholes targeting the newly discovered Wolf Zone. The drilling was carried out by drilling contractors More Core and Ed Core. The drill program was supervised by George Flach, P. Geo., Vice‐President of Exploration of Harte, and David Power‐Fardy, P. Geo., Senior Geologist of WGM. The purpose of the program was to locate the source of the recently discovered Peacock Boulder Showing, and eventually to further explore and define the newly discovered Wolf Zone. Six (6) diamond drillholes were originally drilled (NZ10‐01 to NZ10‐06) in an attempt to locate the source of the Peacock Boulders. NZ10‐02 intersected what is now referred to as the Wolf Zone, and the hole was renamed WZ10‐01. An additional 27 holes (WZ10‐02 to WZ10‐28) were drilled, all targeting the Wolf Zone. Diamond drilling returned significant gold results in the middle of the zone, but drilling at depth, and to the northern and southern edges of the zone had less promising results. Table 2 summarizes a table of significant results from the Wolf Zone drilling.
Harte Gold Corp. – Sugar Zone Project Page 41 Preliminary Economic Assessment, May 31, 2012
TABLE 2. SUMMARY OF WOLF ZONE SIGNIFICANT DRILLHOLE RESULTS
10.5.2 2011 Diamond Drill Program
Sugar Zone During the periods of February 11 to April 13, 2011 and July 17, 2011 to Sept 16, 2011, a total of 7,511.43 m of drilling was completed in 25 holes which targeted and intersected the Sugar Zone. The drilling was carried out by Blackhawk Diamond Drilling Ltd., Smithers, B.C. The drill program was supervised by both Roland Landry, P. Geo., and Gregory McKay. Some of the drilling was helicopter supported. The purpose of the program was to expand on the current Mineral Resource estimate of the Sugar Zone for both the Upper and Lower zones, and to test the continuity of the Sugar Zone at vertical depths of between 300 and 600 m. Wolf Zone During the period of September 11, 2011 to October 11, 2011, 1,197.39 m of diamond drilling was completed in four diamond drillholes. The holes were done between drilling at the Sugar Zone and the Fold Nose. Two holes (WZ11‐29 and WZ11‐32) targeted the north end of the Wolf Zone, and intercepted no significant gold mineralization. The other two holes (WZ11‐ 30 and WZ11‐31) targeted an area between the Sugar Zone and the Wolf Zone, and also intercepted no significant gold mineralization.
Harte Gold Corp. – Sugar Zone Project Page 42 Preliminary Economic Assessment, May 31, 2012
Fold Nose A total of 3,430.93 m of NQ diamond drilling was completed in 15 diamond drillholes over two drill programs from April 6 to April 23, and October 12 to December 7, 2011. The last 11 holes were not drilled all together, but instead with some Sugar Zone and some Wolf Zone drilling between them. All of the holes targeted north striking IP chargeability anomalies to the west and north‐west of Hambleton Lake. The drillholes intercepted several sedimentary packages, with up to 10% pyrrhotite, but no significant gold mineralization was detected. All holes drilled outside of the Sugar Zone on other exploration targets are previously shown on Figure 10‐5. 10.5.3 Surveys Before the 2004 diamond drilling program the drill collar sites were located using a grid system using 100 m spaced lines running at 50°. During and after the 2004 diamond drill program, drillholes were spotted using a global positioning system ("GPS"). Casings for all of the drillholes were subsequently surveyed in 2011 by a Harte prospector using NAD 83 UTM co‐ordinates on a Trimble 3000 GeoXT device. The data was post‐processed and corrected using the CORS, Hearst Base Station. All drillholes are spotted by either a Harte prospector or a Harte field geologist. Two fore‐sites were used to spot the holes because of the configuration of the drill shack. Drillers and/or a geologist lined up the drills for azimuth. The drillers submitted daily work reports for day and night shifts for each drill rig. The drillers are in radio and/or cell phone contact with their foreman, and Harte’s Project Geologist, in case of any problems, or needs. For all drilling, Reflex EZ‐SHOT was used to test the orientation of the hole at approximately 50 m intervals down‐the‐hole. All surveys with a magnetic intensity outside of 5550 to 5700 were disregarded, and assumed to be affected by magnetic factors in rock in the immediate area.
10.6 WGM COMMENT ON HARTE DRILLING PROGRAMS Drilling before 2009‐2010 was under the supervision of Dave Hunt, P.Geo., of Sharpstone and by all accounts appears to be generally well run. These drilling programs are more completely described in the NI 43‐101 reports filed in 2010 and previously. Due to the different generations of drilling, the various techniques used to locate drillhole collars and issues encountered during the 3‐D wireframing for the Mineral Resource estimate,
Harte Gold Corp. – Sugar Zone Project Page 43 Preliminary Economic Assessment, May 31, 2012
WGM recommended that all holes should be re‐located in the field and re‐surveyed using NAD 83 UTM co‐ordinates. This was done using a Trimble 3000 GeoXT device (as described above); the results were more accurate and all holes are now done using the same base data. This was imperative for the current Mineral Resource estimate, as it was completed using 3‐D wireframing, not a polygonal method as used previously (which doesn’t require the same level of accuracy). After re‐surveying, the drill collar locations were marked with a wooden picket and labelled using a permanent marker. For the 2010 and 2011 drilling, the holes are marked with a tripod made of rebar and labelled using metal dymo tape and zip tied to the tripod. WGM suggests that this procedure be continued for all future drilling and that Harte mark and label drillhole collars immediately after drill dismount. Considering that some basalts and the diabase dyke are magnetic and the dyke passes through the Upper and Lower zones in certain areas, the traces for the drillholes that have EZ‐SHOT surveys are not optimally reliable and it is a judgement call which surveys to discard. WGM recommends that a non‐magnetic down‐hole drillhole survey system be considered for future drilling, particularly if Harte is embarking on a deep drilling program. It is understood by WGM that there is still core in the bush from previous drilling programs and this should be catalogued and stored properly, if at all possible. It is also understood by WGM that most rejects and pulps are stored in a secure trailer behind the White River field office. Also, all rejects and pulps that are currently available should be catalogued and stored for potential future re‐assaying. WGM did not review any drilling that was taking place during our most recent site visit, but during Mr. Power‐Fardy’s previous site visits, a review of the drilling practices were found to be in keeping with industry best practices. WGM has not completed a thorough review of the recent JVX down‐hole geophysical information which is to be used for future targeting purposes.
Harte Gold Corp. – Sugar Zone Project Page 44 Preliminary Economic Assessment, May 31, 2012
11.0 SAMPLE PREPARATION, ANALYSIS AND SECURITY WGM has relied for our descriptions of sample preparation and analyses solely on the basis of historic reports, notes and communications with Harte, Sharpstone and the analytical laboratories themselves. Additional descriptions have been summarized in previous Sharpstone NI 43‐101 Technical Reports.
11.1 FIELD SAMPLING AND PREPARATION
11.1.1 Pre‐1993 Drilling Programs
WGM has not reviewed any pre‐1993 program data for the Property and none of these holes have been used in the current Mineral Resource estimate. Information relating to the drilling programs between 1993 and 2011 are included in this report.
11.1.2 1993 To 2011 Core Handling and Logging Procedures
During the period September 1993 to December 2011, all surface diamond drillholes were NQ in diameter. After pulling the rods, the core is placed in wooden core boxes by the drillers. The boxes are sealed by the drillers at the drill site and delivered to the core logging facility at 128 Tukanee Lake Rd. in White River, ON, at the end of every drill shift. The core logging protocol by Harte geologists is summarized as follows:
1. A geotechnician orients the core in the core box and measures the core marking 1.0 m intervals with a green China marker; these are measured against the depth blocks inserted by the drillers at the end of every run. The core is re‐measured by the geologist that also checks that the drillers’ metre blocks are correctly placed and labelled. The meterage at the start and end of each box is also recorded on the core using a green China marker. Any lost or ground core, zones of poor RQD (i.e. <75%) or reaming are noted within the drill log;
2. After being measured, and before being logged, the core is photographed using a
digital camera, in three or four box pictures, except at the end of the hole when there are less boxes available. The pictures are then copied onto the office computer, and labelled accordingly. In each picture, the hole number, meterage and box numbers are recorded on a dry erase board centered below the bottom box of core;
Harte Gold Corp. – Sugar Zone Project Page 45 Preliminary Economic Assessment, May 31, 2012
3. The core boxes are then labelled using a metal dymo tag, which is stapled onto the left end of the box. The dymo tag label has a record of the drillhole number, box number and meterage; and
4. The core is logged in detail and recorded in a digital format using a Microsoft Excel
spreadsheet.
11.1.3 1993 TO 2011 Core Sampling Procedures
Core displaying obvious mineralization and preferable alteration is sampled. The samples are marked by the geologist using a red China marker and two sample tickets are inserted in the core box at the beginning of the sample. Depending on the lithology, alteration and mineralization, the sample widths taken are predominantly between 0.2 m to 1.1 m in length. The samples are entered on the drill logs and for each sample the percentage of quartz‐ carbonate veining and sulphide mineralization are estimated and entered on the log. Other noticeable features, such as degree of alteration, magnetism, foliation and shearing, are also recorded in the log. The samples are then cut in half by a Harte geotechnician using a Vancor diamond core saw. Any visible gold is circled using a red China marker and these samples are shown to the geologist before being placed in the sample bag. Half the core is placed in a plastic bag with a sample ticket, displaying only the sample number, and the other half is put back in the box with a duplicate sample ticket, displaying the metre interval and sample number, at the beginning of each sampled interval. The bagged samples are placed in rice bags, a lab work order is prepared and the samples are delivered via Greyhound bus shipping, or delivered in person by one of the Harte staff, to Actlabs in Thunder Bay. Samples taken prior to the 1998 diamond drilling program were sent to Accurassay in Thunder Bay.
11.1.4 2008 Core Storage and Security
All of the boxes of core from within the Sugar Zone, drilled during the 1993‐94, 1998 and 2004 diamond drill programs are stored in the core yard behind the core shack in White River, ON. The rest of the core drilled during the 1993‐94, 1998 and 2004 diamond drill programs are stored on pallets to the side of Road 305. All of the core from the 2009, 2010 and 2011 diamond drill programs is stored in the core yard behind the core shack in White River.
Harte Gold Corp. – Sugar Zone Project Page 46 Preliminary Economic Assessment, May 31, 2012
11.1.5 WGM Comment on Logging and Sampling
WGM toured the core yard (much was covered in snow) and examined the mineralized sections for five 2011 drillholes during its most recent site visit and found the core to be in good order. The drill logs have also been reviewed and WGM believes they are comprehensive and generally are of good quality and to industry standards. There are some differences between the different drilling/logging campaigns, as different geologists have been involved in the logging, but nothing that gives WGM cause for great concern, as the Upper and Lower zones appear to have been properly identified and sampled. Core descriptions in the logs reviewed by WGM were found to match the drill core. WGM also confirmed that the sample tickets in the trays were located as reported in the drill logs. The drill core sampling approach using mostly 0.2 m to 1 m long samples respecting lithological/mineralization contacts was confirmed by the core reviewed by WGM. Based on the core examined, it was noted that the core recovery was consistently good and the sampling approach was in accordance with industry best practices. The samples were found to be representative and no sampling biases were noted, but WGM suggests not going below a 20 cm sample length. Harte also has a core library or reference board with examples of rock types and mineralization in the core shack and WGM agrees that this is excellent practice to ensure standardization of logging in the future.
11.2 LABORATORY SAMPLE PREPARATION AND ANALYSIS
11.2.1 Pre‐1993 Drilling Program Laboratory Analysis
Lab analyses from all sampling programs prior to 1993 were not well documented. As a result, the lab procedures from those programs are not described in this report.
11.2.2 Laboratory Sample Preparation and Analysis
Hemlo completed diamond drilling of 21 holes on the Dayohessarah Lake Property over the course of two programs in 1993 and 1994. Of the 21 holes, 14 intersected the Sugar Zone, all at depths of less than 50 m.
Harte Gold Corp. – Sugar Zone Project Page 47 Preliminary Economic Assessment, May 31, 2012
All core samples for the 1993‐94 drilling programs were sent to Accurassay. All samples were assayed for gold using a fire assay using lead collection and an Atomic Absorption finish. If sample assays returned a value greater than 3,000 ppb Au, they were re‐assayed using a metallic screen method. Corona/Harte's 1998 diamond drilling program was designed to test the Sugar Zone “resource area” at pierce points of 50 m spacing along a 3 km strike length at shallow depths, and to test the reported ‘124 shoot’ in the Sugar Zone. Additional drilling was completed in 2004 and from 2009 through 2011, and drilling is ongoing at the time of writing this report. Actlabs was the Primary laboratory used for all of the assay work for all samples taken during and after the 2009 program. All samples were assayed for gold using a fire assay using lead collection and an AAS finish. If sample assays returned a value greater than 3,000 ppb Au, they were re‐assayed using a metallic screen method. According to Harte, there has not been significant assaying for base metals or other precious metals, including silver, on the Sugar Zone in any program due to the limited concentration and potential of these metals in the Sugar Zone. To date, there has been no Secondary lab used for check assaying of the sample pulps. For Corona’s programs prior to 2009, there were no field‐inserted Standards and/or Blanks. For Corona and Harte’s 2009 to 2011 (and current) programs, field‐inserted Certified Reference Standards and Blanks supplemented Actlabs internal Quality Assurance/Quality Control ("QA/QC") programs on Blanks and Standards (Table 3).
TABLE 3. SUMMARY OF ASSAY METHODS – 2009 TO PRESENT
In addition to the details in Table 4, as aforementioned, Actlabs internal QA/QC procedures call for the insertion of Blanks and Standards. This data has been compiled by Harte.
Harte Gold Corp. – Sugar Zone Project Page 48 Preliminary Economic Assessment, May 31, 2012
Actlabs is accredited by the Standards Council of Canada (SCC) for International Standards Organization (ISO/IEC) 17025, Mineral Analysis/geological tests (CAN‐P‐1579). The accreditation program includes ongoing audits which verify the QA system and all applicable registered test methods. Accurassay is also accredited by the Standards Council of Canada to ISO/IEC 17025 guidelines for gold analysis. Sample preparation and gold analysis procedure at Actlabs are as follows: Sample Preparation Once the samples have been received and sorted, they are given an Actlabs reference number in a file batch. The samples are then checked for dryness prior to any sample preparation and dried if needed. The samples are then crushed to 70% passing 10 mesh (2 mm) and then split into 250 g sub‐sample size using a Jones Riffle Splitter. These sub‐samples are then pulverized (using rings and pucks to 90% passing 200 mesh (0.075 mm)) and homogenized prior to analysis. Compressed air is used to clean crushers, riffles and pans between each sample to prevent any cross contamination. Random screen analysis is performed daily to check for attainable mesh size. Gold Analysis All routine gold analysis is performed using a 30 g charge by Fire Assay using lead collection with a silver inquart. The detection limit is 5 ppb Au. The beads are then digested and an Atomic Absorption finish is used. Gold Pulp Metallic Analysis Screened Pulp Metallic Analysis includes crushing of the entire sample to 90% ‐10 mesh and using a Jones Riffle to split the sample to a 2 kg sub‐sample. The entire sub‐sample is pulverized to 90% ‐150 mesh and subsequently sieved through a 150 mesh screen. The entire +150 mesh portion is assayed, along with two duplicate cuts of the ‐150 mesh portion. Results are reported as a calculated weighted average of gold in the entire sample. Gold pulp metallic analysis is carried out on samples originally assaying greater than 3 g Au/t.
11.2.3 Laboratory Quality Assurance and Quality Control
A Certified Standard and Blank assay are run with each batch of samples. In addition, a Replicate assay is run on every 10th sample to be used for checking the reproducibility of the assays. Non‐reproducible check assays are an indication of nugget problems within the sample.
Harte Gold Corp. – Sugar Zone Project Page 49 Preliminary Economic Assessment, May 31, 2012
All Standards run are graphed to monitor the performance of the laboratory. The Warning Limit is 2 times the Standard Deviation and the Control Limit is three times the Standard Deviation. Any work order with a Standard running outside of the Warning Limit will have selected re‐assays performed, and any work order with a Standard outside of the Control Limit will have the entire batch of samples re‐assayed. All QA/QC data run with each work order is kept with the client’s file. If desired, the client may have all the Blanks and Certified Standards reported on a certificate to correspond to the client’s samples. The laboratory also keeps daily log books for the sample throughput. These logs record all information pertaining to: 1) who performed the analysis; 2) when the analysis was done; 3) how the analysis was performed; and 4) what other samples were analyzed at the same time. This is done to help eliminate the possibility of misrepresentation and cross‐contamination of the samples. The Atomic Absorption instruments are calibrated using ISO traceable Calibration Standards and Quality Control Standards, created from separate solutions. The instruments are directly tied to the lab program eliminating the need for manual data entry, hence, reducing human error. Actlab internal QA/QC protocol includes analytical Duplicates and assaying of Certified Reference Standards. Figure 6 shows the results for Certified Reference Standards for gold and Table 5 summarizes statistical results for these Standards versus Certified values.
Harte Gold Corp. – Sugar Zone Project Page 50 Preliminary Economic Assessment, May 31, 2012
Figure 6. Gold assay results for Actlabs‐inserted Certified Reference Standards (2009 to 2011)
Harte Gold Corp. – Sugar Zone Project Page 51 Preliminary Economic Assessment, May 31, 2012
TABLE 4. STATISTICAL SUMMARY FOR GOLD ASSAYS FOR ACTLABS‐INSERTED CERTIFIED REFERENCE STANDARDS (2009 to 2011)
11.2.4 Additional Assaying
A total of 103 samples from the 2009‐2011 drill programs, in addition to routine assaying, were re‐assayed by Gravimetric Fire Assay and another 50 samples by the Screened Pulp Metallic method. Both gravimetric and metallic screen assaying are assaying strategies used to help mitigate the effects of coarse gold towards obtaining more representative assays. The gravimetric finish was performed for all samples which originally assayed over 3.0 g Au/t, with two exceptions (12.2 g/t and 30.1 g/t samples). The metallic screen assaying was performed on all samples which originally assayed over 10.0 g Au/t, or when there was too much of a discrepancy between the original fire assay value and the gravimetric fire assay value. In addition to this, there were 30 samples from the 2010 program which were only sampled by the metallic screen assay method, as requested by the project geologist at the time. For a gravimetric fire assay at Actlabs a sample size of 30 g is used. The sample is mixed with fire assay fluxes (borax, soda ash, silica, litharge); the flux is free of silver. The mixture is placed in a fire clay crucible, is preheated at 850º C, intermediate at 950º C and finished at 1060º C; the entire fusion process lasts 60 minutes. The crucibles are then removed from the assay furnace and the molten slag is carefully poured from the crucible into a mould, leaving a lead button at the base of the mould. The lead button is then placed in a preheated cupel which absorbs the lead when cupelled at 950º C to recover the Ag and Au. The cupellation bead is controlled in the final point by the volatile of the silver. Au is separated from the Ag in the doré
Harte Gold Corp. – Sugar Zone Project Page 52 Preliminary Economic Assessment, May 31, 2012
bead by parting with nitric acid. The gold flake remaining is weighed gravimetrically on a microbalance. For the metallic screen fire assay at Actlabs, a representative 500 g split is sieved at 100 mesh with fire assays performed on the entire +100 mesh, and 2 splits on the ‐100 mesh fraction. The total amount of the sample and the +100 mesh and ‐100 mesh fraction is weighed for assay reconciliation. Measured amounts of cleaner sand is used between samples and saved as gold may plate on the mill. The entire metallic screen is mixed with fire assay fluxes (borax, soda ash, silica, litharge) and with Ag added as a collector, and the mixture is placed in a fire clay crucible, preheated at 850º C, intermediate at 950º C and finished at 1060º C; the entire fusion process lasts 60 minutes. The crucibles are then removed from the assay furnace and the molten slag is carefully poured from the crucible into a mould, leaving a lead button at the base of the mould. The lead button is then placed in a preheated cupel which absorbs the lead when cupelled at 950º C to recover the Ag and Au. The cupellation bead is controlled in the final point by the volatile of the silver. Au is separated from the Ag in the doré bead by parting with nitric acid. The gold flake remaining is weighed gravimetrically on a microbalance. Two splits on the ‐100 mesh fraction is weighed and analyzed by fire assay with a gravimetric finish. A final assay is calculated based on the weight of each separated fraction and the values. Results for metallic screen fire assays and gravimetric fire assays compared to routine fire assays are shown in Figures 7 to 10 and in Table 5.
Harte Gold Corp. – Sugar Zone Project Page 53 Preliminary Economic Assessment, May 31, 2012
Figure 7. Comparison of Metallic Screen Assays to Original Regular / Routine Fire Assays
Harte Gold Corp. – Sugar Zone Project Page 54 Preliminary Economic Assessment, May 31, 2012
Figure 8. Relative Percent Difference Plot for Metallic Screen Fire Assays vs. Original Regular / Routine Fire Assays
Harte Gold Corp. – Sugar Zone Project Page 55 Preliminary Economic Assessment, May 31, 2012
Figure 9. Comparison of Gravimetric Assays to Original Regular / Routine Fire Assays
Harte Gold Corp. – Sugar Zone Project Page 56 Preliminary Economic Assessment, May 31, 2012
Figure 10. Relative Percent Difference Plot for Gravimetric Fire Assays vs. Original Regular / Routine Fire Assays
TABLE 5. SUMMARY STATISTICS FOR METALLIC SCREEN AND ROUTINE FIRE ASSAY PAIRS
11.2.5 Harte Quality Assurance and Quality Control
QA/QC for assays includes components initiated by Harte and also components conducted by the assay laboratories used. Actlabs is Harte’s Primary assay laboratory and carries out its own internal QA/QC programs consisting of the insertion of Duplicates and Certified Reference
Harte Gold Corp. – Sugar Zone Project Page 57 Preliminary Economic Assessment, May 31, 2012
Standards into the routine sample stream, as outlined above. Harte’s In‐field QA/QC Protocols Starting with the definition drilling program in 2009 (Hole SZ‐09‐91), Harte's QA/QC program was implemented. Harte initiated insertion of Certified Gold Reference Standards and Blanks into the sample stream at frequencies of one control sample every 25th regular/routine sample. Prior to 2011, Blank samples were ½ drill core of un‐mineralized basalt which had been previously sampled and returned a gold value below the detection limit. During and after 2011, Blanks were granite from near the intersection of Road 100 and Highway 17. The granite Blank was originally assayed by sending 20 samples to Actlabs and 20 samples to SGS Labs, Toronto, ON. All of the sampled Blanks returned assay values less than the detection limit of 5 ppb Au. These Blanks were inserted after samples that were expected to have the highest gold values; which was determined visually during logging. Figure 11 shows assay results for field‐inserted Blanks since start of program in early 2009.
Figure 11. Gold assay results for field‐inserted Blanks from 2009 to 2011
The two Blank samples in the above graph were inserted after high grade routine samples and may indicate improper cleaning between samples at the lab. WGM recommends that Harte keeps track of these blanks on a more consistent basis and reports any discrepancies immediately to the lab for a possible re‐run of the sample or the batch. The Certified Reference Standards were purchased from Actlabs. Four different field Standards have been used since the beginning of the 2009 drilling program. These control samples were
Harte Gold Corp. – Sugar Zone Project Page 58 Preliminary Economic Assessment, May 31, 2012
inserted in the field by the core logging geologist. The Standards were supplied in sealed paper pouches, and were inserted in the same plastic bags used for the core samples. The sample bags were numbered in accordance with the routine sampling scheme. The identity of the control material was not provided to Actlabs. Figure 12 shows the results of Harte’s four field‐inserted Au Standards since program reception. Table 6 summarizes the statistical results.
Figure 12. Gold assay results for field‐Inserted Certified Reference Standards from 2009 to 2011
TABLE 6. STATISTICAL SUMMARY FOR GOLD ASSAYS FOR FIELD‐INSERTED CERTIFIED REFERENCE STANDARDS (2009‐2011)
No re‐assaying was done by Harte on the basis of the results for field‐inserted Blanks and Standards. There is one Standard that did appear to give erroneous results, and WGM suggests that this is looked into. If this group/batch of assays did not return any significant values, then this is not critical, but if there are “ore grade” values in the mineralized zone in this batch, then the lab should re‐run these pulps to check the original results.
Harte Gold Corp. – Sugar Zone Project Page 59 Preliminary Economic Assessment, May 31, 2012
Outside Check Assay Program To date, there have been no pulps or rejects from the Sugar Zone assayed at a Secondary lab.
11.2.6 Sample Shipping and Security
Samples are delivered by Greyhound Shipping from White River to Actlabs in Thunder Bay. The White River core shack, where the core is stored, is surrounded by fences and locked gates are in place at all road access points to the site. 11.2.7 WGM Comments on Sampling, Assaying and QA/QC The sampling and assay programs before 2009 are covered in previous NI 43‐101 reports by D. Hunt, and appear to have included credible sampling, assaying and QA/QC components that helped to assure quality exploration data. WGM makes the following general comments on Harte’s programs and suggestions on how these issues should be addressed going forward as drilling continues:
• A more active monitoring of lab and field QA/QC results as they are received should be initiated and Harte should take the appropriate steps when assay or sample irregularities are observed. A written protocol specifying the criteria for identifying and selecting questionable sample results should be established (QA/QC failures) and a separate “tracking table” is a good method to address QA/QC issues;
• Continue to develop and document QA/QC protocols and procedures, as this was
not done to an acceptable level prior to the writing of this NI 43‐101 report;
• QA/QC protocols currently include in‐field insertion of Standards and Blanks. WGM believes Harte’s general QA/QC procedures are to industry standards, but we also note that none of the quality control materials submitted to the lab were "blind", except for the Blanks. The labs do not know the values of the Standards, so they are technically blind to the lab, but with only a few pre‐packaged Standards, any lab can eventually figure out the gold values that these Standards should return. Harte’s Blanks were also used to check for carry‐over gold in the labs, as they were also submitted after high grade samples. WGM believes this is good practice, but must be acted upon when questionable results arise. A program of second half core assaying (Field Duplicates) can also be useful for quality assurance because such samples are truly blind to the lab and these should be done on a regular/routine basis;
Harte Gold Corp. – Sugar Zone Project Page 60 Preliminary Economic Assessment, May 31, 2012
• Harte should immediately contract an outside Secondary lab to supplement and check its regular/routine assaying with Actlabs. This should be done throughout the exploration program, not done after‐the‐fact; and
• WGM recommends that Harte strives to improve its sampling and assaying database for future drilling programs and should compile all of the previous Property assay records and Certificates that can be located. The database should include all assays, not just the Finals computed from component assays, and the procedures for doing this must be clear and transparent. The database also should include results for all QA/QC materials both for Harte‐inserted materials and laboratory‐inserted materials.
These steps should be established immediately and will lead to improved quality and confidence of data. Some minor discrepancies in logging, sampling and assaying are identifiable from results returned, but WGM has not identified any material errors that delegitimize these processes and believes program results are of sufficient quality to support the Mineral Resource estimate.
Harte Gold Corp. – Sugar Zone Project Page 61 Preliminary Economic Assessment, May 31, 2012
12.0 DATA VERIFICATION 12.1 GENERAL A four day site visit (including travel) was conducted by WGM from January 17 to 20, 2012. During the site visit, Mr. Kociumbas reviewed drill logs and various maps at Harte’s exploration office in White River. Drilling completed to date, proposed drilling strategy, deposit interpretation, logging and sampling procedures were also discussed. During this site visit, independent samples were taken from five drillholes (SZ‐11‐03, 11‐05, 11‐11, 11‐15, 11‐17) from Harte’s 2011 drilling campaign. Harte’s personnel were very helpful in providing the requested information and data and assisting with the logistics of the site visit. Mr. Greg McKay, Harte’s Project Geologist, accompanied Mr. Kociumbas on his trip to the property and provided access to the drill core. The weather conditions during the recent site visit were not very conducive to extended periods outdoors, as more than a metre of snow was on the ground, the temperatures were well below ‐25ºC and the snowfall was unpredictable. However, WGM did go out to the property with Mr. McKay on the one day that it was possible. Access to the drilling sites was by 4‐wheel drive vehicle to the edge of the property and then by snowmobile on old logging roads or drill rig trails from the previous programs. The transportation of the drill rig was delayed for the start of the 2012 campaign and only arrived in White River during WGM’s visit, so we did not have the opportunity to visit the rig while it was working. Previously, Mr. Power‐Fardy was on site from October 27 to November 3, 2010 at the request of Harte to conduct a site visit to assist with the project. During this visit, Mr. Power‐Fardy reviewed reports, maps, plans and sections in the company’s procession at their exploration office at White River, ON. Mr. G. Flach, Vice‐President of Exploration for Harte, accompanied Mr. Power‐Fardy during the site visit. The visit also included an inspection of the trenches and selected drillholes and independent sampling of three old holes (CH‐39, CH‐70 and CH‐77) and one Harte drillhole (SZ‐10‐103). In all cases, the remaining ½ core was taken by WGM for our independent analysis. 12.2 COLLAR COORDINATE VALIDATION A total of four drillhole locations were found and recorded by a hand‐held GPS during WGM’s recent site visit. A fifth location was not found due to heavy snow cover. Mr. Power‐Fardy’s previous checks were done with a Garmin hand‐held GPS and compared
Harte Gold Corp. – Sugar Zone Project Page 62 Preliminary Economic Assessment, May 31, 2012
the supplied drill logs. The remaining half of the core was taken by WGM and this was noted in the core box. As a component of the verification procedure, WGM checked a random selection of assays in Harte’s database versus the Actlabs Analytical Certificates and also the database was checked against selected drill logs. During this process, a couple of errors were identified which were communicated to Harte personnel and these errors were fixed in the database for future work. No omissions were found. Mr. Power‐Fardy was also contracted by Harte from November 9, 2010 through to February 25, 2011 to assist with the ongoing exploration program. This involved multiple visits to the Property, with the work focussing on the Wolf Zone drilling campaign. The main duties included logging and sampling of the core, as well as spotting drillholes using a hand‐held GPS. Drillhole locations were selected by Mr G. Flach, Vice President of Exploration for Harte. The holes logged and sampled by WGM included WZ‐01 through WZ‐18. Samples were sent to the laboratory by Greyhound bus. After February 2011, Harte hired its own field geologists to look after the subsequent drilling on the Wolf and Sugar Zones. The recent verification samples were bagged and tagged by Mr. Kociumbas on site. The samples were then placed into a cardboard box and sealed. The samples were collected from Harte Gold’s exploration office and shipped directly to WGM’s office in Toronto by courier (Purolator). The samples were checked on arrival at the WGM office and then personally transported to AGAT Laboratories (“AGAT”) in Mississauga, ON. Mr. Power‐Fardy’s verification samples were sent to WGM’s Toronto office via courier. The samples were checked and verified upon their arrival at WGM’s office, and then were rebagged and tagged and sent to the laboratories. These verification samples were sent to two laboratories, AGAT and SGS Laboratory in Toronto, ON. Six samples (423751 – 56) were sent to SGS and 15 samples (423757 – 71) were sent to AGAT. AGAT carried out comparable sample preparation to that of Actlabs, and carried out similar assaying procedures for WGM’s verification procedure. Sample preparation for the drill core samples followed Package 200001; crushing the core sample to 75% passing 10 mesh (2 mm) sieve, splitting off 250 g and then pulverizing to 85% passing 200 mesh (0.075 mm). The samples were assayed for Au following Package 202052; using the Fire Assay (FA) method on a 30 g charge with ICP‐OES finish. For values greater than 10 g Au/t, a gravimetric finish was used (Package 202064). AGAT is accredited to ISO/IEC 17025:2005 by the Standards Council of Canada. Note that ISO 9001 certification is a generic management standard that can be applied to any business or administration. ISO 17025 was written to incorporate all the ISO 9001 requirements that are
Harte Gold Corp. – Sugar Zone Project Page 63 Preliminary Economic Assessment, May 31, 2012
relevant to the scope of testing and calibration services as well as specifying the technical requirements for technical competence. WGM Verification samples are presented in Table 8 and Figures 13 and 14.
Table WGM Verification Samples
Harte Gold Corp. – Sugar Zone Project Page 64 Preliminary Economic Assessment, May 31, 2012
Figure 13. Comparison of Original Harte assays to WGM verification assays
Harte Gold Corp. – Sugar Zone Project Page 65 Preliminary Economic Assessment, May 31, 2012
Figure 14. Relative Percent Difference Plot for Original Harte assays vs. WGM verification assays If WGM samples 423768 and 611665 are removed from the data set (both of these samples originally assayed above 200 g Au/t), then the correlation factor increases to 0.858 and the percent difference between averages drops from 53% to 14%. WGM is of the opinion that the difference in the values is caused by the “nugget effect” and the variance in assays from one half of the core to the other. This can be typical of the type of gold mineralization in the Sugar Zone, where there is coarse gold particles present. Many of the drillholes contain visible gold in the quartz veins and WGM also identified gold specks and blebs in the core reviewed on site. WGM’s sampling results generally corroborated those obtained by Harte and we conclude that the Harte sampling programs and assaying results are generally reliable and suitable for Mineral Resource estimates
Harte Gold Corp. – Sugar Zone Project Page 66 Preliminary Economic Assessment, May 31, 2012
13.0 MINERAL PROCESSING AND METALLURGICAL TESTING
13.1 GENERAL
SGS Minerals Services (SGS) conducted laboratory testwork, in 2010, to investigate gold recovery from the Sugar Zone deposit. The testwork program consisted of preparation of a composite sample, mineralogical examination, Bond ball mill work index determination, gravity separation of gold, cyanidation of the gravity tailing and flotation of the gravity tailing followed by leaching of the flotation concentrate. The results are reported in the SGS report “The Recovery of Gold from the Sugar Zone Deposit Samples”, December 14, 2010.
13.2 SAMPLES AND MINERALOGY
The Sugar Zone composite sample was prepared by combining 109 kg of drill core sample. The gold head grade determined using the pulp metallics method was 12.3 g/t and the silver grade assayed 3.1 g/t. The average gold head grade back calculated from the testwork was 13.1 g/t. Table 0‐1 lists the samples selected for the composite and Table 0‐2 records the composite head analyses.
Table 0-1 Drill Core Samples
Drill Hole No. Interval, m Sample No.
SZ10‐105A 11.77‐14.76 259378 ‐ 259384
SZ10‐105A 35.89‐39.09 259389 ‐ 259397
SZ10‐105A 39.09‐41.76 259398 ‐ 259401
SZ10‐ 106 13.68‐14.00 259409
SZ10 ‐106 30.82‐42.87 259418 ‐ 259422
SZ10‐107 23.38‐23.92 259442
SZ10‐107 44.97‐48.03 259447 ‐ 259451
SZ10‐107 50.17‐51.09 259454 ‐ 259455
SZ10‐108 12.43‐13.83 259460 ‐ 259461
SZ10‐108 40.33‐43.60 259467 ‐ 259474
SZ10‐109 11.86‐13.92 259477 ‐ 259480
SZ10‐109 40.44‐43.23 259487 ‐ 259493
SZ10‐109 43.23‐46.44 259494 ‐ 259500
259751 ‐ 259752
SZ10‐110 12.00‐16.29 259762 ‐ 259769
SZ10‐110 42.2145.64 259777 ‐ 259784
SZ10‐110 45.64‐47.58 259785 ‐ 259787
SZ10‐110 47.58‐48.29 259788 ‐ 259789
Harte Gold Corp. – Sugar Zone Project Page 67 Preliminary Economic Assessment, May 31, 2012
Table 0-2 Composite Sample Analyses
Elements Value
Au (pulp and metallics) g/t 12.3
Au (from testwork) g/t 13.1
Ag g/t 3.1
S(T) % 1.03
S= % 1.02
C(T) % 0.15
C(g) % <0.01
Whole Rock Analysis
As % <0.001
SiO2 % 64.2
Al2O3 % 11.8
Fe2O3 % 8
MgO % 2.67
CaO % 6.43
Na2O % 1.66
K2O % 2.16
TiO2 % 0.62
P2O5 % 0.08
MnO % 0.12
Cr2O3 % 0.05
V2O5 % 0.03
LOI % 1.82
Sum % 99.6
The composite sample was composed mainly of quartz and silicate minerals. Pyrrhotite was the most abundant sulphide mineral, while native gold and electrum were the most abundant gold minerals. Based on a gold deportment study, the Sugar Zone sample is amenable to gold recovery by gravity, flotation, and/or direct leaching.
13.3 GRINDABILITY
A Bond ball mill index was determined for the composite and returned a value of 12.1 kWh/tonne (10.9 kWh/T) at a screen size of 100 mesh (149 micron), indicating a relatively soft material.
13.4 GRAVITY CONCENTRATION
A series of gravity separation tests was completed on the Sugar Zone composite sample to produce gravity tailing products for downstream testing. Each test was carried out using 10 kg of feed sample. Tests G‐1 to G‐3 were conducted at a K80 size of approximately 100 μ, while Test G‐4 was carried out at a finer K80 size of 83 μ in order to produce tailing for a bulk flotation test. Gravity recovery ranged from
Harte Gold Corp. – Sugar Zone Project Page 68 Preliminary Economic Assessment, May 31, 2012
77% to 90% in 0.07 % to 0.25% of feed weight, indicating good potential for gravity recovery of a substantial fraction of the gold.
13.5 CYANIDATION
A single cyanidation test was conducted on gravity tailings. The sample was leached at 40% solids for 48 hours and 1 g/L NaCN. The gold extraction was 85.6% for a combined gravity‐leach recovery of 98.6. The leach kinetic data suggested that gold leaching was essentially complete in 24 hours. The final leached residue contained 0.2 g/t Au and the cyanide consumption was 1.1 kg/t. An intensive cyanidation test was performed on a gravity concentrate. Gold extraction was 99.8% in approximately 4 hours. Cyanide consumption was 0.5 kg/t and the leached residue assayed 1.7 g/t gold. The results of the cyanidation tests suggest that most of the gold is relatively fine. The largest gold grain measured in the gold deportment study was approximately 500 microns in size.
13.6 FLOTATION
Four rougher, one cleaner and one bulk flotation tests were conducted. The best rougher test recovered 89% of the gold (98% gravity plus flotation) to 13.3 % of the mass, leaving 0.33 g/t Au in the residue. Further grinding to 62 microns yielded no significant improvement in results. A single cleaning test at a concentrate regrind of 30 microns yielded a recovery of about 79% (96% overall) to a weight fraction of 2%. The recovery‐weight curve is shown in Figure 0‐1.
Figure 0-1 Cleaner Flotation
Gold recovery, %
Weight %
Harte Gold Corp. – Sugar Zone Project Page 69 Preliminary Economic Assessment, May 31, 2012
13.7 CYANIDATION OF FLOTATION CONCENTRATE
A 72 hour cyanidation test on flotation concentrate reground to 83 microns, conducted at 33% solids and 1 g/L cyanide with oxygen added to maintain a dissolved oxygen concentration of 20 mg/L, extracted 98.6% of the gold (97.2 % overall) and left a residue of 0.35 g/t. Cyanide consumption was 2.23 kg/t and lime consumption 0.73 kg/t. The kinetic data recovered indicates that a leach time of 24 – 30 hours is adequate at this grind.
Harte Gold Corp. – Sugar Zone Project Page 70 Preliminary Economic Assessment, May 31, 2012
14.0 MINERAL RESOURCE AND MINERAL RESERVE ESTIMATES 14.1 PREVIOUS MINERAL RESOURCE/RESERVE ESTIMATES An initial Mineral Resource estimate of the Sugar Zone was prepared by David S. Hunt, P.Geo., of Sharpstone after the completion of the 1998 drilling program. The total Inferred Mineral Resource estimate for both the Upper and Lower zones was 429,996 tonnes with an average grade of 11.19 g Au/t, using a 3 g Au/t cutoff grade, yielding a total of 154,671 contained ounces of gold. The Mineral Resource estimate of the Sugar Zone was revised by D. Hunt after the completion of the 2003‐04 drilling program. The total Inferred Mineral Resources for both the Upper and Lower zones was increased to 904,400 tonnes with an average grade of 9.752 g Au/t, using a 3 g Au/t cutoff grade, yielding a total of 283,500 contained ounces of gold. The estimate of the Sugar Zone was again revised by D. Hunt after the completion of the 2004 program. The total Inferred Mineral Resource for both the Upper and Lower zones was increased to 953,600 tonnes with an average grade of 9.933 g Au/t, using a 3 g Au/t cutoff grade, yielding a total of 288,400 contained ounces of gold. The estimate of the Sugar Zone was last updated by D. Hunt after the completion of the 2010 drilling program (Table 10). The total Mineral Resource estimate for both the Upper and Lower zones was increased to an Indicated Resource of 1.117 million tonnes grading 8.41 g Au/t (302,000 contained oz) and an Inferred Resource of 0.417 million tonnes grading 7.13 g Au/t (95,400 contained oz).
TABLE 10. 2010 MINERAL RESOURCE ESTIMATE OF SUGAR ZONE DEPOSIT (Cutoff grade of 3.0 g Au/t)
The previous Mineral Resources of the Upper and Lower zones of the Sugar Zone deposit were estimated using a polygonal method and are based on weighted averages with a cutoff grade of 3 g Au/t over a minimum estimated true width of 1.45 m. The weighted averages commonly included high “spikes” reflecting the presence of free gold in quartz veins and
Harte Gold Corp. – Sugar Zone Project Page 71 Preliminary Economic Assessment, May 31, 2012
stringers, and include flanking, lower grade (< 3g/t Au), resulting in an average grade of at least 3 g Au/t over a minimum true width of 1.45m. In the case of mineralized intersections made up of two or more high‐grade quartz veins, samples assaying above cutoff defined each end of the interval. In cases where mineralized intervals contained only one high grade vein, the weighted average was extended by including samples assaying below the 3 g/t cut‐off in order to define a weighted average of at least 3 g Au/t over a true width of 1.45m. In rare cases, unsampled core intervals were included and given an arbitrary grade of 0.000 g Au/t. The polygons were constructed in the plane of each zone and were created by drawing a circle with a radius of 50 m (for Indicated) or 100 m (for Inferred), centered on the pierce point of each drill hole in the longitudinal section. Longitudinal sections were projected in the plane of mineralization, rather than vertically, in order to eliminate distortion of circles and polygons. In the case of overlapping circles, the polygon boundaries were drawn along the intersection point of each overlap. Polygons were digitally drawn using MapInfo and Discover software and areas of each polygon was calculated by the software. Because Inferred polygons were based on circles with 100 m radius (50 m for Indicated), the area of Inferred polygons was calculated by subtracting the area of the 50 m radius polygon for any drillhole from the area of the 100 m radius polygon for the same drillhole. The volume of each polygon was calculated by multiplying the area of the polygon by the calculated true width of the intersection. The tonnage of each resource is the product of the volume and specific gravity of the mineralized rock. This was determined to be 2.62 by Accurassay Laboratories Ltd., (Hunt and Drost, 1999). 14.2 WGM MINERAL RESOURCE ESTIMATE STATEMENT WGM has prepared an updated Mineral Resource estimate for two sub‐zones (Upper and Lower zones) in the Sugar Zone. These mineralized zones have sufficient data to allow for continuity of geology and grades. A summary of the Mineral Resources is provided in Table 11.
TABLE 11. WGM SUMMARY OF SUGAR ZONE MINERAL RESOURCE ESTIMATE (Cutoff of 3.0 g Au/t)
Harte Gold Corp. – Sugar Zone Project Page 72 Preliminary Economic Assessment, May 31, 2012
The classification of Mineral Resources used in this report conforms with the definitions provided in the final version of NI 43‐101, which came into effect on February 1, 2001, as revised on June 30, 2011. We further confirm that, in arriving at our classification, we have followed the guidelines adopted by the Council of the Canadian Institute of Mining Metallurgy and Petroleum ("CIM") Standards. The relevant definitions for the CIM Standards/NI 43‐101 are as follows: A Mineral Resource is a concentration or occurrence of diamonds, natural, solid, inorganic or fossilized organic material including base and precious metals, coal, and industrial minerals in or on the Earth's crust in such form and quantity and of such a grade or quality that it has reasonable prospects for economic extraction. The location, quantity, grade, geological characteristics and continuity of a Mineral Resource are known, estimated or interpreted from specific geological evidence and knowledge. An Inferred Mineral Resource is that part of a Mineral Resource for which quantity and grade or quality can be estimated on the basis of geological evidence and limited sampling and reasonably assumed, but not verified, geological and grade continuity. The estimate is based on limited information and sampling gathered through appropriate techniques from locations such as outcrops, trenches, pits, workings and drillholes. An Indicated Mineral Resource is that part of a Mineral Resource for which quantity, grade or quality, densities, shape and physical characteristics, can be estimated with a level of confidence sufficient to allow the appropriate application of technical and economic parameters, to support mine planning and evaluation of the economic viability of the deposit. The estimate is based on detailed and reliable exploration and testing information gathered through appropriate techniques from locations such as outcrops, trenches, pits, workings and drillholes that are spaced closely enough for geological and grade continuity to be reasonably assumed. A Measured Mineral Resource is that part of a Mineral Resource for which quantity, grade or quality, densities, shape, physical characteristics are so well established that they can be estimated with confidence sufficient to allow the appropriate application of technical and economic parameters, to support production planning and evaluation of the economic viability of the deposit. The estimate is based on detailed and reliable exploration, sampling and testing information gathered through appropriate techniques from locations such as outcrops, trenches, pits, workings and drillholes that are spaced closely enough to confirm both geological and grade continuity.
Harte Gold Corp. – Sugar Zone Project Page 73 Preliminary Economic Assessment, May 31, 2012
A Mineral Reserve is the economically mineable part of a Measured or Indicated Mineral Resource demonstrated by at least a Preliminary Feasibility Study. This Study must include adequate information on mining, processing, metallurgical, economic and other relevant factors that demonstrate, at the time of reporting, that economic extraction can be justified. A Mineral Reserve includes diluting materials and allowances for losses that may occur when the material is mined. A Probable Mineral Reserve is the economically mineable part of an Indicated, and in some circumstances a Measured Mineral Resource demonstrated by at least a Preliminary Feasibility Study. This Study must include adequate information on mining, processing, metallurgical, economic, and other relevant factors that demonstrate, at the time of reporting, that economic extraction can be justified. A Proven Mineral Reserve is the economically mineable part of a Measured Mineral Resource demonstrated by at least a Preliminary Feasibility Study. This Study must include adequate information on mining, processing, metallurgical, economic, and other relevant factors that demonstrate, at the time of reporting, that economic extraction is justified. Mineral Resource classification is based on certainty and continuity of geology and grades. In most deposits, there are areas where the uncertainty is greater than in others. The majority of the time, this is directly related to the drilling density. Areas more densely drilled are usually better known and understood than areas with sparser drilling. 14.3 GENERAL MINERAL RESOURCE ESTIMATION PROCEDURES The block model Mineral Resource estimate procedure included:
• Importing/compiling and validation of data from Microsoft Excel files to Gemcom to create a Project database;
• Generation of cross sections and plans to be used for validation of geological interpretations;
• Basic statistical and decile analyses to assess cutoff grades, compositing and cutting (capping) factors;
• Creation and validation of 3‐D wireframe models for zones with continuity of geology/mineralization, using available geochemical assays for each drillhole sample interval; and
• Generation of a block model for Mineral Resource estimates for each defined zone and categorizing the results according to NI 43‐101 and CIM definitions.
Harte Gold Corp. – Sugar Zone Project Page 74 Preliminary Economic Assessment, May 31, 2012
14.4 DATABASE Data used to generate the Mineral Resource estimates originated from Microsoft Excel files supplied to WGM by Harte personnel. A Gemcom Project was established to hold all data and to be used for the manipulations necessary for the Mineral Resource estimate. The Property drillhole database consisted of 167 drillholes with geological codes and assay results totalling 36,366.98 m of drilling. Only 99 of these drillholes were used for the current Mineral Resource estimate for zone definition and geological control. The majority of these holes intersected both the Upper and Lower zones. The remainder of the holes in the database fell outside of the defined zone, primarily to the north or south of the Sugar Zone proper and were drilled to test strike extensions of the zone. The Upper Zone had 407 raw sample intervals that averaged 0.52 m in length and 3.47 g Au/t (uncapped) and the Lower Zone had 453 raw sample intervals that had an average length of 0.47 m and graded 10.68 g Au/t (uncapped). Additional information, including copies of the geological logs, summary reports, and previous geological interpretations were supplied as hard copies or electronic files. 14.4.1 Data Validation
Upon receipt of the data, WGM performed the following validation steps:
• Checking for location and elevation discrepancies by comparing collar coordinates with the copies of the original drill logs received from the site and by comparing the topography and zone interpretation against drillhole elevations;
• Checking minimum and maximum values for each quality value field and confirming/modifying those outside of expected ranges;
• Checking for inconsistency in lithological unit terminology and/or gaps in the lithological code;
• Spot checking original assay certificates with information entered in the database; and
• Checking for gaps, overlaps and out of sequence intervals for both assays and lithology tables.
WGM identified a number of possible location issues with the both the old and new drillholes, particularly the elevations, as we were completing the 3‐D wireframing of the Upper and Lower zones. Due to these location issues, WGM requested that Harte go back into the field
Harte Gold Corp. – Sugar Zone Project Page 75 Preliminary Economic Assessment, May 31, 2012
to re‐survey every hole with a Trimble (summarized in Section 10 of this report). All the holes in the current Mineral Resource estimate were located in the field. These have now been permanently marked by either a wooden picket or a tripod made of rebar. This improved the 3‐D geological interpretation considerably, as the elevation measurements of all the holes are now done with the same instrument and have the same accuracy. A couple of the old holes actually moved from one section to an adjacent section, so there was also a lateral movement, as well as a horizontal movement, for some holes. WGM now has greater confidence in the drillhole locations as contained in the database. The assay table supplied to WGM contained a couple of errors when compared to a select number of drillhole logs for previous drilling. For the pre‐Harte drillholes (Hemlo and Corona), there currently appears to be no way of checking the database against original Certificates, however, WGM has requested that Harte makes every effort to try to locate these previous Certificates in order to further validate the older data. Some gaps or missing intervals identified were due to unsampled / unassayed intervals outside of the mineralized zones. After the identified errors in the database were corrected, the database was deemed appropriate for use in the subsequent Mineral Resource estimate. WGM is of the opinion that any other errors that are possible from older drilling programs would not have a materially significant impact on the Mineral Resource estimate.
14.4.2 Database Management
The drillhole data were imported into a Gemcom multi‐tabled workspace specifically designed to manage collar and interval data. The line work for the geological interpretations and the resultant 3‐D wireframes were also stored within the Gemcom Project. The project database stored cross section and level plan definitions and the block models, such that all data pertaining to the project are contained within the same project database. A copy of the project database is stored on WGM's servers in Toronto.
14.5 GEOLOGICAL MODELLING PROCEDURES
14.5.1 Cross Section Definition
Vertical sections were defined for the Sugar Zone perpendicular to the general strike of the mineralization and were used by WGM and Harte geologists for cross sectional interpretation. The drilling for zone definition was conducted on cross sections that had a spacing that varied from about 40 m to 55 m, but most drilling was conducted on 50 m spaced sections. On section, the drillhole spacing was variable, but in the top 300 to 350 m, the zones were
Harte Gold Corp. – Sugar Zone Project Page 76 Preliminary Economic Assessment, May 31, 2012
intersected by drillholes from 50 m to 100 m apart down dip; the closer spaced drilling was nearer to surface (generally in the upper 200 m). In total, 17 southeast‐looking vertical sections, primarily at 50 m spacing, were defined for the mineralized zones. Figure 15 shows the drillhole locations and cross section locations for the Sugar Zone.
14.5.2 Geological Interpretation
WGM digitized 3‐D interpretations of the identified mineralized zones from the generated cross sections and these were used as the basis to define the boundaries of the Upper and Lower zones based on logged geology, alteration, mineralization and a deemed cutoff grade (Figure 16). For the older drillholes, most of the zone intervals originated from Dave Hunt’s 2010 Mineral Resource estimate, but many were adjusted based on cutoff grade, horizontal mining width or a revised interpretation based on new drilling information. The Upper and Lower zones are fairly predictable and “well behaved” in a geological sense and infill drilling has shown that the zones are intersected approximately where anticipated with very few surprises. For the most part, the zones are easily recognized and logged in drill core based on mineralization, alteration, sulphide content and silicification. Higher grade intersections are also usually visually picked out based on quartz, sulphides and the presence of visible gold. WGM also digitized the boundaries of a sub‐vertical diabase dyke that cuts through the Upper and Lower zones along most of the strike length of approximately 700 m. The dyke was not intersected in many holes, so its location, attitude and width are not very well understood for the entire length of the Sugar Zone. This will need to be further investigated during the next phases of drilling and development, as when the dyke was intersected in the drilling at the anticipated zone location (less than five holes), it completely obliterates the mineralization in the zone. There appears to be little or no movement of the zones by the late emplacement of this barren dyke. However, about halfway along the strike length of the Sugar Zone to the northwest, the dyke appears to take a turn or is offset by about 50 to 60 m to the southwest, and it moves more into the centre of the zones. This is where the best information is gained about the orientation and thickness of the dyke, as it is intersected in more holes in this area. The southeast trace of the dyke appears to be only cutting through the upper parts of the zones, but again, the location of the dyke is not precise in these areas. This will be important for mine planning and development, as the attitude and thickness of the dyke appears to be variable and will have an effect on the mine planning and possibly mining dilution. The wireframed zone interpretations and the corresponding polylines used in their generation were imported into Gemcom and each was assigned an appropriate rock code. WGM verified that the digitized lines were 'snapped' to drillhole intervals to anchor the line which allows for the creation of a true 3‐D wireframe that honours the 3‐D position of the drillhole interval.
Harte Gold Corp. – Sugar Zone Project Page 77 Preliminary Economic Assessment, May 31, 2012
Harte Gold Corp. – Sugar Zone Project Page 78 Preliminary Economic Assessment, May 31, 2012 Any
Harte Gold Corp. – Sugar Zone Project Page 79 Preliminary Economic Assessment, May 31, 2012
discrepancies or interpretation differences between Dave Hunt’s original interpretation and those of WGM were discussed with Harte technical personnel and agreed upon before finalizing the interpretation to be used for the Mineral Resource estimate. The majority of the discussions centred around minimum horizontal widths and actual zone identification, particularly at depth. In contrast to the 2010 estimate, a minimum horizontal width of 1.5 m was used for defining the current Upper and Lower zones, as opposed to an estimated 1.45 m true width. Zone boundaries were digitized from drillhole to drillhole that showed continuity of strike, dip and grade, generally from 50 to 120 m in extent. Some dip projections were extended quite a bit further on sections (more than 200 m), especially at depth as there was relatively little drilling information. As both the Upper and Lower zones are quite regular in orientation and more or less mirror each other, WGM felt confident (from a geological perspective) in projecting these zones further if there was supporting drillhole information on adjacent cross sections. Obviously, the largest unknown would be the grade in these cases. Internally, i.e., in the upper 250 to 300 m, the continuity of the zones was observed to be very good. In general, extensions of the boundaries were made consistent with the trends defined by joining known boundaries and with information used from adjacent cross sections. The Sugar Zone mineralized zones are for the most part discrete and can be identified relatively easily, however, there can also be more than one intercept within the same general area of a mineralized section of the drillhole, so care must be used when correlating the zones. WGM used a nominal 0.50 g Au/t cutoff to determine the zone outlines for continuity purposes, but this general rule was applied on a case by case basis and was a fairly manual effort. Most bounding assay intervals used to define the zones were much higher grade than 0.50 g Au/t, however, some lower grade intercepts were used internally as internal dilution to ensure zone continuity in weaker parts of these zones. WGM also used the 3‐D interpretation of the diabase dyke to "overprint" the defined Upper and Lower zones as the final step in order to subtract this barren material from the Mineral Resources. Figure 17 illustrates the 3‐D models of the defined zones used for the Mineral Resource estimate. As previously recommended by WGM in Section 10 of this report, old core (and pulps, if available) from pre‐Harte drilling campaigns should be located, properly catalogued and stored. There are some instances when the sampling in these old holes was very sparse and it is clear that only the visually obvious and higher grade mineralized intervals were sent for assaying. In most cases, these sampled zones are near surface and sometimes below a
Harte Gold Corp. – Sugar Zone Project Page 80 Preliminary Economic Assessment, May 31, 2012
minimum mining width and WGM had to dilute these intervals out to an appropriate width at zero grade. If this core is available, “shoulder samples” should be taken on each side of these zones, regardless of whether or not they appear visually to be mineralized.
14.5.3 Topographic Surface Creation
A topographic surface or triangulated irregular network ("TIN") was generated by WGM from the most recent Trimble GPS survey of the collars. This was not seen as being crucial for this stage of the Mineral Resource estimate, as the zones are going to be mined by underground methods, however, a more detailed topographic survey should be completed for future Mineral Resource estimates and subsequent mine planning.
Harte Gold Corp. – Sugar Zone Project Page 81 Preliminary Economic Assessment, May 31, 2012
14.6 STATISTICAL ANALYSIS, COMPOSITING, CAPPING AND SPECIFIC GRAVITY
14.6.1 Back‐coding of Rock Code Field
The 3‐D solids that represented the interpreted mineralized zones were used to back‐code a rock code field into the drillhole workspace. Each interval in the assay table was assigned a new rock code value based on the rock type solid that the interval midpoint fell within.
14.6.2 Statistical Analysis and Compositing
There were 99 Upper Zone composite intervals identified for the current Mineral Resource estimate that averaged 2.15 m in length and 2.11 g Au/t (uncapped). The Lower Zone had 93 intervals identified that had an average length of 2.27 m and graded 7.00 g Au/t (uncapped). In order to carry out the Mineral Resource grade interpolation, a set of equal length composites of 0.5 m was generated from the raw drillhole intervals within each zone composite, as the original assay intervals were different lengths and required normalization to a consistent length. A total of 951 equal length composites were generated for the two zones. Table 12 summarizes the statistics of the 0.5 m composites inside the defined mineralized envelopes which were used for the Mineral Resource estimate. For our analysis, WGM examined the Upper and Lower zones separately. Some of the histograms resulting from this study are illustrated in Figures 18 to 20.
TABLE 12. Basic Statistics of 0.50 m Uncapped Composites
Notes: 1) *Co‐efficient of Variation
2) Upper Zone Capped at 30 g/t, Average = 2.34 g/t , C.O.V. = 2.29
3) Lower Zone Capped at 50 g/t, Average = 6.20 g/t, C.O.V. = 1.89
Harte Gold Corp. – Sugar Zone Project Page 82 Preliminary Economic Assessment, May 31, 2012
Figure 18. LOG normal histogram, Au composites Upper & Lower Zones (Uncapped)
Harte Gold Corp. – Sugar Zone Project Page 83 Preliminary Economic Assessment, May 31, 2012
Figure 19. LOG normal histogram, Au composites within Upper Zone (Capped)
Harte Gold Corp. – Sugar Zone Project Page 84 Preliminary Economic Assessment, May 31, 2012
Figure 20. LOG normal histogram, Au composites within Lower Zone (Capped)
Harte Gold Corp. – Sugar Zone Project Page 85 Preliminary Economic Assessment, May 31, 2012
14.6.3 Grade Capping
The statistical distribution of Au shows good lognormal distribution and both the Upper and Lower zones exhibit similar behaviour of grade distributions. Considering the nature of the mineralization and the continuity of the zones, WGM studied various capping levels for the zones together and individually. Grade capping, also sometimes referred to as top cutting, for assay grades is commonly used in the Mineral Resource estimation process to limit the effect (risk) associated with extremely high assay values since high‐grade outliers can contribute excessively to the total metal content of the deposit. Philosophies or approaches to establishing and using a grade cap is variable across the industry and includes, for example, not using grade caps at all, arbitrarily setting all assay grades greater than 1 oz/ton to 1 oz/ton, choosing the grade cap value to correspond to the 95th or 98th percentile in a cumulative distribution, evaluation of Mean Grades + multiple levels of Standard Deviations, Decile Analysis and the evaluation of the shape and values of histograms and/or probability plots to identify an outlier population. Another rule of thumb is to set the capping level to lower the top 10% of the metal content in the deposit. A decile is any of the nine values that divide the sorted data into ten equal parts so that each part represents one tenth of the sample or population. Typically, in a decile analysis, capping is warranted if the:
1. last decile has >40% of metal. 2. last decile contains >2.3 times the metal quantity contained in the one before
last. 3. last centile contains >10% of metal. 4. last centile contains >1.75 times the metal quantity contained in the one before
last. WGM assessed most of these techniques and determined that capping was warranted for the estimation of Au grades for the Sugar Zone to reduce the potential risk of grade “distortion” or undue influence from higher grade assays. WGM determined that capping was more appropriate for the 0.5 m composites, as opposed to the raw assay intervals, as the raw interval lengths were too variable and we were of the opinion that sample length normalization should be completed first. The capping levels were set to 30 g Au/t for the lower grade Upper Zone and 50 g Au/t for the higher grade Lower Zone. The net result of WGM’s capping of Au for the Mineral Resource estimate at a 3.0 g Au/t cutoff grade was to reduce the Indicated Resource Au grade and contained metal by 13.9%, and to reduce the Inferred Resource Au grade and contained metal by 15.8%.
Harte Gold Corp. – Sugar Zone Project Page 86 Preliminary Economic Assessment, May 31, 2012
14.6.4 Density/Specific Gravity
The specific gravity ("SG") was previously determined to be 2.62 by Accurassay (Hunt and Drost, 1999). According to Hunt, the SG was “measured directly from drill core within mineralized zones in the 124 Shoot and 130 Shoot areas”. WGM does not have any original correspondence on this work and we have no idea which actual core sections were analyzed. WGM used a constant value of 2.62 for the current Mineral Resource estimate, as no additional data was available to WGM. We strongly recommend that Harte completes more SG tests representing the different rock types and representative mineralization. The majority of the determinations can be via the pulp density method and these are done using a pycnometer (water or gas comparison). This method gives good results if the rock is competent with no vugs or voids, and this should be the case for the majority of Sugar Zone rocks. The pycnometer measurements are done at the same time as the routine assaying using a sub‐portion of the pulp. SG determinations can also be done on previous reject samples if the pycnometer method is used. A select number of bulk densities should also be done using the weigh in air/weigh in water method. WGM recommends that they be completed on entire routine sample lengths using the ½ split core before crushing so the SG can be directly compared to the resultant assay for that sample. A pycnometer reading should also be taken of the same sample for comparison purposes. Also samples should be tested outside the mineralized zones to get SG information for the unmineralized host rock and the main diabase dyke. This may be important for future mining studies when assessing dilution. WGM also recommends that the SG results, like all assays, should also be stored in an assay database table for ease of use and comparison purposes. 14.7 BLOCK MODEL PARAMETERS, GRADE INTERPOLATION AND CATEGORIZATION OF
MINERAL RESOURCES The Mineral Resources have been estimated using the Inverse Distance Cubed ("ID3") estimation technique. ID belongs to a distance‐weighted interpolation class of methods, similar to Kriging, where the grade of a block is interpolated from several composites within a defined distance range of that block. ID uses the inverse of the distance (to the selected power) between a composite and the block as the weighting factor.
Harte Gold Corp. – Sugar Zone Project Page 87 Preliminary Economic Assessment, May 31, 2012
For comparison and cross checking purposes, ID2 and ID10 (which closely resembles a Nearest Neighbour ("NN") technique) were also used. In the NN method, the grade of a block is estimated by assigning only the grade of the nearest composite to the block. All interpolation methods gave similar global results, but had local differences. The grades were very well constrained within the wireframes, and the results of the interpolation approximated the average grade of the all the composites used for the estimate. 14.7.1 Block Model Setup/Parameters
The block model was created using the Gemcom International Inc.’s (“Gemcom”) software package to create a grid of regular blocks to estimate tonnes and grades. The deposit specific parameters used for the block modelling are summarized below. The block sizes used were:
Width of columns = 1.0 m
Width of rows = 3.0 m Height of blocks = 1.0 m
The specific parameters for each block model are as follows:
• Easting coordinate of model bottom left hand corner: 646200.00 • Northing coordinate of model bottom left hand corner: 5406750.00 • Datum elevation of top of model: 480.00 m • Model rotation: 42.00 • Number of columns in model: 500 • Number of rows in model: 330 • Number of levels: 800
14.7.2 Grade Interpolation and Variography
Variograms for both the Upper and Lower zones were generated in an attempt to characterize the spatial continuity of the mineralization in the defined zones, however, many areas of the deposit have very wide spacing (particularly at depth) and meaningful variograms could not be developed for these deeper areas. Since the zones are, for the most part, easily identified visually in the core and the geology and geometry is fairly well understood, the search ellipse sizes and orientation were based on this geological knowledge, as opposed to variograms. The variograms were used primarily as support for empirical observation and to assist with the categorization of the Mineral Resources. The Upper Zone shows less grade continuity than the Lower Zone and is substantially lower grade overall, however, the Upper Zone can still be identified by careful logging of the core, regardless of the grade.
Harte Gold Corp. – Sugar Zone Project Page 88 Preliminary Economic Assessment, May 31, 2012
The variograms were not used for the current grade estimation, as an ID method was used, although they indicate that the grades appear to show reasonable continuity along strike and down dip within a range of 50 to 100 m. The “nuggety” or variable nature of the mineralization will most likely not be resolved by future close spaced drilling of 25 m or less. Closer spaced drilling at depth will be expensive and impractical and may not increase confidence of grade interpolation or significantly upgrade the categorization of the Mineral Resources. Deeper drilling to better define the zones below 300 to 350 m below surface should be at a spacing of 50 to 100 m in order to be included in the Mineral Resource estimate at an Indicated categorization. Due to the nature of mineralization, WGM has decided not to categorize any of the Mineral Resources as Measured. After additional drilling is completed (which is presently ongoing), a more detailed statistical and geostatistical analysis will be done and grade Kriging (or multiple capping) will be completed to compare with the ID method for the updated Mineral Resource estimate. This may provide better local grade estimates, but it is doubtful that it will have much effect on the global resource numbers. The following lists the Au grade interpolation parameters:
• ID3 Search Ellipsoid: ‐ 400 m in the dip (SW) direction
‐ 200 m in the strike (NW‐SE) direction
‐ 50 m in the across the deposit (thickness) direction • Minimum / Maximum number of composites used to estimate a block: 2 / 10
• Maximum number of composites coming from a single hole: 3
• Ellipsoidal search strategy was used with rotation about Z, Y, Z: 0�, ‐70�, 0�. Gemcom does not use the sub‐blocking method for determining the proportion and spatial location of a block that falls partially within a wireframed object. Instead, the system makes use of a percent model (if it is important to track the different rock type's proportions in the block – usually if there is more than one important type) or uses a "needling technology" that is similar in concept, but offers greater flexibility and granularity for accurate volumetric calculations. In this technique, all the blocks that are inside the wireframe (the user specifies the % threshold) are coded and thus are assigned the appropriate rock code and the interpolated grade. During the volumetric calculation, Gemcom's needling process reports only the volume / tonnage of the block actually within the wireframe itself, but applies the interpolated grade to that portion of the block within the wireframe / solid.
Harte Gold Corp. – Sugar Zone Project Page 89 Preliminary Economic Assessment, May 31, 2012
In this case, WGM decided not to use a percent or partial block model and used smaller blocks (1 m x 3 m x 1 m) than would be typical for this drillhole spacing. The blocks were made relatively small in all dimensions so accuracy would be maintained during the Mineral Resource tabulation and resolution of the zones would not be lost, as WGM is not sure what type of underground mining method will be used. If larger blocks were used, due to the geometry and attitude of both the Upper and Lower zones, the narrower portions of these zones may not have been properly defined by the block model vs. the 3‐D wireframes. 14.7.3 Cutoff Grade and Minimum Width
For the current Mineral Resource estimate, a minimum horizontal width of 1.5 m and a 3.0 g Au/t cutoff was determined to be appropriate at this stage of the project, and is also partially based on the three year average gold price of approximately US$1,100/oz at the time of writing this report. These parameters were chosen based on a preliminary review of the parameters that would likely determine the economic viability of an underground mining operation and comparison to similar projects in the area that are currently being mined or are at an advanced stage of study / development. As aforementioned, in some instances assay intervals that fell below the 0.5 g Au/t cutoff grade for zone definition were included in the overall zone composite in order to satisfy the minimum composite length criteria or to provide continuity of the zone for 3‐D modeling purposes. Also, internal or shoulder intervals that were not sampled were included at 0 g Au/t if required to bring the zone out to 1.5 m minimum horizontal width. 14.7.4 Mineral Resource Categorization
Mineral Resource classification is based on certainty and continuity of geology and grades, and this is almost always directly related to the drilling density, but may also be related to grade distribution and confidence in the repeatability of that assay. Areas more densely drilled are usually better known and understood than areas with sparser drilling, which would be considered to have greater uncertainty, and hence lower confidence. To categorize the Mineral Resources, WGM generated a distance model (distance from actual data point to the block centroid) and reported the estimated resources by distances which represented the category or classification. WGM chose to categorize the blocks that had a distance of 50 m or less to be Indicated category and +50 m to be Inferred category. Also, all blocks below 100 m elevation were classified as Inferred due to the lack of drilling below this elevation. The average distances for the categories for both zones were similar and are shown in Table 13.
Harte Gold Corp. – Sugar Zone Project Page 90 Preliminary Economic Assessment, May 31, 2012
TABLE 13. AVERAGE INTERPOLATION DISTANCE FOR RESOURCE CATEGORIZATION
Figures 21 and 22 show the interpolated capped gold grade blocks and categorization on cross sections 19 and 15, respectively.
Harte Gold Corp. – Sugar Zone Project Page 91 Preliminary Economic Assessment, May 31, 2012
Harte Gold Corp. – Sugar Zone Project Page 92 Preliminary Economic Assessment, May 31, 2012
Harte Gold Corp. – Sugar Zone Project Page 93 Preliminary Economic Assessment, May 31, 2012
Table 14 summarizes the categorized Mineral Resource estimate for the Sugar Zone based on a minimum horizontal width of 1.5 m and a 3 g Au/t cutoff, using a gold price of US$1,100/oz.
TABLE 14. WGM SUGAR ZONE MINERAL RESOURCE ESTIMATE BROKEN DOWN BY ZONE (Cutoff of 3.0 g Au/t)
Harte Gold Corp. – Sugar Zone Project Page 94 Preliminary Economic Assessment, May 31, 2012
Due to the uncertainty that may be attached to Inferred Mineral Resources, it cannot be assumed that all or any part of an Inferred Mineral Resource will be upgraded to an Indicated or Measured Mineral Resource as a result of continued exploration. Confidence in the estimate is insufficient to allow the meaningful application of technical and economic parameters or to enable an evaluation of economic viability worthy of public disclosure. Inferred Mineral Resources must be excluded from estimates forming the basis of feasibility or other economic studies. Table 15 shows the sensitivity analysis of the current Mineral Resource estimate using various cutoff grades. The 0 g Au/t cutoff includes all mineralization within the 3‐D wireframes (defined at a nominal 0.5 g Au/t), regardless of block grade. At this cutoff, the tonnage is almost the same for both the Upper and Lower zones, as the zones generally mirror each other. However, as the cutoff grade rises, the lower grade Upper Zone decreases more rapidly in tonnage than the higher grade Lower Zone.
TABLE 15. MINERAL RESOURCE CUTOFF SENSITIVITY
Note: Numbers may not be exact due to rounding. Visual Comparison The visual comparison of block model grades with composite grades shows a reasonable correlation between the values. No significant discrepancies were apparent from the cross sections and level plans reviewed. The interpolated grades on cross sections follow more or less the projection angles defined by the search ellipsoid which was oriented along the average dip of the Upper and Lower zones. It is possible that refining the search ellipsoid orientation by adding an additional sub‐domain in areas of shallower dip (particularly closer to surface) may provide an improvement in the grade distribution, and that should be determined during the next Mineral Resource estimate after the current drilling is completed.
Harte Gold Corp. – Sugar Zone Project Page 95 Preliminary Economic Assessment, May 31, 2012
15.0 MINERAL RESERVE ESTIMATES Due to the preliminary nature of this project, there are no Mineral Reserves on the Property.
Harte Gold Corp. – Sugar Zone Project Page 96 Preliminary Economic Assessment, May 31, 2012
16.0 MINING METHODS The Sugar Zone would be mined by underground techniques as it is close to surface, narrow vein and can be accessed via a portal. The Sugar Zone geometry and mineralized zone thicknesses of approximately 3 metres indicates a selective and lower volume mining method would be employed. The dip of the mineralized zones is approximately 70 degrees and fairly regular on strike, which means that a narrow longhole mining and shrinkage mining methods with backfill would be utilized. 16.1 UNDERGROUND MINE DESIGN The Sugar Zone would be mined at a planned production rate of 750 tonnes per day of potentially economic mineralization or 270,000 tonnes per year. The mine would be accessed by a main access ramp from surface to facilitate movement of equipment, rock, manpower and materials to and from the mine. Levels would be developed from the ramp at approximately 100 metre vertical intervals. Each level would be developed with an access from the ramp to the mineralized zone and a FW drift located in waste, over the entire length of the mineralized zone to be mined. All potentially economic mineralization would be loaded on to underground haul trucks and trucked in the ramp, to surface. The mining methods would be Alimak Vein Longhole and Shrinkage mining with hydraulic backfill. All underground maintenance and associated services facilities would be located midway of the vertical extent of the known potentially economic mineralized zone. Ventilation would utilize raises at each extremity of the mineralized zones being mined for fresh or return air and the ramp as an exhaust for return air, with a push‐pull ventilation arrangement. 16.2 GEOTECHNICAL
Mine Design Engineering (MDEng) of Kingston, Ontario, has conducted a ‘core review’ for
geotechnical assessment of rock mass conditions and subsequent preliminary stope size
estimations for the Sugar Zone. The major findings and recommendations from this study are
summarized as follows:
Harte Gold Corp. – Sugar Zone Project Page 97 Preliminary Economic Assessment, May 31, 2012
Rock mass characterization by the Q’ classification system, using geotechnical data
collected during on site core inspection, suggests that the both mineralized zones as well
as the HW, FW and inter‐zone are of good to very good quality (Q’ = 30 to 50), while the
diabase dyke is of fair to good quality (Q’ = 6.7 to 34).
It is recommended that stope face hydraulic radii not exceed the following estimations:
HRHW = 10 to 12.5, HRBACK = 7.5 to 10, and HRENDWALLS = 20. Where the dyke is adjacent to
stope faces stope face hydraulic radii should not exceed HRHW‐DYKE = 5 to 10 and
HRENDWALLS‐DYKE= 12.5 to 20.
Stope backs are not expected to require cablebolt support. For single lift stopes no HW
cablebolting is expected to be required, however for double lift stopes it is
recommended that HW cablebolting be completed from a drilling sub‐level.
Stope dimensions for maximum ore thickness of 10 m have been estimated at 21 m
strike length with 30 m sublevel intervals, or 16 m strike length with double lift stopes.
Where the HW of a stope is composed of dyke material the strike length should be
limited to 16 m for single lifts (again, assuming 30 m sublevels with 33 m inclined HW
span) and to 13 m for double lift stopes (assuming 66 m inclined HW span with HW
cablebolt ‘strip pillar’). The 30 m sublevel interval is an assumed drill accuracy limitation
and may vary depending drill hole diameter and specific equipment capabilities. Stope
dimensions can be varied but the wall hydraulic radii limitations recommended in this
report should be respected until more, higher quality geotechnical data is available.
Alimak mining may be considered as an alternate mining method. In this case 100 m
level spacing can be achieved with 35 m wide stopes provided the entire HW is
cablebolted with 8 m cables in rings spaced at 2 m (4 cables per ring). Where stope
hangingwalls are immediately adjacent to the dyke the strike span should be reduced to
30 m.
The next phase of stope design (i.e. feasibility level) will require additional geotechnical data to better refine stope geometries and mine plans. The following data acquisition is recommended:
Oriented core be drilled and geotechnically logged to assess the orientation of joint
structure in the mining area.
Material property testing should be completed, including unconfined compressive
strength, tensile strength and elastic rock mass properties (Young’s Modulus and
Poisson’s Ratio).
Further, for feasibility level stope design, three dimensional elastic numerical modelling should be conducted in order to assess the anticipated magnitude of mine induced stresses and to
Harte Gold Corp. – Sugar Zone Project Page 98 Preliminary Economic Assessment, May 31, 2012
evaluate stope sequence possibilities, sill pillar design and for siting of major underground infrastructure.
16.3 MINE ACCESS AND INFRASTRUCTURE 16.3.1 Main Access Ramp The access ramp would be developed, in the footwall, at a grade of 12.5%, to a vertical depth of approximately 650 metres. Refer to Figure 16‐1 which shows a rendering of the mine design. The ramp would be approximately 5,400 metres in length with remuck bays provided every 150 metres along the ramp. The ramp would have dimensions of 4.5 metres by 4.0 metres to accommodate the underground haul trucks travelling underground and to also provide a reasonable cross section for ventilation. Safety bays would be spaced at 30 metre intervals, as required. All major services (compressed air, water lines, electrical cables etc.) would be installed in the ramp.
Figure 16‐1. Mine Design General Arrangement Schematic.
Harte Gold Corp. – Sugar Zone Project Page 99 Preliminary Economic Assessment, May 31, 2012
16.3.2 Level Development Levels would be developed with access crosscuts from the main ramp to the potentially economic mineralized zones. The levels, at 100 metre vertical intervals, would consist of a footwall drift in waste approximately 25 metres from the potentially economic mineralization zone and running the entire strike length of the mineralized zones to be mined. Level openings would be 4.5 metres wide X 4.0 metres high. A typical level configuration is shown in Figure 16‐2. Accesses to the ventilation raises would be developed on each level. Truck loading stations would be located at junctions of the footwall drift and stope accesses. The loading area would have the backs taken down to a height to facilitate an LHD loading 20 tonne underground haul trucks. Other level development would include a small water collection sump and temporary electrical sub‐stations. Services installed on the levels would include compressed air, water and drain lines, communications leaky feeder, central blasting and power cables. All ramp and level waste development would be performed by mining contractor using 2 boom electric hydraulic drill jumbos, 4.8 m3 bucket LHD’s, 20 tonne haul trucks, scissor lift/bolters and other rubber tired diesel‐powered support equipment.
Figure 16‐2. Typical Level Plan General Arrangement.
Harte Gold Corp. – Sugar Zone Project Page 100 Preliminary Economic Assessment, May 31, 2012
16.3.3 Rock Handling Potentially economic mineralization from the stopes would be transported by LHD to a truck loading area where 20 tonne underground haul trucks would be loaded by LHD. The underground haul trucks would transport the potentially economic mineralization in the ramp to surface and dump into a surface crusher feeding a covered stockpile area. During initial development waste would be trucked in the ramps to surface and later trucks would dump waste rock directly into mined out stopes and placed as part of the backfill. 16.3.4 Manpower and Materials Handling
Manpower and materials would enter and leave the mine via the main access ramp from
surface. Personnel would travel in vehicles and/or personnel carriers to workplaces or
equipment parking areas. Materials would be moved on a services truck, equipped with a
boom crane, operating in the ramp. Materials would be transported to and placed in
designated storage areas close to mining.
16.4 MINE SUPPORT FACILITIES Other underground infrastructure would include services facilities and services supporting mining operations. 16.4.1 Mine Dewatering Water collection sumps would be located on each level. The sumps would be located near the point where the ramp and level access crosscuts intersect and would be designed to prevent water entering the ramp from the levels. Overflow drill holes from the sumps would send water to the main water collection sumps, for settling, recirculation and/or discharge from the mine. Main collection sumps would be located on the 200 Level and 650 Levels. Each main sump would be comprised of 2 dirty water and one clear water sumps. Dirty water sumps would be sub‐divided by removable timber baffle walls into 3 compartments to aid in settling of solids. The dirty water sumps would be used one set at a time, and slimes removed from the non‐operational sump with LHD’s. Water would overflow from the dirty water sumps into a clear water sump. Each clear water sump, similar in size to the dirty water sumps, would be utilized to treat and store clear water prior to recirculation within the mine or discharge. Water would be pumped
Harte Gold Corp. – Sugar Zone Project Page 101 Preliminary Economic Assessment, May 31, 2012
to a surface holding pond for underground process water or discharged to the water treatment facility on surface. 16.4.2 Maintenance Shop A mobile equipment maintenance shop would be used to perform all preventative and breakdown maintenance on mobile mining equipment. The shop would be constructed near the 200 Level, off the ramp. The shop would consist of a main shop area for one large piece of equipment or a couple of smaller units. The facility configuration would consist of an access drift leading to the main shop area, a welding area, wash bay area, parts storage warehouse, electrical room, lunchroom and supervisor’s office. The main shop area would be equipped with an overhead bridge crane. The electrical room, meeting room and office would be isolated by steel hinged doors. The lunchroom would be equipped with wooden benches and tables and the office would be equipped with computer workstations connected to the mine information management system. 16.4.3 Fuel Stations Portable self‐contained fuelling stations would be located on levels where mining equipment would be parked. The units have built in isolation doors and fire suppression. A lube bay would be included in the maintenance shop complex and be equipped with HDPE lube tanks on a steel beams and grating platform with a surrounding concrete wall, acting as a catchment basin for any leaks from the tanks. 16.4.4 Refuge Station Main refuge stations would be located on the 200 and 500 Levels. Refuge stations would be fitted with a double door entry system in concrete walls at one end. The facility would include wooden benches and tables, hand washing station and other equipment and supplies, as well as a supervisor’s desk and other associated furniture. The refuge stations would also be equipped with safety and rescue equipment. Compressed air and water lines would be connected from the mines supply system to lines inside the refuge station. The facility would be fitted with an electric heater unit and be vented through intake and exhaust ventilation ducts to the outside. 16.4.5 Explosives Storage All blasting would utilize ANFO explosives. ANFO would be delivered in bulk bags, to explosives magazines.
Harte Gold Corp. – Sugar Zone Project Page 102 Preliminary Economic Assessment, May 31, 2012
Explosives magazines would be located on the 200 and 500 Levels. The magazine entrance would include a concrete wall with doors to allow access for mobile equipment and people traffic. Both sides of the magazine would be fitted with wooden shelving on which bulk explosives bags can be placed. This magazine would require a fire suppression system. Other stick explosives would be stored in this magazine as well. 16.4.6 Detonator Magazine Detonator magazines would be located near the explosives magazines. The magazines would be equipped with suitable wooden shelving to allow stacking of detonator boxes on each side. The entrance would be blocked with timber posts and screen, with a man door in the wall. 16.4.7 Materials Storage Areas Storage areas, specially constructed for the purpose, for storing mining consumables including pipe and fittings, ground support materials, ventilation supplies, etc. would be developed on the 200 and 500 Levels. The storage areas would include shelving and low wooden racking to safely store articles. Materials and parts would be palletized or placed in specially designed containers (for bulk materials and parts) for sending underground via the ramp. Service vehicles would transport the bulk materials to the storage areas. Materials would be distributed from the storage areas to work place storage areas by service vehicles. 16.4.8 Washrooms Portable toilet units equipped with a mine toilet and small sink would be located on appropriate working levels and near to refuge stations. 16.5 SERVICES 16.5.1 Electrical Distribution Primary electrical power for the mine would be provided from the main surface substation connected to the outside powerline. The powerline would be connected to a surface substation located near to the mine portal. Power from the main substation would feed the main underground power line, a 500 mcm cable, installed in the main access ramp from surface. This power line would feed portable
Harte Gold Corp. – Sugar Zone Project Page 103 Preliminary Economic Assessment, May 31, 2012
substations located on levels central to working areas. Portable power centres would supply loads on the nearby levels and transform power down to 4160V and 600V as required. On surface, the substation would also provide 4160V feeds to drive ventilation fans and other power requirements for the underground mine surface facilities. The system would utilize a switch room/MCC panel near the ramp portal. 16.5.2 Compressed Air Compressed air would be supplied by 2 compressors in enclosures located in a small covered structure, near the ramp portal. They would provide approximately 150,000 litres per minute at a minimum pressure 8.3 bar (120 psi) to the underground mine. Each compressor would operate at half capacity to ensure one compressor could provide mine requirements when the second compressor is being repaired or maintained. The compressors would supply the main compressed air pipeline located in the main access ramp from surface. 16.5.3 Service Water The underground mine would require approximately 80 million litres of service water per year for use in drilling, dust suppression, etc. Water would be sent underground in a pipeline located in the trackless access ramp from surface. This would feed the main distribution lines on the levels, which would send water to the stope access crosscuts. Water pressures and volumes would be controlled by installing water stations, at appropriate vertical intervals within the mine, which would house a transfer station and holding tanks. 16.5.4 Mine Communications and Control Systems The mine would also have a communications network to provide voice communications and some PLC monitoring within the mine. 16.6 VENTILATION The mining operation to support the mining equipment fleet would require ventilation air volumes of approximately 163 cu. metres per second (350,000 cfm). The ventilation system would consist of a push‐pull system utilizing the ventilation raises and the main access ramp.
Harte Gold Corp. – Sugar Zone Project Page 104 Preliminary Economic Assessment, May 31, 2012
Two 3 metre diameter ventilation raises would be developed from surface to the bottom of the mine in legs and be located at either end of the levels. One raise would be an intake raise and the other an exhaust raise. High pressure fans would be located on surface on top of the exhaust raise and low pressure fans on top of the intake raise. Air would flow from the intake ventilation raise along a level, be picked up by auxiliary ventilation fans and pushed into stope overcut accesses and drawpoints and flow back out to the footwall drift. Air would travel in the footwall drift to the exhaust raise and to surface in the raise. Approximately one half of the fresh air sent underground would be split off and enter the ramp from the levels and flow up the ramp to surface. If required low pressure fans would be connected to the ramp near the portal to assist air exhaust to surface. 16.7 MINING METHOD It is envisaged that 2 mining methods would be employed to accommodate the narrow and potentially non‐uniform geometry of the deposit: Alimak Narrow Vein and Shrinkage mining. For design and costing purposes it has been assumed that each mining method will be applied to 50% of the potentially mineable resource tonnes. 16.7.1 Alimak Narrow Vein Mining Mining horizons would be developed on each main level (100, 200, 300 , 400 , 500 , 600 and 650 Levels) Each Alimak vein stope would be 30 metres along strike with 1 drawpoint per stope in the centre, from the footwall drift. An undercut over the full width and length, on the lower main level of the potentially economic mineralization block, would be developed. An Alimak raise would be driven in the centre of a stope from the undercut to the level above the stope. The raise would be screened over its entire length to facilitate drillers working in the raise. Cable bolts would be installed into the hangingwall of the stope, from the Alimak platform in the raise, to support the hangingwall. The Alimak installation would be left in the raise and a longhole ring drill installed on the work platform of the Alimak. The longhole drill would drill 70 mm horizontal drillholes (approximately 13.5 metres in length) parallel to the footwall and hangingwall of the potentially economic mineralization. Drill holes would be loaded with ANFO and Nonel detonators and blasted in horizontal slices into the undercut below. Access to stope raises to allow workers to perform drilling and blasting functions on the Alimak, would be from the level above the stope. Broken potentially economic mineralization would be mucked from the undercut by LHD’s and transported to truck loading stations.
Harte Gold Corp. – Sugar Zone Project Page 105 Preliminary Economic Assessment, May 31, 2012
Stope undercut sills would be developed to full width of the zone to be mined by 3.5 metres high. The openings would be drilled with 2 boom E/H jumbos and mucked with 3.1 cu. m. bucket LHD’s. Ground support would consist of 1.5 metre mechanical rockbolts and screen. Alimak drilling raises would be developed 3 metres in diameter using stopers and the walls of the raise supported by resin rebar or rockbolts and welded wire mesh screen. Stope mucking would utilize 3.1 cu. m. bucket LHD’s mucking in the drawpoints. The stopes would be mined in a primary/secondary sequence. Primary stopes would be those where all stope walls are in rock. Secondary stopes are those where the stope walls along strike in the ore consist of backfill. Mined out stopes would be backfilled with cemented (primary stopes) and uncemented (secondary stopes) hydraulic backfill. Dilution and Extraction Expected dilution and mining recovery for the proposed Alimak vein stope mining method would be approximately 15% and 95%, respectively, with these factors included in the mineable resources. 16.7.2 Shrinkage Mining Mining horizons would be developed every 50 metres vertical elevation. Each shrinkage stope would be 30 metres along strike with 2 drawpoints per stope, developed on 15 metre centres, from the footwall drift. An undercut over the full width and length, at the lower main level of the potentially economic mineralization block, would be developed. An Alimak raise would be driven at one end of the stope from the undercut to the level above the stope. The raise would be screened over its entire length for safety. The Alimak installation would be left in the raise and used to move men and materials to the stopes. The stope would be mined by drilling a 1.8 metre high breast with 2.4 metre long horizontal drill holes, using jacklegs. As well one or 2 rounds behind the horizontal breasting 2.4 metre upholes would be drilled by stopers in the back along the length of the stope. All holes would be drilled 57 mm in diameter. Drill holes would be loaded with ANFO and Nonel detonators and blasted in horizontal slices into the undercut below. Access to stopes, to allow workers to perform drilling and blasting functions, would be via the raises from the level above the stope. Only enough broken potentially economic mineralization would be mucked from the undercut to accommodate miners entering and working in stopes to perform
Harte Gold Corp. – Sugar Zone Project Page 106 Preliminary Economic Assessment, May 31, 2012
drilling. All potentially economic mineralization mucked from stopes by LHD’s would be transported to truck loading stations. Stope undercut sills would be developed to full width of the zone to be mined by 3 metres high. The openings would be drilled with 2 boom E/H jumbos and mucked with 3.1 cu. m. bucket LHD’s. Ground support would consist of 1.5 metre mechanical rockbolts and screen. Alimak raises would be developed 2.4 by 2.4 metres using stopers and the walls of the raise supported by resin rebar or rockbolts and welded wire mesh screen. Stope mucking would utilize 3.1 cu. m. bucket LHD’s mucking in the drawpoints. The stopes would be mined in a primary/secondary sequence. Primary stopes would be those where all stope walls are in rock. Secondary stopes are those where the stope walls along strike in the ore consist of backfill. Mined out stopes would be backfilled with cemented (primary stopes) and uncemented (secondary stopes) hydraulic backfill. Dilution and Extraction Expected dilution and mining recovery for the proposed shrinkage mining method would be approximately 5% and 95%, respectively with these factors included in the mineable resources. 16.8 POTENTIALLY MINEABLE RESOURCE The potentially mineable underground resource is estimated to be 1,584,000 tonnes at a grade of 8.1 grams Au per tonne. The tonnes and grade include an average dilution of 10 percent, for the combined
(50% each) Alimak Vein and Shrinkage Mining, at zero grade, as well as mining losses of 5%.This Preliminary Economic Assessment relies on Indicated Mineral Resources (approximately 73 percent of the total resource tonnes) but also Inferred Mineral Resources. It should be noted that the Inferred Mineral Resources are considered too speculative geologically to have economic considerations applied to them that would enable them to be categorized as Mineral Reserves. For the PEA the metallurgical recovery is based on early stage test work. Also the cost projections range in accuracy from PEA to Feasibility level. Therefore, there is no guarantee that the economic projections contained in this Preliminary Economic Assessment would be realized.
Harte Gold Corp. – Sugar Zone Project Page 107 Preliminary Economic Assessment, May 31, 2012
16.9 DEVELOPMENT AND PRODUCTION SCHEDULES The life of mine development schedule is shown in Table 16‐1. All aspects of the mining operation would be performed by mining contractors. To meet the development schedule would require a contractor to have 2 development crews performing ramp and lateral development work for one year of the pre‐production period and the first 2.5 years of operation. Following that 1 crew would be sufficient to complete development work. Contractor Alimak raise crews would also develop ventilation raises and slot raises (including cable bolting). The contractor could be expected to advance at the following rates:
Single heading – Ramp & Lateral Development 1.5 rounds or 5 m/day
Multiple Heading – Ramp & Lateral Development 2.5 rounds or 6.7 m/day
Raising 2.0 rounds or 4.8 m/day
Harte Gold Corp. – Sugar Zone Project Page 108 Preliminary Economic Assessment, May 31, 2012
Table 16‐1. Mine Development Schedule.
Heading Quantity Total Pre- Total (metres) -2 -1 Production 1 2 3 4 5 6 7 8 9 10
Harte Gold Corp. – Sugar Zone Project Page 109 Preliminary Economic Assessment, May 31, 2012
The pre‐production development period, would require approximately 1.5 years, after permitting and detailed engineering is completed. The mine production schedule is shown in Table 16‐2. The schedule is based on a production rate of 750 tpd, or 270,000 tonnes per year. This provides for a mine life of approximately 6 years, mining out the resources available.
16.10 MINING AND SERVICES MOBILE EQUIPMENT The mobile mining equipment required to develop the mine and produce 750 tonnes per day of potentially economic mineralization is presented in Table 16‐3. All equipment would be supplied by the mining contractor. As well approximately 5 to 7 Alimaks would be required in raise development and stoping operations.
Harte Gold Corp. – Sugar Zone Project Page 110 Preliminary Economic Assessment, May 31, 2012
Table 16‐3. Mining Equipment List.
Mining personnel would be transported via the main access ramp from surface, into the mine using vehicles or man carriers (carrying 6 to 8 people). During shift, personnel would primarily travel around the mine in personnel vehicles equipped with bench seats in the rear for personnel transport. These vehicles would also be used by geology, engineering and mine staff to travel throughout the mine. Materials and explosives would be transported using flatbed service vehicles equipped with a boom crane. Fuel would be transported underground in a rubber tired fuel carrier. A grader would ensure roadways are kept in good condition and that large rocks spilled from haul trucks and LHD’s are removed from travelways.
UnitQuantity
3.1 cu.m. LHD 1
4.8 cu.m. LHD 3
20 t Haul Truck 5
Development Jumbo 2
Scissor Lift 4
Grader 1
Service Truck 1
Mechanics Truck 1
Personnel Vehicles 5
Harte Gold Corp. – Sugar Zone Project Page 111 Preliminary Economic Assessment, May 31, 2012
16.11 MINE SURFACE SUPPORT FACILITIES
An explosives and detonators storage area on surface would be constructed from a series of shipping containers. The magazines would be located at least 0.5 to 1 kilometre from other buildings or facilities. The main mine power substation, located near to the mine portal would consist of a concrete pad on which an all‐weather substation would be installed, connection equipment to the main site sub‐station and switch gear to facilitate power transfer underground. A laydown area and cold storage buildings for mining supplies and equipment would also be provided near the ramp portals. 16.12 MINE MANPOWER All mine manpower except for the technical staff would be contractor employees. Manpower estimates for the mine total approximately 164 people. These numbers include mine and surface employees, mine site management, engineers and geology personnel. The direct mining manpower complement totals approximately 78 persons. Table 16‐4 shows the mining personnel complement.
Table 16‐4. Direct Mining Personnel Complement.
Position Complement
Shrinkage Miners 36
Alimak Stopes 16
Blaster 4
Blaster Helper 4
Stope Mucking LHD Operators 8
Truck Operators ‐ Average 10
Total Direct Mining Manpower 78
Harte Gold Corp. – Sugar Zone Project Page 112 Preliminary Economic Assessment, May 31, 2012
The complement for mine services is estimated to be approximately 22 persons and the maintenance department 18 persons. Table 16‐5 shows the mine services complement and Table 16‐6 the mine maintenance department complement.
Table 16‐5. Mine Services and Support Personnel Complement.
Table 16‐6. Mine Maintenance Department Complement.
Position Complement
Service Truck Operator 4
Grader Operator 2
Construction/Services Leader 2
Backfill Man 8
Lamproom/Dry Man 2
General Labourer 4
Total Mine Support Services Manpower 22
Position Complement
Leadhand Mechanic 2
Mobile Mechanic 6
Mechanics Helper 4
Electrician 2
Electrician Helper 2
Welder 1
Parts Man/General 1
Total Mine Maintenance Department Manpower 18
Harte Gold Corp. – Sugar Zone Project Page 113 Preliminary Economic Assessment, May 31, 2012
An additional approximately 30 development miners would be required to perform lateral and raise development work. Contractor staff would include a Mine Superintendent, 4 supervisors, a maintenance/Assistant Superintendent, a safety coordinator and a clerk. Technical support for the mine would be provided by the geology and engineering departments. The geology department would continue to be responsible for mapping and interpretation, sampling of production drill holes, grade control and ore reserve estimations. There would be a separate exploration group to undertake exploration work on the property and to prove up new Mineral Resources for potential mining. The engineering department would continue to be responsible for mine planning and design, production scheduling, surveying, geotechnical design, and performance statistics for the mine and any other technical requirements that support the operation. The mine owner staff complement of 8 is presented in Table 16‐7.
Table 16‐7. Mine Staff Complement.
All mine operating personnel would work two 10 hour shifts, on a 7 days on and 7 days off or 14 days on and 14 days off rotations. Mine staff would work a combination of two 10 hour shifts similar to the hourly rotations or 10 hour shifts 4 days per week.
Position Total
Complement
Mine Engineer 1
Ventilation/Surveyor Technician 2
Mine Geologist 1
Geological Technicians 4
Total Mine Staff 8
Harte Gold Corp. – Sugar Zone Project Page 114 Preliminary Economic Assessment, May 31, 2012
17.0 RECOVERY METHODS
17.1 PROCESS SELECTION AND DESIGN PARAMETERS The available metallurgical testwork indicates that the Harte deposit is readily amenable to conventional processing and that gravity concentration followed by flotation and/or cyanidation can be used to obtain relatively high gold recovery. Gravity alone is unlikely to be an economic option. The flowsheet alternatives are expected to be:
1) Gravity concentration followed by flotation, with cyanidation of both concentrates to produce doré.
2) Gravity concentration followed by flotation and shipment of a combined or separate concentrates to a smelter or toll mill. This option eliminates the use of cyanide on site and may allow an earlier startup. Some doré could be produced on site by smelting a high grade gravity concentrate.
3) Gravity concentration followed cyanidation of gravity tailings. For purposes of this scoping study a flowsheet consisting of gravity concentration followed by flotation and cyanidation of the concentrate is selected. Further testwork and a trade‐off study will be required to adequately define the most economic choice. Selected design parameters for the study are shown in Error! Reference source not found..
Table 0‐1 Selected Design Parameters
Area Parameter Value Units
Grinding Bond ball mill index 12.1 kWh/t
Grind (K80) 80 microns
Gravity Concentrate 0.1 wt %
Flotation Rougher concentrate 12 wt %
Gold recovery, gravity+flotation 97 %
Cyanidation Gold recovery 97 %
Gold recovery (overall) 94 %
17.2 PROCESS DESCRIPTION Crushed ore is ground to a K80 of 80 microns in a two stage grinding circuit at a rate of 824 t/d (273,750 t/a). A gravity recovery circuit is incorporated within the grinding circuit for recovery
Harte Gold Corp. – Sugar Zone Project Page 115 Preliminary Economic Assessment, May 31, 2012
of free gold. The gravity concentrate is leached separately and the product directed to the Merrill‐Crowe circuit. Ground product from the grinding circuit is directed to a rougher flotation circuit for recovery of gold. The rougher concentrate is reground and cleaned in one stage with the cleaner concentrate pumped to a cyanidation circuit. A conventional cyanidation ‐ Merrill‐Crowe circuit extracts and recovers gold as a precipitate. The precipitate is smelted to yield a doré product. A tailings management & storage area would be constructed near the processing plant with dams initially constructed to start the mine and the dam(s) height(s) increased during the mine life as required
Harte Gold Corp. – Sugar Zone Project Page 116 Preliminary Economic Assessment, May 31, 2012
18.0 PROJECT INFRASTRUCTURE The project is located close to a number of towns which could support and provide services to the mine workforce. This section describes the infrastructure required to support the mining operation. Infrastructure required would include:
● Upgrading of Access Road ● Powerline ● Electrical Substations and Distribution ● Site Roads ● Haul Roads ● Maintenance Shop/Offices/Dry/Warehouse Complex ● Water Supply System and Water Treatment Plant ● Landfill Site ● Sewage Disposal Site
A site plan for the project is shown in Figure 18‐1. 18.1 MINE ROAD ACCESS Approximately 20 kilometres of road requires construction or upgrade, to allow heavy truck traffic to access the site. Construction will include clearing to the required width of the right of way; placing road base, installing culverts and bridges and capping the entire road surface with granular material of suitable type (Granular A in MTO standards).
18.2 POWERLINE TO SITE The higher expenditures required to construct a powerline to site is more than offset by the savings in power costs of grid versus diesel generated power. Approximately 50 kilometres of powerline to site from White River would require construction. As well at the main power distribution centre in White River a new step‐down transformer would be required. Grid power would be delivered at 115kV, with secondary service at 44kV. The power requirement on site would be a maximum of 10 MVa in the long term. The substation will consist of a 15/20 MVa transformer that will transform incoming power from 44kV to 13.8 kV for local loads. Local transformers will be used to step down to
Harte Gold Corp. – Sugar Zone Project Page 117 Preliminary Economic Assessment, May 31, 2012
Figure 18‐1. Sugar Zone Project Proposed Site Plan
Harte Gold Corp. – Sugar Zone Project Page 118 Preliminary Economic Assessment, May 31, 2012
local voltages as required (4160V for large motors, 600V for other uses) with panels established for low‐voltage, single phase (220/110V) needs. The new substation will be set up with two independent lines, with a disconnect switch allowing use of either line‐up independently and interconnection to power systems for emergency needs. Back‐up diesel generation for pumps, fans and the mill facility would be required. 18.3 WATER SUPPLY
Plant and process water, as well as fire water, will be sourced from a river or lake close to the site. 18.3.1 Plant and Process Water A main objective of the design is to minimize the overall water usage requirements. It is anticipated that 80 to 90% of the water used in process would be recycled from the mine/mill process water pond, with 10‐20% being made up with fresh water from the fresh water source. Process water will be treated as necessary to maintain low turbidity. Any water being sent back to the environment will be treated to meet Provincial regulations. Gland water will be taken from the make‐up water to ensure minimal turbidity in the process. Water testing of the fresh water source will be carried out prior to detailed design to assess the need for filtration of this water source. 18.3.2 Fire Water Fire water will be drawn from a lake and stored in a fire water tank adjacent to the mill facility. Diesel‐powered generators will power the fire pumps throughout the plant and the tank will be of sufficient size to meet FM (Factory Mutual) requirements for the facility.
18.3.3 Potable Water Wells for potable water will be drilled and water will be treated with a combination of reverse osmosis filters and chlorination to ensure the water meets all regulatory guidelines. Potable water will be pumped to a storage tank and kept for use in all drinking and bathing.
Harte Gold Corp. – Sugar Zone Project Page 119 Preliminary Economic Assessment, May 31, 2012
18.4 WATER TREATMENT PLANT A water treatment plant has been included to treat water from the mine and surface facilities. 18.5 MULTI‐USE COMPLEX To maximize the overall efficiency of the site, while minimizing capital outlay a multi‐use complex will house mine offices, a dry facility, warehousing and surface shops in a single building. This approach has been very successful in the past at other sites, and reduces the need for extensive site surface preparation, foundation construction and other items. The single structure minimizes cabling and piping for power, communication, air and water, and centralizes services into one location adjacent to the processing facility. The services/administration building would provide office and work space for the mine supervision, geology and engineering, support staff, administration and purchasing/ accounting personnel. The building would have a central open area, with partitioned office space, for engineering and geology personnel. This open area would have individual offices surrounding it for senior mine management, engineering, geology, and administration personnel, as well as a lunchroom, conference room and washrooms. A separate area for mine supervision offices and crew line up area would also be included. A network room would house the mines computer LAN and telephone communications systems. The facility would be constructed from a series of office trailers and shipping containers and prefabricated buildings where more appropriate. Work areas would be equipped with desks, filing cabinets, bookcases, computers and telephones. A separate area for photocopier, fax machine printers and plotter would be provided as well. All work areas would be heated and air conditioned. A warehouse facility would be provided with areas for pallet shelving storage of materials and parts, a lockup area for supplies and office space for purchasing and warehousing personnel. A laydown yard for large material and equipment is provided next to the warehouse building and a cold storage building to house large materials and equipment, which requires cover, would be constructed. The warehouse building would be a prefabricated structure with steel structural framing and metal cladding, with concrete floors. 18.6 REFUSE AND WASTE DISPOSAL Sewage generated at the operation would be treated in septic tank and filtration bed systems. Sewage would be collected in septic tanks and overflow water sent to a filtration bed for
Harte Gold Corp. – Sugar Zone Project Page 120 Preliminary Economic Assessment, May 31, 2012
treatment and release. Septic tank contents would be periodically pumped into tankers and transported to the nearest community with sewage treatment facilities for disposal by a contractor. All non‐toxic garbage from the operation would be collected and trucked to the nearest existing landfill operation. Hazardous waste would be collected in bounded areas and then disposed of using suitably qualified removal companies. 18.7 TELECOMMUNICATIONS AND COMPUTER NETWORKING Telephone, data links and Internet services infrastructure for the operation would be provided via a fibre optic cable link to the nearest main services infrastructure, most likely at White River. The fibre connection would probably be laid in the powerline corridor as part of the powerline construction phase. 18.7.1 Computer LAN’s and Networking The corporate computer systems of the mine would be based on Microsoft.NET Enterprise Servers. Network and office software would be installed on the network servers and local computers. A mid‐tier accounting package capable of general ledger, accounts payable and receivable, purchasing and inventory and mine maintenance planning would be implemented at site. The telephone system, would also provide data and internet services to the mine. It would provide the mine with worldwide internet access and systems to allow for sending electronic data to head office and also facilitate worldwide data transfers as required. 18.8 PROJECT MANAGEMENT The project construction would be managed by an EPCM consulting team and/or company. The project team would be responsible for managing and supervising project contractors and undertaking inspection, acceptance and commissioning of contractor work. EPCM costs associated with the project have been included in the capital estimates. 18.9 GENERAL & ADMINISTRATIVE General and administrative (G&A) costs are those primarily associated with the general management and administration of the project. G&A is associated with surface facilities and
Harte Gold Corp. – Sugar Zone Project Page 121 Preliminary Economic Assessment, May 31, 2012
personnel not included under the mining, product preparation or maintenance groups and in addition to the surface department comprise of: administration; procurement; human resources; and security. 18.9.1 Administration Administration comprises senior and general management, accounting, third party environmental support and information technology functions. In addition to employee salaries and benefits, other components include employee relocation, travel expenses for business away from the property, insurance (property and business interruption), permits and licences, fees for mining rights, professional fees, and operating surface vehicles for the personnel. Accounting functions include payroll, accounts payable, accounts receivable, budgeting, forecasting and other corporate cost accounting. Information technology comprises all components associated with operating and maintaining the telephone, computer network, internet, fax and radio systems for the mine site. Allowances for long distance telephone charges are also included. Environmental costs are associated with monitoring of the mine’s environmental performance and reclamation work. 18.9.2 Procurement Procurement encompasses all functions associated with on and off site procurement of materials and supplies; warehousing and inventorying; transportation from point of origin to site and other associated support services. Actual freight costs for items required by the mine, processing plant and maintenance departments are included in those department’s costs. The main cost components are comprised of employee salaries and benefits and warehouse supplies (such as personal protective equipment). Also included is small equipment (pallet lifters, forklifts, etc.) and parts used for warehousing, purchasing and logistics. Surface support includes loading and unloading of trailers and shipping containers, movement of materials on site and maintenance of the warehouse and associated facilities. 18.9.3 Human Resources Human resources encompass all functions associated with personnel, union relations, health and safety, training and community relations. Personnel and industrial relations costs include salaries and benefits for employees to recruit required personnel, manage Company salary and
Harte Gold Corp. – Sugar Zone Project Page 122 Preliminary Economic Assessment, May 31, 2012
benefits policies, manage hourly employees and oversee the Company’s policies and procedures. Health and safety includes salaries, benefits, on‐site first aid personnel, first aid supplies and vehicles required by this group. Community relations costs include funds to aid in supporting local community efforts and facilities. 18.9.4 Security Mine site security is provided on a contract basis by a third party security firm. Security surveillance equipment will be provided to the security firm by the mine. Other minor security equipment for the security personnel (such as metal detectors, etc.) would be provided by the contractor. A security facility will be constructed along the access road to prevent inadvertent access to the mine site and to the restricted lakes in the area. All personal vehicles will be parked at security and transportation by bus will be provided to the mine site for the work force. 18.9.5 Manpower The G&A manpower required for the mine after commercial production starts is estimated to be 15 employees with the cost structure based on expected salaries paid in the Canadian mining industry. The G&A manpower is presented in Table 18‐1.
Harte Gold Corp. – Sugar Zone Project Page 123 Preliminary Economic Assessment, May 31, 2012
Table 18‐1. G&A Manpower Complement
Position Total
Complement
General Manager 1
Mine/Office Clerk 1
Accountant /Contract Admin 1
Accounting Clerk 1
Purchasing Agent 1
Warehouseman 2
Human Resources/H&S 1
Environmental Technician 1
Security/First Aid Officers 6
TOTAL COMPLEMENT 15
Harte Gold Corp. – Sugar Zone Project Page 124 Preliminary Economic Assessment, May 31, 2012
19.0 MARKET STUDIES AND CONTRACTS The gold price used in this study is based on LME 24 month moving average monthly prices to the end of April 2012 of $US 1,490 per ounce. The gold doré would be sold to a refiner such as the Canadian Mint or Johnson Mathey.
Harte Gold Corp. – Sugar Zone Project Page 125 Preliminary Economic Assessment, May 31, 2012
20.0 ENVIRONMENTAL STUDY, PERMITTING AND SOCIAL OR COMMUNITY IMPACT 20.1 ENVIRONMENTAL ISSUES Harte is not aware of any historical environmental issues affecting the Property. Harte uses best practices standards in its current exploration work and has completed baseline flora and fauna studies and water testing and monitoring programs as part of wider permitting and related studies associated with an advanced exploration program on the Property. 20.2 PERMITTING As indicated above, Harte has begun permitting and related studies associated with an advanced exploration program. Harte has retained NordPro Mine & Project Management Services Ltd. of Thunder Bay, Ontario to manage this process. 20.3 SOCIAL/COMMUNITY AND FIRST NATION ISSUES Harte is proactively involved in Social/Community and First Nations initiatives and works closely with White River Forest Products (“WRFP”), the Town of White River (“the Town”), the Local Citizens Committee (“LCC”) and has entered into an Exploration Agreement with Pic Mobert First Nation (“PMFN”); the proximal First Nations Band. WRFP is jointly owned by the Town, PMFN and a forestry industry executive and holds timber rights over ground that is covered by Harte’s claims. Harte works closely with WRFP in the construction and upgrading of lumber roads that provide access to the claims. Harte strives to ensure that the maximum amount of work opportunities associated with its roadwork initiatives are directed to and carried out by the local population. Harte also works closely with the Town and the LCC to ensure that its exploration programs and any potential impacts related thereto are fully understood by local interests. Harte currently enjoys a positive relationship with PMFN and works hard to ensure that consultation at both the exploration and project levels is well understood. The Exploration Agreement referred to above defines the terms under which the PMFN and Harte will cooperate during the exploration phase of the project. Harte and PMFN will enter into good faith negotiations regarding an Impact Benefits Agreement once a bankable feasibility study is completed and prior to mine construction.
Harte Gold Corp. – Sugar Zone Project Page 126 Preliminary Economic Assessment, May 31, 2012
21.0 CAPITAL EXPENDITURES AND OPERATING COSTS 21.1 CAPITAL EXPENDITURES ESTIMATES The capital expenditures estimates are based on budget pricing from suppliers for critical components, consultants, contractors and a review of other Canadian projects. Smaller equipment and facilities component costs were factored based on industry norms for the type of facility being constructed and, where possible, adjusted to reflect local conditions. Labour rates are based on contractor costs in the region and country, for similar types of work. Where costs were either not available or irrelevant, costs from other similar projects in Canada were used. The rates used include all cost and profit components payable to contractors. All expenditure estimates are in 2012 constant Canadian Dollars. 21.1.1 Mining Mine capital expenditures are primarily related to mine development, mine infrastructure on surface and underground and mine equipment related to the underground mine. The total mine pre‐production expenditures are expected to be approximately $31.9 million. Underground mine infrastructure totals approximately $15.6 million, mine development $15.0 million dollars, and underground PCM $1.3million. The mine infrastructure capital expenditures are presented in Table 21‐1 and mine development expenditures in Table 21‐2. The projected mine sustaining capital expenditures are also shown in the mine capital expenditures tables. Sustaining capital expenditures total approximately $24.5 million, primarily for mine development. A contingency of 10‐15 percent is included in the capital expenditures. 21.1.2 Processing Plant & Tailings Management The construction of a processing plant would require capital expenditures of approximately $41.9 million. Table 21‐3 provides the cost estimate breakdown. Construction of the initial tailings storage area is estimated to be approximately $4 million. Sustaining capital of approximately $3 million is included for tailings dams height increases.
Harte Gold Corp. – Sugar Zone Project Page 127 Preliminary Economic Assessment, May 31, 2012
21.1.3 Infrastructure and Support Facilities Total pre‐production capital expenditures for project infrastructure and surface department are estimated to be approximately $28.5 million. Table 21‐4 provides the infrastructure capital expenditures breakdown and Table 21‐5 shows the surface mobile equipment capital expenditures. Major expenditure components are estimated to be approximately $13 million
Harte Gold Corp. – Sugar Zone Project Page 128 Preliminary Economic Assessment, May 31, 2012
Table 21‐1. Mine Infrastructure Capital Expenditures.
Component Quantity Units Unit Cost Total Cost Year Pre-Production TOTAL-2 -1 Period Total 1 2 3 4 5
Hydro One & Main Site Electrical Substation 1 L.S. $8,000,000 $8,000,000 8,000,000 $8,000,000Site Power Distribution 1 L.S. $1,500,000 $1,500,000 1,500,000 $1,500,000Tailings Pump Power Centre 1 L.S. $25,000 $25,000 25,000 $25,000Backup Diesel Generator 1 each $750,000 $750,000 750,000 $750,000Communication & Data Link 1 L.S. $400,000 $400,000 400,000 $400,000
Total Infrastructure Expenditures $27,859,000 $2,713,000 $25,148,000 $27,861,000
Infrastructure Capital
Harte Gold Corp. – Sugar Zone Project Page 132 Preliminary Economic Assessment, May 31, 2012
Table 21‐5. Surface Mobile Equipment Capital Expenditures ($).
for the powerline and stepdown transformers and approximately $2 million for buildings and furnishings not including contingencies. The total expenditures include EPCM, contractor overheads and a 25% contingency on all estimated expenditures.
21.1.4 Owners Costs
Project in‐directs are all estimated expenditures for the project (such as project management)
borne directly by Harte in completion of the project construction. These estimated expenditures
total $1.6 million over the 1.5 year pre‐production period.
21.1.5 Project Total Expenditures The estimated project total pre‐production capital expenditure, inclusive of contingencies, is approximately $119 million. A summary of project pre‐production capital expenditures is presented in Table 21‐6. A working capital allowance estimate of $10.1 million is included.
Description Quantity Units Unit Year TotalPrice -2 -1 Cost
Yard Integrated Tool Carrier/Forklift 1 each $300,000 300,000 $300,000Warehouse Forklift 1 each $90,000 90,000 $90,000Services Truck 1 each $130,000 130,000 $130,000
Sub-Total 0 520,000 $520,000
Contingency 25% 0 130,000 $130,000
TOTAL SURFACE MOBILE EQUIPMENT COST $0 $650,000 $650,000
Harte Gold Corp. – Sugar Zone Project Page 133 Preliminary Economic Assessment, May 31, 2012
Table 21‐6. Project Pre‐Production Capital Expenditures ($).
Sustaining Capital Sustaining capital expenditures are estimated to be $29 million. Major mine sustaining capital expenditures are associated with mine development expenditures. Sustaining capital also includes the purchase of 1.5% of the NSR reducing the project NSR to 2%. Closure costs estimates are included at a total cost of $2.5 million at the end of the project life. 21.2 OPERATING COSTS ESTIMATES Operating costs are based on Canadian norm prices from suppliers and other similar type Canadian projects, for consumables and parts. The cost of power is based on rates charged by Hydro One for similar sized power consumers in the province. Critical operating cost components are based on the following costs:
The diesel fuel price is assumed to be $1.30 / litre.
The electrical power cost is assumed to be $0.08 per kWh.
Harte Gold Corp. – Sugar Zone Project Page 134 Preliminary Economic Assessment, May 31, 2012
Labour costs for the operating period are based on the manpower schedules presented for each department and the associated labour costs. The costs include a burden component of approximately 35 to 40 percent. All costs are quoted in constant 2012 Canadian Dollars. 21.2.1 Mining The mine operating cost estimates were developed from first principles. The breakdown of the direct mining method costs is presented in Table 21‐7 for the two proposed mining methods and includes the costs for direct mining related labour and supervision. Mine services equipment and consumables costs and mine services and maintenance personnel costs are contained in Tables 21‐8 and 21‐9, respectively. Geology and engineering staff costs are presented in Table 21‐10. The average total mine operating costs are estimated to be $100 per tonne of potentially economic mineralization. 21.2.2 Processing and Tailings Management The processing cost is expected to be approximately $ 25 per tonne of potentially economic mineralization based on preliminary discussions with custom milling operations. A breakdown of the processing cost is presented in Table 21‐11. 21.2.3 General & Administration Operating Costs Infrastructure and surface mobile equipment, required to maintain the surface infrastructure and provide surface services, operating costs have been included in G&A costs. Surface ½ ton pickup trucks would be utilized by staff to travel around site and their operating costs have been included in G&A costs as well.
Harte Gold Corp. – Sugar Zone Project Page 135 Preliminary Economic Assessment, May 31, 2012
Table 21‐7. Direct Stope Mining Costs.
Alimak Mining Method
Shrinkage Mining Method
Components Total Cost
($/t)
Level Development $25.06
AlimakRaise $21.54
Drilling $11.26
Blasting $3.39
Cable Bolting $6.86
Backfill $4.76
Underground Truck Haulage $10.43
Total Cost, per tonne $83.29
Components Total Cost
($/t)
Development $28.64
Drilling $1.30
Blasting $8.57
Ground Support $9.53
Mucking $0.29
Manpower $18.55
Backfill $4.76
Underground Truck Haulage $10.43
Total Cost, per tonne $82.07
Harte Gold Corp. – Sugar Zone Project Page 136 Preliminary Economic Assessment, May 31, 2012
Table 21‐8. Mine Services Costs.
Component Total Cost
($)
Services & Auxiliaries $1,129,000
Mine Construction $53,000
Services Mobile & Fixed Equipment $704,000
Power Consumption $1,217,000
Total Services Costs $3,103,000
Overheads $198,000
Communication $39,000
Safety and Training $87,000
Total Overheads Costs $324,000
Harte Gold Corp. – Sugar Zone Project Page 137 Preliminary Economic Assessment, May 31, 2012
21‐9. Mine Services and Maintenance Personnel Costs.
Support Services Manpower Complement & Costs ($)
Position Complement Salary Burden Annual Yearly Total
Cost / Yr 35% Salary Cost($) ($) ($) ($)
Service Truck Operator 4 $80,000 $28,000 $108,000 $432,000
Parts Man/General 1 $80,000 $28,000 $108,000 $108,000
Total Mine Maintenance Department Manpower 18 $2,084,000
Harte Gold Corp. – Sugar Zone Project Page 138 Preliminary Economic Assessment, May 31, 2012
Table 21‐10. Mine Staff Costs.
Table 21‐11. Processing Cost Components ($).
Administration operating costs include costs and taxes for maintaining the property in good standing, land taxes, and resource usage fees (water, etc.). The G&A operating costs encompass
Position Total Annual Benefits Annual Yearly Total
Harte Gold Corp. – Sugar Zone Project Page 139 Preliminary Economic Assessment, May 31, 2012
all operating costs associated with operating the offices and providing materials and supplies for staff functions. The total yearly operating costs are estimated to be approximately $3.3 million (presented in Table 21‐12), of which approximately $1.8 million is for salaries and benefits. The total G&A equates to an average of approximately $13 per tonne of potentially economic mineralization processed. Manpower costs represent approximately 55% of G&A operating costs. G&A manpower costs are presented in Table 21‐13. Employee burdens account for approximately 40% of the total salary for each employee.
Harte Gold Corp. – Sugar Zone Project Page 140 Preliminary Economic Assessment, May 31, 2012
Table 21‐12. General and Administration Operating Cost Components.
Component Per
Year
Salaries & Overhead $1,792,000
Communications/IT $15,000
Equipment Rental & Maintenance $10,000
Computer Supplies & Software $8,000
Office Supplies $10,000
Surface Buildings Maintenance $46,000
Electrical Distribution Repairs $25,000
Road Maintenance Contract $40,000
Water Treatment Supplies $200,000
Postage, Courier & Light Freight $15,000
Insurance $500,000
Permits & Licences $5,000
Bank Charges $12,000
Professional Fees ‐ Accounting $30,000
Professional Fees ‐ Legal $5,000
Recruitment/Relocation $5,000
Security $5,000
Cleaning Contract $40,000
Safety, Clothing and Training $3,000
First Aid $5,000
Dues & Subscriptions $2,000
Public Relations $30,000
Power $224,000
Surface Transportation ‐ Pickups $38,000
Surface Equipment $146,000
Professional Fees ‐ General $20,000
Travel & Accommodation ‐ Business $25,000
Freight $10,000
Miscellaneous $15,000
TOTAL G&A COSTS $3,281,000
Harte Gold Corp. – Sugar Zone Project Page 141 Preliminary Economic Assessment, May 31, 2012
Table 21‐13. G&A Manpower Costs.
21.2.4 Dore Transport and Refining Charges
Transport and refining costs of $ 3.05 per ounce for gold have been included in the cashflow model and are based on Canadian norms.
21.2.5 Project Total Operating Costs The estimated total average operating cost (excluding smelting and refining) for the mine is approximately $145 per tonne of potentially economic mineralization. Table 21‐14 presents a summary table of life of mine average operating costs for each department on a cost per tonne of potentially economic mineralization.
Security/First Aid Officers 6 $86,000 $30,000 $696,000
TOTAL COMPLEMENT 15 $1,792,000
Harte Gold Corp. – Sugar Zone Project Page 142 Preliminary Economic Assessment, May 31, 2012
Table 21‐14. Project Operating Costs Summary.
Department Cost
($/t Mined)
Mine $100 Processing & Environmental $ 25
Surface Dept. and G&A $ 13
Royalty (2%) $ 7
TOTAL $145
Harte Gold Corp. – Sugar Zone Project Page 143 Preliminary Economic Assessment, May 31, 2012
22.0 ECONOMIC ANALYSIS
The expected base case cashflow estimates are calculated using a forecast long term gold price (based on the past 2 year moving average prices for gold) of $US 1,490
A summary of the expected parameters used for the financial analysis is presented in Table 22‐1.
Table 22‐1. Expected Project Parameters.
Potentially Mineable Resource after mining dilution & recovery
1.584 million tonnes Indicated Resources @ a grade of 8.1 g Au/t.
Estimated Mining Dilution 10 percent @ 0% grade
Payable Metals Produced 66,100 ounces Gold per year
Pre‐Production Capital Expenditures $119 million
Total Sustaining Capital Expenditures $29 million
Closure Cost $2.5million
Estimated Operating Costs ($/tonne): Mining Processing & Environmental General & Administration NSR Total Operating Costs
$100 $ 25 $ 13 $ 7 $145
Life of Mine 6 Years
The cashflow analysis excludes any element or impact of financing arrangements. All exploration and acquisition costs incurred prior to the production decision are also excluded from the cashflows. Capital expenditures, as shown in the capital section, would be incurred over a 2 year period, which is reflected in the discounted cash flow calculations. The cash flows include sustaining capital and capital expenditures contingency of approximately 25%. Revenue is based on payments for gold by gold refiners. A gross revenue royalty of 2% is included in the operating costs above.
Harte Gold Corp. – Sugar Zone Project Page 144 Preliminary Economic Assessment, May 31, 2012
Costs for metal sales and shipping are included in the deductions that the refiner makes. The expected cash flow analysis used the metal prices indicated above and a C$:US$ exchange rate of 1:1. The discounted cashflow analysis uses 2012 Constant Canadian Dollar values. 22.1 FINANCIAL RETURNS In most cases the levels of accuracy for this study are to Pre‐feasibility standard (+/‐ 20%) and vary by major estimate area. Estimates will have higher accuracy where recent pricing has been acquired, near quoting level of pricing has been determined or other recent projects with some similarities in design exist, etc. The estimated levels of accuracy for this study are:
Mine Development & Mining Costs 15% Mine Underground Infrastructure 20% Processing Plant 30% Surface Infrastructure and Facilities 20%
General & Administration Costs 15% The potentially mineable underground resource is estimated to be 1,584,000 tonnes at a grade of 8.1
grams Au per tonne. This Preliminary Economic Assessment relies on Indicated Mineral Resources (approximately 73 percent of the total resource tonnes) but also Inferred Mineral Resources. It should be noted that the Inferred Mineral Resources are considered too speculative geologically to have economic considerations applied to them that would enable them to be categorized as Mineral Reserves. For the PEA the metallurgical recovery is based on early stage test work. Also the cost projections range in accuracy from PEA to Feasibility level. Therefore, there is no guarantee that the economic projections contained in this Preliminary Economic Assessment would be realized. The project expected investment and returns based on the expected cashflow parameters for the project are shown in Table 22‐2.
Harte Gold Corp. – Sugar Zone Project Page 145 Preliminary Economic Assessment, May 31, 2012
Table 22‐2. Expected Project Returns.
Pre‐Tax After‐Tax
Undiscounted Net Revenue $577 million $577 million Undiscounted Cashflow $204 million $142 million
NPV (5%) $137 million $92 million NPV (10%) $ 91 million $58 million IRR 35% 28%
Payback Period 2.5years 2.5 years
22.1.1 Sensitivity Analysis Sensitivity analysis was performed for gold price, capital expenditures, operating costs, grade and recoveries using 20 percent (except for gold price variations) positive and negative variations. The project is very sensitive to changes in gold price, capital expenditures and grade, only marginally less sensitive to operating costs and relatively insensitive to processing recoveries. The results of the sensitivity analysis are presented in Table 22‐3. Figure 22‐1 and 22‐2 show the base case pre‐tax and after‐tax sensitivity analysis results, respectively in graphical form.
Harte Gold Corp. – Sugar Zone Project Page 146 Preliminary Economic Assessment, May 31, 2012
Advanced Exploration ‐ $10 million Advanced Exploration ‐ $20 million
143152
97105
3843
103 110
6774
3236
Harte Gold Corp. – Sugar Zone Project Page 147 Preliminary Economic Assessment, May 31, 2012
Figure 22‐1. Project Base Case Pre‐Tax NPV & IRR Sensitivities.
0
50
100
150
200
250
70 80 90 100 110 120 130
Net Present Value Pre‐Tax (millions)
Percentage Change from Base Case (Base Case = 100)Gold Price Capital Expenditure Operating CostsGrade Recovery Advanced Exploration
0%
10%
20%
30%
40%
50%
60%
70 80 90 100 110 120 130
Internal Rate of Return (Pre‐tax)
Percentage Change from Base Case (Base Case = 100)Gold Price Capital Expenditure Operating Costs
Grade Recovery Advanced Exploration
Harte Gold Corp. – Sugar Zone Project Page 148 Preliminary Economic Assessment, May 31, 2012
Figure 22‐2. Project Base Case After‐Tax NPV Sensitivities.
0
50
100
150
200
250
70 80 90 100 110 120 130
Net Present Value After‐Tax (m
illions)
Percentage Change from Base Case (Base Case = 100)Gold Price Capital Expenditure Operating CostsGrade Recovery Advanced Exploration
0%
5%
10%
15%
20%
25%
30%
35%
40%
45%
50%
70 80 90 100 110 120 130
Internal Rate of Return (After‐tax)
Percentage Change from Base Case (Base Case = 100)Gold Price Capital Expenditure Operating Costs
Grade Recovery Advanced Exploration
Harte Gold Corp. – Sugar Zone Project Page 149 Preliminary Economic Assessment, May 31, 2012
23.0 ADJACENT PROPERTIES The Dayohessarah Lake Property has been actively explored since the discovery of the Hemlo Mines in 1969. To date, there has been no production on the greenstone belt. The Corona‐Harte Joint Venture mining claims cover the entire greenstone belt, as well as a buffer zone around the belt. There are no truly adjacent properties to the Dayohessarah Lake Property. There are two small 1‐unit claims near the south‐east edge of the Property owned by Kabi Lake Forest Products Inc., as a source of road gravel. The closest mining claims are the Lizar Property, recently acquired by Canadian International Minerals Inc., 20 km east of the Dayohessarah Property, and the Hiawatha Property, owned by Trelawney Mining and Exploration Inc. adjacent to the east end of the Lizar Property, and 35 km east of the Dayohessarah Lake Property. Both properties are situated within the Kabinakagami Lake Greenstone Belt. The properties have seen limited exploration to date and hold gold and base metal potential. Approximately 30 km to the west is the Shabotic Property owned by Tyko Resources Ltd. and 40 km west of the Dayohessarah Greenstone belt are the Hemlo East Property of Metalcorp Limited and the Rouse Lake Property of Entourage Metals Limited. Both of these properties are situated within the Hemlo Greenstone Belt.
Harte Gold Corp. – Sugar Zone Project Page 150 Preliminary Economic Assessment, May 31, 2012
24.0 OTHER RELEVANT DATA AND INFORMATION To the best of the author’s knowledge, Nordpro is unaware of any other available technical information pertinent to this Property study.
Harte Gold Corp. – Sugar Zone Project Page 151 Preliminary Economic Assessment, May 31, 2012
25.0 INTERPRETATION AND CONCLUSIONS The mineral resources for the Sugar Zone are 980,900 tonnes at a grade of 8.72 grams Au per tonne of Indicated Resources and 580,500 tonnes at a grade of 7.03 grams Au per tonne of Inferred Resources. This Preliminary Economic Assessment identified a potentially mineable resource of 1.6 million tonnes at a grade of 8.1 grams Au per tonne. The deposit would be mined using underground mining techniques with Alimak Narrow Vein and Shrinkage mining being proposed. The mine would be ramp access using mobile rubber tired diesel operated equipment. Processing would employ CIP and produce doré. Major infrastructure would include a powerline, surface shop and warehouse, office/dry complex and services supporting the operations. Financial analysis provides the following expected returns from the project with a capital investment of approximately $108 million (not including permitting and working capital expenditures) and operating costs totalling approximately $144.57 per tonne of potentially economic mineralization processed.
Pre‐Tax After‐Tax
Undiscounted Net Revenue $577 million $577 million Undiscounted Cashflow $204 million $142 million
NPV (5%) $137 million $92 million NPV (10%) $ 91 million $58 million IRR 35% 28%
Payback Period 2.5years 2.5 years
Based on the study results, conclusions are:
1. The project provides significant positive and robust returns. 2. Significant increase in project IRR can be achieved (indicated by sensitivity analysis)
through reducing capital expenditures by 10 to 20%. This savings could be realized in part by sourcing a used processing plant and/or used processing equipment. Used processing plant equipment is still available, although the market has contracted and careful due diligence on equipment is required. Savings of up to 30% in the processing plant capital costs may be realized.
Harte Gold Corp. – Sugar Zone Project Page 152 Preliminary Economic Assessment, May 31, 2012
3. The potential for custom milling of potentially economic mineralization at processing plants in the region could also improve project returns as capital expenditures for a plant and tailings management area would be significantly reduced.
4. Commencing production while underground capital development is still underway also significantly increases the IRR of this project. Production of from 3 to 6 months in the pre‐production period increases the IRR by approximately 5 to 10%. This could be achieved by advancing development and developing stopes in the near surface levels earlier (though this creates more areas where stopes would be mined under backfilled stopes).
5. An underground bulk sample to confirm ore continuity, grades and gravity recoveries (which are predicted to be very high), would be beneficial. In addition to ore confirmation this would ensure that recoveries and processing costs are scalable.
6. The specific gravities for potentially economic mineralization and waste rock types stated and used by Watts Griffis and for determining the mineable potentially economic mineral resource were based on analysis results attributed to Accurassay, but no documentation with respect to the work was found by Watts Griffis. The stated value of 2.62 used for potentially economic mineralization appears low and needs confirmation.
7. The stope geometries used in this study are based on RQD information and more detailed rock mechanics analysis is required before more detailed mine design work is performed.
8. The most significant infrastructure expenditure is for a 50 kilometre powerline. The higher capital expenditure for the powerline versus diesel generated power, is more than offset by the savings in power cost from grid power. The difference in capital expenditures would be recaptured in approximately 1 year of operations.
9. Undertaking an advanced exploration programme to confirm resources in lower portions of the deposit and gravity concentrate recoveries could require approximately $10 to $20 million expenditures. This would also however provide an opportunity to accelerate the development and production cycle to improve potential project returns, should the mine be advanced to production.
25.1 RISK ASSESSMENT
The Sugar Zone Project is technically uncomplicated because of the near surface nature of the deposit and relatively simple ramp access to the underground mine. The processing plant uses well proven technologies to achieve excellent gold recoveries. Infrastructure requirements are also relatively risk free as the mine is in an area of other economic activity with many regional services. The main risks to project success would be:
Harte Gold Corp. – Sugar Zone Project Page 153 Preliminary Economic Assessment, May 31, 2012
• Gold prices. • The near surface nature of the deposit though being mined by underground
mining techniques allows access by a ramp from surface and mining a bulk sample would improve deposit geometry knowledge as well as provide a large sample to confirm the high predicted gravity gold recovery.
• Gravity separation of gold is predicted to be very high and if not achieved in
the processing plant could increase the processing costs as leaching costs would increase.
• Pre‐production capital expenditures are relatively low as mine development
and surface infrastructure required to commence production are not overly extensive. Regional communities provide much of the support services for employees and the mine.
• Environmental risks should be minimal as the host rocks have very low
potential for acid water generation and a cyanide destruction circuit removes the major toxic chemical from tailings. As well, 60% of tailings will be sent back underground as backfill.
• The project is located in an area where mining has been carried on for many
generations and mines are welcomed. Support for mines is readily available with many `local` and regional suppliers available.
Harte Gold Corp. – Sugar Zone Project Page 154 Preliminary Economic Assessment, May 31, 2012
26.0 RECOMMENDATIONS Based on the results of this Preliminary Economic Assessment, recommendations are:
1. Advance the project to production by undertaking an advanced exploration programme in parallel with finalizing the project design and capital requirements.
2. The goal of the Advanced Exploration Programme will be to confirm resources with the objective of converting Mineral Resources to Mineral Reserves.
3. Plan and environmentally permit a bulk sample programme for the Sugar Zone with
development of the ramp to the 100 metre vertical depth elevation.
4. Develop a detailed and optimized advanced exploration programme budget in the range of $10 to $20 million.
5. Process a bulk sample to confirm gravity concentration recoveries.
6. Undertake a comprehensive confirmation of the specific gravities for the potentially economic mineralization and waste rock types.
7. Perform a detailed rock mechanics analysis for stope geometry and mine design
including oriented core geotechnical drilling.
8. Investigate potential project expenditure reductions through sourcing of a used mill or processing equipment and the potential for custom milling.
Harte Gold Corp. – Sugar Zone Project Page 155 Preliminary Economic Assessment, May 31, 2012
27.0 REFERENCES
SGS Report: An Investigation into the RECOVERYOF GOLD FROM THE SUGAR ZONE DEPOSIT SAMPLES prepared for HARTE GOLD CORPORATION, December 14, 2010
Harte Gold Corp. – Sugar Zone Project Page 156 Preliminary Economic Assessment, May 31, 2012
28.0 SIGNATURES AND CERTIFICATES CERTIFICATE of QUALIFIED PERSON
MALCOLM BUCK, P.ENG. I, Malcolm Buck, M.Eng., P. Eng., residing at 164 Castle Crescent, Oakville, Ontario, Canada do hereby certify that:
1. I am an Associate of NordPro Mine & Project Management Services Inc.
2. This certificate applies to the technical report entitled “Preliminary Economic Assessment for the Sugar Zone Project, Ontario, Canada” (the “Technical Report”), with an effective date of May 31 , 2012.
3. I am a graduate of The Technical University of Nova Scotia, with a Bachelor of Engineering in Mining Engineering (1983). I have also obtained a Masters of Engineering, in Mining Engineering (Mineral Economics) from McGill University (1986).
4. I am licensed by the Professional Engineers Ontario (License No. 5881503). In addition, I am a member of the Canadian Institute of Mining, Metallurgy and Petroleum.
5. I have read the definition of “Qualified Person” set out in National Instrument 43‐101 (“NI 43‐101”) and certify that, by reason of my education, affiliation with a professional association (as defined in NI 43‐101) and past relevant work experience, I fulfill the requirements to be a “qualified person” for the purposes of NI 43‐101.
6. My relevant experience for the purpose of the Technical Report is:
Practiced my profession continuously since 1983.
Extensive and progressively more senior engineering and operational duties at base metals, gold and uranium mining operations and development projects.
20 years’ experience performing all types of feasibility studies and due diligence and strategic planning studies for mines and mining companies.
7. I authored and/or co‐authored Sections 16 and 18 to 26, of the technical report.
8. I have not visited the Property that is the subject of this Technical Report.
9. As of the date of this certificate, to the best of my knowledge, information and belief, the technical report contains all scientific and technical information that is required to be disclosed to make the technical report not misleading.
10. I am independent of the issuer applying all of the tests in sect 1.4 of NI 43‐101.
11. I have not had prior involvement with the Property that is the subject of this Technical Report.
12. I have read NI 43‐101 and Form 43‐101F1 and this Technical Report has been prepared in compliance therewith. Effective date: May 31, 2012 Signing Date: July 12, 2012 {Signed and Sealed} “Malcolm Buck” __________________ Malcolm Buck, P.Eng.
Harte Gold Corp. – Sugar Zone Project Page 157 Preliminary Economic Assessment, May 31, 2012
CERTIFICATE of AUTHOR I, Alfred S. Hayden, P.Eng. do hereby certify that: 1. I am President of:
EHA Engineering Ltd. PO Box 2711, Postal Station “B” Richmond Hill ON, L4E 1A7 Canada
2. I graduated from the University of British Columbia, Vancouver, B.C. in 1967 with a Bachelor of Applied Science in Metallurgical Engineering.
3. I am a member of the Canadian Institute of Mining, Metallurgy and Petroleum and a Professional Engineer and Designated Consulting Engineer registered with Professional Engineers Ontario.
4. I have worked as a metallurgical engineer for a total of 45 years since my graduation from university.
5. I have read the definition of “qualified person” set out in National Instrument 43‐101 (“NI 43‐101”) and certify that by reason of my education, affiliation with a professional association (as defined in NI 43‐101) and past relevant work experience, I fulfill the requirements to be a “qualified person” for the purposes of NI 43‐101.
6. I am responsible for the preparation of sections 13, 17, portions of 21 and 26 of the technical report titled “Preliminary Economic Assessment for the Sugar Zone Project, Ontario, Canada” (the “Technical Report”), with an effective date of May 31 , 2012.
7. I have had no prior involvement with the property that is the subject of the Technical Report.
8. I am not aware of any material fact or material change with respect to the subject matter of the Technical Report that is not reflected in the Technical Report, the omission to disclose which makes the Technical Report misleading.
9. I am independent of the issuer applying all of the tests in section 1.5 of National Instrument 43‐101.
10. I have read National Instrument 43‐101 and Form 43‐101F1, and the Technical Report has been prepared in compliance with that instrument and form.
11. I consent to the filing of the Technical Report with any stock exchange and other regulatory authority and any publication by them for regulatory purposes, including electronic publication in the public company files on their websites accessible by the public, of the Technical Report.
Effective date: May 31, 2012 Signing Date: July 12, 2012 {SIGNED AND SEALED} [Alfred Hayden] ____________________________________ Alfred Hayden, P.Eng
Harte Gold Corp. – Sugar Zone Project Page 158 Preliminary Economic Assessment, May 31, 2012
CERTIFICATE of QUALIFIED PERSON BRIAN LEBLANC, P.ENG.
I, Brian LeBlanc, B.Sc., P. Eng., residing at 781 Community Hall Road, Thunder Bay, Ontario, Canada do hereby certify that: 1. I am Vice President & General Manager of NordPro Mine & Project Management Services Ltd.
2. This certificate applies to the technical report titled “NI 43‐101 TECHNICAL REPORT ON The PRELIMINARY ECONOMIC ASSESSMENT OF THE SUGAR ZONE PROJECT, NORTH‐WESTERN ONTARIO, CANADA, FOR HARTE GOLD CORP. (the “Technical Report”), with an effective date of May 31, 2012.
3. I am a graduate of the Haileybury School of Mines as a Mining Technician (1981). I have also obtained a Bachelor of Science degree in Mining Engineering from Michigan Technological University (1986).
4. I am licensed by the Professional Engineers Ontario (License No. 90427972 ).
5. I have read the definition of “Qualified Person” set out in National Instrument 43‐101 (“NI 43‐101”) and certify that, by reason of my education, affiliation with a professional association (as defined in NI 43‐101) and past relevant work experience, I fulfill the requirements to be a “qualified person” for the purposes of NI 43‐101.
6. My relevant experience for the purpose of the Technical Report is:
Extensive and progressively more senior engineering and operational duties at base metals, gold and nickel mining operations and development projects.
8.5 years of experience directing and overseeing several scoping level, pre‐feasibility level and feasibility level studies for mines and mining companies.
Project Manager for Ontario – North American Palladium Ltd.................................................................................2007 ‐ 2010
Vice President and General Manager – NordPro Mine and Project Management Services Ltd............................2010 ‐ Present
7. I supervised preparation of the Technical Report and co‐authored Sections 1, 16, 18, 25 and 26 of the Technical Report.
8. I have visited the Property that is the subject of this Technical Report in September 2010.
Harte Gold Corp. – Sugar Zone Project Page 159 Preliminary Economic Assessment, May 31, 2012
9. As of the date of this certificate, to the best of my knowledge, information and belief, the technical report contains all scientific and technical information that is required to be disclosed to make the technical report not misleading.
10. I am independent of the issuer applying all of the tests in sect 1.4 of NI 43‐101.
11. I have not had prior involvement with the Property that is the subject of this Technical Report.
12. I have read NI 43‐101 and Form 43‐101F1 and this Technical Report has been prepared in compliance therewith.
Effective date: April 12, 2011 Signing Date: May , 2011 {SIGNED AND SEALED} [Brian LeBlanc] ____________________________________ Brian LeBlanc, P.Eng.