rticle history:eceived 26 December 2013eceived in revised form 14 April 2014ccepted 21 April 2014vailable online 28 April 2014
eywords:erium
a b s t r a c t
The effect of the substitution of cerium on the catalytic conversion of guaiacol over Ni-based catalystsprepared from the reduction of La1−xCexNiO3 perovskite-type oxides (0.0 ≤ x ≤ 0.9) has been investigated.The thermal behavior under reductive atmosphere indicates a beneficial effect of Ce addition. The charac-terization of the calcined La1−xCexNiO3 perovskites and reduced Ni-based catalysts by atomic absorptionspectroscopy (AAS), adsorption of N2 (−196 ◦C), transmission electron microscopy (TEM), X-ray powderdiffraction and temperature programmed reduction (TPR) revealed significant differences in crystallinestructure and reducibility. The Ni-reduced materials were effective in catalyzing the conversion of gua-
ickelerovskitesuaiacolDO
iacol to cyclohexanol. The catalysts with Ce content x ≤ 0.3 displayed similar initial intrinsic rate. Thehighest activity was obtained for the catalysts with Ce content x = 0.5 and 0.7 which was ascribed tothe highest thermal stability under reductive atmosphere of CeO2-solid solution partially substitutedwith La. The Ni-reduced catalysts displayed a high selectivity to cyclohexanol and methoxycyclohexanolcompounds and the catalysts with XCe = 0.5 presented a high stability in the guaiacol conversion.
The thermochemical conversion of biomass into fuels and chem-icals, as an alternative to fossil fuels, has been extensively studiedin recent years. Biomass gasification followed by Fischer Tropschreaction is a proven alternative to obtain methanol as well as liquid
ydrocarbons [1,2]. The fast pyrolysis of lignocellulosic biomass inrder to produce bio-oil is another attractive route for the process3,4]. Bio-oil is a complex mixture of water and about 300 chem-cals. Among them, the following prominent compounds can be
entioned: guaiacol, catechol, syringol, vanillin, furancarboxalde-ydes, isoeugenol, pyrones, acetic acid, formic acid, carboxylic acidserivates, hydroxyaldehydes, hydroxyketones, sugars, carboxyliccids and phenolic compounds [3,4]. This makes bio-oil a poten-ial feedstock for chemicals within the biorefinery concept. Ligninerivatives in bio-oils can be as much as 30 wt% [3] and offer partic-lar promise as a major source of aromatic compounds due to theirnique structure. However, they have received limited attentionecause they make bio-oil thermally unstable, corrosive and alsohey have the proclivity to polymerize under air exposure [4,5]. Dif-erent methods have been studied to extract chemicals from bio-oil,ith the use of polar and non-polar solvents [3,5]. Hydrotreatingrocess, intended to reduce the oxygen content of lignin deriva-ives to indirectly address many of the limitations of bio-oil, haslso been widely investigated [6–8]. Guaiacol (2-methoxyphenol)as been extensively used as a lignin model compound becauseuaiacyl-type compounds with their two functional groups (–OHnd –OCH3) are significant constituents of bio-oil [3,5]. Thesetudies have been conducted using different catalysts and reactoronfigurations [9–21].
Previously, Laurent and Delmon [9] carried out catalyticydrodeoxygenation (HDO) reaction of guaiacol on conventionalydrodesulfurization catalysts (CoMoS/�-Al2O3 and NiMoS/�-l2O3), primarily producing catechol. Bui et al. [10] stud-
ed the effect of support on the catalytic conversion ofuaiacol with MoS2 supported on �-Al2O3, TiO2 and ZrO2atalysts. They found that the support modifies the activ-ty and product distribution. The observed trends in prod-ct distribution were as follows: for MoS2/�-Al2O3 catalyst,atechol > methylcatechol > methylphenol > heavy products; foroS2/TiO2 and MoS2/ZrO2 catalysts, phenol > catechol » light prod-
cts (mainly methanol) > HDO compounds. The large extent ofethylation reaction displayed by MoS2/�-Al2O3 catalyst was
ttributed to the acid strength of the �-Al2O3 support which pro-otes the formation of heavy products, acts as a precursor to coke
nd hence decreases the overall catalytic activity. Along these lines,hu et al. [11] studying the influence of acid sites of Pt/zeolite cat-lysts for the transformation of methoxybenzene found that acidites favor the formation of methyl phenolic compounds (methyl-atechols, methylphenols, etc.). Despite the high activity of theulfided catalysts and the possibility to get different products, theseatalysts are quickly deactivated by coke deposition reaction con-itions [22,23].
On the other hand, several studies have demonstrated the via-ility of non-sulfided materials as a new class of catalysts thatre active and selective for guaiacol conversion. Gutierrez et al.13] reported high conversion and selectivity in the hydrogenationf guaiacol at lower reaction temperatures on zirconia supportedonometallic and bimetallic–noble metallic (Rh, Pd, Pt) catalysts.
he monometallic catalyst produces cyclohexanol as its princi-al product, whereas 1-methyl-1,2-cyclohenanediol was obtainedrom bimetallic catalysts. However, it is well known that the prod-ct distribution is strongly dependent on the respective support.ee et al. [14] reported that noble metal (Rh, Pd, Pt, Ru) catalystsupported on carbon black, Al2O3 and SiO2–Al2O3 were able toodify the product distribution. Noble metals supported on carbon
lack favored the formation of 2-methoxycyclohexanol, whereashose supported on SiO2–Al2O3 favored cyclohexane as the main
roduct. On the other hand, noble metals supported on more acidicaterials were reported to favor deoxygenation reactions. Reac-
ion conditions have also been studied in order to determine theirotential influence on guaiacol conversion. Nimmanwudipong et al.
A: General 481 (2014) 1–10
[15] reported no dependence of the reaction temperature on theproduct distribution for guaiacol conversion with Pt/Al2O3 catalyst.However, the authors demonstrated that an increase in the hydro-gen pressure (from atmospheric pressure to 127 MPa) favored theformation of benzene, toluene, anisole, phenol and o-cresol com-pounds. Other non-classical catalysts, such as Ni2P/SiO2, Co2P/SiO2and Fe2P/SiO2 have also been studied for guaiacol conversion:Ni2P/SiO2 and Co2P/SiO2 catalysts displayed high activity, prin-cipally producing benzene, whereas Fe2P/SiO2 catalyst was lessactive and favored the production of phenol [16]. Bykova et al. [24]reported it to be active in the guaiacol conversion into cyclohexane,1-methylcyclohexane-1,2-diol and cyclohexanone compounds asthe main product over Ni-based catalysts. In general, the metal cata-lysts have shown a high activity and selectivity to different productsin the conversion of guaiacol, though the stability of the activephase under reaction condition is low and has had little attention.An attractive option to stabilize metal particles on mixed oxides isby using perovskite-type oxides as precursors. In fact, Escalona et al.[25] stabilized Co nanoparticles by reducing LaFe1−xCoxO3 perov-skites to high temperature, displaying a high activity in the FischerTropsch reaction. In general, these oxides can be represented bythe general formula ABO3 structures, where A is an alkaline earthor lanthanide and B is a redox d-transition series metal, generallyresponsible for the catalytic activity. There is a considerable num-ber of potentially interesting perovskites in oxidation reactions,owing to the number of A and B cations that can be inserted intothis structure. When perovskite-type oxides are reduced, the lowthermal behavior of these materials leads to highly dispersed metalnanoparticles [26]. Additionally, the oxygen storage capacity of thesubstituted perovskites may also catalyze the oxidation of carbona-ceous materials deposited on the active sites of the catalyst, leadingto enhanced stability. Therefore, the objective of the current workwas to study the guaiacol conversion in high added value chemi-cals over highly dispersed Ni particles supported on a mixed oxide.The catalysts were prepared by reduction of high temperature ofLa1−xCe1−xNiO3 (x = 0.0, 0.1, 0.3, 0.5, 0.7, 0.9) perovskites precursorwith different substitution of lanthanum cation La3+ by an oxygenstorage cation such as cerium (which arises from the redox behav-ior of Ce3+/Ce4+). The Ni nanoparticles displayed a high activity andselectivity, however segregation of La2O3 and CeO2 oxides depend-ing on grade of substitution were observed. The Ni-reduced catalystthat displayed the most activity in batch reactor was comparedwith sulfides NiMoS/SiO2 catalyst and its stability was studied in acontinuous flow reactor.
2. Experimental
2.1. Preparation
Substituted La1−xCexNiO3 (x = 0.0, 0.1, 0.3, 0.5, 0.7, 0.9) perov-skites were prepared by the self-combustion method [27]. Glycine(H2NCH2CO2H), used as ignition promoter, was added to an aque-ous solution of lanthanum, ceria and nickel nitrates with theappropriate stoichiometry in order to get a NO3
−/NH2 (molarratio) = 1. The resulting solution was slowly evaporated until a vitre-ous green gel was obtained. The gel was heated up to around250 ◦C, temperature at which the ignition reaction occurs produc-ing a powdered precursor which still contains carbon residues.The solids were crushed and sieved to obtain the required parti-cle size (<200 �m) prior to calcination at 700 ◦C in air for 10 h inorder to eliminate the remaining carbon and leads to the formation
of the perovskite structure. Even though in some of the calcinedsolids the perovskite structure was not obtained, the nomenclatureLa1−xCexNiO3 was used throughout this study for the sake of uni-formity. Since hydrogen was used to activate the perovskites prior
N. Escalona et al. / Applied Catalysis A: General 481 (2014) 1–10 3
Table 1Bulk composition (wt%), BET specific surface area, crystal size and average particle size from TEM and H/Ni ratios obtained from H2-chemisorptions of La1−xCexNiO3 solids.
a Estimated error below 1%.b Nominal values in parentheses.c Standard deviation ± 2.
o catalytic activity measurements, the calcined perovskites wererst reduced under pure hydrogen flow (50 mL min−1) at 500 ◦C for
h. After the reactor was purged with nitrogen and cooled downntil room temperature. Then, it was placed in a cryostatic bathnd a flow of 5% O2/Ar was admitted into the reactor for 1 h. After-ards, it was purged for 30 min with N2 under the same cryostatic
onditions and finally the bath was removed and the catalysts weretabilized at room temperature. These materials are referred to asi-reduced samples in this work.
.2. Characterization
Absorption atomic spectroscopy (AAS) was performed using aerkin Elmer instrument. Specific surface areas were calculatedsing the BET method from the nitrogen adsorption isotherms at196 ◦C using Micromeritics ASAP 2010 apparatus. X-ray powderiffraction (XRD) patterns were obtained by means of a Rigakuiffractometer equipped with a nickel-filtered CuK�1 radiation� = 1.5418 A). Temperature-programmed reduction (TPR) exper-ments were performed in a TPR/TPD 2900 Micromeritics system
ith a thermal conductivity detector (TCD). Transmission electronicroscopy (TEM) was used to observe the nickel particles in a
EOL Model JEM-1200 EX II instrument. Hydrogen chemisorptioneasurements were carried out at 25 ◦C in a greaseless volumet-
ic system to evaluate the hydrogen uptake and H/Ni ratio. Beforehe chemisorption experiment, the samples were reduced in situt 500 ◦C for 2 h and then outgassed for 4 h at the same tempera-ure. Metal particle size obtained from H2-chemisorption at 25 ◦Cas evaluated assuming cubic metal particles, in which one face
emains on the support and the other five are exposed to hydrogen,y the equation d = 5/S�. A stoichiometry of H/Nis = 1 was used. Inhis equation, S represents the specific metal area and � is the metalpecific density.
.3. Catalytic tests
The catalytic conversion of guaiacol was carried out in an auto-lave reactor operating in batch mode. Prior to the catalytic test, theerovskites were ex situ activated under H2 (AGA Chile, 99.99%) at00 ◦C to obtain Ni-reduced catalyst. Guaiacol (0.232 mol L−1) withexadecane as an internal standard were dissolved in n-dodecane80 mL) and introduced into a batch reactor containing freshlyeduced 0.20 g of Ni-reduced catalyst. To avoid air contamination,he system was closed and bubbled with nitrogen for 10 min. Theeactor was then heated up, with continuous stirring, to the reac-ion temperature of 300 ◦C under N2 with a ramp of 10 ◦C/min.
hen this temperature was reached the first sample was takennd H2 was introduced into the reactor, up to a total pressure of
MPa and kept constant during the course of the experiment. Sam-les were periodically taken during the reaction and analyzed in
Perkin Elmer (Clarus 400) gas chromatograph equipped with aame ionization detector (FID) and a CP-Sil 5 CB column (Agilent,
30 m × 0.53 mm × 1.0 �m film thickness). The specific reaction ratefor total guaiacol conversion was calculated from the initial slopeof conversion as a function of time [12,23]. The intrinsic rate wascalculated from the specific rate according to the following equa-tion:
Ir= Sr
nNiNAV (1)
where Ir is the intrinsic rate (i.e. molecules of guaiacol transformedper Ni surface atoms obtained by H2-chemisorptions experimentsexpressed in molec. at−1
Ni s−1), Sr the specific rate (i.e. moles of gua-iacol transformed per gram of catalyst per second and expressedin mol. gcat
−1 s−1), nNi the number of Ni surface atoms obtained byH2-chemisorption and NAV the Avogadro number. The hydrodeoxy-genation (HDO) rate was also calculated according to Eq. (1), wherethe specific activity represents the conversion of guaiacol intodeoxygenated compounds (benzene, toluene, cyclohexene, cyclo-hexane and hexane).
The stability of the selected catalysts during the HDO reactionwas carried out in a stainless steel continuous-flow micro-reactor.In a typical experiment, approximately 0.2 g of the catalyst were1:1 diluted with SiC and loaded into the reactor tube, whereas theremaining reactor space was packed with SiC. The conditions forHDO reactions were as follows: 275 ◦C, 3 MPa, liquid hourly spacevelocity (LHSV) of 40 h−1, H2 gas hourly space velocity (GHSV) of3600 h−1 and H2/guaiacol molar ratio of 23. Fresh samples werecollected hourly for 9 h with regular flushing preceding each col-lection. The liquid products were then analyzed by GC.
3. Results and discussion
3.1. Elemental analysis and specific surface area
The elemental composition of Ni in the La1−xCexNiO3 perovskiteoxides was determined by atomic absorption spectrometry and theresults are compiled in Table 1, where it can be seen that nickelcontents were similar to the nominal values which is indicative ofno metal loss during synthesis. The BET specific surface areas of thecalcined and reduced solids are also shown in Table 1. The obtainedvalues are characteristic of these types of materials [28,29], as theypresent a monotonic dependence of surface area on Ce content witha slight decrease after reduction treatment.
3.2. X-ray diffraction
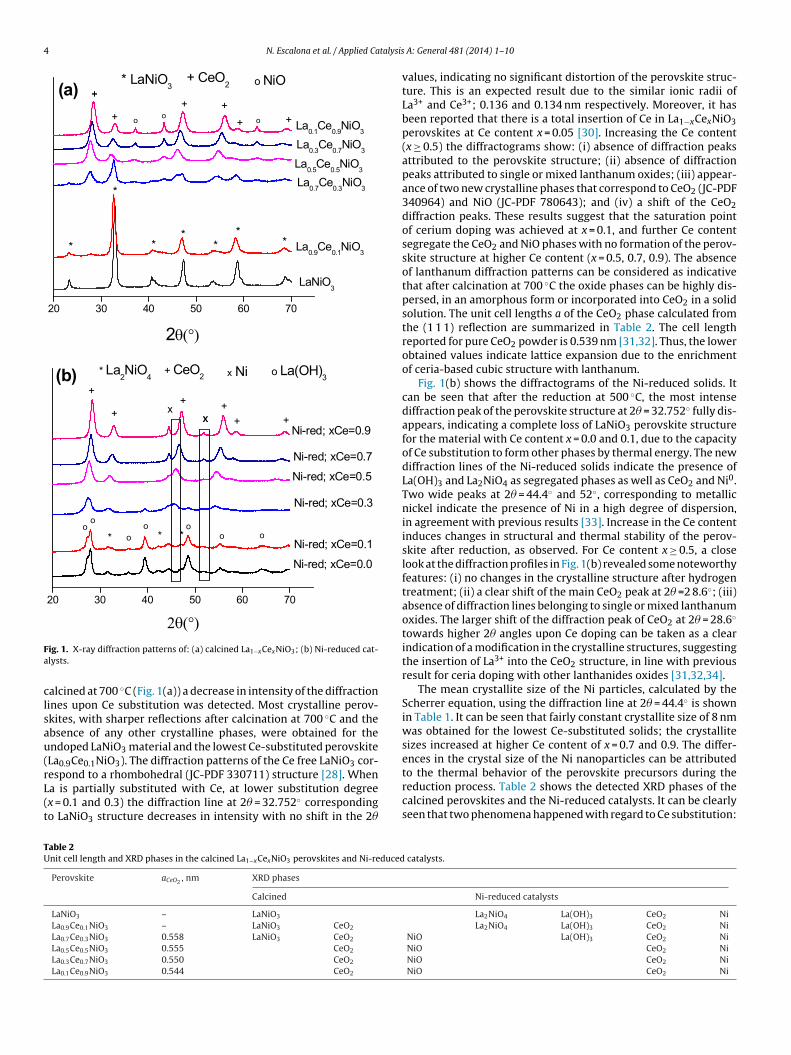
The XRD patterns of the calcined perovskites at 700 ◦C and theNi-reduced solids at 500 ◦C are shown in Fig. 1(a) and (b). The differ-ence in the diffractograms between the calcined and reduced solids
is indicative of a lower thermal stability in reductive atmosphere.Moreover, the absence of the characteristic perovskite diffractionlines and the appearance of segregated phases after the reductionprocess indicate loss of the perovskite structure. For the samples
alcined at 700 ◦C (Fig. 1(a)) a decrease in intensity of the diffractionines upon Ce substitution was detected. Most crystalline perov-kites, with sharper reflections after calcination at 700 ◦C and thebsence of any other crystalline phases, were obtained for thendoped LaNiO3 material and the lowest Ce-substituted perovskiteLa0.9Ce0.1NiO3). The diffraction patterns of the Ce free LaNiO3 cor-
espond to a rhombohedral (JC-PDF 330711) structure [28]. Whena is partially substituted with Ce, at lower substitution degreex = 0.1 and 0.3) the diffraction line at 2� = 32.752◦ correspondingo LaNiO3 structure decreases in intensity with no shift in the 2�
able 2nit cell length and XRD phases in the calcined La1−xCexNiO3 perovskites and Ni-reduced
Perovskite aCeO2 , nm XRD phases
Calcined
LaNiO3 – LaNiO3
La0.9Ce0.1NiO3 – LaNiO3 CeO2
La0.7Ce0.3NiO3 0.558 LaNiO3 CeO2
La0.5Ce0.5NiO3 0.555 CeO2
La0.3Ce0.7NiO3 0.550 CeO2
La0.1Ce0.9NiO3 0.544 CeO2
A: General 481 (2014) 1–10
values, indicating no significant distortion of the perovskite struc-ture. This is an expected result due to the similar ionic radii ofLa3+ and Ce3+; 0.136 and 0.134 nm respectively. Moreover, it hasbeen reported that there is a total insertion of Ce in La1−xCexNiO3perovskites at Ce content x = 0.05 [30]. Increasing the Ce content(x ≥ 0.5) the diffractograms show: (i) absence of diffraction peaksattributed to the perovskite structure; (ii) absence of diffractionpeaks attributed to single or mixed lanthanum oxides; (iii) appear-ance of two new crystalline phases that correspond to CeO2 (JC-PDF340964) and NiO (JC-PDF 780643); and (iv) a shift of the CeO2diffraction peaks. These results suggest that the saturation pointof cerium doping was achieved at x = 0.1, and further Ce contentsegregate the CeO2 and NiO phases with no formation of the perov-skite structure at higher Ce content (x = 0.5, 0.7, 0.9). The absenceof lanthanum diffraction patterns can be considered as indicativethat after calcination at 700 ◦C the oxide phases can be highly dis-persed, in an amorphous form or incorporated into CeO2 in a solidsolution. The unit cell lengths a of the CeO2 phase calculated fromthe (1 1 1) reflection are summarized in Table 2. The cell lengthreported for pure CeO2 powder is 0.539 nm [31,32]. Thus, the lowerobtained values indicate lattice expansion due to the enrichmentof ceria-based cubic structure with lanthanum.
Fig. 1(b) shows the diffractograms of the Ni-reduced solids. Itcan be seen that after the reduction at 500 ◦C, the most intensediffraction peak of the perovskite structure at 2� = 32.752◦ fully dis-appears, indicating a complete loss of LaNiO3 perovskite structurefor the material with Ce content x = 0.0 and 0.1, due to the capacityof Ce substitution to form other phases by thermal energy. The newdiffraction lines of the Ni-reduced solids indicate the presence ofLa(OH)3 and La2NiO4 as segregated phases as well as CeO2 and Ni0.Two wide peaks at 2� = 44.4◦ and 52◦, corresponding to metallicnickel indicate the presence of Ni in a high degree of dispersion,in agreement with previous results [33]. Increase in the Ce contentinduces changes in structural and thermal stability of the perov-skite after reduction, as observed. For Ce content x ≥ 0.5, a closelook at the diffraction profiles in Fig. 1(b) revealed some noteworthyfeatures: (i) no changes in the crystalline structure after hydrogentreatment; (ii) a clear shift of the main CeO2 peak at 2� =2 8.6◦; (iii)absence of diffraction lines belonging to single or mixed lanthanumoxides. The larger shift of the diffraction peak of CeO2 at 2� = 28.6◦
towards higher 2� angles upon Ce doping can be taken as a clearindication of a modification in the crystalline structures, suggestingthe insertion of La3+ into the CeO2 structure, in line with previousresult for ceria doping with other lanthanides oxides [31,32,34].
The mean crystallite size of the Ni particles, calculated by theScherrer equation, using the diffraction line at 2� = 44.4◦ is shownin Table 1. It can be seen that fairly constant crystallite size of 8 nmwas obtained for the lowest Ce-substituted solids; the crystallitesizes increased at higher Ce content of x = 0.7 and 0.9. The differ-ences in the crystal size of the Ni nanoparticles can be attributed
to the thermal behavior of the perovskite precursors during thereduction process. Table 2 shows the detected XRD phases of thecalcined perovskites and the Ni-reduced catalysts. It can be clearlyseen that two phenomena happened with regard to Ce substitution:
catalysts.
Ni-reduced catalysts
La2NiO4 La(OH)3 CeO2 NiLa2NiO4 La(OH)3 CeO2 Ni
NiO La(OH)3 CeO2 NiNiO CeO2 NiNiO CeO2 NiNiO CeO2 Ni
N. Escalona et al. / Applied Catalysis A: General 481 (2014) 1–10 5
0 10 0 200 300 40 0 50 0 600 700
(a)In
tens
ity(a
.u.)
Tempe rature (°C)
La0.1Ce0.9NiO3
La0.3Ce0.7NiO3
La0.5Ce0.5NiO3
La0.7Ce0.3NiO3
La0.9Ce0.1NiO3
LaNiO3
0 10 0 200 300 40 0 50 0 60 0 700
(b)
Inte
nsity
(a.u
.)
Tempe rat ure (° C)
Ni-red; xCe=0.9
Ni-red; xCe=0.7
Ni-red; xCe=0.5
Ni-red; xCe=0.3
Ni-red; xCe=0.1
Ni-r ed; xCe=0.0
FT
(utuxscttcd
3
errimsAThFiC
0,0 0,1 0,2 0,3 0,4 0,5 0,6 0,7 0,8 0,9 1,00
4
8
12
16
20
H2 c
onsu
mpt
ion
(mm
olg-1
)
x Ce
Fig. 3. Plot of hydrogen consumption of the La1−xCexNiO3 vs. nominal Ce content(×) TPR1; (�) TPR2.
ig. 2. Temperature-programmed reduction profiles of La1−xCexNiO3. (a) TPR1; (b)PR2.
i) formation of the perovskite structure with low thermal stabilitynder hydrogen for samples with low Ce content x ≤ 0.3; (ii) forma-ion of a solid solution of CeO2–La2O3, with higher thermal stabilitynder hydrogen for samples with higher degree of Ce substitution
≥ 0.5. It is likely that the thermal stability under hydrogen atmo-phere of the precursor determined the crystalline structure orrystal size of the Ni nanoparticles, in line with results that indicateshat rare earth oxide can prevent agglomerations and promoteshe dispersion of Ni particles [35]. The Ni-reduced catalyst with Ceontent x = 0.5 shows the lowest crystallinity and the highest Ni0
ispersion.
.3. Temperature programmed reduction cycles
Temperature-programmed reduction cycles (TPR1–TPR2),mployed to study the thermal behavior of the perovskites undereductive atmosphere, included the following steps: (i) a firsteduction step under H2/Ar flow up to 700 ◦C (TPR1); (ii) coolingn Ar flow to room temperature; (iii) oxidation in an O2/He flow
ixture up to 700 ◦C; (iv) a second reduction treatment (TPR2) as intep (i) after the sample was cooled to ambient temperature underr. The difference in the H2 consumption between the TPR1 andPR2 processes is a measurement of the structural changes under
ydrogen treatment. The TPR1 and TPR2 profiles are shown inig. 2(a) and (b). Two different thermal behaviors can be observedn the TPR1 profiles: (i) two reduction peaks for the samples withe contents x ≤ 0.3; (ii) only one broad reduction process for those
with Ce contents x ≥ 0.5. The TPR1 profile of LaNiO3 sample showsa first reduction peak that corresponds to the reduction of Ni3+
ions of LaNiO3 to yield the La2NiO4 phase that implies an oxygenloss from the structure [36]. According to the literature [37], thefirst reduction peak of the TPR1 at ∼350 ◦C corresponds to a partialreduction with the formation of oxygen-deficient perovskite whilethe second peak, with a maximum H2 consumption at ∼500 ◦C, isrelated to the complete reduction of the perovskite structure. AfterCe substitution, the TPR1 for the x = 0.1 and 0.3 perovskites showsalmost the same thermal behavior as that of LaNiO3. For highercerium substitution, only one and broad reduction process can beseen. In the TPR2 profiles only one reduction peak, attributed tothe reduction of Ni2+ to Ni0 is clearly seen. To better highlight thereduction steps, the hydrogen consumptions of the TPR1 and TPR2profiles were measured by deconvolution of the area under thecurve using a Lorentzian peak in a computer peak-fitting routine.The hydrogen consumption values in the reduction process wasplotted as a function of Ce content and shown in Fig. 3. The TPR1profile shows larger hydrogen consumption for the perovskiteswith Ce content x ≤ 0.3 and almost constant value for those withCe content x ≥ 0.5. Meanwhile, the TPR2 profiles show an almostconstant value of hydrogen consumption for all of the Ni-reducedcatalysts. Considering that the theoretical hydrogen uptake forsample reduction assuming that NiO is stoichiometrically reducedto Ni0 is 4.1 mmol g−1, the larger obtained values suggest thatother oxides entities are also being reduced.
Taking into account the XRD results, the lower stability underhydrogen of the perovskites with Ce contents x ≤ 0.3 led to the lossof the perovskite structure and the formation of segregated phasessuch as La(OH)3, La2NiO4 and CeO2 that increases hydrogen con-sumption. For perovskites with Ce contents x ≥ 0.5, TPR1 exhibitssimilar hydrogen consumption values with no observable variationwith Ce contents. Since XRD results did not show any structuralchanges under reductive atmosphere it is possible to calculate thedegree of reduction of the perovskite structure considering only thereduction of Ni3+ to Ni0. The obtained degree of reduction of 24%fits quite well with previously reported results corresponding tothe total reduction of Ni present in the original perovskites [33,38].Hydrogen consumption values derived from the TPR2 profiles ofthe Ni-reduced catalysts were identical despite changes in Ni dis-persion and the nature of the mixed metal oxides. Again, TPR1 andTPR2 cycles results, coupled with XRD results, showed two differ-ent behaviors: higher thermal stability under reductive atmospherefor perovskites with Ce content x ≥ 0.5 while those with Ce contents
x ≤ 0.3 exhibited lower stability.
6 N. Escalona et al. / Applied Catalysis
3
Natsdma
3
cmpHotptisifia
Fig. 4. TEM micrographs of Ni-reduced catalysts (a) x = 0.5; (b) x = 0.9.
.4. Transmission electronic microscopy
Fig. 4(a) and (b) shows the micrographs of two representativei-reduced catalysts with Ce contents x = 0.5 and 0.9. In general,ll of the Ni-reduced catalysts show a narrower particle size dis-ribution for metallic Ni between 5 and 25 nm. The mean particleize evaluated from 5 micrographs and 150 particles counted areisplayed in Table 1. The Ni average particle size obtained from theicrographs had sizes between 9 and 20 nm and are in reasonable
greement with crystallite size obtained by XRD [38].
.5. H2-chemisorption
In order to provide much convincing data of the hydrogenhemisorption capacity after the reduction process, Table 1 sum-arizes the H2 uptake of the reduced samples and the estimated
article size by H2-chemisorption assuming a stoichiometry of/Nis = 1. The obtained H/Ni uptake is smaller than the expectedne considering the particle size obtained from TEM and XRDechniques. It should be emphasized that hydrogen chemisorptionrovides only the amount of exposed surface metallic atoms. Thus,o explain the observed differences in hydrogen chemisorption, its proposed that in the higher Ce susbtituted catalysts, Ni particles
hould be partially inserted, not available to hydrogen uptake. Tak-ng into consideration the fact that the perovskite-type structure isrstly reduced to an oxygen-deficient La2NiO4 intermediate phasend finally completely reduced to metallic Ni0, it is highly probable
A: General 481 (2014) 1–10
that the Ni particles could be partially inserted or decorated by ceriaor lanthanum oxides after the reduction process, decreasing theirhydrogen uptake leading to larger particle size values that do notcorrespond to the real size [39,40].
3.6. Catalytic activity
3.6.1. Batch reactorThe evolution of the transformation of guaiacol and the yield
of products with the time for the Ni-reduced catalysts are shownin Fig. 5. The main products were cyclohexanol and methoxycy-clohexanol with lower amounts of cyclohexanone, phenol, anisole,light compounds (methanol) and HDO products such as benzene,cyclohexene, cyclohexane and xylene. Meanwhile, methylphenol,methylcyclohexane and methoxycyclohexanone were detected invery small amount. Methylated oxygenates such as methylguaiacolwere not detected. In addition, Fig. 5 shows that phenol, cyclohex-anone and methoxycyclohexanol increase and then decrease withtime, suggesting that they are intermediary products. Based on theliterature [9,10,15] and the observed reaction products, the pro-posed reaction scheme for catalytic transformation of guaiacol overNi-reduced catalysts prepared from a La1−xCexNiO3 perovskite pre-cursors is shown in Fig. 6. Guaiacol can initially be transformed intophenol and anisole via demethoxylation (DMO) and direct deoxy-genation (DDO) pathways, respectively. In addition, hydrogenation(HYD) of the aromatic ring of guaiacol led to the formation ofmethoxycyclohexanone and methoxycyclohexanol. The evolutionof cyclohexanol with time indicates that it was obtained throughsuccessive hydrogenation of phenol to cyclohexanone and thento cyclohexanol. Furthermore, cyclohexanol can be produced viaDMO route from methoxycyclohexanol. From the results of thisstudy, the HYD and DMO routes were the principal pathway inthe conversion of guaiacol over Ni-reduced catalysts preparedfrom a La1−xCexNiO3 perovskites precursor. In other words, theNi-reduced catalysts displayed a high hydrogenation with lowhydrogenolysis C OH bond. The significantly high cyclohexanolproduction has also been reported for Ru/Al2O3 [14], Pd/ZrO2 [13],Pt/ZrO2 [13] and PdPt/ZrO2[13] catalysts. The products distributioncalculated at 20% conversion of guaiacol and at 4 h of reaction timeare shown in Fig. 7. This shows that all Ni-reduced catalysts dis-played similar trends in product distribution, suggesting that theactive sites were not significantly modified with Ce substitution.The changes in Ni particle size and the presence of segregated phaseinfluenced by the degree of Ce substitution, does not affect selec-tivity. Additionally, Fig. 7(b) shows that the Ni-reduced catalystsdisplayed a yield of around 50% of cyclohexanol. Considering thatcyclohexanol and cyclohexanone are widely used in the manufac-ture of adipic acid (6,6 nylon feedstock), Ni-reduced catalysts fromLa1−xCexNiO3 perovskite-type structures have high potential to beused in lignin valorization technology.
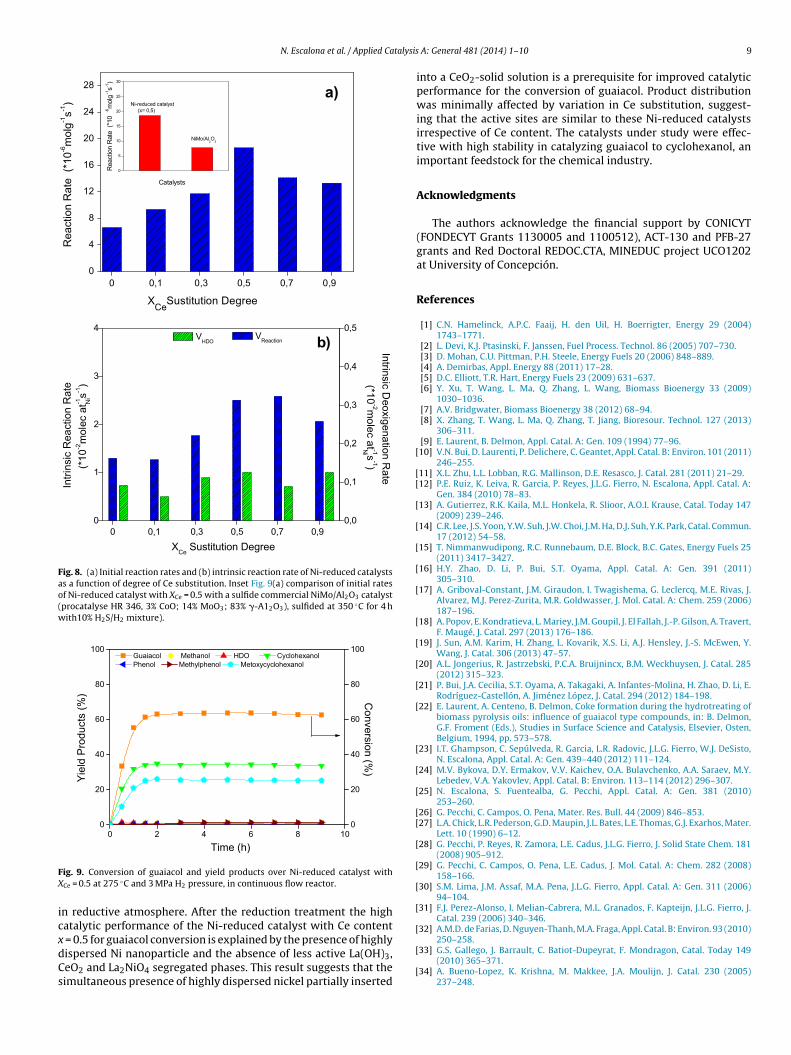
The effect of Ce substitution in Ni-reduced catalysts on theinitial rate is shown in Fig. 8(a). On the other hand, the initialrate increases with Ce loading up to x = 0.5 and then decreasesat higher Ce substitution. The initial guaiacol conversion ratesand deoxygenation rate were normalized by Ni atoms surfaceobtained by H2-chemisorptions result and the trend is illustrated inFig. 8(b). Fig. 8(b) shows that the intrinsic reaction rates increasesfor the catalysts with Ce content up to x = 0.5. The Ni-reducedcatalysts with a Ce content of x = 0.7 displayed similar intrinsicactivity than with a Ce content of x = 0.5, then a higher Ce con-tent the intrinsic rate decreased. On the contrary, the HDO intrinsicrates were similar in all catalysts, but with values over 10 times
lower than intrinsic activity, suggesting that HDO intrinsic rateapparently was not modified for the changes of Ni dispersionand segregated La(OH)3, CeO2 and La2NiO4 phases. On the otherhand, XRD patterns and characterization results of the samples
N. Escalona et al. / Applied Catalysis A: General 481 (2014) 1–10 7
F r La1−x
soLtarbtd
ig. 5. Conversion of guaiacol and yield of products as a function of reaction time fo = 0.5, (e) x = 0.7 and (f) x = 0.9.
ubjected to reduction indicate the loss of the crystalline structuresf La1−xCexNiO3 perovskites (x ≤ 0.3) with the segregation ofa(OH)3, CeO2, La2NiO4 and Ni metallic phases. On the contrary,he thermally stable La1−xCexNiO3 (x ≥ 0.5) solids did not undergony structural changes under reductive atmosphere, with only the
eduction of Ni3+ to Ni0. The highest intrinsic activity displayedy the catalysts with Ce content x = 0.5 and 0.7 can be attributedo the highest stability of their precursor that leads to highlyispersed Ni nanoparticles partially inserted into the CeO2-solid
−xCexNiO3 perovskites catalysts with Ce content (a) x = 0.0, (b) x = 0.1, (c) x = 0.3, (d)
solution. On the contrary, the lowest activity for the Ni-reduced cat-alysts with Ce content x ≤ 0.3 could be explained by the existenceof different phases with similar particle sizes. It can be assumedthat the segregated La(OH)3, CeO2 and La2NiO4 phases were notas active for guaiacol conversion as Ni nanoparticles and con-
tributed to the overall low activity of these catalysts. The decreasein intrinsic activity for Ni-reduced catalysts with Ce content x > 0.7was attributed to the loss of active sites by increase in the sizeof Ni nanoparticles, suggested by XRD and TEM results. On the
8 N. Escalona et al. / Applied Catalysis A: General 481 (2014) 1–10
Fig. 6. Reaction scheme for the conversion of guaiacol [6,7,12].
nvers
oimomrou
3
sagtoi
Fig. 7. Products distribution at (a) 20% co
ther hand, the inset of Fig. 9(a) shows the comparison of thenitial rate of Ni-reduced catalyst with XCe = 0.5 and sulfide com-
ercial NiMo/Al2O3 catalyst. This figure shows that the activityf Ni-reduced catalysts is 2.4 times more intense that the com-ercial NiMo/Al2O3 catalyst in the conversion of guaiacol. This
esult shows that the Ni-reduced catalysts obtained by reductionf La1−xCexNiO3 perovskites precursors have a high potential in thepgrading of lignin derivates compounds.
.6.2. Continuous-flow micro-reactorIn order to determine the stability of Ni-reduced catalysts, Fig. 9
hows the conversion of guaiacol in function of time over the cat-lyst with Ce content x = 0.5. Fig. 9 shows that the conversion of
uaiacol did not display even a slight difference after 9 h of reac-ion, suggesting a high stability of this catalyst under this conditionf reaction. The products of reaction were similar to the displayedn batch reaction with cyclohexanol and methoxycyclohexanol
ion of guaiacol and (b) 4 h reaction time.
compounds as main products. In addition, the yield of productsafter 3 h does not change with the time of reaction. These resultsconfirm the high potential of these catalysts in the upgrading oflignin derivates compounds.
4. Conclusions
La1−xCexNiO3 perovskite-type oxides (0.0 ≤ x ≤ 0.9) with mod-erate surface area were prepared by the self-combustion methodand used as precursors for the preparation of Ni-reduced nanopar-ticles which were subsequently used as catalyst for guaiacolconversion. For lower Ce content (x ≤ 0.3), it was found that therewas a partial insertion of Ce into the perovskite structure produc-
ing no change in the thermal stability under reductive atmosphere.In contrast, at higher Ce content (x ≥ 0.5), the formation of anew CeO2-solid solution coupled with the absences of the perov-skite structure led to an enhancement of the thermal stability
N. Escalona et al. / Applied Catalysis
Fig. 8. (a) Initial reaction rates and (b) intrinsic reaction rate of Ni-reduced catalystsas a function of degree of Ce substitution. Inset Fig. 9(a) comparison of initial ratesof Ni-reduced catalyst with XCe = 0.5 with a sulfide commercial NiMo/Al2O3 catalyst(procatalyse HR 346, 3% CoO; 14% MoO3; 83% �-A12O3), sulfided at 350 ◦C for 4 hwith10% H2S/H2 mixture).
0 2 4 6 8 100
20
40
60
80
100
0
20
40
60
80
100 Guaia col Me thano l HDO Cy clohe xan ol Pheno l Me thylph eno l Me toxycy clohe xanol
Conversion (%
)
Yie
ld P
rodu
cts
(%)
Time (h)
FX
icxdCs
[
[[
[
[
[
[
[
[
[
[
[
[
[
[
[
[[
[
[
[
[
[250–258.
ig. 9. Conversion of guaiacol and yield products over Ni-reduced catalyst withCe = 0.5 at 275 ◦C and 3 MPa H2 pressure, in continuous flow reactor.
n reductive atmosphere. After the reduction treatment the highatalytic performance of the Ni-reduced catalyst with Ce content
= 0.5 for guaiacol conversion is explained by the presence of highly
ispersed Ni nanoparticle and the absence of less active La(OH)3,eO2 and La2NiO4 segregated phases. This result suggests that theimultaneous presence of highly dispersed nickel partially inserted
[
[
A: General 481 (2014) 1–10 9
into a CeO2-solid solution is a prerequisite for improved catalyticperformance for the conversion of guaiacol. Product distributionwas minimally affected by variation in Ce substitution, suggest-ing that the active sites are similar to these Ni-reduced catalystsirrespective of Ce content. The catalysts under study were effec-tive with high stability in catalyzing guaiacol to cyclohexanol, animportant feedstock for the chemical industry.
Acknowledgments
The authors acknowledge the financial support by CONICYT(FONDECYT Grants 1130005 and 1100512), ACT-130 and PFB-27grants and Red Doctoral REDOC.CTA, MINEDUC project UCO1202at University of Concepción.
References
[1] C.N. Hamelinck, A.P.C. Faaij, H. den Uil, H. Boerrigter, Energy 29 (2004)1743–1771.
[2] L. Devi, K.J. Ptasinski, F. Janssen, Fuel Process. Technol. 86 (2005) 707–730.[3] D. Mohan, C.U. Pittman, P.H. Steele, Energy Fuels 20 (2006) 848–889.[4] A. Demirbas, Appl. Energy 88 (2011) 17–28.[5] D.C. Elliott, T.R. Hart, Energy Fuels 23 (2009) 631–637.[6] Y. Xu, T. Wang, L. Ma, Q. Zhang, L. Wang, Biomass Bioenergy 33 (2009)
1030–1036.[7] A.V. Bridgwater, Biomass Bioenergy 38 (2012) 68–94.[8] X. Zhang, T. Wang, L. Ma, Q. Zhang, T. Jiang, Bioresour. Technol. 127 (2013)
306–311.[9] E. Laurent, B. Delmon, Appl. Catal. A: Gen. 109 (1994) 77–96.10] V.N. Bui, D. Laurenti, P. Delichere, C. Geantet, Appl. Catal. B: Environ. 101 (2011)
246–255.11] X.L. Zhu, L.L. Lobban, R.G. Mallinson, D.E. Resasco, J. Catal. 281 (2011) 21–29.12] P.E. Ruiz, K. Leiva, R. Garcia, P. Reyes, J.L.G. Fierro, N. Escalona, Appl. Catal. A:
Gen. 384 (2010) 78–83.13] A. Gutierrez, R.K. Kaila, M.L. Honkela, R. Slioor, A.O.I. Krause, Catal. Today 147
(2009) 239–246.14] C.R. Lee, J.S. Yoon, Y.W. Suh, J.W. Choi, J.M. Ha, D.J. Suh, Y.K. Park, Catal. Commun.
17 (2012) 54–58.15] T. Nimmanwudipong, R.C. Runnebaum, D.E. Block, B.C. Gates, Energy Fuels 25
(2011) 3417–3427.16] H.Y. Zhao, D. Li, P. Bui, S.T. Oyama, Appl. Catal. A: Gen. 391 (2011)
305–310.17] A. Griboval-Constant, J.M. Giraudon, I. Twagishema, G. Leclercq, M.E. Rivas, J.
18] A. Popov, E. Kondratieva, L. Mariey, J.M. Goupil, J. El Fallah, J.-P. Gilson, A. Travert,F. Maugé, J. Catal. 297 (2013) 176–186.
19] J. Sun, A.M. Karim, H. Zhang, L. Kovarik, X.S. Li, A.J. Hensley, J.-S. McEwen, Y.Wang, J. Catal. 306 (2013) 47–57.
20] A.L. Jongerius, R. Jastrzebski, P.C.A. Bruijnincx, B.M. Weckhuysen, J. Catal. 285(2012) 315–323.
21] P. Bui, J.A. Cecilia, S.T. Oyama, A. Takagaki, A. Infantes-Molina, H. Zhao, D. Li, E.Rodríguez-Castellón, A. Jiménez López, J. Catal. 294 (2012) 184–198.
22] E. Laurent, A. Centeno, B. Delmon, Coke formation during the hydrotreating ofbiomass pyrolysis oils: influence of guaiacol type compounds, in: B. Delmon,G.F. Froment (Eds.), Studies in Surface Science and Catalysis, Elsevier, Osten,Belgium, 1994, pp. 573–578.
23] I.T. Ghampson, C. Sepúlveda, R. Garcia, L.R. Radovic, J.L.G. Fierro, W.J. DeSisto,N. Escalona, Appl. Catal. A: Gen. 439–440 (2012) 111–124.