12


NIB Bank Ltd. A wholly owned subsidiary of
January 2015
ECONOMIC REVIEW
Headline inflation (CPI) clocked in at 3.88% Y/Y for the month of Jan’15 (vs. 4.30% Y/Y recorded for the month of Dec’14) taking average CPI to clock in at 5.79% during 7mFy15. On a sequential basis, CPI remained flat during Jan’15 (up 0.09% M/M). Slow-down in sequential CPI is likely due to lower domestic POL prices which likely had a positive impact on Food (better supply situa-tion also eases price pressures) and Transport segments. However, risks to CPI exist via fiscal adjustments (administered price changes) to raise revenue through the phasing out of power subsidies (subsequent higher domestic gas and electricity prices) and a rebound in international oil prices. A lower CPI print (average CPI of 6.11% Y/Y during 1hFy15) and an improving external account outlook (C/A posted a surplus of USD 76mn in Dec’14) along with a stable PKR/USD parity has encouraged the SBP to continue the monetary easing cycle by reducing the benchmark discount rate by 100bps to 8.5% for the next two months. In this regard, soft oil prices, an improved trade account, and upcoming privatization transactions (e.g. HBL, KAPCO) provides further cushion to the external account. Going forward, domestic POL prices can be expected to be further brought down in line with the weakness in international oil prices which should keep the inflationary outlook benign and along with the optimism on the external account can encourage the SBP to continue with the monetary easing cycle.
During the period under review, SBP conducted two T-bill auctions with a cumulative target of PKR400bn against a total maturity of ~PKR209bn. Cumulative participation in the auction was witnessed at ~PKR1,149bn and the amount accepted was ~PKR383bn (both amounts excluding non-competitive bids). SBP also conducted a PIB auction on January 28’15, against a target of PKR50bn, participation of PKR271bn (face value) was witnessed while the government accepted an amount of ~PKR73bn. Participation in the 3years PIBs attracted 46%, while the 10 years tenor attracted 28% of the entire participation. The cut-off yields were 8.8895% for the 3 years tenor (face value PKR 5bn), followed by 9.7469% in the 5 years tenor (face value PKR65bn), 10.0093% in the 10 years tenor (face value PKR2bn) and 10.9995% in the 20 years tenor (face value PKR0.5bn).
The KSE100 Index witnessed a strong performance by gaining 7.20% M/M (KMI30 Index gained 6.24% M/M) during Jan’15 on the back of a host of positive macro economic developments. As a result, average volumes also improved by 23% M/M to 304mn shares traded in Jan’15. Net foreign inflows of USD 2.80mn were also witnessed during Jan’15 against net foreign outflows (USD 49.50mn) recorded in Dec’14. Activity at the exchange remained relatively robust during Jan’15 as improving macros via 1) Continued soft inflation, 2) A 100bps cut in the benchmark discount rate, and 3) Improvement in the trade account along with stable FX reserves led to comfort on the external side, took the benchmark index to new highs. In this regard, lower trending CPI along with comfort on the external account has strengthened the case for further monetary easing in Mar’15. Going forward, we flag 1) Continuation of the monetary easing cycle in the backdrop of a soft inflationary outlook, 2) Political consensus in implementing reforms, 3) Stability on the external account (benefit of lower international oil prices to curb the import bill and positive impact on price levels), 4) Positive surprises in the on-going result season, 5) Successful completion of the on-going military offensive in the tribal regions, and 6) Continued foreign inflows in equities, as key short to medium term re-rating triggers for the index.
MONEY MARKET REVIEW
EQUITY MARKET REVIEW
01 | FUND MANAGER’S REPORT
Risk Disclaimer: All investments in mutual fund are subject to market risks. Past performance is not necessarily indicative of the future results. Please read the Offering Document to understand the investment policies and the risks involved.

January 2015
PICIC CASH FUND (PICIC-CF)
INVESTMENT OBJECTIVE:
FUND INFORMATION FUND STRATEGY MATURITY PROFILE
To provide competitive returns to its investors through active investments in low risk portfolio of short duration, while maintaining . The Fundaims to maximize returns through efficient utilization of investment and liquidity management tools.
NIB Bank Ltd. A wholly owned subsidiary of 02 | FUND MANAGER’S REPORT
During the month, the Fund size increased to PKR 5,785mn from PKR 5,331mn in Dec’14. The Fund earned an annualized return of 10.22% for the month, comfortably outperforming the benchmark. The fund increased its exposure in T- bills with the amount maturing in Placements. The overall weighted average maturity increased marginally to 79 days from 70 days in Dec’14. Going forward, the fund would look at other avenues to augment its return for the unit holders.
Weighted Average Maturity
ASSET QUALITY
AA, 13%
AA+, 16 %
Govt Securities70%
Others, 1%
79 Days
Asset Allocation Jan’15
Cash
T-Bills
Placement with Banks and DFI’s
Other including receviables
Total
Dec’14
1 2
70 53
28 44
1 1
100 100
(% of Total Assets)
AssetQuality
(% of totalassets)
Inception to date return**
Month to Date return
Year to Date return (FYTD)
12M Trailing
PICIC-CF 3M-Deposit
INVESTMENT COMMITTEE MEMBERS
Mir Adil Rashid, Chief Executive Officer
Suleman Chhagla, Chief Operating Officer
Umer Pervez, Head of Equities
Tauqir Shamshad, Head of Fixed Income
11.57
10.22
9.38
9.27
8.24
7.00
7.58
7.49
KEY RATES (%) PERFORMANCE ANNUALIZED (%)Jan’15
8.37
9.08
11.44
11.68
7.16
7.59
9.67
9.39
KIBOR (1M)*
KIBOR (3M)*
KIBOR (6M)*
Latest T-Bill Cut-Off(3M)
FY-14
PICIC-CF 3M-Deposit
FY-13
FY-12
FY-11Latest T-Bill Cut-Off(6M)
Discount Rate
CPI Inflation Y/Y
FUND PERFORMANCE (%)ANNUALIZED
Fund Perfomance Annualized (%) Feb-14 Mar-14 Apr-14 May-14 Jun-14 Jul-14 Aug-14 Sep-14
Fund Returns
Ave. of 3M Bank Deposit(AA Rated)
Note: 1-Performance data does not include cost of sales loads. 2- Computation of performance is dividend adjusted NAV to NAV basis
*Average (BID) for the period** From 14th December 2010
WWF Note: The scheme has maintained provisions against WWF liability to the tune of Rs 19,278,941, if the same were not made the NAV per unit/return of the scheme would be higher by Re 0.3789/ 0.75% (YTD). For details, investors are advised to read the Note 7 of the latest �nancial statements of the scheme
Risk Disclaimer: All investments in mutual fund are subject to market risks. Past performance is not necessarily indicative of the future results. Please read the Offering Document to understand the investment policies and the risks involved.
Fund TypeCategoryLaunch DateNet Assets NAV per UnitTrusteeAuditorBenchmark
Dealing DaysCut off timePricing MechanismManagement FeeAMC RatingFund Stability RatingFront-end Load
Min.SubscriptionFund ManagerListingLeverageRisk Profile
Open-endMoney Market FundDecember 14th 2010PKR 5,785 millionPKR 105.6874CDCA.F.Ferguson & Co.Average of 3M AA Rated Bank DepositMonday-Friday4:00 pm (Mon to Fri)Backward0.5% per annumAM2-(JCR-VIS)AA(f) (JCR-VIS)Class C: NilClass D: 1% of NAVPKR 5,000Tauqir ShamshadISENilLow
8.97
8.93
8.93
8.96
8.99
8.50
3.88
Oct-14 Nov-14 Dec-14 Jan-15
8.30 8.34 8.65 8.61 8.61 8.68 8.94 8.94 9.11 9.54 8.80 10.22
7.37 7.37 7.37 7.37 7.37 7.75 7.75 7.75 7.75 7.75 7.33 7.00
high liquidity

PICIC INCOME FUND (PICIC-IF)
INVESTMENT OBJECTIVE:
NIB Bank Ltd. A wholly owned subsidiary of
January 2015
03 | FUND MANAGER’S REPORT
FUND PERFORMANCE (%)ANNUALIZED
Inception to date return**
Month to Date return
Year to Date return (FYTD)
12M Trailing
PICIC-IF 6M KIBOR
INVESTMENT COMMITTEE MEMBERS
Mir Adil Rashid, Chief Executive Officer
Suleman Chhagla, Chief Operating Officer
Umer Pervez, Head of Equities
Tauqir Shamshad, Head of Fixed Income
13.30
18.46
14.29
12.36
10.77
8.93
9.66
9.77
KEY RATES (%)
TOP TFCs / SUKUK HOLDING (% OF TOTAL ASSETS)
Engro Fertilizer Limited Sukuk 1.67%
PERFORMANCE ANNUALIZED (%)Jan’15
8.78
9.52
11.85
11.66
9.57
9.67
12.13
13.20
KIBOR (1M)*
KIBOR (3M)*
KIBOR (6M)*
Latest T-Bill Cut-Off (3M)
Latest T-Bill Cut-Off (6M)
Latest T-Bill Cut-Off (12M)
Discount Rate
PIB Cut-Off (10 Yr)
CPI Inflation Y/Y
FY - 14
PICIC-IF 6M KIBOR
FY - 13
FY - 12
FY - 11
Fund Perfomance Annualized (%) Feb-14 Mar-14 Apr-14 May-14 Jun-14 Jul-14 Aug-14 Sep-14 Oct-14 Nov-14 Dec-14 Jan-15
Fund Returns
Ave. 6M KIBOR
Note: 1-Performance data does not include cost of sales loads. 2- Computation of performance is dividend adjusted NAV to NAV basis
*Average (BID) for the period** From 24th July 2010
WWF Note: The scheme has maintained provisions against WWF liability to the tune of Rs 15,851,652, if the same were not made the NAV per unit/return of the scheme would be higher by Re 0.5171 / 1.02% (YTD). For details, investors are advised to read the Note 5 of the latest �nancial statements of the scheme.
Fund TypeCategoryLaunch DateNet AssetsNAV per UnitTrusteeAuditorBenchmarkDealing DaysCut off timePricing MechanismManagement FeeAMC RatingFund Stability RatingFront-end LoadMin.SubscriptionFund ManagerListingLeverageRisk Profile
Open-endIncome FundJuly 24th 2010PKR 3,572 millionPKR 108.5907CDCA.F.Ferguson & Co.Average of 6M KIBORMonday-Friday4:00 pm (Mon to Fri)Forward1.25% per annumAM2-(JCR-VIS)A+(f) (JCR-VIS)Class D: 1.25%NAVPKR 5,000Tauqir ShamshadISENilLow to Medium
FUND INFORMATION FUND STRATEGY MATURITY PROFILE
During the month, the Fund size increased to PKR 3,572mn from PKR 3,279mn in Dec’14. The Fund made an annualized return of 18.46% during the month. The Fund’s weighted average maturity decreased to 366 days against 484 days in Dec’14 . Going forward, the fund intends to keep moderate duration levels to provide competitive returns to its investors while keeping a check on the volatility of the returns.
Weighted Average Maturity
ASSET QUALITY
A, 2%
AA-, 9%
Govt Securities,74%
MTS (unrated)15%
366 Days
Asset Allocation Jan’15
Cash
T-Bills
Placement with Banks and DFI’s
PIB’s
Sukuks
MTS
Others
Total
Dec’14
9 6
29 22
0 0
45 51
2 2
15 16
0 3
100 100
(% of Total Assets)
AssetQuality
(% of totalassets)
To provide competitive returns to its investors through active investments in a blend of short, medium and long term debt ins truments. The Fund aims to preserve capital while maximizing returns through efficient utilization of investment and liquidity management tools.
Risk Disclaimer: All investments in mutual fund are subject to market risks. Past performance is not necessarily indicative of the future results. Please read the Offering Document to understand the investment policies and the risks involved.
8.67 15.19 16.01 -4.19 7.65 10.15 10.05 10.80 14.99 18.74 13.26 18.46
9.90 9.86 9.93 9.92 9.92 9.92 9.93 9.93 9.94 9.61 9.40 8.93
8.97
8.93
8.93
8.96
8.99
8.86
8.50
10.00
3.88

TOP TFCs / SUKUK HOLDING (% OF TOTAL ASSETS)
Engro Fertilizer Limited Sukuk 8.70%
January 2015
PICIC ISLAMIC INCOME FUND (PICIC-IIF)
INVESTMENT OBJECTIVE:
FUND INFORMATION FUND STRATEGY MATURITY PROFILE
NIB Bank Ltd. A wholly owned subsidiary of 04 | FUND MANAGER’S REPORT
During the month of January, the fund size witnessed a decline of PKR 38mn. The current fund size was PKR 459mn against PKR 497mn in December 2014. The fund made an annualized of 9.03% for the month. The Fund manager adopted a cautious stance by investing liquidity at appropriate rates in GOP Ijarah Sukuks and through placement. The fund manager is actively pursuing for quality Assets/ Sukuks to further increase the fund’s return, while safeguarding the investors against any potential losses.
ASSET QUALITY
AA-, 34%
AA+, 32%
A, 1%
A, 9%
Govt Securities22%
Others, 2%
AssetQuality
(% of totalassets)
PERFORMANCE ANNUALIZED (%)
Inception to date
FY - 15 to date
FY - 14
PICIC-IIF BENCHMARK
INVESTMENT COMMITTEE MEMBERS
Mir Adil Rashid, Chief Executive Officer
Suleman Chhagla, Chief Operating Officer
Umer Pervez, Head of Equities
Tauqir Shamshad, Head of Fixed Income
8.47
8.33
8.95
6.69
6.74
6.49
KEY RATES (%)
KIBOR (1M)*
KIBOR (3M)*
KIBOR (6M)*
Discount Rate
CPI Inflation Y/Y
Fund Perfomance Annualized (%)
14.71 8.57 7.37 8.52 8.18 7.81 9.26
6.49 6.49 6.48 6.54 6.55 6.51 6.84
May-14 Jun-14 Jul-14 Aug-14 Sep-14 Oct-14 Nov-14
7.46
6.79
Dec-14
9.03
7.51
Jan-15
Fund Returns***
Benchmark
Note: 1-Performance data does not include cost of sales loads. 2- Computation of performance is dividend adjusted NAV to NAV basis
*AVERAGE (BID) FOR THE PERIOD**FROM 29TH MAY 2014***MANAGEMENT FEE IS WAIVED FROM MAY 29, 2014 TILL JUNE 30, 2014****INCLUDING TWO DAY IPO RETURN (27TH & 28TH MAY’14)
WWF Note: The scheme has maintained provisions against WWF liability to the tune of Rs 576,281, if the same were not made the NAV per unit/return of the scheme would be higher by Re 0.1208 / 0.24% (YTD). For details, investors are advised to read the Note 12 of the latest �nancial statements of the scheme.
Risk Disclaimer: All investments in mutual fund are subject to market risks. Past performance is not necessarily indicative of the future results. Please read the Offering Document to understand the investment policies and the risks involved.
Fund TypeCategoryLaunch DateNet AssetsNAV per Unit TrusteeAuditorBenchmark
Dealing DaysCut off timePricing MechanismManagement Fee
AMC RatingFund Stability RatingFront-end LoadMin.SubscriptionFund ManagerListingLeverageRisk ProfileShariah Advisor
Open-endIslamic Income FundMay 29th 2014PKR 459 millionPKR 104.9142CDCBDO Ebrahim & Co.
Monday-Friday4:00 pm (Mon to Fri)Forward
AM2-(JCR-VIS)A(f) (JCR-VIS)Class B: 0% to 1.50%PKR 5,000Tauqir ShamshadISENilLow
Weighted Average Maturity 241 Days
Asset Allocation Jan’15
Cash
GoP Ijarah Sukuks
Placement with Banks and DFI’s
GOP Guaranteed Sukuks
Sukuks
Others
Total
Dec’14
13 40
22 0
54 50
0 0
9 8
2 2
100 100
(% of Total Assets)
To provide competitive risk adjusted returns to its investors by investing in a diversified portfolio of long, medium and sho rt term Shariah compliant debt instruments while taking in to account liquidity considerations.
Avg. of 6M profit rate of 3 Islamic Banks or Islamic Windows of Conventional Banks having rating A and above
10% of gross Earnings subject to minimum fee of 0.50% and Maximum fee of 1.50% of average daily net assets***
Fortune Islamic Ser-vice
Jan’15
8.97
8.93
8.93
8.50
3.88
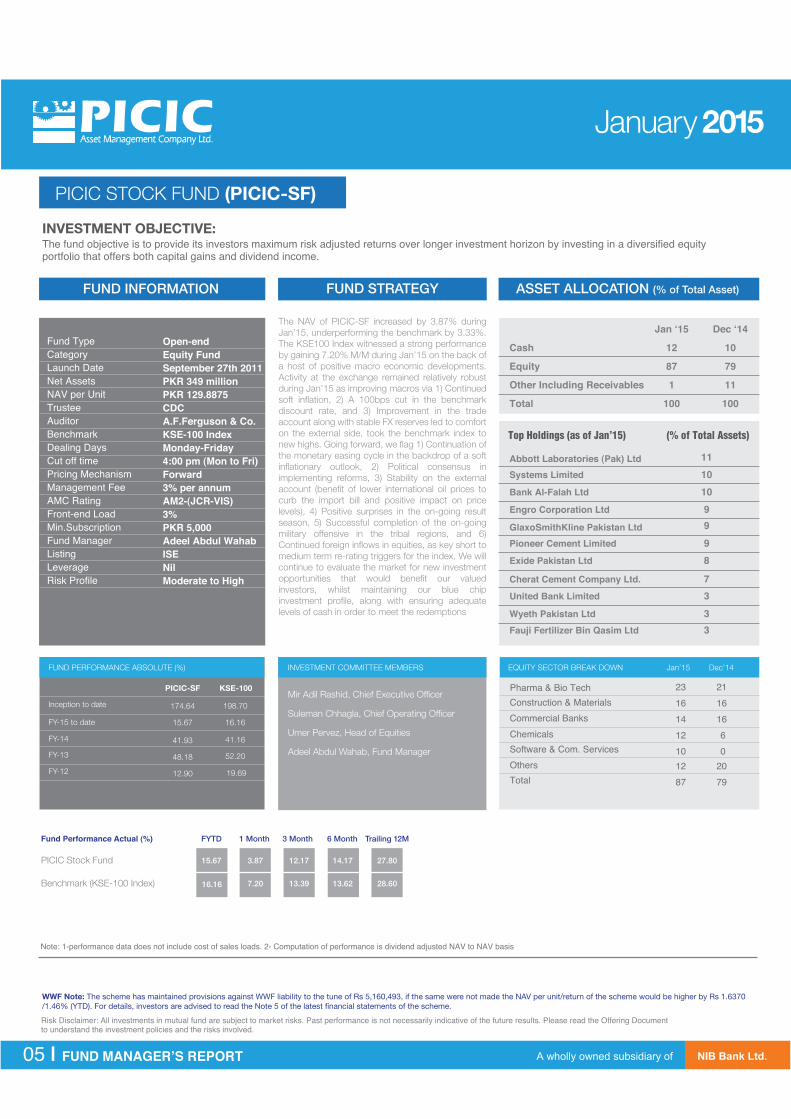
PICIC STOCK FUND (PICIC-SF)
INVESTMENT OBJECTIVE:
January 2015
NIB Bank Ltd. A wholly owned subsidiary of 05 | FUND MANAGER’S REPORT
FUND STRATEGY
The NAV of PICIC-SF increased by 3.87% during Jan’15, underperforming the benchmark by 3.33%. The KSE100 Index witnessed a strong performance by gaining 7.20% M/M during Jan’15 on the back of a host of positive macro economic developments. Activity at the exchange remained relatively robust during Jan’15 as improving macros via 1) Continued soft inflation, 2) A 100bps cut in the benchmark discount rate, and 3) Improvement in the trade account along with stable FX reserves led to comfort on the external side, took the benchmark index to new highs. Going forward, we flag 1) Continuation of the monetary easing cycle in the backdrop of a soft inflationary outlook, 2) Political consensus in implementing reforms, 3) Stability on the external account (benefit of lower international oil prices to curb the import bill and positive impact on price levels), 4) Positive surprises in the on-going result season, 5) Successful completion of the on-going military offensive in the tribal regions, and 6) Continued foreign inflows in equities, as key short to medium term re-rating triggers for the index. We will continue to evaluate the market for new investment opportunities that would benefit our valued investors, whilst maintaining our blue chip investment profile, along with ensuring adequate levels of cash in order to meet the redemptions
INVESTMENT COMMITTEE MEMBERS EQUITY SECTOR BREAK DOWN Jan’15 Dec’14
Mir Adil Rashid, Chief Executive Officer
Suleman Chhagla, Chief Operating Officer
Umer Pervez, Head of Equities
Adeel Abdul Wahab, Fund Manager
FUND PERFORMANCE ABSOLUTE (%)
Inception to date
FY-15 to date
FY-14
FY-13
FY-12
PICIC-SF KSE-100
Fund Performance Actual (%) FYTD 1 Month 3 Month 6 Month Trailing 12M
PICIC Stock Fund
Benchmark (KSE-100 Index)
WWF Note: The scheme has maintained provisions against WWF liability to the tune of Rs 5,160,493, if the same were not made the NAV per unit/return of the scheme would be higher by Rs 1.6370 /1.46% (YTD). For details, investors are advised to read the Note 5 of the latest �nancial statements of the scheme.
Risk Disclaimer: All investments in mutual fund are subject to market risks. Past performance is not necessarily indicative of the future results. Please read the Offering Document to understand the investment policies and the risks involved.
FUND INFORMATION ASSET ALLOCATION (% of Total Asset)
Fund TypeCategoryLaunch DateNet AssetsNAV per UnitTrusteeAuditorBenchmarkDealing DaysCut off timePricing MechanismManagement FeeAMC RatingFront-end LoadMin.SubscriptionFund ManagerListingLeverageRisk Profile
Cash
Equity
Other Including Receivables
Total
Jan ‘15
12
87
1
100
Dec ‘14
10
79
11
100
Open-endEquity FundSeptember 27th 2011PKR 349 millionPKR 129.8875CDCA.F.Ferguson & Co.KSE-100 IndexMonday-Friday4:00 pm (Mon to Fri)Forward3% per annumAM2-(JCR-VIS)3%PKR 5,000Adeel Abdul WahabISENilModerate to High
The fund objective is to provide its investors maximum risk adjusted returns over longer investment horizon by investing in a diversified equity portfolio that offers both capital gains and dividend income.
Top Holdings (as of Jan’15) (% of Total Assets)
Note: 1-performance data does not include cost of sales loads. 2- Computation of performance is dividend adjusted NAV to NAV basis
Pharma & Bio Tech Construction & Materials Commercial Banks Chemicals Software & Com. Services Others Total
198.70
16.16
41.16
52.20
19.69
174.64
15.67
41.93
48.18
12.90
23 16 14 12 10 12 87
21 16 16 60
20 79
Abbott Laboratories (Pak) Ltd Systems Limited
Bank Al-Falah Ltd
Engro Corporation Ltd
GlaxoSmithKline Pakistan Ltd Pioneer Cement Limited
Exide Pakistan Ltd
Cherat Cement Company Ltd.
United Bank Limited
Wyeth Pakistan Ltd Fauji Fertilizer Bin Qasim Ltd
11 10 10 9 9 9 8
7 3 3 3
15.67
16.16
3.87
7.20
12.17
13.39
14.17
13.62
27.80
28.60

January 2015
PICIC ISLAMIC STOCK FUND (PICIC-ISF)
INVESTMENT OBJECTIVE:
FUND INFORMATION FUND STRATEGY
NIB Bank Ltd. A wholly owned subsidiary of 06 | FUND MANAGER’S REPORT
The NAV of PICIC-ISF increased by 4.43% during Jan’15, underperforming the benchmark KMI30 by 1.81%. The KMI30 Index witnessed a strong performance by gaining 6.24% M/M during Jan’15 on the back of a host of positive macro economic developments. Activity at the exchange remained relatively robust during Jan’14 as improving macros via 1) Continued soft inflation, 2) A 100bps cut in the benchmark discount rate, and 3) Improvement in the trade account along with stable FX reserves led to comfort on the external side, took the benchmark index to new highs. Going forward, we flag 1) Continuation of the monetary easing cycle in the backdrop of a soft inflationary outlook, 2) Political consensus in implementing reforms, 3) Stability on the external account (benefit of lower international oil prices to curb the import bill and positive impact on price levels), 4) Positive surprises in the on-going result season, 5) Successful completion of the on-going military offensive in the tribal regions, and 6) Continued foreign inflows in equities, as key short to medium term re-rating triggers for the index. We will continue to evaluate the market for new investment opportunities that would benefit our valued investors, whilst maintaining our blue chip investment profile, along with ensuring adequate levels of cash in order to meet the redemptions.
ASSET ALLOCATION (% Of Total Asset)
FUND PERFORMANCE ABSOLUTE (%)
Inception to date (May 29 ‘14)
FY - 15 to date
FY - 14 (May 29 ‘14 to Jun 30 ’14)
PICIC-ISF KMI-30 Index
INVESTMENT COMMITTEE MEMBERS
Mir Adil Rashid, Chief Executive Officer
Suleman Chhagla, Chief Operating Officer
Umer Pervez, Head of Equities
Adeel Abdul Wahab, Fund Manager
EQUITY SECTOR BREAK DOWN
Fund Performance Actual (%)
22.83 4.43 14.36 20.08
13.03 6.24 10.68 10.40
FYTD 1 Month 3 Month 6 Month
PICIC Islamic Stock Fund
Benchmark (KMI-30 Index)
Note: 1-Performance data does not include cost of sales loads. 2- Computation of performance is dividend adjusted NAV to NAV basis
The scheme has maintained provisions against WWF liability to the tune of Rs 529,447 if the same were not made the NAV per unit/return of the scheme would be higher by Re 0.3797 / 0.38% (YTD).For details, investors are advised to read the Note 12 of the latest �nancial statements of the scheme.
Risk Disclaimer: All investments in mutual fund are subject to market risks. Past performance is not necessarily indicative of the future results. Please read the Offering Document to understand the investment policies and the risks involved.
Fund TypeCategoryLaunch DateNet AssetsNAV per Unit TrusteeAuditorBenchmarkDealing DaysCut off timePricing MechanismManagement FeeAMC RatingFront-end LoadMin.SubscriptionFund ManagerListingLeverageRisk ProfileShariah Advisor
Cash
Equity
Other including Receivables
Total
Jan ‘15 Dec ‘1414
85
1
100
1
78
21
100
Open-endIslamic Equity FundMay 29th 2014PKR 189 millionPKR 118.6615CDCBDO Ebrahim & Co.KMI-30 IndexMonday-Friday4:00 pm (Mon to Fri)Forward3% per annumAM2-(JCR-VIS)3%PKR 5,000 (Growth Unit)
Adeel Abdul WahabISE (in progress)NilModerate to High
TOP HOLDINGS (AS OF Jan’15) (% OF TOTAL ASSETS)
Systems Limited
Cherat Cement Company Ltd.
Abbott Laboratories (Pak) Ltd
Pioneer Cement Limited
Pak Suzuki Motor Company
GlaxoSmithKline Pakistan Ltd
Exide Pakistan Ltd
Lucky Cement Ltd
Engro Corporation Ltd
Meezan Bank Ltd
16
12
9
8
7
7
6
6
5
3Fortune Islamic Service
Jan’15(%) Dec’14(%)
The fund objective is to provide its investors maximum risk adjusted returns over longer investment horizon by investing in a diversified equity portfolio that offers both capital gains and dividend income.
2816151475
85
280171811478
15.36
13.03
2.06
23.86
22.83
0.84
Constr. & Materials Software & Com.Services Pharma & Bio Tech Automobile & Parts Chemicals Others Total

PICIC ENERGY FUND (PEF)
INVESTMENT OBJECTIVE:
January 2015
NIB Bank Ltd. A wholly owned subsidiary of 07 | FUND MANAGER’S REPORT
FUND STRATEGY
The NAV of PEF increased by 3.33% during Jan’15, underperforming the benchmark by 3.87% during Jan’15. A continuous fall in international oil prices (Arab Light down ~19% M/M) during Jan’15 kept the price performance of energy sector companies in check. In this regard, amongst our major holdings, POL, PPL and NCPL lost 4%, 3% and 2% during the review period. However, other portfolio companies viz. LPL, KAPCO, and SHEL gained 28%, 4% and 3% during Jan’14. We will continue to recalibrate our energy composite portfolio to maximize returns, whilst ensuring adequate levels of cash in order to meet the redemption requests of our valued investors.
INVESTMENT COMMITTEE MEMBERS EQUITY SECTOR BREAK DOWN Jan’15(%) Dec’14(%)
Mir Adil Rashid, Chief Executive Officer
Suleman Chhagla, Chief Operating Officer
Umer Pervez, Head of Equities
Adeel Abdul Wahab, Fund Manager
FUND PERFORMANCE ABSOLUTE (%)
Inception to date
Date to Conversion- Jun 25 ‘13
Oil & GasGas, Water & Multi-utilities
Electricity
OthersTotal
5432--
86
4944--
93
FY-15 to date
FY-14
FY-13
PICIC-EF
27.02
1.94
23.92
0.55
KSE-100
63.16
16.16
41.16
-0.50
Fund Performance Actual (%) FYTD
1.94 3.33 3.46 -0.61 9.12
16.16 7.20 13.39 13.62 28.60
1 Month 3 Month 6 Month Trailing 12M
PICIC Energy Fund
Benchmark (KSE-100 Index)
The scheme has maintained provisions against WWF liability to the tune of Rs 26,449,293 if the same were not made the NAV per unit/return of the scheme would be higher by Re 0.2783 / 2.43% (YTD). For details, investors are advised to read the Note 5 of the latest �nancial statements of the scheme.
Risk Disclaimer: All investments in mutual fund are subject to market risks. Past performance is not necessarily indicative of the future results. Please read the Offering Document to understand the investment policies and the risks involved.
FUND INFORMATION ASSET ALLOCATION (% of Total Asset)
Fund TypeCategoryLaunch Date (Closed Ended)
Conversion Date (Open Ended)
Net AssetsNAV per UnitTrusteeAuditorBenchmarkDealing DaysCut off timePricing MechanismManagement FeeAMC RatingFront-end LoadMin.SubscriptionFund ManagerListingLeverageRisk Profile
Cash
Equity
Other Including Receivables
Total
Jan ‘15
9
86
5
100
Dec ‘14
6
93
1
100
Open-endEquity FundJanuary 2006June 25, 2013PKR 1,101 millionPKR 11.6515CDCA.F.Ferguson & Co.KSE-100 IndexMonday-Friday4:00 pm (Mon to Fri)Forward2% per annumAM2-(JCR-VIS)3%PKR 5,000Adeel Abdul WahabISENilModerate to High
Top Holdings (as of Jan’15) (% of Total Assets)
19
16
11
10
10
8
6
6
0*
Note: 1-performance data does not include cost of sales loads. 2- Computation of performance is dividend adjusted NAV to NAV basis
*0.01
The fund objective is to invest in securities defined in the energy sector to provide investors access to high quality blue chip stocks in the Energy sector.
Kot Addu Power Company Ltd Lalpir Power Limited
Attock Petroleum Ltd
Nishat Chunian Power Ltd
Shell Pakistan Ltd
Nishat Power Limited
Pakistan Oilfields Ltd
Pakistan Petroleum Ltd
Engro Powergen Qadirpur Ltd

January 2015
PICIC GROWTH FUND (PGF)
INVESTMENT OBJECTIVE:
FUND INFORMATION FUND STRATEGY
NIB Bank Ltd. A wholly owned subsidiary of 08 | FUND MANAGER’S REPORT
The NAV of PGF increased by 1.17% on an Ex-frozen basis (underperforming the benchmark by 6.03%), while it gained 2.97% on a Total Return basis (underperforming the benchmark by 4.23%) during Jan’15. The KSE100 Index witnessed a strong performance by gaining 7.20% M/M during Jan’15 on the back of a host of positive macro economic developments. Activity at the exchange remained relatively robust during Jan’14 as improving macros via 1) Continued soft inflation, 2) A 100bps cut in the benchmark discount rate, and 3) Improvement in the trade account along with stable FX reserves led to comfort on the external side, took the benchmark index to new highs. Going forward, we flag 1) Continuation of the monetary easing cycle in the backdrop of a soft inflationary outlook, 2) Political consensus in implementing reforms, 3) Stability on the external account (benefit of lower international oil prices to curb the import bill and positive impact on price levels), 4) Positive surprises in the on-going result season, 5) Successful comple-tion of the on-going military offensive in the tribal regions, and 6) Continued foreign inflows in equities, as key short to medium term re-rating triggers for the index. We will continue to evaluate the market for new investment opportunities that would benefit our valued investors, whilst maintaining our blue chip investment profile.
INVESTMENT COMMITTEE MEMBERS
Mir Adil Rashid, Chief Executive Officer
Suleman Chhagla, Chief Operating Officer
Umer Pervez, Head of Equities
EQUITY SECTOR BREAK DOWN(% of Total Assets) FUND PERFORMANCE ACTUAL (%) FYTD 1 Month 3 Month 6 Month Trailing 12M
PICIC Growth Fund - Total
PICIC Growth Fund - Frozen
PICIC Growth Fund - Ex Frozen
Benchmark (KSE-100 Index)
Note: 1-Performance data does not include cost of sales loads. 2- Computation of performance is dividend adjusted NAV to NAV basis
* As per Trust Deed** Includes frozen portion of PSO
The scheme has maintained provisions against WWF liability to the tune of Rs 529,447 if the same were not made the NAV per unit/return of the scheme would be higher by Re 0.3797 / 0.38% (YTD).For details, investors are advised to read the Note 12 of the latest �nancial statements of the scheme.
Risk Disclaimer: All investments in mutual fund are subject to market risks. Past performance is not necessarily indicative of the future results. Please read the Offering Document to understand the investment policies and the risks involved.
Fund TypeCategoryLaunch Date*Net AssetsNAV per Unit TrusteeAuditorBenchmarkManagement FeeAMC Rating1 Year Perf. RankingListingLeverage
ASSET ALLOCATION (% Of Total Asset)
Cash
Equity
Other including Receivables
Total
Jan ‘15 Dec ‘143
91
6
100
3
94
3
100
Closed-endEquity FundJuly 2004PKR 11,780 millionPKR 41.55CDCBDO Ebrahim & Co.KSE-100 Index2% per annumAM2-(JCR-VIS)MFR 3 Star (JCR-VIS)KSE, LSE, ISENIL
TOP HOLDINGS (AS OF JAN’15)
Jan’15(%) Dec’14(%)
To maximize the wealth of the certificate holders for which investments would be made in the best available opportunities, while considering acceptable risk parameters and applicable rules and regulations.
Oil & Gas**Commercial BanksChemicalsPharma & Bio Tech
OthersTotal
47131087691
4624287794
Construction & Materials (Cem.)
Sui Northern Gas Pipeline Ltd
Pioneer Cement Limited
Pakistan State Oil Company
National Bank of Pakistan Ltd
Lotte Chemical Pakistan Ltd
GlaxoSmithKline Pakistan Ltd
Fauji Fertilizer Bin Qasim Ltd
Engro Corporation Ltd
Bank Al-Falah Ltd
Abbott Laboratories (Pak) Ltd
2.20
-2.41
7.67
16.16
2.97
4.63
1.17
7.20
7.39
8.37
6.31
13.39
1.13
-5.63
9.04
13.62
19.97
21.28
18.92
28.60

January 2015
* As per Trust Deed** Includes frozen portion of PSO
PICIC INVESTMENT FUND (PIF)
INVESTMENT OBJECTIVE:
FUND INFORMATION FUND STRATEGY
NIB Bank Ltd. A wholly owned subsidiary of 09 | FUND MANAGER’S REPORT
The NAV of PIF increased by 1.12% on an Ex-frozen basis (underperforming the benchmark by 6.08%), while it gained by 2.67% on a Total Return basis (underperforming the benchmark by 4.53%) during Jan’15. The KSE100 Index witnessed a strong performance by gaining 7.20% M/M during Jan’15 on the back of a host of positive macro economic developments. Activity at the exchange remained relatively robust during Jan’14 as improving macros via 1) Continued soft inflation, 2) A 100bps cut in the benchmark discount rate, and 3) Improvement in the trade account along with stable FX reserves led to comfort on the external side, took the benchmark index to new highs. Going forward, we flag 1) Continuation of the monetary easing cycle in the backdrop of a soft inflationary outlook, 2) Political consensus in implementing reforms, 3) Stability on the external account (benefit of lower international oil prices to curb the import bill and positive impact on price levels), 4) Positive surprises in the on-going result season, 5) Successful completion of the on-going military offensive in the tribal regions, and 6) Continued foreign inflows in equities, as key short to medium term re-rating triggers for the index. We will continue to evaluate the market for new investment opportunities that would benefit our valued investors, whilst maintaining our blue chip investment profile.
INVESTMENT COMMITTEE MEMBERS
Mir Adil Rashid, Chief Executive Officer
Suleman Chhagla, Chief Operating Officer
Umer Pervez, Head of Equities
EQUITY SECTOR BREAK DOWN FUND PERFORMANCE ACTUAL (%)
PICIC Investment Fund - Total
PICIC Investment Fund - Frozen
PICIC Investment Fund - Ex-Frozen
Benchmark (KSE-100 Index)
Note: 1-Performance data does not include cost of sales loads. 2- Computation of performance is dividend adjusted NAV to NAV basis
The scheme has maintained provisions against WWF liability to the tune of Rs 529,447 if the same were not made the NAV per unit/return of the scheme would be higher by Re 0.3797 / 0.38% (YTD).For details, investors are advised to read the Note 12 of the latest �nancial statements of the scheme.
Risk Disclaimer: All investments in mutual fund are subject to market risks. Past performance is not necessarily indicative of the future results. Please read the Offering Document to understand the investment policies and the risks involved.
Fund TypeCategoryLaunch Date*Net Assets NAV per Unit TrusteeAuditorBenchmarkManagement FeeAMC Rating1 Year Perf. RankingListingLeverage
ASSET ALLOCATION (% Of Total Asset)
Cash
Equity
Other including Receivables
Total
Jan ‘15 Dec ‘145
89
6
100
4
92
4
100
Closed-endEquity FundApril 2004PKR 5,244 millionPKR 18.46CDCBDO Ebrahim & Co.KSE-100 Index2% per annumAM2-(JCR-VIS)MFR 3 Star (JCR-VIS)KSE, LSE, ISENIL
TOP HOLDINGS (AS OF JAN’15)
Jan’15(%) Dec’14(%)
To maximize the wealth of the certificate holders for which investments would be made in the best available opportunities, while consid-ering acceptable risk parameters and applicable rules and regulations.
38262109792
391411109689
Wyeth Pakistan Ltd
Pioneer Cement Limited
Pakistan State Oil Company
National Bank of Pakistan Ltd
Lotte Chemical Pakistan Ltd
GlaxoSmithKline Pakistan Ltd
Exide Pakistan Ltd
Engro Corporation Ltd
Bank Al-Falah Ltd
Abbott Laboratories (Pak) Ltd
2.83
-2.73
7.43
16.16
2.67
4.73
1.12
7.20
7.01
8.01
6.25
13.39
2.28
-5.99
9.05
13.62
18.17
21.15
17.16
28.60
FYTD 1 Month 3 Month 6 Month Trailing 12M
Oil & Gas** Commercial Banks Chemicals Pharma & Bio Tech Construction & Materials Others Total

SINCE INCEPTION RETURNS
NIB Bank Ltd. A wholly owned subsidiary of 10 | FUND MANAGER’S REPORT
Note: 1-Performance data does not include cost of sales loads. 2- Computation of performance is dividend adjusted NAV to NAV basis
Risk Disclaimer: All investments in mutual fund are subject to market risks. Past performance is not necessarily indicative of the future results. Please read the Offering Document to understand the investment policies and the risks involved.
PICIC Stock Fund
Benchmark (KSE-100 Index)
PICIC Energy Fund
Benchmark (KSE-100) Index
PICIC Islamic Stock Fund
Benchmark (KMI-30 Index)
137.44
157.15
24.60
40.46
0.84
2.06
15.67
16.16
1.94
16.16
22.83
13.03
67.29
82.16
0.55
-0.50
12.90
19.69
PICIC Cash Fund
Ave. of 3M Bank Deposit (AA Rated)
PICIC Income Fund
Ave. 6M KIBOR
PICIC Islamic Income Fund
Benchmark
11.31
8.34
12.14
11.14
8.95
6.49
9.38
7.58
14.29
9.66
8.33
6.74
11.50
8.80
12.21
11.67
12.00
9.57
12.41
12.66
11.68
9.39
11.66
13.20
FUND PERFORMANCE ACTUAL%
FUND PERFORMANCE ANNUALIZED%
30 June, 14FYTD ‘15 30 June, 13 30 June, 12 30 June, 11

NIB Bank Ltd. A wholly owned subsidiary of
Sr # Designated Branch City Address Phone Contact Person
1
2
3
4
5
6
7
8
9
10
11
12
13
14
15
16
17
18
19
20
21
22
23
24
25
26
27
28
29
30
31
32
33
34
35
36
37
38
39
40
41
42
43
44
45
46
47
48
49
50
51
52
53
NIB -DHA Phase IV
NIB -DHA Phase II
NIB -Kulsoom Court
NIB -Zamzama
NIB -North Nazimabad
NIB -Khyaban e Shahbaz
NIB -University Road
NIB -Gulshan-e-Iqbal
NIB -DHA 26th Street
NIB -Saba Avenue
NIB -Business Arcade, Shahra-e-Faisal
NIB -Defence Phase I
NIB -Gul Tower
NIB -Hyderi Karachi
NIB -Zaibunnisa Street Saddar
NIB -Malir Colony, Liaquat Market
NIB -Stadium Road
NIB -DHA Phase II
NIB -Jouhar Town E Block
NIB -Bharia Town
NIB -Gulberg Main Boulevard
NIB -Z Block DHA Phase III
NIB -Model Town
NIB -Davis Road
NIB -Model Town Link Rd
NIB -6-Bank Square
NIB -Gulberg III
NIB -Gulberg III A�uent
NIB -House
NIB -New Garden Town
NIB -F-8 Markaz
NIB - Post Mall
NIB -I -8
NIB -PWD Employee C.H.S
NIB -F-10
NIB -F-11 Markaz
NIB -I -10 Markaz
NIB -Razia Sharif
NIB -Murree Road Saddar
NIB -Mall Road Branch, Rawalpindi
NIB -Adyala Road
NIB -Regency Arcade
NIB - Karkhana Bazar Branch
NIB -Liaquat Road
NIB -Millat Road
NIB -Hayatabad
NIB -Abdali Road
NIB -Main
NIB -Okara Branch
NIB -Mandi Bahauddin Branch
NIB -Habib Center
NIB -Jhelum City Branch
NIB -Shahabpura Sialkot
Karachi
Karachi
Karachi
Karachi
Karachi
Karachi
Karachi
Karachi
Karachi
Karachi
Karachi
Karachi
Karachi
Karachi
Karachi
Karachi
Karachi
Lahore
Lahore
Lahore
Lahore
Lahore
Lahore
Lahore
Lahore
Lahore
Lahore
Lahore
Lahore
Lahore
Islamabad
Islamabad
Islamabad
Islamabad
Islamabad
Islamabad
Islamabad
Islamabad
Rawalpindi
Rawalpindi
Rawalpindi
Faisalabad
Faisalabad
Faisalabad
Faisalabad
Peshawar
Multan
Hyderabad
Okara
Mandi Bahauddin
Gujranwala
Jhelum
Sialkot
99E, 9th Commercial Street Phase IV, DHA Karachi.
Plot No 106-C DHA Phase II, National Highway Near Tooba Apartments, Karachi
NIB Bank, Kulsoom Court, Near Della Wala, Building, Clifton, Karachi
Zamzama Branch, 18-C, 5th Zamzama Lane, Phase 5, DHA Karachi
SD -12, Bl - 'A'- North Nazimabad, Karachi
Shop No.2,3,4 C -23, Kh e Saher, Phase-VII, DHA, Karachi
Plot No. SB -4 Block 13 -B University Road, Gulshan -e-Iqbal, Karachi
Plot # FL -2/3 block 6, Improvement scheme No. 24, Gulshan-e-Iqbal, Karachi
NIB Bank, 42 C, Sun Centre,26th Street, Tuheed Commercial Area, DHA Phase V, Karachi
Saba Avenue Branch, 8-C Badar Commercial Street # 06, Phase-V Ext DHA, Karachi
Business Arcade, Block 6, PECHS, Shahra -e-Faisal, Karachi
19-C & 21 -C, East Street, Main korangi Road, DHA Phase - I, Karachi
Gul Tower, I.I Chundrigar Road, Karachi
D-14, Block -H, North Nazimabad, Karachi.
State Life Building # 5, Zaibunnisa Street, Saddar, Karachi
Plot No. G -107/10, Liaquat Market, Malir Colony,Karachi
Shop # 2 & 3, G.F, Plot # SC -45, Chandni Chowk, KDA Sch # 7, Stadium Road, Karachi
2/1 Block B Guldasht Town Zarar Shaheed Road, Lahore Cantt
Plot # 1, Block E 1, Johar Town, Lahore
Bharia Town Branch, Commercial Area, Alfalah Plaza, Sector B, Bahria Town Lahore
Old Sanda Road, Sardar Chapal Chock, Bilal Gunj, Lahore
NIB Bank, 38 Z, Commercial Area, Phase III, DHA Lahore
Shop No. 10-11 Model Town C Block Commercial Market, Lahore
Aftab Centre, 30 Davis Road, Lahore
Plot # 34-B, phase IIII Govt Employees C.H.S, Model Town Link Road, Lahore
6-Bank Square, Shahrah Quaid Azam, Lahore.
83-E -I, Main Boulovard, Gulberg III, Lahore
NIB Bank, 70 E 1, Hali Road, Gulberg III, Lahore
NIB House, Old Race Course branch, Aiwan E Tijarat Raod, China Chowk, Lahore
10-A Block, New Garden Town, Lahore
12 & 13, Al -Babar Center, F-8 Markaz, Islamabad
NIB Bank, Post Mall Branch, F 7, Markaz Islamabad
I -8 Markaz MB City Mall Palaza, Islamabad
40B PWD Housing Society, Islamabad highway, Islamabad
NIB Bank Ltd, Unit # 1 -R, Block 3,4&5, Main Double Road, F -10 Markaz Islamabad
18-Trade Center Main Double Road, F-11 Markaz Islamabad
Plot # 3-A, I -10 Markaz, Islamabad
NIB Bank, Razia Sharif Branch, Blue Area Islamabad
Building No.111/10 Muree Road, Saddar Rawalpindi
31/3-31/A, The Mall Rawalpindi.
Khasra# 1365/572, Skindar Plaza, Munawar Colony Main Adyala Road, Rawalpindi
The Mall, Regency Shopping Arcade, Faisalabad
Property #122, Khatooni # 1650, Khewat # 1647, Faisalabad
Plot No. 3, Liaquat Road, Faisalabad
Commercial Center # 02 Gulistan Colony Millat Road, Faislabad
B -1 Phase 5, Hayatabad, Peshawar.
Plot # 66/9, Abdali Road, Multan
Plot # 53 & 54, Cantt Saddar, Hyderabad
Khewat # 50-18, Chak # 1 -A/4-C, M.A. Jinnah Road
Plot # 7/211, Ward # 7, Mandi Bahauddin
Al Hameed Center Branch, Opposite Iqbal High School, G.T. Road, Gujranwala
B -V -112, Resham Plaza, Civil Lines, Jhelum
Plot # B -III -8-S-206, Shahabpura, Sialkot
0213-5885718
0213-5314083
0213-5837011
0213-5295210
0213-6673597
0213-5348772
0213-4980430
0213-4986186
0213-5304163
0213-5341672
0213-4524667
0213-5386881
0213-5277220
021-36643411
0213-5212102
0213-4117601
0213-4932266
0423-6639771
0423-5220637
0423-5341656
0423-7220005
0423-5748865
0423-5915406
0423-6286965
0423-5888303
0423-7246257
0423-5756850
0423-5756993
042-99203194
0423-5843886
051-2852653
051-2653581
051-4862271
051-5957660
051-2215856
051-2107862
051-2852653
051-2826553
051-5562944
051-5701200
051-5948126
041-2604875
041-2601808
041-2604931
041-8849935
091-5825278
061-4517126
022-2787462
0442-550902
0546-509551
055-9200236
0544-627286
052-3559682
Farrukh Ghani Soomro
Gazanfar Ali
Jalal Jamil
Faiz Ijaz
Junaid Mitha
Moazzam
Muhammad Umair Khan
Salman Aslam
Omar Abdullah
Yousuf Muhammad Farooqi
Mudassir Ahmed
Ahmed Alvi
Fasih Uddin
Moamer Habib
Mansoor
Majid Warsi
Syed Iqbal Rasheed
Ali Agha
Asad Sheikh
Asjad Mir
Babar Ali Peerzada
Fahad Kardar
Majid Bashir
Mirza Ali Yar Baig
Noroz Nabi
Saleem Mukhtar
Raiz Azhar Sheikh
Muhammad Ameen
Muhammad Waqas Ijaz
Mansoor Akram
Aamir Rashid Chaudhry
Asim Ikram
Muhammad Ebraheem
M.Nauman-Ul-Haq Khawaja
Shiraz Khan Afridi
Syed Usman Ali Shah
Afzaal Mehmood
Shaheed Ahmed
Faqir Sheryar
Junaid Waheed
Syed Dabeer Ali Hamdani
Aqeel Ahmed
Muddassar Sohail
Syed Mazfoor Mohsin Gillani
Dilbar Hassan Ch
Muhammad Ali Khan
Basharat Ali Siddiqui
Taneer Hussain kazi
Ch M Aslam
Khawar Nazir
Muhammad Kashif Ahmed
Awais Khurram
Rajesh Kumar
3rd Floor, PNSC Building, M.T. Khan Road, Karachi UAN: +92 21 1111 PICIC (74242) | Fax: +92 21 35642770 - 71 | Toll Free: 0800-PICIC(74242)Email: [email protected] | Web: www.picicamc.com


