22
Nic Allen Jeff Laun BEL AIR MASS FINISHING MQP
| Date post: | 01-Jan-2016 |
| Category: |
Documents |
| Upload: | gwen-palmer |
| View: | 220 times |
| Download: | 0 times |

Nic AllenJeff Laun
BEL AIR MASS FINISHING MQP
Study surfaces produced by mass finishing
Understand the basic mechanisms we have determined the normal forces between a surface and a sample mass finishing media
Study how the surface produced by mass finishing eff ects the shininess of the surface.
OBJECTIVE

BEL AIR FMSL 22CENTRIFUGAL DISC FINISHER

Al 6061-T6
Polished Al Surfaces to a mirror.
Obtained a Vickers Hardness value of the surface
Mass Finished with abrasive media for 30 s.
Measured the depths of the scratches
Calculated the normal force
EXPERIMENT, SCRATCH DEBTHS

POLISHED SURFACE (100X)

EXAMPLE SCRATCH (50X)

EQUATION USED FOR FORCE CALC
HV= Vickers HardnessF= Force (Newtons)A= Area
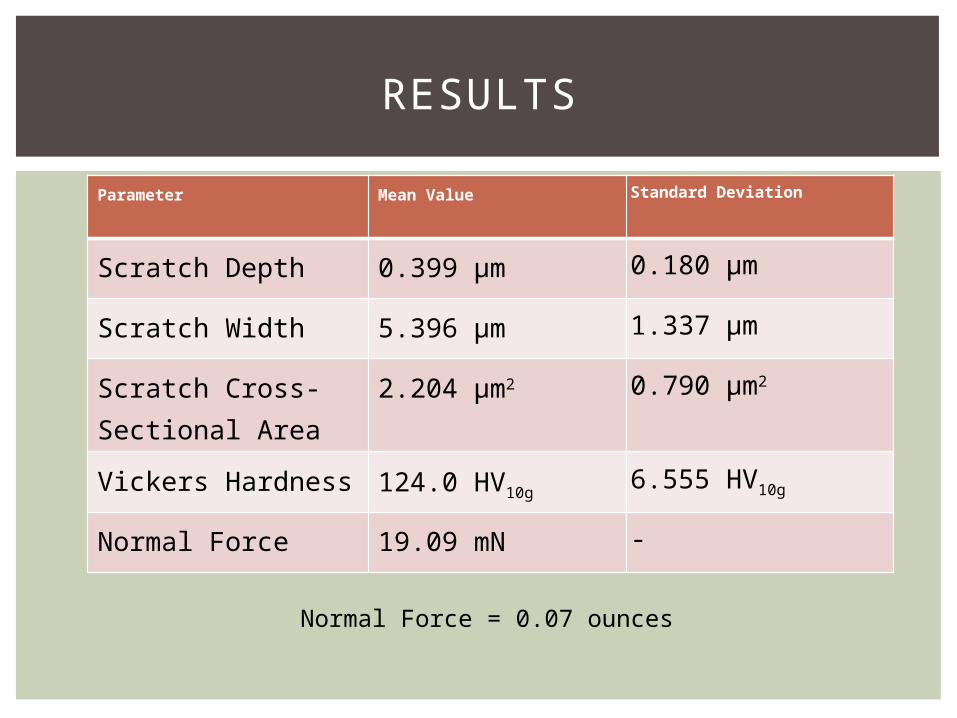
Parameter Mean Value Standard Deviation
Scratch Depth 0.399 µm 0.180 µm
Scratch Width 5.396 µm 1.337 µm
Scratch Cross-Sectional Area
2.204 µm2 0.790 µm2
Vickers Hardness 124.0 HV10g6.555 HV10g
Normal Force 19.09 mN -
RESULTS
Normal Force = 0.07 ounces

OLYMPUS USPM-RU IIIMICRO SPECTROPHOTOMETER
Turned Al 6061-T6 @ 0.05mm/rev @ 2000 rpm (~3.94 in/min)
Took measurements of surface on confocal microscope
Mass Finished for 30s, 1 min, 4min, 10 min, 30 min, & 60 min taking measurements of the surface at each time interval
Also, measurements were taken with the spectrophotometer
EXPERIMENT, REFLECTIVITY

IMAGES OF SURFACES (20X)
Initial 30s 1 min
4 min 10 min 1 hr.

SPECTROPHOTOMETER RESULTS (INITIAL)
350 400 450 500 550 600 650 700 750 8000
10
20
30
40
50
60
Percentage of LIght Returned vs. Wavelength
Series1
Wavelength, nm
Refl
ecti
vit
y,
%
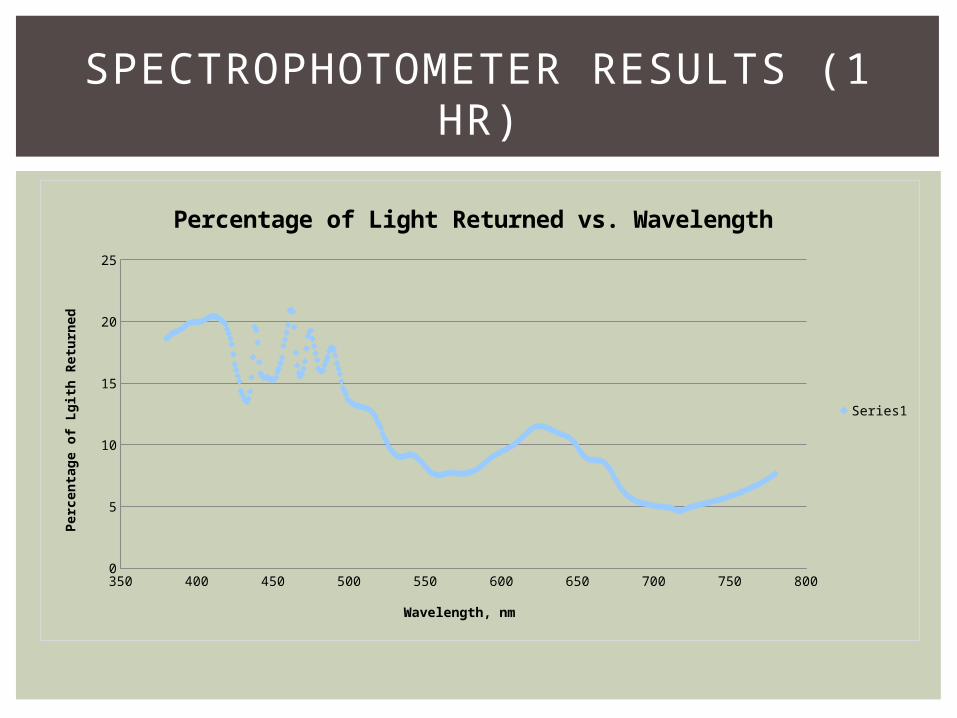
SPECTROPHOTOMETER RESULTS (1 HR)
350 400 450 500 550 600 650 700 750 8000
5
10
15
20
25
Percentage of Light Returned vs. Wavelength
Series1
Wavelength, nm
Perc
enta
ge o
f Lgit
h R
etu
rned

ROUGHNESS VS. TIME
0 10 20 30 40 50 60 700
0.1
0.2
0.3
0.4
0.5
0.6
Roughness vs. Time in Finisher
Time, min
Ra,
µm
2

RELATIVE AREA VS. SCALE FOR ALL TIMES100X OBJECTIVE

REFLECTIVITY VS. TIME
0 10 20 30 40 50 6015
20
25
30
35
40
Reflectivity (405 nm) vs. Time
Time, min
Refl
ecti
vit
y,
%

RELATIVE AREA VS. REFLECTIVITY
0.995 1 1.005 1.01 1.015 1.02 1.025 1.03 1.035 1.040
5
10
15
20
25
30
35
40
f(x) = − 384.506259924448 x + 418.828154411647R² = 0.870142559702443
Relative Area (2 µm2) vs. Reflectivity (405 nm)
Relative Area, µm2
Refl
ecti
vit
y,
%
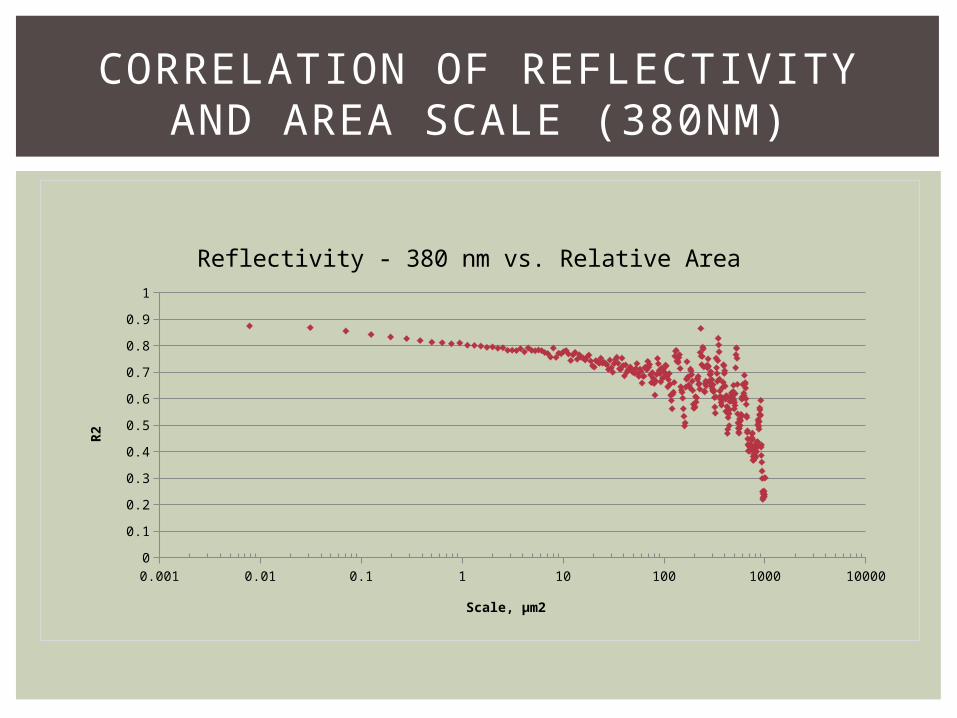
CORRELATION OF REFLECTIVITY AND AREA SCALE (380NM)
0.001 0.01 0.1 1 10 100 1000 100000
0.1
0.2
0.3
0.4
0.5
0.6
0.7
0.8
0.9
1
Reflectivity - 380 nm vs. Relative Area
Scale, µm2
R2
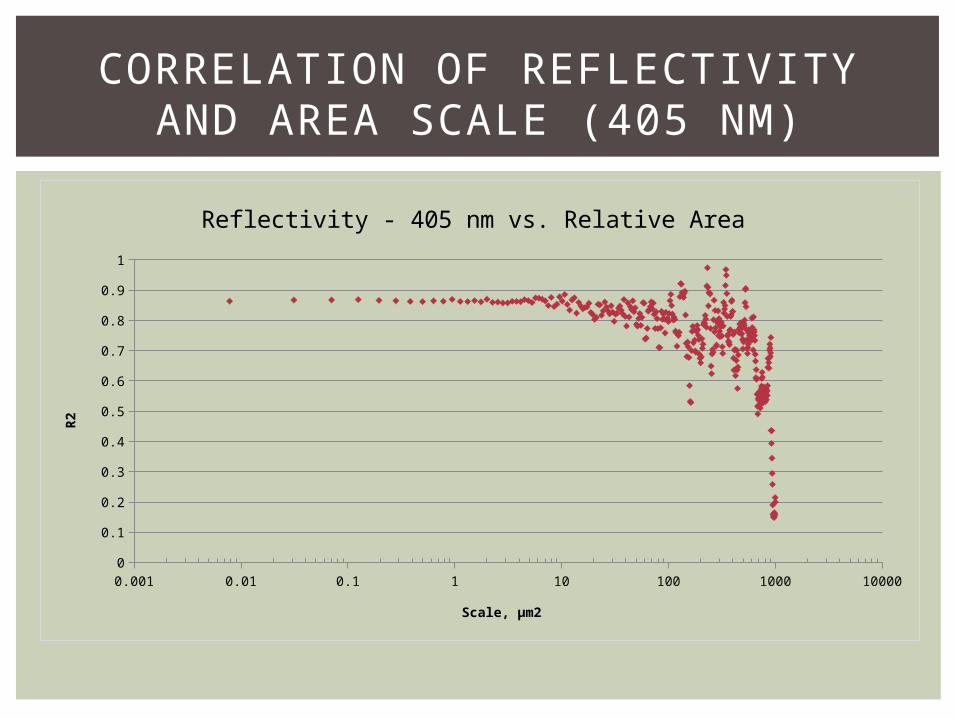
CORRELATION OF REFLECTIVITY AND AREA SCALE (405 NM)
0.001 0.01 0.1 1 10 100 1000 100000
0.1
0.2
0.3
0.4
0.5
0.6
0.7
0.8
0.9
1
Reflectivity - 405 nm vs. Relative Area
Scale, µm2
R2

CORRELATION OF REFLECTIVITY AND AREA SCALE (515 NM)
0.001 0.01 0.1 1 10 100 1000 100000.000.100.200.300.400.500.600.700.800.901.00
Reflectivity - 515 nm vs. Relative Area
Scale, µm2
R2

3D GRAPH OF AREA SCALE, WAVELENGTH, AND CORRELATION

Best correlations found at 405 nm and a scale of ~2μm2
This Wavelength of light is the same used in the confocal microscope’s laser Unsure of significance of this finding
Correlations drop off significantly after ~450 nm and again at ~600 nm
RESULTS


