86
Public Disclosure Authorized Public Disclosure Authorized Public Disclosure Authorized Public Disclosure Authorized

December 31, 2004
Document of the World Bank
Report No. 31193-NI
NicaraguaDrivers of Sustainable Rural Growth andPoverty Reduction in Central AmericaNicaragua Case Study
(In Two Volumes) Volume I: Executive Summary and Main Text
Department of Environmentally and Socially Sustainable DevelopmentLatin America and the Caribbean Region
Rep
ort N
o. 3
11
93
-NI
Nicaragu
aD
rivers of Su
stainab
le Ru
ral Gro
wth
and
Poverty R
edu
ction
in C
entral A
merica V
olu
me I
Pub
lic D
iscl
osur
e A
utho
rized
Pub
lic D
iscl
osur
e A
utho
rized
Pub
lic D
iscl
osur
e A
utho
rized
Pub
lic D
iscl
osur
e A
utho
rized


iii
Table of Contents
VOLUME I Abbreviations and Acronyms ............................................................................................. ii Acknowledgements.......................................................................................................... viii Foreword ............................................................................................................................ ix Executive Summary ............................................................................................................. x 1. Introduction................................................................................................................ 1 2. Characterization of the Nicaragua Rural Economy and Policy Directions ............... 8 3. Rural Household Performance and Assets in Nicaragua ......................................... 16 4. Summary of Spatial, Household-Level and Qualitative Analyses .......................... 29 5. Conclusions and Recommendations ........................................................................ 52 References......................................................................................................................... 60 Boxes 2.1. Land Issues in Nicaragua........................................................................................... 8 3.1. Interpreting the Study’s Scatter Plots ...................................................................... 19 4.1. The Regression Model ............................................................................................. 41 4.2. Endogeneity and Causality in the Regressions ........................................................ 43 4.3. Livelihood Studies in Rural Nicaragua.................................................................... 46 4.4. Assets of Rural Households..................................................................................... 49 4.5. Project Stocktaking Exercises.................................................................................. 51 Tables 2.1. Distribution of Population: Urban-Rural, by Region, 2001....................................... 9 2.2. Distribution of Poverty and Extreme Poverty, 1993, 1998, 2001............................ 11 2.3. Poverty Rates and Absolute Numbers of Poor and Extreme Poor,
1993, 1998, 2001...................................................................................................... 11 2.4. Estimated Shares of Rural Poverty by Region, 2001............................................... 12 2.5. Estimated Numbers of Poor and Extreme Poor by Region, 2001 ........................... 12 3.1. Measures of Well-being and Household Conditions, 1998 and 2001a .................... 17 3.2. Human Assets, Rural Nicaragua, 1998 and 2001 .................................................... 21 3.3. Race of Household Head and Measures of Well-being, Rural Nicaragua, 2001..... 22 3.4. Physical Assets of Rural Households, 1998 and 2001a ........................................... 23 3.5. Poverty and Land Ownership: Incidence of Extreme and Moderate Poverty ......... 24 3.6. Mean Change in Well-being 1998-2001, by Landholding, Rural Households ....... 25 3.7. Measures of Access to and Adequacy of Infrastructure, Rural Households, 2001 . 26 3.8. Participation in Community Organizations, Rural Households, 1998 and 2001..... 27 3.9. Rural Sources of Employment................................................................................. 28 4.1. Nicaragua’s Five Economic Dynamism Zones ....................................................... 30

iv
4.2. The “Prime Gradient” for Nicaragua ....................................................................... 34 Figures 1.1. The Asset-based Approach: Assets, Livelihood Strategies and Well-Being
Outcomes ................................................................................................................... 7 2.1. Map of Nicaragua .................................................................................................... 10 3.1. Density Distributions and Differences of all Households’ Consumption ............... 18 3.2. Scatter Plots of Changes in Well-being, all Nicaragua and by Urban and Rural
Areas ........................................................................................................................ 20 4.1. Zone-by-Zone Maps of Economic Dynamism ........................................................ 31 4.2. Zones of Economic Dynamism, All of Nicaragua................................................... 32 4.3. Cumulative Area and Number of Extremely Poor People, by Travel Time to
Managua................................................................................................................... 35 4.4. Cumulative Poor Population by Poverty Density .................................................... 35 4.5. Extreme Rural Poverty Density Map....................................................................... 37 4.6. Nicaragua Poverty Map ........................................................................................... 38 4.7. Regional Distribution of Extreme Poverty Density Map......................................... 40

v
VOLUME II Abbreviations and Acronyms ............................................................................................. ii Appendixes 1. Using an Asset-Based Approach to Identify Drivers of Sustainable Rural Growth
and Poverty Reduction in Central America: Conceptual Framework ....................... 1 2. Nicaragua Mapping Rural Economic Dynamism:................................................... 24 3. Nicaragua Economic Geography: A Snapshot ........................................................ 37 4. Changes in Well-being in Rural Nicaragua, 1998-2001: A Household-level
Analysis.................................................................................................................... 64 5. Summary Report: Nicaragua Livelihood Studies and Project Stocktaking Exercises ................................................................................................................ 113 Boxes 1.1. Sectoral and spatial linkages...................................................................................... 4 1.2. The mystery of assets................................................................................................. 7 1.3. Why the poor are poor: Lack of assets and low asset productivity .......................... 9 1.4. Defining a livelihood ................................................................................................. 9 5.1. Description of the project stocktaking methods .................................................... 121 Tables 1.1. Toward a New Rural Development Strategy for Central America.......................... 21 1.2. Household-level assets and links to other levels...................................................... 22 2.1. Classification of soils............................................................................................... 26 2.2. Climatic zones.......................................................................................................... 32 2.3. Overlay of indexes to define zones according to economic dynamism................... 33 3.1. Geographic typology of UBE 2002 ......................................................................... 38 3.2. The Prime Gradient.................................................................................................. 39 3.3. Regression of ln Rural Extreme Poverty percentage on ln travel time to Managua 57 3.4. Regression of ln rural population density on ln travel time to Managua................. 57 3.5. Regression of ln rural population density on ln travel time to Managua and ln
percent of municipio within 60 minutes travel time of municipio seat ................... 57 3.6. Regression of ln rural extreme poverty density on ln travel time to Managua and
ln percent of municipio within 60 minutes travel time of municipio seat ............... 58 3.7. Regression of ln (farmed land/economically active rural population) on ln travel
time to Managua ...................................................................................................... 58 3.8. Regression of ln (farmed land/economically active rural population) on ln travel
time to Managua, ln percent of municipio within 60 minutes travel time of seat, and proportion of farmed land in perennials............................................................ 58
4.1. Description and summary statistics of variables used in regression analysis.......... 82 4.2. Summary statistics for five broad household typologies ......................................... 83

vi
4.3. Static regression results. Exogenous determinants of household well-being in 1998, remote households ......................................................................................... 86
4.4. Static regression results. Structural determinants of household well-being in 1998, remote households ......................................................................................... 87
4.5. Dynamic regression results. Determinants of changes in household well-being 1998-2001, remote households ................................................................................ 88
4.6. Static regression results. Exogenous determinants of household well-being in 1998, non-remote households .................................................................................. 89
4.7. Static regression results. Structural determinants of household well-being in 1998, non-remote households .................................................................................. 90
4.8. Dynamic regression results. Determinants of changes in household well-being 1998-2001, non-remote households......................................................................... 91
4.9. Static regression results. Exogenous determinants of household well-being in 1998, non-remote farmer household, low education ............................................... 92
4.10. Static regression results. Structural determinants of household well-being in 1998, non remote farmer households, low education .............................................. 93
4.11. Dynamic regression results. Determinants of changes in household well-being 1998-2001, non-remote farmer households, low education..................................... 94
4.12. Static regression results. Exogenous determinants of household well-being in 1998, non-remote farmer households, high education............................................. 95
4.13. Static regression results. Structural determinants of household well-being in 1998, non-remote farmer households, high education............................................. 96
4.14. Dynamic regression results. Determinants of changes in household well-being 1998-2001, non-remote farmer households, high education ................................... 97
4.15. Static regression results. Exogenous determinants of household well-being in 1998, non-remote non-farmer households, low education....................................... 98
4.16. Static regression results. Structural determinants of household well-being in 1998, non-remote non-farmer households, low education....................................... 99
4.17. Dynamic regression results. Determinants of changes in household well-being 1998-2001, non-remote non-farmer households, low education ........................... 100
4.18. Static regression results. Exogenous determinants of household well-being in 1998, non-remote non-farmer households, high education ................................... 101
4.19. Static regression results. Structural determinants of household well-being in 1998, non-remote non-farmer households, high education ................................... 102
4.20. Dynamic regression results. Determinants of changes in household well being 1998-2001, non-remote non-farmer households, high education .......................... 103
4.21. Determinants of multiple job holding, all rural areas ............................................ 107 4.22. Determinants of probability that one household member migrated in 1998,
all rural areas.......................................................................................................... 108 4.23. Determinants of participation in community-based committees (Probit model)... 111 4.24. Determinants of use of improved seed varieties, farmer households .................... 112 5.1. Assets of “extreme poor” rural households ........................................................... 127 5.2. Assets of “poor” rural households ......................................................................... 127 5.3. Assets of “better-off poor” rural households ......................................................... 128 5.4. General characteristics of communities ................................................................. 128 5.5. Principal livelihood strategies................................................................................ 129

vii
5.6. Description of ESSD project objectives and major components ........................... 130 5.7. Pillar #1 – Broad-based economic growth, Nicaragua CAS 2002......................... 131 5.8. Rural-related initiatives from other pillars, Nicaragua CAS 2002 ........................ 133 Figures 1.1. Schematic presentation of the asset-based approach: Asset, context, behavior,
and outcomes ........................................................................................................... 23 2.1. Agricultural Potential............................................................................................... 29 2.2. Access to Infrastructure and Markets ...................................................................... 31 2.3. Climatic zones.......................................................................................................... 33 2.4. Zone high dynamism................................................................................................ 34 2.5. Zone medium dynamism.......................................................................................... 34 2.6. Zone low dynamism................................................................................................. 34 2.7. Zone in dry lands ..................................................................................................... 34 2.8. Zones according to economic dynamism................................................................. 35 3.1. Intercorrelation of accessibility, rural poverty, rural population density................. 39 3.2. Within-municipio access vs. access to Managua..................................................... 41 3.3. Rural extreme poverty rate vs. travel time to Managua........................................... 42 3.4. Extreme poverty rate vs. travel time to Managua, excluding Managua Region...... 42 3.5. Rural population density and Managua access ........................................................ 44 3.6. Cumulative poverty and area vs access to Managua ............................................... 45 3.7. Cumulative poor population by poverty density...................................................... 46 3.8. Land/labor ratio and travel time to Managua........................................................... 47 3.9. Percent forest cover and travel time to Managua..................................................... 48 3.10. Soil constraints and travel time to Managua............................................................ 49 3.11. Predicted poverty reductions vs. rural population density from universal road
improvement ............................................................................................................ 51 3.12. Proportion of farms privately owned, by size class ................................................. 55 3.13. Road network and assumed speed ........................................................................... 59 3.14. Relative travel time to Managua .............................................................................. 60 3.15. Population density, 2000, person/square km ........................................................... 60 3.16. Land use in farms, by municipio.............................................................................. 61 3.17. Area-weighted proportion of farm without documents, size class 100-500 Mz...... 62 3.18. Area-weighted proportion of farms without documents, size class 500+ Mz ......... 62 3.19. Elevation map, Central America.............................................................................. 63 3.20. Forests on slopes, Central America ......................................................................... 63 4.1. Relationship between diversification of job holding categories and household
well-being, 1998 .................................................................................................... 104 4.2. Relationship between diversification of job holding categories and increase in
household well-being, 1998-2001.......................................................................... 105 4.3. Relationship between diversification of job holding categories and variance in
household well-being, 1998-2001.......................................................................... 106

viii
Acknowledgements
This study was prepared under the overall guidance of Martin Raine, Sector Leader
for Central America in the Environmentally and Socially Sustainable Development (ESSD) Department at LCR. Francisco Pichon was the Task Team Leader for the study. Paul Siegel (Consultant, World Bank and FAO/CP), Jeffrey Alwang (Professor, Virgina Tech), Ken Chomitz (World Bank), Carlos Arce (Consultant, World Bank) and Jonathan Wadsworth (DFID/RUTA) were the main contributors and co-authors of the Nicaragua case study. Other members of the study team included: Ricardo Arias (Consultant, World Bank), Jorge Caballero (FAO), Richard Anson (Consultant, World Bank), and Martin Carnap (Consultant, World Bank). Diana Rebolledo provided administrative support.
The study team thanks Felipe Jaramillo, Robert Schneider and the entire Central America ESSD team for their intellectual guidance throughout the study. Many thanks are also due to Jane Armitage, Country Director for Central America, for her support to the ideas advanced by the study. Without support from FAO/CP and Selim Mohor, we could not have afforded the level of analytical effort demanded by the three country case studies. FAO facilitation remains key for dissemination and mainstreaming of the study's recommendations and subsequent technical assistance activities.
Many other people at the World Bank and institutions in Nicaragua made substantial contributions to the study. The “Programa Campesino a Campesino” (Farmer to Farmer Program or PCAC in Spanish) of the National Union of Farmers and Cattlemen (UNAG) should especially be recognized for their contribution to the livelihood studies collected from 56 communities throughout rural Nicaragua. The survey data collected by PCAC facilitators provide rich evidence about the multi-dimensional role of social capital and other assets in enabling or constraining exits from poverty.

ix
Foreword
In Central America, most of the poor are found in rural areas and much of the rural
population is poor. Ongoing debate revolves around the underlying causes of persistent rural poverty and the most appropriate mix of interventions to promote broad-based, poverty-reducing growth. The World Bank’s recent Rural Development Strategy for the Latin America and Caribbean Region has underscored the fact that governments and donors need information about tradeoffs between growth and poverty reduction. Should public investments be targeted towards more favored areas in the hope that synergisms and economies of agglomeration create conditions for self-sustaining rural growth? Or, should less-favored regions receive a larger share of this investment to compensate for historical under-investment in these areas? Which regions and households are best able to take advantage of the emerging opportunities? What should be done to support those who cannot?
This Central American regional study is part of ongoing efforts by the Environmentally and Socially Sustainable Development Department and the Central American Department in the Latin America and Caribbean Region of the World Bank to address these fundamental questions and to strengthen analyses and strategies for rural development. This regional study encompasses three Central American countries: Nicaragua, Guatemala and Honduras. The focus of this report is Nicaragua. The study complements other World Bank-supported economic sector work currently being carried out by other sectors in the Latin America and Caribbean region.
The study is also motivated by several other factors: First is the recognition that sub-national regions are becoming increasingly heterogeneous and economically differentiated as part of ongoing processes of development and diversification, with some areas advancing and others being left behind. Second is the acceptance that one rural strategy does not fit all; design of an appropriately tailored rural strategy requires understanding the assets, markets, and institutions that frame household opportunity sets and livelihood strategies. Third, rural heterogeneity requires identification of sufficiently homogeneous areas and household types to facilitate policy formulation, investment strategies, and project design. Fourth, there is a need to bridge the gap between conceptual strategies and their timely implementation in order to obtain tangible and sustainable results. To this end, it is necessary to identify the appropriate sequencing and complementary of investments in assets needed to drive growth and reduce poverty.

x
DRIVERS OF SUSTAINABLE RURAL GROWTH AND POVERTY REDUCTION IN CENTRAL AMERICA:
NICARAGUA CASE STUDY
Executive Summary
Study Objectives
For millions of people in Central America, the question could not be more important: which priorities for public investments in rural development can best achieve sustainable growth and poverty reduction in the region? Should scarce public investments be targeted toward more favored areas that have better prospects for self-sustaining rural growth? Or should less-favored regions receive a larger share of this investment to compensate on equity grounds for historical under-investment in these areas? Which regions and households are best able to take advantage of the emerging opportunities? What should be done to support those who cannot?
This Central American regional study is part of ongoing efforts by the Environmentally and Socially Sustainable Development Department and the Central American Department of the World Bank to address these fundamental questions and to strengthen analyses and strategies for rural development. This regional study encompasses three Central American countries: Nicaragua, Guatemala, and Honduras. The focus of this report is Nicaragua. The study complements other World Bank-supported economic sector work currently being carried out by other sectors in the Latin American and Caribbean region.
The objective of the study is to understand how broad-based economic growth can be stimulated and sustained in rural Central America. The study identifies “drivers” of sustainable rural growth and poverty reduction. Drivers are defined as the assets and combinations of assets needed by different types of households in different geographical areas to take advantage of economic opportunities and improve their well-being over time. The study examines the relative contributions of these assets, and identifies the combinations of productive, social, and location-specific assets that matter most to raise incomes and take advantage of prospects for poverty-reducing growth. By examining the role of assets in achieving development objectives, it is hoped that subsequent policy and investments will have a sustainable impact on poverty reduction in rural areas.
Sub-objectives of the study include to:
• Examine recent changes in well-being for different areas of the country and different population sub-groups
• Describe the asset bases of rural households and understand how assets and combinations of assets contribute to well-being and rural growth

xi
• Examine how the Bank’s current portfolio of Environmentally and Socially Sustainable Development and other sector projects can better contribute to improving the asset bases of rural households
• Provide guidance for strategies and investment priorities in Central America.
Conceptual Approach
This study adopts an asset-based conceptual approach. Assets are defined to include natural, physical, financial, human, social, political, institutional, and location-specific assets. The study focuses on how households deploy their assets within the context of policies, institutions, and risks to generate a set of opportunities. Households respond to these opportunities by allocating their assets and selecting livelihood strategies that ultimately determine their well-being outcomes. Assets enable better risk management, empower people to participate in political and social life, and have impacts on levels of household well-being, incomes, and future growth potential. Through these outcomes and subsequent investment decisions, the household’s future asset base is determined.
The study is not trying to identify particular enterprises or sub-sectors that might stimulate growth and poverty reduction. Instead it analyzes the quantity, quality, and productivity of assets needed by households in different geographical areas to exercise their potential for generating long-term growth and improving well-being under a particular enterprise or development path. The asset-based approach is well-suited for understanding and analyzing the Nicaraguan rural economy because of the unequal distribution of assets, high exposure to natural, economic, and social risks, and ongoing economic, political, and institutional reforms -- all of which influence prospects for rural growth and poverty reduction.
The study's focus on assets is appropriate given historically stark inequalities in the distribution of productive assets among households in the region. Such inequalities are likely to constrain how the poor share in the benefits of growth, even under appropriate policy regimes. Because of these inequalities, policy and market-based reforms alone cannot quickly level the playing field between the asset poor and those who possess the complementary assets necessary to exploit economic opportunity. Indeed, some growth-oriented investments can bypass poor households and deepen inequalities without targeted interventions to build the asset bases of the poor. The focus on assets also helps delineate public and private roles in building and strengthening asset bases. Major Findings Overall conditions in Nicaragua improved between 1998 and 2001
Between 1998 and 2001, overall poverty declined slightly in Nicaragua. Reductions in the incidence of extreme poverty were responsible for most of the decline. About 58 percent of Nicaraguan households enjoyed an increase in real consumption expenditures per capita during this period. A relatively large number of households (almost 15 percent) moved out of poverty (rising above the poverty line). Even among the chronic poor, well-being

xii
improved. Many households below the poverty line experienced an improvement in well-being -- but not by enough to move them out of poverty in all cases. Many households that experienced improvements remain highly vulnerable to poverty
The first finding illustrates the importance of considering changes in well-being along the entire distribution of well-being. Analysts and policymakers are often primarily concerned with poverty-reducing improvements with respect to the poverty line. Yet broad-based growth is also evident in the form of improved well-being for households above the poverty line and for poor households that increase well-being, yet remain below the poverty line. A large proportion of the rural density occurred very close to the poverty line. This bunching close to the poverty line indicates that many households that experienced improvements in well-being between 1998 and 2001 remain vulnerable to poverty (that is, remain in danger of falling below the poverty line).
Profound regional differences in levels and changes in well-being in Nicaragua stem from inequalities in the distribution of productive, social, and location-specific assets
While overall conditions improved between 1998 and 2001 and reductions in rural poverty have been significant, some areas and households have prospered, while others have not. This heterogeneity of rural areas is caused by geographic inequalities in the distribution of a range of household assets, risks, opportunities, constraints, and historical investment decisions by households in response to these conditions. The variability in levels and changes in welfare within narrowly defined geographical areas highlights the appropriateness of an asset-based strategy that focuses not only on location-specific assets, but on household assets, as well. Heterogeneity creates challenges for analyses, policy formulation of rural growth policies, investment strategies, and the design of projects. Economic potential has a strong spatial pattern, with high potential areas close to the main cities
To draw implications for regional development strategies and targeting of investments, the study further investigated the themes of location and assets using standard tools of geographic information system and multivariate spatial and household level analyses. An overlay of spatially indexed municipal-level data was done to produce a regional typology of economic potential. By overlaying maps that reflect natural resource assets, access to infrastructure and markets, and climatic risks, the analysis identifies five economic dynamism zones, all hypothesized to have varying degrees of economic and market development. The analysis finds that economic potential has a strong spatial pattern, with high potential areas close to the main cities. The zones are not contiguous, reflecting high heterogeneity within municipios (municipalities) even at this level of aggregation. Economic potential does not automatically translate into improved well-being outcomes for all households

xiii
The study is ultimately interested in understanding how greater prospects for growth translate into improved economic performance of households. Key questions include: Are people better off in the high potential areas? If not, why not? An important issue for targeting public investments is to identify the combinations of productive, social, and location-specific assets that best enable households to take advantage of an area’s growth potential and contribute to improvements in their well-being. The striking result was that about half of the extreme rural poor in Nicaragua reside in the quarter of the country that is within four hour-drive from Managua: in the Central and Pacific regions, which are areas with high and medium economic potential. The Central region alone has the highest share of rural extreme poverty. Almost two-thirds (62.4 percent) of the country’s total population of rural extreme poor live there. Investments must focus on the complementary assets that the poor lack to allow them to take advantage of existing economic opportunities
We need to understand why despite the high potential of these regions, so many people living in them are poor, why an area’s economic potential does not automatically translate into greater prospects for improved well-being for the poor, and why so many single-asset investments focusing on these areas have had limited success in reaching the poor or have bypassed them altogether. These questions are of critical importance for the Nicaraguan government’s strategy of rural cluster development. Promoting clusters in areas with good transport and infrastructure access makes sense from the standpoint of business and cost-efficiency. But the strategy cannot reach the poor if it does not recognize the factors that prevent them from raising their incomes and taking advantage of prospects for poverty-reducing growth in high potential areas. Some of these factors are missing assets, others are poorly functioning institutions, and some are related to policy shortcomings. Targeting areas with high poverty rates will not necessarily reach areas with high numbers of poor
The spatial analysis also yields important insights for future investments. In particular, it raises important issues about the nature of tradeoffs between efficiency and equity in targeting rural development interventions. Investments targeted to areas with high poverty rates such as the Atlantic will not necessarily reach areas with high numbers of poor households such as the Central region. While most people in the Atlantic are indeed poor, most poor people do not live in the Atlantic given the region’s considerably fewer poor people per square kilometer, or much lower poverty densities.
There is need to consider both poverty rates and poverty density for developing growth and poverty reduction strategies. Investment in high poverty-density areas in the municipios located in the immediate circle around Managua and other urban centers in the Central and Pacific regions will reach high numbers of poor (but might imply large leakages to the non-poor). However, such targeting would exacerbate regional disparities in income, neglecting areas with the highest poverty rates, such as the Atlantic.

xiv
To generate substantial gains in poverty reduction and broad-based growth, complementarites between productive, social, and location-specific assets must be addressed
The spatial analysis explains much variation in assets and outcomes between municipos, but not all. And it does not address variation within–municipios. Its aggregate nature can mask substantial intra-regional differences. Household-level analysis is needed to quantify the links between assets, livelihood strategies, and well-being outcomes. By combining such data with results from qualitative livelihood surveys and participatory ESSD project stocktakings the study gains additional insights into the determinants of rural growth and poverty reduction.
The study found the most important assets to be education, infrastructure (especially access to roads), social capital, landholding size, and other location-specific assets. Other, less tangible assets also play key roles. For example, lack of information about markets and opportunities, and access to public services can represent major constraints to broad-based growth. Not all assets are equal in importance; some are effective only in combination with other assets, so public investment strategies should be coordinated across sectors. Education matters in all areas and for each type of household
Education, particularly completing primary school, has the most consistently positive impacts on household welfare of all assets considered in this study. The analysis found that households headed by people with less than four years of education are 20 percent worse off than others. However, the impacts of education on poverty reduction depend on other key productive assets, such as land, infrastructure, productive capital, and location. These complementarities reinforce the need for investments in complementary assets.
The positive impacts of education are direct and indirect. Education levels influence household decisions about productive investments, such as technology adoption, saving and investing in farm and equipment, diversification of employment sources, use of natural capital (private and common property), and participation in community organizations. All these factors are associated with improvements in household well-being. Policy and institutions should be designed to bolster returns to investments in education by facilitating access to farm and financial services. Improved road access has a positive impact on changes in well-being, but its significance depends on a number of factors
The analysis confirmed expectations about the role of remoteness; remote households tend to be poorer and have fewer prospects for growth than non-remote households. Access to roads and landholding interact to affect welfare; road improvements in combination with larger landholdings have a strong positive impact on welfare. Thus better roads disproportionately benefit people with larger landholding sizes in remote areas, but a road-building program together with land access may be a good means of improving welfare in remote rural areas.

xv
As with education, roads and other market-related infrastructure have direct and
indirect impacts on well-being through their influence on household economic decisions and livelihood strategies. Some of these results reflect selectivity: asset rich households tend to choose to live in less remote areas. They also have the ability to choose more productive livelihood strategies. However, infrastructure access promotes technology adoption, diversified farms, wage- and self-employment outside of agriculture, accumulation of land and livestock, participation in community organizations, and development of credit relations. All these factors, working together, can improve levels and changes in household well-being.
Access to land is an important determinant of well-being in rural Nicaragua, but livelihood strategy also matters
Landless rural families constitute the most prominent group at risk of being poor in Nicaragua. Although landless households experience higher rates of poverty, increased landholding is not necessarily associated with lower poverty rates. Livelihood strategies, especially if they include rural non-agricultural activities, are also important. The relationship between landholding size and economic well-being depends, among other things, on land quality, its suitability for agricultural production, its proximity to markets, and on other complementary assets, especially education and infrastructure. The amount of land under irrigation is positively associated with farm-household well-being. Farmers using modern seed and chemical inputs were also better off, holding all else constant, than those who did not use these inputs.
Assets can complement and substitute for one another
No unique minimum or optimal asset bundle applies to every household or region. For example, road access substitutes for landholding size in remote areas, but distance from services makes education even more important. Infrastructure investments are more effective when directed toward areas with better land security and access. Households with low education (and lacking other assets) do not benefit as much from better roads. Social capital of communities compensates for lack of location-specific assets.
Strong local level institutions and social capital can compensate for lack of physical assets
Strong local level institutions are key to managing community affairs such as provision of basic services, regulation of natural resource use, mediation of conflicts, and coordination of community development. Water committees, school committees, credit associations, sharecropper associations, and churches are commonly found in communities. In the absence of formal institutions in isolated rural areas, these organizations fill a critical role. Much of the potential for poverty-reducing growth lies in the dynamism of communities, their local level institutions and social assets.
Evidence from the multivariate household analysis and qualitative studies shows that
social capital can substitute for location disadvantages. Strong communities make greater and more intensive use of their natural capital. They increase productivity and facilitate social

xvi
action in the face of crises. These actions can generate social innovation and lead to greater participation and interaction with external agents and more coordinated demands to the government. By strengthening their productive, economic, and social organizations, communities enhance their other assets. Multisectoral approaches tend to be more often advocated than implemented
Findings from ESSD project stocktakings confirm the need for improved complementarity of investments and cross-sectoral cooperation to realize highest levels of project impacts. ESSD investments in agricultural technology, forestry, and land administration can be more effective in reducing poverty if they can be properly coordinated with investments in physical and social infrastructure and public services. For example, improvements in agricultural technology and extension should be linked to improved access to education, markets, and infrastructure, such as roads, telecommunications, and finance.
From the perspective of beneficiaries, most projects have tended to provide only
partial solutions to their general lack of assets. They report that “missing” or poorly functioning assets often limit project impacts. Investments in social services and infrastructure are highly valued, but there is a high demand for productive assets that increase the earning capacity of households. The challenge is to separate the public and private roles in providing productive assets; at a minimum, the public sector should reduce inefficient barriers to productive asset accumulation. Recommendations
The following recommendations should be placed in the context of supporting efforts to strengthen the analytical underpinnings of: (a) the World Bank’s assistance program, with the aim of supporting work to implement effectively its Country Assistance Strategy and achieve the expected outcomes in the ESSD and other sectors; and (b) the Government of Nicaragua’s on-going work to operationalize its Poverty Reduction Strategy (National Development Plan) and the Ministry of Agriculture and Forestry’s Rural Productivity Strategy. Move from geographically untargeted investments in single assets to a more integrated and geographically based approach of asset enhancement with proper complementarities
Investments in single assets (e.g. roads, education, agricultural technology) need to be complemented by provision of other assets to achieve broad-based poverty-reducing growth. Otherwise, their benefits can bypass households that lack these complementary assets. Investments in education, roads, and other infrastructure related to access to markets intensify the positive effects of investments in agriculture and other land-based production strategies, which by themselves have limited impacts on growth and poverty reduction. Improved complementarity of investments with increased cross-sectoral cooperation is necessary to realize project impacts. A multisectoral and spatially differentiated investment program is required to upgrade and improve access to household assets. The appropriate roles of the public and private sectors in providing access to assets needs to be carefully

xvii
considered. At a minimum market failures and information asymmetries should be addressed through public actions and barriers to asset accumulation should be identified.
If the development objective is to reach the largest number of poor, invest in a variety of social and productive household assets in higher potential areas with the highest rural poverty densities
Most poor people in Nicaragua reside in areas that are already favored by relatively good access (internal and long distance), better soil, and more secure land tenure. Because both the general rural population density and the rural poverty density are higher in these areas, virtually any intervention that involves fixed service provision will have a lower unit cost in these areas; however, possible leakages to the non-poor need to be considered. In particular, there are probably agglomeration economies, rather than diminishing marginal returns, to infrastructure improvement in these areas. For instance, better road networks can improve access to markets, health centers, and location assets. If investments are made in services for which use by non-poor can be controlled, targeting high poverty density areas would maximize the benefits to the poor per dollar invested. If the investments produce non-rival goods (those for which consumption by one person does not preclude use or consumption by another—roads, for example) then targeting high poverty density areas also makes sense.
Remote areas such as the Atlantic need specialized analyses and differentiated strategies and investments
Targeting infrastructure and service-delivery interventions on less remote, more densely populated areas might benefit more poor people than a similar investment in less dense areas. However, as suggested above, a strategy of targeting “better endowed areas” might exacerbate regional disparities in income, neglecting the more remote areas with the highest poverty rates. Regional inequalities are of particular concern because the most remote areas have high proportions of indigenous populations. Moreover, remote areas such as the Atlantic include some of the larger blocks of natural forested areas and they are of considerable value in terms of biodiversity.
Frequently discussed options in these more remote areas include agroforestry, sustainable forest management for timber or non-timber forest products, ecotourism, forest protection services, and market for different types of “environmental services.” All these options face hurdles of financial viability directly related to low population density and inadequate production volume to warrant large-scale infrastructure investments. The challenge is to identify cost-effective interventions for reaching poor people with few assets of any kind, in areas of low population density.
Because of the high poverty rates in remote areas such as the Atlantic region, a project or investment need not have an explicit targeting mechanism; leakages to the non-poor are reduced in areas with higher rates of poverty. On the other hand, because population densities are low, investments should be spatially targeted to specific population clusters or placed so as to guarantee a reasonable standard of access, even in low population

xviii
density areas. Land titling and distance delivery of technical services might be appropriate in low density areas because they can be delivered across space at a minimal cost, especially when these areas enjoy relatively good agro-forestry potential and complementary infrastructure already exists. Asset investment programs need to be adapted according to the specific needs of regions and households
Some household assets programs should be national in nature (such as education and health), while others (such as investments in infrastructure, and productive and social capital assets) require more local adaptation and must be carried out in tandem, according to specific needs of regions and households. Household-level heterogeneity limits the appropriateness of “cookie-cutter approaches” to policies and programs designed to foster broad-based growth. Investment strategies should be formulated on broad regional bases, but options within regions should be tailored to local asset bases and other conditions. Investments should support decentralized planning and implementation, but informed central analysis and central funding are still necessary for the poorest, most remote areas
Heterogeneity implies a greater role for local decision-making. Central government should provide guidance for investments and national priorities, but seek local input and analysis before deciding on the final form of such investments. Projects should contain a menu of alternatives whose ultimate choice depends on local assets and conditions. Local development investments should be community-driven, but informed analysis and central guidance and funding are still necessary, especially for poorest, most remote areas. These recommendations are consistent with efforts toward decentralization supported by the Government’s recent “Ley de Decentralization.” There is need for more strategic convergence in linking the investment and impacts of sectoral projects backed by the World Bank and other donors in the diverse geographical regions of the country
Investments in the environmentally and socially sustainable development sectors in themselves have limited growth and poverty reduction impact unless they can build on complementary basic assets, especially in education, roads, and other market-related infrastructure. The Bank must improve the complementarity of Bank-supported investments and cross-sectoral cooperation. This is important for the Bank’s ability to prioritize new investments and increase its effectiveness in using the existing and proposed lending program to leverage more substantial gains in policy, regulatory, and institutional reforms that the Bank seeks in the country, as stated in the Country Assistance Strategy for Nicaragua (2002). A similar conclusion and overarching recommendation would apply to the investments carried out by the Government of Nicaragua and other collaborating partners. The proposed PRSC II and Sector Wide Approach program (SWAp) for the rural sector are taking programmatic approaches, which lend themselves to applying the asset-based framework.

xix
Although rural productive technology investments have improved productivity and diversification into higher-return activities, it is also clear that one or two productive assets are not sufficient for sustainable poverty reduction. SWAp needs to include a “package” of technology, land, finance, markets, business skills, social capital, and risk management. Where there is no SWAp, projects need to come together to achieve such integration and complementarities. The study confirms the strategic role of the proposed PRORURAL Program, which is currently being prepared as a SWAp for the rural sector in Nicaragua. While this operation is not being designed as a multisectoral operation, it can be an effective vehicle for carrying out many of the above recommendations, particularly if combined with other sectoral investment programs (social, infrastructure).


1
Chapter 1. Introduction 1.1. Context for the Study
Central American countries have been characterized by dualistic agricultural sectors and pervasive rural poverty throughout their history (Hereford and Echeverría 2003; de Ferranti and others 2004). Even though the Region has experienced a process of urbanization, most of the poor can be found in rural areas. Structural sources of rural poverty include unequal distribution of assets, inadequate investments in infrastructure and other public goods, ineffective delivery of public services such as health care and education, weak institutions, and policy biases against rural areas.
Since the early 1990s, many anti-rural policy biases in Central American countries have been reformed. During the 1990s, agricultural growth contributed to increased incomes and marginally lower rural poverty rates. This growth was largely driven by increasing prices of key agricultural commodity exports (notably coffee). Since the late 1990s agricultural prices have fallen dramatically. Lower agricultural prices have generated a sense of crisis in rural areas. The crisis is compounded by recurring natural disasters, which have negatively impacted rural populations and weakened their economic base. Potential policy changes, such as the Central American Free Trade Agreement (CAFTA), further contribute to the uncertainty, but also create opportunities for growth.
Traditional policy and market-based reforms cannot quickly resolve decades of structural constraints, including highly unequal access to productive and social infrastructure and skewed asset distributions. The human and economic cost of inequality and poverty is particularly stark among indigenous peoples, populations of African descent and women, many of who already belong to the poorest of the poor. Most of these social groups also have endured historical patterns of exclusion, which persist to this day. The violence and crime endemic to the Region compound the challenge. Although this violence is born of long-standing social, economic, and political inequalities, its influence has infiltrated the societies of almost every country in the region, retarding economic and social development, and undermining the confidence of citizens in government and public institutions.
Most vulnerable among the rural poor are those with small landholdings and landless farm workers who live in ecologically fragile areas, such as hillsides and sub-humid, drought-prone lands. Many of these areas lack basic transportation, communication, and social infrastructure. Households in such areas have limited assets and opportunities. They tend to have lower levels of education and larger families, yet have strong communal traditions and cultural values that are not always well understood in the context of the market economy. They are often net purchasers of food, producing primarily for subsistence or the local market. Their productivity has not kept pace with other sectors of the economy, and many see migration as their best opportunity to escape poverty.

2
Analysts acknowledge that new strategies are needed to promote sustainable poverty-reducing economic growth in rural Central America.1 A central theme is that agriculture cannot serve as the sole engine of poverty-reducing rural growth, and that a balanced and integrated multi-sectoral, spatial approach is needed. Such an approach will consider linkages between agricultural and non-agricultural activities, linkages across space, and relationships between household and community actions. Differences in environmental conditions and access to infrastructure and services, dictates a differentiated rural strategy that considers differences in household and spatial assets, together with the spread and concentration of formal and informal institutions. The strategy should encourage asset accumulation and be responsive to local conditions.
1.2. Study Objectives
The objective of the study is to understand how broad-based economic growth can be stimulated and sustained in rural Central America. The study identifies “drivers” of sustainable rural growth and poverty reduction. Drivers are defined as the assets and combinations of assets needed by different types of households in different geographical areas to take advantage of economic opportunities and improve their well-being over time. The study examines the relative contributions of these assets, and seeks to identify the combinations of productive, social, and location-specific assets that matter most to raise incomes and take advantage of prospects for poverty-reducing growth. By examining the role of assets in achieving development objectives, we can help ensure that policy has a sustainable impact on poverty reduction.
Sub-objectives of the study include to:
• Examine recent changes in well-being for different areas of the country and different population sub-groups
• Describe the asset bases of rural households and understand how assets and combinations of assets contribute to well-being and rural growth potential
• Examine how the Bank’s current portfolio of Environmentally and Socially Sustainable Development (ESSD) and other sector projects can better contribute to improving the asset bases of rural households
• Provide guidance for strategies and investment priorities in Central America.
This study adopts an asset-based conceptual approach. Assets are defined to include natural, physical, financial, human, social, political, institutional, and location-specific assets. The study focuses on how households deploy their assets within the context of policies, institutions, and risks to generate a set of opportunities. Households respond to these opportunities by allocating their assets and selecting livelihood strategies that ultimately determine their well-being outcomes. Assets enable better risk management, empower people to participate in political and social life, and have impacts on levels of household
1 See, for example, de Janvry and Sadoulet (2000); Echeverría (2001a); IFAD (2002); Valdes and Mistiaen (2001). The approach is reflected in the World Bank’s new rural strategy for Central America (World Bank 2002a).

3
well-being, incomes, and future growth potential. Through these outcomes and subsequent investment decisions, the future household asset base is determined.
The study is not trying to identify particular enterprises (such as cut flowers, broccoli, or snow peas) or sub-sectors (crop, livestock, forestry) that might stimulate growth and poverty reduction. Instead we analyze the quantity, quality, and productivity of assets needed by different household types in different geographical areas to exercise their potential for generating long-term growth and improving well-being. The asset-based approach is well-suited for understanding and analyzing the Nicaraguan rural economy because of the unequal distribution of assets, high exposure to natural, economic and social risks, and ongoing economic, political, and institutional reforms -- all of which influence prospects for rural growth and poverty reduction.
The study's focus on assets is appropriate given historically stark inequalities in the
distribution of productive assets among households and geographical areas in the country. Such inequalities are likely to constrain how the poor share in the benefits of growth, even under appropriate policy regimes. Because of these inequalities, policy and market-based reforms alone cannot quickly level the playing field between the asset poor and those who possess the complementary assets necessary to exploit economic opportunity. The focus on assets also helps delineate public and private roles in building and strengthening asset bases.
Indeed, some growth-oriented investments can bypass poor households and deepen inequalities without targeted interventions to build and strengthen the asset bases of the poor. A critical case in point for the Region is agriculture -- often the only livelihood strategy open to low-asset households. Land -- perhaps the most unequally distributed asset of all--is a key asset for mobilizing other assets that help guarantee subsistence consumption and generate the basis for further income-generating activity. Land concentration limits these mobilization effects. Unless large-scale concentrated holdings are especially absorptive of labor, the allocation of resources will remain inefficient, with low productivity of both land and labor.
1.3. Study Audiences
The primary audience of the study includes: Central America World Bank operational staff and management (ESSD and other sector units); government officials (policymakers and strategy implementers) in national planning and sectoral ministries; management and technical officers from donor organizations working on the rural sector in the Central America countries; and officials from major nongovernmental organizations (NGOs) and farmer groups promoting rural sector growth and poverty reduction.
The secondary audience includes: World Bank staff from LAC and other regions, where the conceptual and analytical approaches may be of relevance; and academicians who are carrying out relevant rural sector analytical studies.
The chapter continues with a presentation of the asset-based conceptual framework employed in the subsequent analyses. The analytical framework used for applying the asset-based approach to Nicaragua is then presented, with a roadmap outlining major components of the study. These components include a geographical information systems (GIS)-based
4
mapping exercise, an analysis of the determinants of household well-being using the 1998 and 2001 Living Standards Measurement Surveys (LSMS), and qualitative analyses of livelihoods and three World Bank projects. 1.4 The Asset-based Conceptual Framework
The conceptual framework used in this study is anchored to an asset-based approach. 2 The approach provides insights that are particularly appropriate for examining rural poverty and the potential drivers of growth. The framework includes the following components: assets (productive, social, location-specific), the context (policies, institutions and risks), household behavior (livelihood strategies), and outcomes (measures of household well-being). Household and community decisions determine outcomes such as household well-being, environmental preservation, and community prosperity. The welfare-generating potential of assets depends on the asset-context interface. Policy reforms and building of assets need to be considered in tandem (see figure 1.1).
A household’s assets consist of the stock of productive, social, and location-specific resources used to generate well-being3 (see Moser 1998; Siegel and Alwang 1999; Rakodi 1999). Household assets are drawn from individual, household, community, and national and global levels. Assets include human factors such as age, education and family structure; natural capital; physical capital such as land, equipment, and housing; financial assets; location-specific factors such as access to infrastructure and social services; and social, political, and institutional assets that include social and political networks and social inclusion. According to the asset-based framework, the poor are “asset-poor,” have limited assets, hold assets with low welfare-generating potential, or are unable to exploit their assets effectively.
Certain assets are effective only if combined with others; asset complementarity matters. For example, access to high-quality land has different implications for well-being depending on its location relative to markets and other infrastructure, on access to credit, and on high-quality inputs. Education may have markedly different implications for welfare generation depending on location and the functioning of labor markets and related institutions. Good transport and market infrastructure are essential for successful adoption of higher-productivity agricultural technology. Other important determinants of asset productivity include regulatory and legal systems, which determine the security and
2 See appendix 1 and Siegel (2005) for a more detailed presentation. 3 Natural assets include the quantity and quality of land, water and forest resources, agro-ecological conditions (elevation, slope, climatic factors), and soil conservation investments. Physical assets include durables such as livestock, machinery and equipment, the household’s dwelling and other buildings. Human assets include size and composition of the household, education levels, training and technical assistance received, and ethnicity. Financial assets include savings, credit, transfers (remittances and other cash transfers), and liquid stocks. Social and political assets include membership in various types of organizations, participation in collective action, social and political networks and social inclusion, voting rights, and participation in community, local and national elections. Finally, location-specific assets are related to the geographical location of the household and include access to population centers, markets, roads and public services, and population density.

5
transferability of assets, and the existence of means of exclusion. These factors are part of the context.
The context in which households operate helps determine the welfare-generating potential of assets and prospects for improved well-being. The political, legal, and regulatory contexts affect how household assets are managed and the extent to which successful livelihood strategies can be undertaken (Zezza and Llambi 2002). Exposure to risk is also a part of the context. Risk has both an intrinsic and instrumental cost. Risk creates fluctuations in consumption and lowers household well-being. The instrumental cost of risk is due to its impact on household responses. The costs of risk management include lower growth due to risk-avoidance behavior and risk-reducing activities, and costs associated with coping activities (Siegel and Alwang 1999). Domestic and international policies, institutions and markets, and forces of nature shape the context. In response, households allocate their assets and select livelihood strategies to manage risks associated with the prevailing context.
The opportunity set for households to achieve levels of well-being depends on the interface between assets and the prevailing context. Strategic management of household asset portfolios defines its behavior or livelihood strategy (Chambers and Conway 1992; Ellis 1998). Livelihood strategies refer to activities such as land and labor use decisions, investments in education, migration, participation in social capital building and other assets. Asset holdings determine the ability to undertake a given enterprise and the productivity of resources allocated to that enterprise; this ability and the potential returns of the strategy depend also on the context. Livelihood strategies include a range of on- and off-farm agricultural and non-agricultural activities (Berdegue, Reardon, Escobar 2001; Corral and Reardon 2001). In the asset-based approach, asset accumulation and changes in livelihood strategies are important drivers of sustained improvements in well-being.
Ultimately, we are concerned with outcomes that reflect household well-being and prospects for growth over time. The asset-based conceptual framework leads us to consider a variety of measures of household well-being and to use quantitative and qualitative analyses. In addition to income and consumption, poor rural households are concerned about food security, health status, vulnerability in general, empowerment and self-esteem, participation in community affairs, environmental quality, and hopefulness toward the future (Narayan and others 2000). 1.5. Study Analytical Components and Organization of the Report
The asset-based framework is amenable to a number of analytical techniques, but experience shows that simultaneous use of complementary methods deepens understanding of the relationship between assets, policy, and growth potential. This study combines graphical mapping techniques, quantitative household analysis and qualitative analyses of assets and livelihoods. The combination generates a description of rural space that recognizes the differential effect of policies in different households and regions.

6
The case study for Nicaragua has the following components: Chapter 1: Introduction Chapter 2: Characterization of the rural economy of Nicaragua and the policy context, including key sectoral issues and policy directions to combat rural poverty Chapter 3: Descriptive analysis of rural households’ key asset bases and their relationship to recent changes in household well-being in different geographic regions of the country Chapter 4: Analytical results
The bulk of the report’s analytical results is summarized in chapter 4 to draw implications for investment priority setting. Qualitative information from livelihood studies and project stocktakings helped ground-truth results from the quantitative analyses and assess communities and household’s perceptions of the issues investigated by study.
• Overview of the spatial layout of the rural economy, including economic potential and geographic distribution of household poverty, income growth and well-being
• Descriptive and econometric micro-level analyses based on household-level data4 to understand:
(i) the location of households, the assets they hold, the risks they face, the livelihood strategies and outcomes they generate
(ii) the assets and asset combinations and livelihood strategies that lead to exits from poverty or lessening of the depth of poverty, and
(iii)the importance of spatial location in household performance and the empirical linkages with potential policy levers
• Qualitative assessment of community and households’ assets and livelihood strategies collected from 56 communities within identified sub-regions and household typologies to provide understanding of the multi-dimensional role of social capital and other assets in enabling or constraining exits from poverty
• Rapid participatory assessments with stakeholders involved with ongoing ESSD projects in Nicaragua related to agricultural technology, forestry, and decentralization to help identify “missing” or poorly functioning assets constraining project impacts
Chapter 5: Main conclusions and implications for priority setting of investments and other appropriate interventions
4 Data from 1998 and 2001 for a panel of households (Living Standards Measurement Surveys, or LSMS) and the 2001 Agricultural Census were used. The LSMS data were geo-referenced to the census data.

7
Figure 1.1. The Asset-based Approach: Assets, Livelihood Strategies and Well-Being Outcomes
Assets… .….within a given context
…determine the opportunity set
Productive assets Social assets Location assets o Policies and institutions Risks
o Natural resources (private and commons)
o Human capital (education, skills, health status, household composition)
o Physical capital (equipment, housing, transport)
o Financial capital (savings, stocks of grains and livestock, access to credit)
o Social networks
o Political networks (human rights, participation in political decisions)
o Access to infrastructure and services
o Distance to urban centers
o Agro-ecological zone (soil quality, climatic conditions)
f
O P T I O N S
o Macroeconomic and trade policies
o Sectoral policies and institutions
o Political and market liberalization, decentralization, privatization
o Legal and regulatory systems, property rights and contracts
o Human rights, labor laws o National and local
governments and institutions o Private sector development
in factor and product markets o Social protection and safety
nets
o Price and market risk
o Droughts and floods
o Natural disasters
o Diseases and pests of animals and plants
o Human diseases
o Physical insecurity
o Discrimination
Well-being outcomes … for Livelihood strategies (behavior) o Income and consumption
o Savings
o Food security
o Health and nutritional
status
o Self-esteem
o Leisure and recreation
o Empowerment
o Environmental quality
o Hopefulness about the future
o On-farm activities agricultural activities
o Off-farm agricultural, non-agricultural activities
o Commercial activities, microenterprise
o Migration, receipt of remittances
o Activities to strengthen social, environmental assets
o Participation in social assistance and safety nets

8
Chapter 2. Characterization of the Nicaragua Rural Economy and Policy Directions
Chapter 2 presents a characterization of the rural economy of Nicaragua and the
policy context, including key sectoral issues and policy directions to combat rural poverty. 2.1. Rural Poverty in Nicaragua
Nicaragua is a relatively poor country. In 2000, per capita income was about US$400, about half the level that prevailed in 1980 (in real terms).5 The country is still struggling to recover from the political, social, and economic upheavals the occurred between 1979 and 1990, including civil war. These upheavals destroyed infrastructure, reduced productivity, and increased poverty. Political and economic reforms that began in 1991 are still creating adjustments in economic, political, and social conditions in Nicaragua.
Rural Nicaragua is characterized by high inequality in access to land and uncertain tenure regimes (Corral and Reardon 2001) (see box 2.1). 6 The many smallholders tend to concentrate production on staple foods. Commercialization of inputs and outputs is minimal, agricultural productivity is low, and input and output markets function poorly (World Bank 2002b). The agricultural frontier is rapidly expanding, leading to deforestation and loss of forest resources. Social infrastructure is limited and education and health indicators are low. Administrative capacity is hindered by overlapping jurisdictions and lack of coordination. Donor activities are not well coordinated. A lack of an articulated vision and consistency in rural project formulation has limited the poverty-reducing impact of investments in rural areas (World Bank 2002b).
5 Figures on Nicaragua’s GDP vary by source. The annexes of the recent CAS (World Bank 2002e) present several figures. 6 Davis and Murgai (2000) calculate a Gini coefficient of .86 for land holding.
Box 2.1. Land Issues in Nicaragua A series of booms in coffee, cotton, sugar, and meat, together with policy distortions encouraging the accumulation of land, beginning in the late nineteenth century, encouraged a systematic process of land concentration and plantation-type farming systems. The Sandinista revolution of 1979 tried to address this situation through appropriations and redistribution of private and public land with or without legal titles (Deininger and Chamorro 2002). The post-Sandinista governments have addressed land issues, including claims for restitution and attempts by former and current occupants to obtain secure legal title. Resolution of land disputes has proceeded slowly (World Bank 2003a), but overall it has been considered fairly successful, if still incomplete (Deininger and Chamorro 2002; World Bank 2002b; Deininger, Zegarra, and Lavandez 2003). Although the process of land regularization has proceeded, land assets remain unevenly distributed, with most rural residents owning small tracts of agricultural land. Large proportions of the rural poor remain landless. The functioning of land markets has improved, but impacts on reducing disparities in the distribution of incomes and assets have been minimal, Deininger, Zegarra, and Lavandez (2003) report. The rural poor often lack complementary assets necessary to increase land and labor productivity.

9
Nicaragua’s population is estimated to be 5.2 million. Over 42 percent live in rural areas, which is close to the average for all Central American countries (World Bank 2003d) (see table 2.1). About 25 percent of the national population resides in the Department of Managua, where most commerce and manufacturing are concentrated. The cities of Matagalpa, Chinandega, León, Masaya, and Estelí are important centers (see figure 2.1). The Pacific and Central Regions each have about a third of the national population, but both regions are largely rural (42 and 62 percent rural for the Pacific and Central regions, respectively). About 45 percent of Nicaragua’s rural residents live in Central region. The more sparsely populated Atlantic Region is also primarily rural, with almost two-thirds of its residents residing in rural areas. However, the total population of the Atlantic Region is less than half of that in the Central or Pacific Regions. Table 2.1. Distribution of Population: Urban-Rural, by Region, 2001
Region Number of persons Share (%) National 5,205,000 100.0
Urban 2,995,000 57.5 Rural 2,210,000 42.5
Managua 1,300,000 25.0 Pacific 1,610,000 31.0
Urban 935,000 58.0 Rural 675,000 42.0
Central 1,615,000 31.0 Urban 621,000 38.5 Rural 994,000 61.5
Atlantic 680,000 13.0 Urban 235,000 34.5 Rural 445,000 65.5
Note: Pacific region includes Chinandega, Leon, Masaya, Granada, Carazo, and Rivas. Central region includes Nueva Segovia, Madriz, Esteli, Boaco, Chontales, Jinotega, and Matagalpa. Atlantic Region includes RAAN, RAAS, and Rio San Juan. Source: Population estimates from INEC: www.inec.gob.ni. (Numbers and percents are rounded).

10
Figure 2.1. Map of Nicaragua
Population growth during the 1990s was about 2.8 percent per year. Fertility rates are
twice the Latin America average, resulting in a young population, with a median age of 17. Since 1991 there has been considerable population movement, within regions, from rural to urban areas, and out of the country. An estimated 300,000 Nicaraguans work in Costa Rica, mostly as temporary migrants. Temporary migrants and émigrés are an important source of income.
Nicaragua has made progress in reducing poverty over the last decade (World Bank 2001b, 2003b). The proportion of the population living under the poverty line has declined continuously, according to the Living Standards Measurement Surveys (LSMS) carried out for Nicaragua in 1993, 1998, and 2001 (table 2.2). Nationally, poverty fell from 50.3 to 45.8 percent, and extreme poverty fell from 19.4 to 15.1 percent, from 1993 to 2001.

11
Table 2.2. Distribution of Poverty and Extreme Poverty, 1993, 1998, 2001 Incidence of extreme poverty (%) Incidence of poverty (%) Region 1993 1998 2001 1993 1998 2001 National 19.4 17.3 15.1 50.3 47.9 45.8 Urban 7.3 7.6 6.1 31.9 30.5 28.7 Rural 36.3 28.9 24.7 76.1 68.5 64.3 Managua 5.1 3.1 2.5 29.9 18.5 20.2 Pacific Urban 6.4 9.8 5.9 28.1 39.6 37.2 Rural 31.6 24.1 16.3 70.7 67.1 56.8 Central Urban 15.3 12.2 11.1 49.2 39.4 37.6 Rural 47.6 32.7 38.4 84.7 74.0 75.1 Atlantic Urban 7.9 17.0 13.1 35.5 44.4 43.0 Rural 30.3 41.4 26.9 83.6 79.3 76.7 Source: World Bank 2003b
National poverty rates mask the spatial distribution of poverty in Nicaragua. Poverty is mostly a rural phenomenon. Over 60 percent of the poor and over 75 percent of the extreme poor are located in rural areas (table 2.3). In general, the further one gets from Managua, the higher the rate of poverty. Over 50 percent of the rural poor and 62 percent of the rural extreme poor reside in the Central Region (table 2.4). The shares of rural poor and rural extreme poor are 26.1 and 18 percent for the Pacific Region, and 23.2 and 19.6 percent for the Atlantic Region (table 2.5). While the rates of poverty in the Atlantic Region are very high, the region’s absolute number of poor people is relatively low because of low population densities. Table2.3. Poverty Rates and Absolute Numbers of Poor and Extreme Poor, 1993, 1998, 2001 National National Poverty rate No. of poor Extreme poverty rate No. of extreme poor 1993 50.3% 2,100,000 19.4% 810,000 1998 47.9% 2,303,000 17.3% 835,000 2001 45.8% 2,386,000 15.1% 783,000 Rural, 2001 Poverty rate No. of rural
poor Extreme poverty rate No. of extreme
rural poor 1993 76.1% 1,323,000 36.3% 632,000 1998 68.5% 1,506,000 28.9% 635,000 2001 64.3% 1,471,000 24.7% 595,000

12
Urban, 2001 Poverty rate No. of urban
poor Extreme poverty rate No. of extreme
urban poor 1993 31.9% 777,000 7.3% 178,000 1998 30.5% 797,000 7.6% 200,000 2001 28.7% 915,000 6.1% 188,000 Note: No. of poor includes extreme poor and others below poverty line. Source: World Bank 2003b. Rural Shares of Nicaragua’s Poor and Extreme Poor Rural share of poor Rural share of extreme poor 1993 63.0% 78.0% 1998 65.4% 76.0% 2001 61.7% 76.0% Table 2.4. Estimated Shares of Rural Poverty by Region, 2001 Region Share of rural
extreme poor (%) Share of rural
poor (%) Pacific 18.0 26.1 Central 62.4 50.7 Atlantic 19.6 23.2 Table 2.5. Estimated Numbers of Poor and Extreme Poor by Region, 2001
Incidence of extreme poverty (numbers of extreme poor)
Incidence of poverty (numbers of poor)
Region People Percenta Percentb Percentc People Percenta Percentb Percentc
National** 766,359 100.0 2,154,116 100.0
Urban 154,912 20.2 100.0 682,563 31.7 100.0Rural 611,447 79.8 100.0 1,471,553 68.3 100.0Managua 32,469 4.2 262,349 12.2Pacific 165,405 21.6 732,060 34.0Urban 55,197 7.2 35.6 348,021 16.2 51.0Rural 110,208 14.4 18.0 384,039 17.8 26.1Central 450,442 58.8 979,630 45.5Urban 68,933 9.0 44.5 233,502 10.8 34.2Rural 381,509 49.8 62.4 746,128 34.6 50.7Atlantic 150,512 19.6 442,427 20.5Urban 30,782 4.0 19.9 101,041 4.7 14.8Rural 119,730 15.6 19.6 341,386 15.8 23.2 a.Percent of national number of people. b.Share of urban poor and extreme poor. c.Share of rural poor and extreme poor. Source: This table was generated using information from tables 2.1 and 2.3.

13
The agricultural sector accounted for about 30 percent of GDP and employed about 40 percent of the economically active population in 2001.7 The share of agriculture in GNP and employment is higher than other Central American countries (World Bank 2002b). In recent years, the agricultural sector has experienced weather and price-related shocks. These shocks have contributed to uneven economic performance and uncertainty about the future, and a perception by some of a “rural crisis” (see Varangis and others 2002). 2.2. Agricultural Growth and Rural Poverty Reduction
The recent Poverty Assessment for Nicaragua (World Bank 2003b) indicates that agricultural growth was a major force driving both national economic growth and rural poverty reduction over the past decade. However, agricultural growth during 1990s was driven primarily by expansion of the area under cultivation, increases in coffee production, and increases in coffee prices; it was not due to gains in productivity (World Bank 2002b). Such growth is not sustainable. Coffee prices have declined dramatically in recent years and lagging agricultural productivity is slowing the spread of gains from agricultural growth. While the value of agricultural production rose during the 1990s, real agricultural wages remained stagnant or declined.
Recent analyses indicate that agriculture alone is not a path for exiting poverty for many in Nicaragua (Davis and Stampini 2002; World Bank 2003b). Many rural poor receive a significant share of their incomes from non-agricultural employment and enterprises (Corral and Reardon 2001; Davis and Murgai 2000).
The role of agriculture as an engine of growth is complex. Because most rural households have small or no landholdings, broad-based agricultural led growth might be limited under the current distribution of land. Linkages between commercial agricultural growth and poverty reduction are limited to labor and product markets. The labor market is characterized by weak institutions and information and power asymmetries. Wage growth in agriculture also lags behind other sectors. If improved agricultural productivity is to become an engine of poverty reduction, institutional weaknesses will have to be overcome. Policies aimed at productivity enhancement should be complemented with efforts to strengthen labor institutions (such as labor market regulation, improved information, and increased enforcement of existing regulations), reduce transaction costs, and eliminate information asymmetries. 2.3. Macroeconomic Reforms and Rural Strategy and Policy Directions
Nicaragua has pursued structural adjustment policies since the early 1990s, with major objectives of macroeconomic stability, fiscal discipline, market liberalization, privatization, and decentralization. In the early 1990s, government efforts were directed toward shifting from a central command structure to a market-led economy. Reforms
7 There is an ongoing debate on the accuracy of Nicaragua’s data on agriculture’s share of GDP and employment. The figures reported here are consistent with recent World Bank reports (World Bank 2002b, 2003b).

14
included ending most price controls and privatizing publicly owned enterprises in agriculture, commerce, and industry. Restructuring of the financial sector and the adjudication and regularization of land rights (to deal with agrarian reform and land appropriations carried out by the Sandinistas) were priorities. Reforms were also aimed at import and export liberalization, although protection remained on some agricultural import-substitutes, such as staple grains (World Bank 2003a).
The 1990s reforms had important implications for the agricultural economy and rural areas. In particular, the reforms dismantled the country’s agricultural support services, attempted to privatize and decentralize extension services, lifted protection against imported food staples, removed food price controls, and removed controls on agricultural exports. Efforts were also made to regularize land rights and compensate people whose land had been expropriated. To counter negative short-term impacts of these reforms on the rural poor, international development agencies, NGOs, and the Government of Nicaragua devoted considerable resources to the rural sector.8
In 1999, following a broad consultation process, the Government published a rural development strategy, known as “A Road Map for Modernizing Rural Nicaragua.” It contains proposals to improve incentives and encourage development of factor and output markets. It also addresses issues of public investments in economic and social infrastructure to support pro-poor growth in the rural sector, and devotes attention to risks and risk management strategies.9
Recognizing that problems associated with rural poverty in Nicaragua cannot be addressed solely through agriculture, the Government has begun to consider a broader rural development perspective that includes agriculture, but extends to human and social capital, risk management, and environmental quality. Last year the Ministry of Agriculture and Forestry (MAGFOR) completed the formulation of its Estrategia de Desarrollo Rural Productivo, 2003 (GoN 2003b). The overarching objective of the strategy is to attain a higher level of well-being and quality of life in the rural sector, based on the generation of wealth and employment. The strategy designates roles for public and private sectors. It outlines a strategic and policy framework based on five thrusts: improve the business/investment environment; promote production and marketing reforms; develop output and input markets; develop social capital; and improve efficiency of public expenditures. The strategy presents a framework for pursuing a territorial strategy based on the development of regional clusters,
8 Several World Bank projects provide social protection or “safety nets” for the rural population, including the Rural Municipalities Projects and the Local Development and Poverty Reduction Project. There have also been attempts to re-establish institutions that support extension (such as the Agricultural Technology Project), credit (the recently proposed Financial Sector Project), and land (the recently approved Land Administration Project) based on market-led arrangements, rather than centrally controlled ones. 9 A World Bank report, “Nicaragua: Promoting Competitiveness and Stimulation Broad-based Growth in Agriculture” (World Bank 2002c), highlights the government’s current agricultural policy directions. The major components include improving competitiveness, improving efficiency of rural factor markets, and improving risk management. This agricultural sector strategy implicitly considers the broader rural economy, but focuses on creating “market-based conditions” for the agricultural sector to serve as an engine of rural growth.

15
combined with integrated programs related to rural competitiveness, productive transformation and value-added, rural development, and food security.
Because Nicaragua is a Highly Indebted Poor Country, the Government prepared a Poverty Reduction Strategy Paper (PRSP) in 2001. The PRSP is based on four pillars: broad-based growth, with an emphasis on productive employment generation and rural development; greater and better investment in the human capital of the poor; better protection for vulnerable populations; and the strengthening of institutions and good governance. Nicaragua’s Country Assistance Strategy recognizes agricultural-led growth and rural poverty reduction as a priority (World Bank 2002e). It suggests that the World Bank “provide assistance for the implementation of this strategic pillar that would focus on policies to facilitate cluster network development and on measures to improve the investment climate.” The Government of Nicaragua has also formulated a comprehensive National Development Strategy (GoN 2002; 2003a; 2003b). It concentrates on creating a macroeconomic environment that enables competitiveness and productivity; creating a basis for competitiveness at the local level by strengthening business clusters in regions with absolute comparative advantage; and strengthening growth generation around development poles. In the most recent version of the strategy document, the Government considers differences in the economic potential of different areas of the country and the need for area-specific strategies. To facilitate cluster development based on a growth pole approach, the Government has attempted to characterize the economic potential of different areas and identify geographical areas with special attributes that provide the basis for comparative advantage. This study draws upon this work carried out for the Government, as discussed in chapter 4.
16
Chapter 3. Rural Household Performance and Assets in Nicaragua
An important issue for rural public investments is to identify which combinations of assets can best contribute to improvements in household well-being. Chapter 3 begins the empirical analysis by describing asset bases in different types of households in different geographic regions of the country, and their relationship to recent changes in well-being. The findings suggest that asset holdings are closely related to household poverty status. Results from this descriptive analysis lead to the more detailed spatial and household-level analyses that follow in chapter 4. 3.1. Changes in Household Well-being
The analysis presented in this chapter expands on the work by Davis and Stampini (2002) and the World Bank Poverty Assessment (World Bank 2003b). The LSMS data used to generate this information are unique in that the progress of specific households can be examined, for 1998 and 2001. 10 These “panel data” track the same households over time. They thus enhance the analysis of changes in well-being and allow examination of how assets contribute to well-being, while holding household-specific attributes constant. In addition to examining changes over time, this study broadens the analysis by investigating the entire distribution of well-being, not only changes occurring above and below the poverty line.
Changes in household well-being11 from 1998 to 2001 are illustrated using two graphical techniques: household consumption density distributions and density differences; and scatter plots of specific household real consumption levels in both years. Unlike many poverty analyses that focus on households falling below a poverty line, these techniques provide a picture of changes of well-being for all sample households. The results show important regional differences in levels of and changes in well-being. Well-being changes include movement in and out of poverty, and improvements in and deterioration of well-being without crossing the poverty line.
In 2001, high proportions of households were found bunched around the poverty line.
This bunching indicates that even though poverty was reduced between 1998 and 2001, many households remained vulnerable to poverty. Sudden losses of income might throw them back below the poverty line. This finding suggests the need to examine more carefully the entire income distribution and not only households below the poverty line. 10 A detailed description of the LSMS data and methods used to construct poverty lines is presented in the recent Nicaragua poverty assessment (World Bank 2003b). 11 This study uses the term “well-being” to summarize conditions within the household. The household analysis uses per-capita consumption expenditures as the primary measure of well-being. This consumption aggregate was created for both years of the survey by valuing the total of goods and services consumed in the previous year. The aggregate value includes food (inside and outside the house), housing, health, education, consumer goods and services, and the use value of durable goods (see Sobrado 2001). Values for 2001 were deflated to 1998 price levels using the ratio of the poverty lines for the two periods.

17
Overall conditions in Nicaragua improved between 1998 and 2001 Between 1998 and 2001, household well-being clearly improved in Nicaragua. As
seen in table 3.1, higher percentages of households are found at higher levels of well-being. Rural areas shared in this improvement, but the improvement among rural households was less pronounced than that for urban households. The density shift, shown in figure 3.1, demonstrates that a large proportion of households moved from just below to just above the poverty line, suggesting continued vulnerability to poverty for many households that experienced improvements in well-being between 1998 and 2001. Table 3.1. Measures of Well-being and Household Conditions, 1998 and 2001a
Variable Rural Urban All Nicaragua 1998 2001 1998 2001 1998 2001 Percent incidence ofb
Extreme poverty 21.5 21.4 5.1 4.1 12.2 10.8Moderate poverty 37.7 37.6 18.1 18.4 26.6 25.8Non-poor 40.9 41.0 76.7 77.5 61.2 63.4
Consumptionc 4864 4658 10055 9868 7807 7855Household size (no. of members)
5.7 5.7 5.2 5.1
Head’s age 44.9 46.3 45.7 46.5 45.3 46.4Percent female-headed 18.5 18.9 34.9 34.2 27.8 28.3Share of households:
With electricity 40.0 41.0 68.7 72.2With wood or earthen floor 75.2 72.8 36.6 34.0 49.1 51.0Receiving water from pipe 30.5 26.2 83.9 83.6 60.8 61.3With latrine 67.6 70.2 57.2 59.0 78.6 63.3Without sanitary services 30.0 27.8 5.1 5.0 15.9 13.9Cooking with wood 92.2 93.2 47.0 44.8 66.6 63.7
Number of observations 1853 1862 2187 2356 4040 4218a Full data set is used here; the panel of households is described below. b Weights used are household weights: typically poverty measures are presented in terms of percent of people poor. Instead, percent of households in each poverty category is reported. c Real value of household consumption per capita (in 1998 Cordobas). Source: 1998 and 2001 LSMS. There are profound regional differences in levels and changes in well-being
Improvements in broad-based well-being were more pronounced in some rural regions than others, particularly the Pacific and Central Regions (figure 3.1).12 In the Pacific Region, many households far below and close to the poverty line in 1998 had improved their well-being by 2001,13 while in the Central region, some of the poorest households might have been left out of the improvements in well-being.14 Households in the Atlantic region did not 12 Households in these regions experienced a generalized rightward shift in their well-being density. 13 The decline in density was stronger and over a wider range (below the poverty line). 14 The shift was more spiked, meaning that the decline in density occurred over a shorter range.

18
experience a substantial improvement in well-being.15 In some better-off households, well-being worsened between 1998 and 2001.
Figure 3.1. Density Distributions and Differences of all Households’ Consumption
Log PC Consumption
Density of Consumption Changes Pacif ic Central Atlantic
-2 0 2
0
.7
Log PC Consumption
Pacif ic-All Rural Central-All Rural Atlantic-All Rural
-2 0 2
0
Changes in well-being for the panel of households can be captured by simple plots of log-consumption for 1998 and 2001 (see box 3.1 on how to interpret the scatter plots). Figure 3.2 (lower right panel) shows that for Nicaragua as a whole, improvements in well-being 15 Rightward shifts were less pronounced.
19
predominate.16 About 58 percent of Nicaraguan households experienced an increase in real consumption expenditures per capita between 1998 and 2001. A relatively large number (almost 15 percent) of households moved out of poverty (from being poor to rising above the poverty line -- the graph’s northwest quadrant). Even among the chronic poor, improvements in well-being predominate. Many households below the poverty line in both periods experienced an improvement in well-being, but not by enough to move them out of poverty.
Figure 3.2 also shows scatter plots representing the panel of households for the survey
periods for households in rural (upper right panel) and urban areas (upper left panel). Conditions in urban areas are generally better than those in rural areas.17 Chronic poverty affects a far lower percentage of urban households: 19 percent, compared to 49 percent in rural areas. A higher percentage of rural households moved out of poverty than urban households (18 percent, compared to 12 percent). Economic conditions worsened in only few poor urban and rural households between 1998 and 2001. This finding is surprising, given the widely held perception of an economic crisis in Nicaragua. 16 The cloud of points is centered well above the 45o line. 17 The urban cloud is centered to the northeast of the rural cloud.
Box 3.1. Interpreting the Study’s Scatter Plots The scatter plots show real log household consumption per capita in 2001 graphed against its 1998 value for the same households. The graphs summarize changes in welfare across the survey years. The 45o line allows comparison across the years. Points above the 45o line represent households that experienced an improvement in per capita consumption between the periods. The vertical and horizontal lines (the poverty lines) divide the graph into four quadrants. Points in the northeast (NE) quadrant are households that did not experience poverty in each of the survey periods. Points in the northwest (NW) quadrant represent households that moved out of poverty from 1998 to 2001. The southeast (SE) quadrant represents households that moved into poverty. Points in the southwest (SW) quadrant indicate chronically poor households, or those that were poor in both survey periods. The well-being of households in the NE and SW quadrants could have improved or worsened, depending on their position relative to the 45o line.

20
Figure 3.2. Scatter Plots of Changes in Well-being, all Nicaragua and by Urban and Rural Areas
Con
sum
o 20
01 p
er c
apita
Consumo 1998 & 2001, by ruralConsumo 1998 per capita
rural==0
605.38 170995.42400.14
170995.42
rural==1
Total
605.38 170995.42400.14
170995.42
Many households that experienced improvements remain highly vulnerable to poverty
In summary, clear patterns emerge from the descriptive graphical analysis. Between 1998 and 2001, overall poverty declined slightly in Nicaragua. Reductions in the incidence of extreme poverty were responsible for most of the decline. Many households below the poverty line experienced an improvement in well-being, but not by enough to move them out of poverty. A large proportion of the rural density increase occurred very close to the poverty line, indicating continued vulnerability to poverty for many households that experienced well-being improvements.
These findings illustrate the importance of considering changes in well-being along
the entire distribution of well-being. Analysts and policymakers are often primarily concerned with poverty-reducing improvements with respect to the poverty line. Yet broad-based growth is also evident in the form of improved well-being for households whose consumption is greater than poverty levels and for poor households that increase well-being yet remain below the poverty line.

21
3.2. Changes in Household Assets and Well-being 18 Asset holdings are closely related to household poverty status
The analysis continues by examining rural households’ key asset bases and their relationship to recent changes in well-being for the rural panel between 1998 and 2001. The study begins to empirically establish and quantify the conceptual links between assets, livelihood strategies, and well-being outlined in chapter 1. The results illustrate how productive, social, and location-specific assets contribute to improvements in levels of, and changes in, household well-being. Table 3.2. Human Assets, Rural Nicaragua, 1998 and 2001
Variable Description 1998 2001 HH head education Percent in each class of
education hed4 < 4 years 6620195 6853385 Schead=0 No formal education 45.07 45.34 Schead=1 <4 years education 23.11 25.07 Schead=2 Primary, >4 years 22.14 21.33 Schead=3 Secondary 6.98 6.19 Schead=4 Technical 1.40 0.97 Schead=5 University 1.29 1.11
Household composition Depart Dependency ratio: number of
dependents/total household size 5422083 5390139
Infant Number of infants 1.092595 9671154 m6_11 Males 6-11 years 5259721 5339264 f6_11 Females 6-11 years 5102615 5449775 m12_17 Males 12-17 years 4790408 4823476 f12_17 Females 12-17 years 464583 4310509 Madult Male adults 1.25939 1.293423 Fadult Female adults 1.185801 1.222309 Meld Male elderly 1525565 1661098 Feld Female elderly 1310829 1331303
Migration assets Nmigrate Total months migrated by HH
members in past 12 months 5195267* .4322683*
Migrate_01 Number of HH members who migrated in past 12 months
3.087085* 1.8436*
* Difference between years significant at 5 percent level. Source: Authors calculations based on 1998 and 2001 LSMS. 18 This sub-section is based on a background paper by Alwang (appendix 4).

22
Human capital assets
Human capital assets include the gender and age composition of the household, dependency (defined as the ratio of non-working to working members), and accumulated human capital (measured by the educational attainment of the household head). Few changes are observed in education of the household head, or in household composition between 1998 and 2001 (see table 3.2). None of the household head’s schooling variables or the numbers of household members in each age class is statistically different between 1998 and 2001.19
Over the sample period, the tendency to migrate changed significantly. In rural areas, the tendency to leave households for extended (but short) periods of time is statistically lower in 2001 than it was in 1998. A possible explanation for reduced migration in 2001 is the general improvement in rural household well-being.
The race of household members can be an important determinant of well-being. The LSMS sample contains a significant number of observations from households that classified themselves as “Mestizo del Pacifico.” This racial group is better off compared to all groups except the white population. Indigenous groups, although a very small proportion of the sample, experience high levels of poverty and low levels of consumption (see table 3.3). Table 3.3. Race of Household Head and Measures of Well-being, Rural Nicaragua, 2001 Race of household head Share of sample % poor Mean consumption
(real 1998 Cordobas) Mestizo del pacifico 80.44 66.0 3974 Mestizo costeno 1.20 79.8 3395 White 4.65 62.0 4949 Criole 7.04 77.8 3418 Miskito, Mayagna, other 6.66 80.9 3253
Source: 2001 LSMS. Physical and financial assets
Physical and financial assets include the value of business assets, physical equipment for farm production, land, housing assets, and livestock. Such assets are indications of accumulated wealth, and can be used to increase productivity and incomes and enhance risk-bearing. Ownership of many of these assets increased in rural households between 1998 and 2001 (see table 3.4).
19 Simple statistical tests of differences in means were conducting, using a 5 percent level of significance.

23
Table 3.4. Physical Assets of Rural Households, 1998 and 2001a
Sample year Variable Description 1998 2001
Farm households Non-land productive assets vagequip Value of agricultural equipment 3515.25 3590.723 Vfix Value fixed agricultural assets 1369.146 715.4242 Vcattle Value of cattle 9103.6* 12740.61* Vpigs Value of swine 1215.964 549.043 Vchickens Value of chickens 253.3267* 369.228* Vhorses Value of horses 318.0834* 486.4929* Volives Value of other livestock 21.1426 54.4711 Vlives Total value of livestock 10912.12* 14199.85* Use of technology Percent using Impseed Uses improved seed (yes=1) .0542627* .0957348* Chemfert Uses chemical fertilizer (yes=1) .3415119* .3839126* Chempest Uses chemical pesticides (yes=1) .4626989* .4814439* Extech Existence of agricultural technical
assistance in locality (yes=1) .1962 .1786
techass Use of technical assistance (yess=1)
.1156* .1449*
All rural households Land assets Percent rural households in each
holding class 0 Manzanas held 44.4 36.2 <2 Mn Manzanas held 22.7 25.3 2-5 Mn Manzanas held 12.1 14.7 5-20 Mn Manzanas held 11.8 13.4 >20 Mn Manzanas held 9.1 10.4 Other business assets busdum Percentage with non-zero home
business assets .1904443 .2215127
vbusass Value of home business assets 963.8706* 1138.518* a All values are in 1998 Cordobas. * signifies difference in values across years is statistically significant (at 5 percent level).
Farm households enjoyed increases in values of different kinds of livestock, an important means of saving for the rural poor. The mean net increase in the total value of livestock was about 30 percent, and this change was statistically significant. The increase in total value is largely driven by cattle holdings, whose mean value increased by nearly 40 percent. Less poor rural households with larger landholdings experienced larger increases in livestock values than did poorer households (see table 3.5).

24
Table 3.5. Poverty and Land Ownership: Incidence of Extreme and Moderate Poverty 1998 2001 Holding size Share of
extremely poor Share of
moderately poor Share of
extremely poor Share of
moderately poor All rural households 0 21.3 40.2 21.0 37.0<2 Mn 39.8 40.5 36.1 42.42-5 Mn 31.2 46.8 34.7 40.85-20 Mn 31.8 31.5 27.7 42.8>20 Mn 28.1 36.3 17.2 41.4Farmer households 0 56.7 40.4 18.7<2 Mn 39.9 40.3 36.1 42.42-5 Mn 31.2 46.8 34.7 40.85-20 Mn 31.8 31.5 27.7 42.8>20 Mn 28.1 36.3 17.2 41.4
Source: 1998 and 2001 LSMS.
Farm households increased their use of improved agricultural technologies, with statistically significant increases in the proportion of farmers using improved seeds, chemical fertilizer, and pesticides. While access to technical assistance did not change significantly, the proportion of households using such assistance grew appreciably, and this increase was statistically significant. 20
Regression analyses indicate that asset holdings are, in general, closely (and statistically significant) related to household poverty status. In both 1998 and 2001, poor households owned significantly lower values of agricultural equipment and livestock and used improved farming techniques less frequently than non-poor households. Poor households also had less access to technical assistance in agriculture compared to non-poor households. This finding reflects the selectivity in location of such services, which tend to be located in more favorable agricultural areas, where rural poverty is also lower. Moreover, since extension services in Nicaragua have undergone a process of privatization (with farmers paying for technical assistance), better-off households are probably better situated to access technical assistance. Land assets
Access to land is an important determinant of well-being in rural Nicaragua (Deininger, Zegarra, and Lavandez 2003). Landless rural families constitute the most prominent group at risk of being poor in Nicaragua (Valdes and Mistiaen 2001; World Bank 2003b). Although landless households experience higher rates of poverty, increased
20 Access to extension is measured as whether the Comarca (the village geographical unit) of a household’s residence has an agricultural technical assistance office.

25
landholding is not necessarily associated with lower poverty rates. Livelihood strategies, especially if they include rural non-agricultural activities, also matter. The relationship between landholding size and economic well-being depends, among other things, on land quality, its suitability for agricultural production, its proximity to markets, and on other complementary assets.
Access to land in rural Nicaragua changed between 1998 and 2001 (see table 3.4). The proportion of landless households fell from 44 to 36 percent. The proportion of households in other landholding classes increased slightly. These changes explain part of the improvement in well-being observed between 1998 and 2001. However, the relationship between landholding and poverty status in the study sample is not as clear-cut as might be expected (see table 3.5). Extreme poverty declines monotonically with increased landholding for both years of the survey, but moderate poverty does not vary systematically by landholding class. Landless households experience higher rates of poverty; however, increased landholding (once a household has land) is not necessarily associated with lower poverty rates.
Changes in well-being between 1998 and 2001 are not directly related to landholding size in 1998 (see table 3.6). Small-scale landholding households (those owning fewer than five adjusted manzanas)21 enjoyed fairly substantial gains in mean well-being, while well-being declined in households among the larger landholding classes. This finding can be explained, in part, by differences in land quality and agro-ecological conditions, the proximity of the land to markets, and the availability of other complementary assets, especially education and infrastructure. Table 3.6. Mean Change in Well-being 1998-2001, by Landholding, Rural Households (in $C) Landolding size in 1998 All rural households Farm households
0 414.58 -30.56<2 Mn 432.63 432.632-5 Mn 350.37 350.37
5-20 Mn -646.74 -646.74>20 Mn -422.07 -480.25
Source: 1998 and 2001 LSMS. Location-specific assets
Location-specific factors related to land quality and agricultural potential are important assets, as are distances from population centers and markets (Valdes and Mistiaen 2001). The LSMS data contain information on differences in location that can help clarify the relationship between location assets and household well-being.
21 Landholding was adjusted to reflect the main crop, a proxy for land quality. See Davis and Stampini (2002) for details on the adjustment method.

26
Access to public services varies dramatically in rural Nicaragua. Paved roads are the principal access for less than 17 percent of the rural households in the sample, and the mean distance to a highway is more than 40 kilometers (see table 3.7). In contrast, primary schools tend to be located relatively close, while health centers and the primary purchase point for foods are nearly one hour away, on average.22 Access to such services is closely associated with poverty status and measures of well-being.
The most striking difference in access to infrastructure between the poor and the non-
poor relates to distance from a highway. Poor households, on average, are more than 20 kilometers farther from highways. The poor also travel a significantly longer time to the nearest health center and to their primary place of food purchase. Physical distance to the nearest food purchase point is not significantly different for the poor and the non-poor, but access time is significantly longer. This finding indicates lower-quality transport infrastructure in poor areas or suggests that the poor have less access to faster modes of transport. Table 3.7. Measures of Access to and Adequacy of Infrastructure, Rural Households, 2001 Variable
Description
Mean
(Std. Dev.)
Difference poor versus non-poor
households Disshop Distance to primary shopping point in km 7.04
(14.59) -1.108
timeshop Time to travel to primary shopping point in minutes
45.84 (94.73)
10.34*
Pavroad Primary access to household is a paved road (=1 if yes)
.168 (.374)
-.130*
Dschmin Time to travel to nearest school in minutes 23.10 (35.670)
3.48*
Dhcmin Time to travel to nearest health center in minutes 63.91 (81.907)
18.03*
Droad Distance to major road in kms 43.26 (97.012)
23.246*
improver Dummy variable with value =1 if access to road improved between 1998 and 2001
.174 (.379)
-.039
Worser Dummy variable with value =1 if access to road worsened between 1998 and 2001
.228 (.420)
.015
* means difference in values across years is statistically significant (at 5 percent level) Source: 2001 LSMS. Social capital and local level institutions
22 Distance can be measured in terms of physical distance or in terms of travel time. The LSMS includes information on both. Differences in such factors as topography, road, quality, and mode of transport explain why time distance might differ from physical distance.

27
Social capital refers to social bonds created through relationships, shared values, norms, and institutional arrangements to promote collective action. Social capital manifests itself through trust and reciprocity, formal and informal institutions, personal relationships, and between communities. Social capital can be important to a household, particularly when it must act with others or receive assistance from the outside. For example, cooperatives can be used to market member’s products, or obtain credit or technical assistance. Relationships with neighbors, friends, or churches are also important during hard times, especially for the poor. Local level organizations are often instrumental in linking households to public institutions and NGOs. In Nicaragua, social capital is a driving force behind farmer cooperatives, enabling small-scale producers to penetrate non-traditional exports and coffee markets.
Although the importance of social assets is widely recognized, empirical analysis has been hindered by difficulties in measuring these assets. This study uses measures of participation in community organizations as a proxy measure of social assets. The data indicate broad participation in a number of community organizations; nearly 30 percent of households participate in some form of organized group (see table 3.8). Religious and producer organizations have most widespread participation, and few households participate in local and governance-related organizations. Participation in almost all organizations declined significantly between 1998 and 2001. Non-poor households are more likely than poor households to participate in most of these organizations, but the difference in participation rates between poor and non-poor households is statistically significant only for savings and loan organizations and labor groups. Table 3.8. Participation in Community Organizations, Rural Households, 1998 and 2001 Percent households participating in
Type of committee
1998
2001
Cbarrio Barrio .0260442* .0078695*Ccomarc Comarca .0510636Cmuni Municipality .0293437* .005378*Cmujer Women .0212353* .0002748*Cmujerr Rural women .0234523Cpadres Parents .0397395 .0416236Csandl Savings and loan .0194075 .0238053Cdeporte Sports .0187747 .0204628Cassp Professional organization .0031719 .0022516Casspro Producer organization .0546821Crelig Religious .2585364* .149525*Csind Labor union .0050115Cotro Other .0247503 .0142401Cany Any .3293381 .2978178* Difference between years significant at 5 percent level. Labor allocation decisions and livelihood strategies

28
Possibly the most important asset held by poor rural households is their labor, and labor allocation decisions reflect conscious livelihood strategies. Substantial shifts occurred between 1998 and 2001 in employment patterns in rural areas. The study uses two indicators of the shift. The first two columns of table 3.9 show the change in the percent of households that report earnings by any household member from four broadly defined occupations: self-employment and wage employment, both inside and outside of agriculture. From 1998 to 2001, the percentage of rural households with any member reported to be a farmer rose from 56 to 64 percent. There were significant shifts out of self-employment in agriculture (38 to 33 percent) and into wage employment in agriculture (51 to 59 percent). Table 3.9. Rural Sources of Employment Variable Share of households
with at least one member in each source of employment (%)
Share of total adult employment in each source of employment (%)
Percent 1998 2001 1998 2001 Farmers 55.7* 64.4* -.- -.- Self-employed (ag) 37.7* 33.0* 23.3* 20.1* Wage-employed (ag) 51.4* 59.1* 37.1* 41.7* Self-employed (nonag) 21.7* 24.7* 12.6 13.5 Wage-employed (nonag) 33.7 33.5 20.0 20.4 *Difference between years significant at 5 percent level.
Evidence of employment shifts is reinforced by examining another measure of employment: the share of total adult employment in the household by each source (the two right-hand columns of table 3.9). This measure shows a decline in self-employment in agriculture, a less-pronounced increase in wage employment in agriculture (from 37 to 42 percent), and a slight increase in self-employment outside of agriculture. These shifts in employment are related to the overall observed shift in rural well-being between 1998 and 2001. As Davis and Stampini (2002) show, employment sources are closely related to static measures of well-being. Wage employment in agriculture is associated with higher incidences of poverty, although many factors may influence this association. The overall conclusion of chapter 3 is that, even though overall conditions improved between 1998 and 2001 and reductions in rural poverty have been significant in Nicaragua, not all areas and households have shared in this relative prosperity. Some areas have prospered, while others have not. The analysis suggests that this heterogeneity of rural areas is caused by geographic inequalities in the distribution of a range of household assets, risks, opportunities, constraints, and historical investment decisions by households and communities in response to these conditions. This heterogeneity means that household assets and location in rural space matter for measurement of determinants of household well-being, policy formulation of rural growth policies, and the design of projects. An important issue for rural investment strategies is to identify the combinations of productive, social, and location-specific assets that affect the ability of households to take advantage of an area’s growth potential and improve well-being.

29
Chapter 4. Summary of Spatial, Household-Level and Qualitative Analyses
Chapter 4 contains the bulk of the report’s analytical results. The previous chapter
identified how location- and household-specific assets are associated with levels of and changes in well-being in Nicaragua. This chapter further investigates the themes of space and assets using multivariate spatial and household level analyses to draw implications for regional development strategies and targeting of investments.
Geographic information systems (GIS) methods are first used to identify zones of economic potential based on three variables: access to infrastructure and services, agro-ecological conditions, and climatic risks. The maps reveal that economic potential has a strong spatial pattern, with high potential areas close to the main cities. However, when the analysis expands the number of dimensions to account for possible geographic variation of household poverty, it turns out that an area’s economic potential does not automatically translate into improved economic outcomes for all households.
The analysis raises many questions. Why, despite the growth potential of these regions, are so many poor people living in them? What factors prevent the poor from raising their incomes and taking advantage of the prospects for poverty-reducing growth that exist in the high potential areas? Why have so many interventions focusing on these areas have had only limited success in reaching the poor or have bypassed them altogether?
The aggregate nature of the spatial analysis can mask substantial intra-regional
differences. Thus the study carries out a household-level analysis to identify the assets that matter most to raise incomes and take advantage of opportunities. The analysis investigates how combinations of productive, social, and location-specific assets affect the ability to take advantage of an area’s growth potential.
Finally, qualitative information from livelihood studies and rapid participatory assessments with stakeholders involved with ongoing ESSD projects provides evidence of the importance of complementarities between productive, social, and location-specific assets in enabling or constraining exits from poverty. Some of the questions about the role of institutions in promoting broad-based growth are addressed in these qualitative studies. The results from the qualitative studies are incorporated into the discussion of main findings from the household-level analysis. Chapter 5 summarizes the main conclusions and implications for priority setting of investments and other appropriate interventions.
4.1. Economic Dynamism Zones in Rural Nicaragua Economic potential has a strong spatial pattern
This chapter begins with an overlay of spatially indexed municipal-level data to produce a regional typology of economic potential (for more information, see appendix 2). Using standard tools of geographic information system (GIS), the analysis identifies five distinct geographic zones with different degrees of economic dynamism in rural Nicaragua.

30
The zones were produced by overlaying maps that reflect natural resource assets, access to infrastructure and markets, and climatic risks. These geographic variables are assumed to play a direct role in influencing economic potential and productivity.23 The data base was provided by the Ministry of Agriculture and Forestry (MAGFOR) and consists of the following layers:24
• Natural endowments. Composed of the following five variables: soil type, gradient,
elevation, rainfall levels, and temperature. • Access to infrastructure and markets. Composed of the following five variables:
permanent roads, markets, agricultural input distributors, existence of gas stations, and existence of warehouses.
• Climatic risks. Composed of a single variable: presence or absence of a systemic dry period during the agricultural season that affects yields, the canicula. This is a proxy for drought-prone area facing the risk of a rain deficit. The overlaying of the above indexes produced five economic dynamism zones, all
hypothesized to have varying degrees of economic and market development (see table 4.1). As shown in figure 4.1, there are high, medium, and low economic dynamism zones, plus a fourth zone placed in dry land areas. A fifth zone (in white, see figure 4.2), with low agricultural potential and low access (farther than 40 kms. of distance), was also identified. The zones are not contiguous. Even at this level of aggregation, there is heterogeneity within municipios. Table 4.1. Nicaragua’s Five Economic Dynamism Zones Panel A. Characteristics of Zones
Area type Characteristics High dynamism Good soils, good climate, good access Medium dynamism Good soils, good climate, medium access Low dynamism Good soils, good climate, poor access Dry zone Good soils, marked dry season, good access Others Low agricultural potential, low access Panel B. Defining Zones According to Economic Dynamism: Overlay of Indexes Variable Zone Economic dynamism High Medium Low Dry areas Agricultural use & potential High High High Low Access to infrastructure & markets
Less than 10 kms.
10--20 kms. 20-- 40 kms. Less than 10 kms.
Climatic risk Canicula: mild, defined, marked and none
Canicula: mild, defined, marked and none
Canicula: mild, defined, marked and none
Canicula: severe
23 Similar indexes have been used by IFPRI (2000). 24Appendix 2 provides a more detailed description of the variables used to construct each composite indexed layer of information, and discusses the mapping exercise of overlaying the three indexes to construct the Zones of Economic Potential.

31
Figure 4.1. Zone-by-Zone Maps of Economic Dynamism

32
Figure 4.2. Zones of Economic Dynamism, All of Nicaragua
The maps reveal that economic potential has a strong spatial pattern, with high
potential areas located close to the main cities. Since the study is ultimately interested in how greater prospects for growth and poverty reduction translate into improved household well-being, the analysis proceeds to expand the number of dimensions considered beyond location-specific attributes. Key questions include: Are people better off in the high potential areas? If not, why not? 4.2. Economic Potential and Spatial Distribution of Household Well-being Economic potential does not automatically translate into improved economic outcomes for all households
The original motivation of this second step in the spatial analysis was to develop a more refined geographic typology for Nicaragua (for more information, see appendix 3).
Medium DynamismLow Dynamism
High Dynamism
Dry Zone
Nicaragua: Economic Dynamism

33
The hypothesis was that different sections of the country had different combinations of assets, risks, opportunities, and constraints that could explain household livelihood strategies and well-being outcomes. Thus if distinctly different groupings of households/areas could be identified, it would logically follow that differential rural development approaches could be targeted to distinct areas. The challenge was to distill the potentially very large number of dimensions describing rural conditions (including soils, climate, infrastructure, land security and distribution, and human capital) into a typology that had just enough categories to provide strategic guidance for rural development investments -- but not so many as to result in an unwieldy amount of sub-regions.
The result was unexpected. Rather than expanding the number of dimensions considered, the analysis finds that a single dimension accounts for most of the geographic variation in rural poverty across Nicaragua at the municipio level: proximity to the capital city of Managua. A key finding is that as remoteness increases, population density decreases faster than poverty rates increase. Hence more remote areas such as the Atlantic Region have fewer poor people per square kilometer, or lower poverty densities.
What is really striking is that about half the extreme rural poor reside in the quarter
of the country that is within four hours drive from Managua: in the Central and Pacific Regions -- which are recognized as higher economic potential areas. The Central Region alone has the highest share of rural extreme poverty; almost two-thirds (over 62 percent) of Nicaragua’s rural extreme poor live there. This finding has important implications for future investments (see chapter 5). The spatial analysis finds a strong intercorrelation, at the municipio level, of rural poverty, rural population density, accessibility to Managua, and a range of other variables important to household assets, livelihoods, and poverty. This study refers to this relationship as the prime gradient. Table 4.2 presents some of the key relationships found along this prime gradient. Near Managua population densities are high, rural poverty and poverty depth rates are low by national standards, and within-municipio accessibility is high.25 As one would expect, good market access is associated with more productive and more labor-intensive land uses, with more secure tenure, and with little remaining forest or open frontier.
25 Internal accessibility was calculated as the proportion of each municipio’s land area that was within 60 minutes’ travel time of the municipio seat, using the travel time methodology described in the text (based on the country’s transportation system and assumptions about the amount of time needed to travel a certain distance on a certain type of road/river).

34
Table 4.2. The “Prime Gradient” for Nicaragua Proximity to Managua Close-in ------------------------------------------------------------------------------- Remote Higher Internal accessibility Lower Higher Population density Lower Lower Poverty rate Higher Higher Poverty density Lower Variable Soil constraints Higher Higher Land productivity Lower Higher Land use intensity Lower Higher Tenure security Lower Lower Forest cover Higher Consolidated Frontier Open/Active
Moving outward from Managua along the gradient, as remoteness increases, poverty and poverty depth rates increase, population density decreases, land use becomes more extensive, and tenure insecurity grows. More remote areas have fewer poor people per square kilometer, or lower poverty densities. Most rural poor people live in the immediate circle around Managua Department and other urban centers. Figure 4.3 shows the cumulative area and cumulative number of extremely poor people as travel time to Managua increases.26 As noted, about half the extremely poor rural population is in the quarter of the country that is within less than four-hour estimated travel time from Managua. Figure 4.4 shows an alternative view of the geographical concentration of rural poverty. Municipios are ranked according to poverty density, from low to high (left to right). The cumulative number of poor people is plotted against cumulative area. The densest 10 percent of area contains about 30 percent of the extreme rural poor people.
26 The figure includes those municipios with available data, including Managua region but excluding Managua City and a few municipios that split between 1995 and 2001. These omissions will tend to reduce the reported concentration of poor people below its actual level.
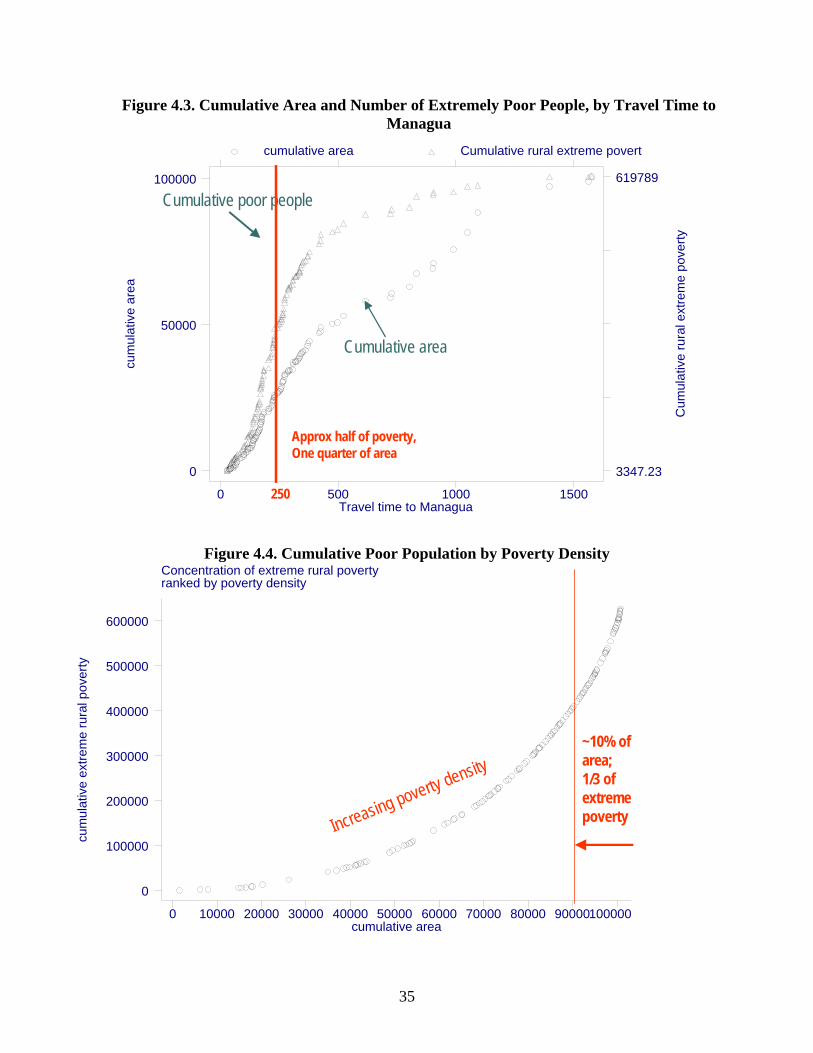
35
Figure 4.3. Cumulative Area and Number of Extremely Poor People, by Travel Time to Managua
Figure 4.4. Cumulative Poor Population by Poverty Density
cum
ulat
ive
area
Travel time to Managua
Cum
ulat
ive
rura
l ext
rem
e po
verty
cumulative area Cumulative rural extreme povert
0 500 1000 1500
0
50000
100000
3347.23
619789
Cumulative area
Cumulative poor people
Approx half of poverty,One quarter of area
250
cum
ulat
ive
area
Travel time to Managua
Cum
ulat
ive
rura
l ext
rem
e po
verty
cumulative area Cumulative rural extreme povert
0 500 1000 1500
0
50000
100000
3347.23
619789
Cumulative area
Cumulative poor people
Approx half of poverty,One quarter of area
250
cum
ulat
ive
area
Travel time to Managua
Cum
ulat
ive
rura
l ext
rem
e po
verty
cumulative area Cumulative rural extreme povert
0 500 1000 1500
0
50000
100000
3347.23
619789
Cumulative area
Cumulative poor people
Approx half of poverty,One quarter of area
250
Concentration of extreme rural povertyranked by poverty density
cum
ulat
ive
extre
me
rura
l pov
erty
cumulative area0 10000 20000 30000 40000 50000 60000 70000 80000 90000100000
0
100000
200000
300000
400000
500000
600000
~10% of area;1/3 of extreme povertyIncreasing poverty density
Concentration of extreme rural povertyranked by poverty density
cum
ulat
ive
extre
me
rura
l pov
erty
cumulative area0 10000 20000 30000 40000 50000 60000 70000 80000 90000100000
0
100000
200000
300000
400000
500000
600000
~10% of area;1/3 of extreme povertyIncreasing poverty density

36
There are many reasons to think that improved accessibility -- to local and to national market centers -- should have a direct, causal impact on output, employment, and poverty alleviation. Proximity to towns increases access to nonfarm employment, which is strongly associated with higher household consumption levels. Proximity to markets also would be expected to boost farmgate prices of outputs and reduce prices of inputs, boosting landholder profits, inducing more intensive land use, and increasing the demand for farm labor -- a major source of income for the poorest. Proximity to towns also makes it easier to recruit teachers and health workers, which should result in higher quality of health and education services. All these factors would be expected to increase population density, which in turn reduces the unit cost of delivering most kinds of services.
Since most of the rural poor in Nicaragua live in high-poverty density municipios within the high and medium economic potential areas, we need to understand why despite the high potential of these regions, so many people living in them are poor, why an area’s economic potential does not automatically translate into greater prospects for improved well-being for the poor, and why so many single-asset investments focusing on these areas have had limited success in reaching the poor or have bypassed them altogether.
These questions are of critical importance for the Nicaraguan government’s strategy of rural cluster development. Promoting clusters in areas with good transport and infrastructure access makes sense from the standpoints of business and cost-efficiency. But the strategy can bypass the poor if does not recognize the factors preventing them from raising their incomes and taking advantage of prospects for poverty-reducing growth that exist in high potential areas. Some of these factors are missing assets, others are poorly functioning institutions, and some are related to policy shortcomings. 4.3. Poverty Rates and Poverty Density Targeting of areas with high poverty rates will not necessarily reach areas with high numbers of poor
The spatial analysis yields important insights for future investments. In particular, it raises important issues about the nature of tradeoffs between efficiency and equity in targeting rural development interventions. Investments targeted to areas with high poverty rates such as the Atlantic will not necessarily reach areas with high numbers of poor households. While most people in the Atlantic are indeed poor, most poor people do not live in the Atlantic, given the region’s considerably fewer poor people per square kilometer, or much lower poverty densities. There is need to consider both poverty rates and poverty density for developing growth and poverty reduction strategies. As seen in figure 4.5, targeting high poverty-density areas in the municipios located in the immediate circle around Managua and other urban centers in the Central and Pacific regions will reach high absolute numbers of poor (and might imply large leakages to the non-poor in these areas). However, such targeting would exacerbate regional disparities in income, neglecting areas with the highest poverty rates, such as the Atlantic (see figure 4.6, Nicaragua Poverty Map).

37
Figure 4.5. Extreme Rural Poverty Density Map
Extreme rural poverty density = extreme rural poor people/area of municipio
Note: Municipios with extreme rural poverty density >13 are outlined in bright red. The access time to Managua is shown by shading, ranging from close-in (brown) to remote (blue).

38
Figure 4.6. Nicaragua Poverty Map (Severe, high, medium, and low poverty, based on poverty rates)

39
The conventional wisdom of poverty-based targeting holds that pro-poor programs should be targeted to areas with the highest prevalence of poverty. The logic is that in high-prevalence areas, leakages to the non-poor will be lower and the average benefit to the poor per dollar invested will be highest. In the case of public goods, many forms of fixed infrastructure, and types of investments where the non-poor can be excluded (such as low-income health card for access to public clinics), it makes sense to target toward high poverty density areas, because this targeting will maximize the benefits to the poor per dollar invested. Figure 4.7 shows that any antipoverty investment that has economies of scale in poverty density is going to have higher return in the purple regions, with more than one poor person every 5 hectares, as compared with the yellow regions, with less than one poor person every 50 hectares. Therefore, a challenge for rural growth strategies is to come up with non-density-dependent investments for the yellow areas.

40
Figure 4.7. Regional Distribution of Extreme Poverty Density Map
Extreme rural poverty density = extreme rural poor people/area of municipio

41
The spatial analysis does not address variation within municipios in assets and outcomes. Its aggregate nature can mask substantial intra-regional differences. Thus household level analysis is needed to understand what combinations of household assets matter most to raise incomes and take advantage of increased prospects for poverty-reducing growth in a particular geographical area. This is feasible using both LSMS data and the 2001 Agricultural Census in Nicaragua. This is the focus of the next section of this chapter. 27 4.4. Assets and Exits from Poverty
The combined analysis of economic dynamism zones and prime gradient show how spatial factors may affect poverty and growth potential at the municipio-level. They form the basis for more refined analyses using household-level data from the LSMS 1998 and 2001 panel to understand how location and a range of other assets affect levels and changes in household well-being across rural Nicaragua. The household analysis builds on previous analyses by incorporating location-specific variables, including information indexed by type of dynamism zone, travel distances, and accessibility to internal infrastructure (see appendix 4). By combining this analysis with qualitative evidence from the livelihood surveys (box 4.3) and participatory ESSD project stocktakings (box 4.5), the study gains additional insights into the determinants of rural growth and poverty reduction.
Policy levers are also introduced. These are loosely classified into four categories: human capital investments (improved education and training); physical infrastructure (road building, electrification, schools and health centers, market centers); land access (efforts to increase land quality and security); and investments in social capital (group formation, empowerment).
Regression analysis is used to understand both the assets and asset combinations and livelihood strategies that lead to exits from poverty or lessening of the depth of poverty; and the importance of spatial location in household performance as well as the empirical linkages with potential policy levers. Box 4.1 describes the regression model.
27 Data from 1998 and 2001 for a panel of households (Living Standards Measurement Surveys, LSMS) and the 2001 Agricultural Census were used, with supplementary variables included, as noted. The LSMS data were geo-referenced to the Census data.

42
To deal with the heterogeneous nature of households, the study examined differences
across broad categories of households. Following exploratory analysis (see appendix 4), the study identified five household types: remote households and non-remote households;28 non-remote households were further disaggregated between households whose economic livelihoods are based on agricultural and non-agricultural activities, and households with high and low education levels.29 As part of the household analysis, the study estimated the determinants of levels of and changes in well-being (per capita real consumption expenditures) for each of these household types. 30 Issues of causality are difficult to sort out in regressions of this sort. Asset accumulation may be endogenous to changes in well-being;
28 Remoteness is defined by the variable “distance to health center in minutes.” Non-parametric analysis indicated a break at one hour for this variable, and remote households are those that are farther than one hour from a health center. 29 Low education households are those in which the household head has four or fewer years of education. 30 In the regression results, when differences are discussed (say between remote and non-remote households), other assets and the context are held constant.
Box 4.1. The Regression Model Consistent with the study’s asset-base approach, the regression analysis models levels and changes in outcomes (real consumption) as a function of household assets and other household characteristics, household behavior (livelihood strategies), and the context (policies and risks). The model has its theoretical basis in the notion that levels of well-being and its rate of change (percentage changes across the sample period) are products of these factors and changes in these factors. The model is thus a general dynamic model of well-being production. The objective is to isolate the impact of such variables on the outcome, holding other factors constant, and to identify strategies for rural growth based on these findings. In the subsequent analysis, the study team uses the rural panel of households created with the 1998 and 2001 LSMS. Each version of the model can be expressed as: B.1 lnCi,98 = f (HH Assets, HH Characteristics, Context, HH Livelihood Strategies) B.2 lnCi,01 – lnCi,98 = f (HH Assets, HH Characteristics, Context, HH Livelihood Strategies) Where: lnCi,98 is real household consumption in 1998, lnCi,01 – lnCi,98 is the change in real household consumption from 1998 to 2001, and (HH Assets, HH Characteristics, Context, HH Livelihood Strategies) represent vectors of 1998 values of different variables representing the household assets and context. For model B.1, the right-hand side variables include levels (in 1998) of key assets and household attributes, and for model B.2, these levels are combined with changes (between 1998 and 2001) in levels for those assets whose change can be considered to be “exogenous” to changes in well-being. Livelihood strategies might include variables such as labor participation, agricultural decisions, and migration choices. The analysis also included interactions between key variables such as land, education, and internal remoteness. These interactions permit us to examine how pairs of assets complement each other. For example, land may be more important for household well being in more or less remote areas. The results of the two models are synthesized in the text. Level effects refer to model B.1, while growth rate effects refer to model B.2

43
households are better off because they accumulate assets, but also accumulate assets because they are becoming better off (see box 4.2). 4.4.1. Assets of Remote Households Human capital assets Education is a determinant of household well-being in remote areas
Education has a direct effect on levels of well-being, and an indirect effect on the rate of growth of consumption. Agricultural-households and lower-education households have approximately 20 percent lower mean levels of well-being than non-agricultural and higher-education households.31 This analysis found that rates of consumption growth did not differ by head’s education, indicating that the education effect on levels of well-being is likely to persist over time. In addition, education of the head is an important determinant of adoption of improved seed varieties; as shown below, improved seeds have both a level and a growth effect on well-being. Higher-dependency households have lower levels of well-being
Dependency, defined as the ratio of non-working to working members, affected well-being. Households with higher dependency experienced marginally higher rates of growth in consumption. Even with a higher percentage change in consumption, the absolute increase 31 Farmer households also have lower mean levels of educational attainment.
Box 4.2. Endogeneity and Causality in the Regressions Issues of exogeneity and causality are difficult to sort out in regressions like those used in this study. The problem is one of theory and inference. Consider the example of education. We wish to know if an increase in education of the household head will lead to an increase in household well-being, all other assets held constant. If education level and well-being are endogenously determined, if the model is missing variables affecting both education and well-being, or if errors in measurement of education levels are correlated with the error in equation B.1, then problems emerge. Essentially, the parameter from the regression will be a biased estimate of the true (theoretical) relationship between education and well-being. As a result of this bias, we can not be sure if a policy to improve educational attainment will improve well-being. We address this bias in several ways when conducting the analysis and in interpreting the coefficients. When possible, we use instrumental variables, usually in the form of census segment-level means of troublesome variables. We compare results of non-instrumented variables with those of instrumented variables to help gauge the degree of bias. However, given the nature of the decisions and outcomes being modeled, it is impossible to sort out all the potential problems of endogeneity. In cases where endogeneity is still suspected to be a problem, the interpretation of the coefficients becomes one of a conditional relationship between the right- and left-hand side variables, rather than one of theoretical causality. We mention these cases where appropriate.

44
from 1998 to 2001 is lower for higher dependency households. Neither the gender nor the age of the household head affected levels of consumption in 1998, but the rate of consumption growth was greater in male-headed households. Thus by 2001, male-headed households were significantly better off than female-headed households. Physical and financial capital assets The relationship between land access and economic well-being depends on the land’s proximity to markets and the availability of other complementary assets, especially education and infrastructure
Land access has important interactions with distance to markets (remoteness) and education32, and this complementarity may affect how policies impact welfare. As households become more remote, the welfare impact of more land increases; this finding holds in both level and growth regressions. This result indicates higher returns (in a welfare sense) to larger landholdings farther from urban centers (in already remote areas). Consolidation of landholdings is a likely market outcome in such situations.
Higher education intensifies the relationship between landholding and welfare. The tendency of better-endowed households to appropriate benefit from land access programs has been noted in other studies (see Deininger, Zegarra, and Lavandez 2003). Our analysis shows that this tendency is particularly pronounced in remote areas. Improved road access has a positive impact on changes in well-being, but its significance depends on a number of factors
Access to roads and landholding interact to affect welfare; road improvements in combination with larger landholdings have a strong positive impact on welfare. Thus better roads disproportionately benefit people with larger landholding sizes in remote areas. Roads by themselves, without complementary investments, may increase inequality, but a road-building program together with land access are a good means of improving welfare in remote rural areas. Higher values of livestock are associated with increased well-being While livestock was associated with higher values of consumption, the relationship between livestock ownership and change in well-being in remote areas was negative. This finding suggests that the positive effect of livestock is diminishing over time in rural areas. 4.4.2. Assets of Non-remote Households Human capital assets
32 The cross products between land holding size and education and distance to markets was entered in the level and growth regressions.

45
Education matters in all areas and for each type of household
In non-remote areas, low-education households had 21 percent lower consumption than higher-education households (holding other factors constant). Higher dependency ratios are correlated with lower consumption. In low-education households, being headed by a female is associated with higher mean levels of consumption. Growth effects are, however, opposite, with male-headed households experiencing faster rates of consumption growth between 1998 and 2001. Returns to education are much higher among non-agricultural households
Agricultural households had 20 percent lower levels of consumption than other rural households. Among agricultural households, low education households were worse off than high education households by roughly 14 percent. mong non-agricultural households, lower education households had 22 percent lower consumption than high-education households. Education benefits non-farm households by more than it does farm households. These results are consistent with recent findings by Davis and Stampini (2002) and the World Bank (2003b), and convey pessimism about the ability of agriculture to serve as a primary poverty exit strategy.
Physical and financial capital Land access is an important vehicle for improved well-being
Land ownership was positively related to well-being for both household types (low and better-educated heads). More land is, however, associated with lower rates of growth in consumption, and the negative growth effect is exacerbated by distance. Thus the welfare advantage of owning more land in non-remote areas is diminishing over time. Although landless households experience higher rates of poverty, increased landholding is not necessarily associated with lower poverty rates. Livelihood strategies, especially if they include rural non-agricultural activities, also matter. The relationship between land and economic well-being also depends on land quality, proximity to markets and the availability of other complementary assets, especially education and infrastructure. Technology adoption provides a positive economic impact for all farmer households
Factors such as household education, remoteness, existence of extension infrastructure, and others are associated with a higher likelihood of adoption of improved farming technologies (mainly seeds, but fertilizer as well). Use of improved seed varieties had positive effects on 1998 welfare for higher- and lower-educated farm households, even in remote areas. “Density” of adoption (the proportion of farmers in a census cluster who adopt) is an important determinant of adoption by individual households. Levels of well-being are significantly and positively related to durable asset accumulation

46
Better-off families are able to invest in assets such as domestic electrical products and vehicles. Female-headed and households with better-educated household heads also accumulated greater values of these assets. Farmer households were less likely to invest in these assets, but more likely to invest in agriculture-related assets. Location-specific assets Access to roads and landholding interact to affect household well-being
Remote households tend to be poorer and have fewer prospects for growth than non-remote households. Road improvements bundled with larger landholdings lead to higher rates of growth in well-being. Returns to education are highest for households that are close to infrastructure and have good access to markets. Hence market access and education are complementary; programs to invest in either one should be complemented with investments in the other. Values of business assets are also associated with improved well-being only for well-educated households, indicating more effective business strategies being pursued by better-educated families.
Social Capital Social capital compensates for lack of physical assets Livelihood studies conducted as part of the Nicaragua country case study provided further evidence of the linkages between assets, livelihood strategies, and well being outcomes, especially on issues that were difficult to quantify with the LSMS data, such as risk and vulnerability and the importance of social capital assets. Participatory livelihood surveys were carried out in 56 rural communities located in 33 municipalities of 8 Departments in the country (box 4.3).
Box 4.3. Livelihood Studies in Rural Nicaragua Livelihood surveys, which are participatory exercises, were carried out in 56 rural communities located in 33 municipalities of 8 Departments (Matagalpa, Boaco, Chinandega, Leon, Managua, Masaya, Madriz and Nueva Segovia), located in the country’s Northern, Pacific and Central regions; plus the municipality of Siuna, located in the Autonomous North Atlantic Region (RAAN). The surveys were carried out between the months of March and May of 2003, using facilitators from the “Programa Campesino a Campesino” (“Farmer to Farmer Program,” or PCAC in Spanish) of the Union National Union of Farmers and Cattlemen (UNAG). The facilitators were trained and supervised by RUTA-DFID staff. The communities chosen were not intended to be a statistically representative sample of all rural communities in Nicaragua. Rather, the geographic distribution was intended to represent a diversity of conditions identified as important from the spatial and household level analyses. These conditions include access to infrastructure and services, agricultural potential, weather conditions, proximity to rural towns and urban centers, agro-ecological zones and crop-livestock systems. In geographic areas of interest, only communities defined as “poor” were selected. The studies developed a general typology of rural communities using as criteria the capacity for households to organize themselves, the types of livelihood strategies adopted, and their ability to resist or be resilient to crisis. Within communities, households were characterized as very poor, poor, and better-off poor.

47
The livelihood study team developed an ex-post categorization of communities based on the types of livelihood strategies adopted and how they, as a community of households, were dealing with the perceived economic and social crises in rural Nicaragua. Communities were characterized as: (a) those not resistant to the crisis; (b) those resistant to the crisis; or (c) those resilient and thriving, despite the crisis. The general characteristics of each type of community are summarized below:
Communities not resistant to crisis:
Most households in these communities generally have not been able to cope with crisis. Many are located in areas with low agricultural potential and limited access to infrastructure and services. The quantity and quality of household assets in these communities are limited and education levels are low. Households live almost exclusively by production of basic grains (maize, beans) on small plots, selling their labor, and harvest/sale of firewood. The communities are in a relative state of economic stagnation and neglect. The level of social organization is weak, and this prevents them from making progress in marketing their products or improving basic services. Communities resisting crisis:
Most households in these communities have managed to develop some capacity to cope with crisis. That capacity is reflected in their ongoing search for alternatives to the different problems they face. Their dynamism is more closely linked to social organization than to productive organization. These communities have achieved a good level of development of their human and social capital, guaranteeing their progress toward ongoing economic and social initiatives. Community members have several trades or occupations (such as farmer, builder, carpenter, or owner-operator of a small business), and have diversified their income sources. Because of these diversified activities, the community can support non-agricultural employment. Entrepreneurial communities thriving despite crisis: Most households in these communities are more economically and socially dynamic than the others. This dynamism is directly related to the development of their human and social capital, which facilitates an ongoing process of social and productive innovation. These communities have developed their management and organizational capacity. Local organizations revolve around social and economic activities, such as business, micro-credit and intermediation facilities, and cooperatives. Households make intensive use of all their assets. These communities are committed to the diversification of production and income. They are successful in agricultural production and also engage in other activities, such as tourism, crafts, and trade. They look for ways to extend agricultural production during the dry season by using irrigation systems. They have the capacity to save, invest, and generate employment. They maintain relations with NGOs and local and national authorities, but also have a high degree of financial independence

48
Within communities, the study team classified households as very poor, poor, and better-off poor according to their different asset bases. Box 4.4 describes the key asset bases of rural households according to the “very poor”, “poor”, and “better-off poor” typology (see also appendix 5). Assets of “very poor” rural households:
Very poor households tend to have many children. Generally, household members have not completed primary school. Their human and social capital is minimal, and they work mainly as day laborers on others’ farms. Their productive experience is based on the farms where they work. Lacking land, they produce basic staple grains and beans, planting one annual rain-fed crop. Their main income comes from the sale of their labor, firewood (often illegally cut) sales, and donations. They have a few small hand tools. They do not have access to credit, since they lack collateral or other means to guarantee repayment. The condition of their houses is poor. They live in subsistence conditions and have become dependent on social welfare and assistance programs. They tend to eat one or two meals daily. In times of crisis, they rely on solidarity, visiting friends, who give them some food to take home. Their health status is poor. Their main social links revolve around religious activities. Generally, they do not hold positions in community organizations. There are many single mothers. Members of these households generally migrate to other communities or other regions in the country. There is evidence of social disintegration. Assets of “poor” rural households:
Poor households tend to have many children. Parents have some primary and secondary education, and they encourage their children to study for technical careers. They work their land using household labor and sometimes hire temporary labor. They combine agricultural and livestock activities, and might have other jobs (such as carpenters, builders, and drivers) and small businesses. Sometimes they rent land to the better-off households or work the land together with them. Some have jobs as farm supervisors. They receive remittances from relatives and have access to non-conventional credit (solidarity loans, rural credit funds). They have silos and store food for their own consumption and sell a little. They maintain small areas of forest and natural pasture. Harvesting of madero negro (a type of timber) is an alternative source of income. They try to diversify their income sources, but are highly dependent on the income generated by the sale of basic grains, and they also sell small livestock and cattle. This group is the one that sends the most members to work outside the country (often to finance the first crop on their farms). They eat three meals a day. They take part in community organizations, and involve the better-off households in social initiatives, such as constructing/rehabilitating a school, to give legitimacy to their efforts.

49
Box 4.4. Assets of Rural Households Assets of “extreme poor” rural households (produce basic grains and sell labor)
Human
Social Physical
Financial Community Level
Low level of education (incomplete primary)
Excluded from many community organizations and activities
Landless or small landholding
Minimal access to credit
Poor access to major roads, long distance to market town
Children might complete primary schools
Social networks mostly religious groups
Have small hand tools
Hold only small livestock and minimal food stocks
Community infrastructure deteriorating or lacking
Larger families &/or single mothers
Depend on humanitarian assistance
Marginal soils, no irrigation
Seasonal migration to obtain cash
If have schools, health center, then lack teachers, nurses and supplies
Poor nutrition levels
Lack own transport
Multiple low-paying sources of income/savings
Assets of “poor” rural households (produce basic grains, sell labor, other activities) Human
Social Physical
Financial Community Level
Education to 3rd-4th grade
Belong to community groups
Small landholdings, rent extra land
Access to informal credit, possibly group
OK access to major roads, OK distance to market town
Children complete primary school
Social networks within & out of community
Small hand tools for agriculture and crafts, some larger tools
Hold small and larger livestock, food stocks
Basic community infrastructure and services
Large families
Sometimes group leaders
Bicycle, radio Seasonal migration to finance on-farm activities
Some community level productive assets/activities
Assets of “better-off” rural households (diversified livelihood strategies) Human
Social Physical
Financial Community Level
Higher level of education
Leaders of community
Own land with title Access to credit Good access to markets
Children attend secondary schools, university
Contacts with local organizations and NGOs
Have small and large tools
Hold livestock and food stocks
Community storage facilities
Smaller families Members of cooperatives
Have good soil, irrigation
Receive remittances
Public and community transport
Good nutrition levels
Greater participation by women
Own some form of transport
Multiple sources of income/savings
Close proximity to schools, health center

50
Assets of “better-off poor” rural households:
Although these households are better off, they still do not satisfy all their basic needs. Better-off poor households tend to practice family planning and have fewer children. Most of them study and have knowledge of improved agricultural technologies and attempts at adoption. They generally have access to credit, because they are reliable and repay loans. Although they participate in social activities for the common good, their main activity is associated with production, revolving around their business or farm or related to harvesting, storage, and marketing. Their incomes are diversified; they have savings and are able to reinvest in their business. They receive income from other sources, including business activities and sales to local stores. They are business intermediaries, moneylenders, and traders, and buy and sell cattle, basic grains and coffee. They receive remittances from Costa Rica and the United States. They live near the better roads. Their homes are in good condition, with basic services, and they own vehicles. They own lands with legal titles, and have small and large tools. They have silos and store for trade. They are medium-sized cattle ranchers, coffee growers, and banana producers. They have greater area of natural pasture and some area of forest. They are recognized by the community and serve as leaders of local organizations. Many are members of large cooperatives.
In summary, investments in social capital can have strong positive effects on changes in real household consumption per capita. Social capital assets can substitute for locational disadvantages, and can also complement location-specific assets. Evidence from the livelihood studies highlights the conclusion that much of the potential for poverty-reducing growth lies in the dynamism of communities and their social assets. Strong communities make greater and more intensive use of the natural capital (private and common property). They increase productivity and social action in the face of crises. This can generate social innovation and lead to greater participation and interaction with external agents and coordinated demands to the government. By strengthening their productive, economic, and social organizations, communities enhance their other assets.
Communities with strong social capital assets demonstrated greater capacity for risk
management. There are able to guarantee food security, through their own production or purchases. They have multiple sources of income and employment. They try to increase incomes and reduce vulnerability by diversifying livelihood activities, including agricultural and non-agricultural enterprises. They tend to adopt improvements, including collection and storage of water, low-cost irrigation systems, and genetic improvement of short-cycle seeds to cope with the drought. They manage to improve their farms through innovation and increased productivity. To cope with crises, they build their social networks and diversify their productive and social organizations.
4.6. The Need for Asset Complementarities in Rural Investment Programs To generate substantial gains in poverty reduction and broad-based growth, complementarities between productive, social, and location-specific assets must be addressed
51
Project stocktaking exercises were carried out using participatory methods to elicit information from stakeholders about selected World Bank-supported ESSD projects in Central America. The major objective of the exercises was to assess how these projects provide new assets and/or strengthen existing assets of poor rural households, and to identify “missing” or poorly functioning assets critical to achieving sustainable poverty-reducing growth (see box 4.5 and appendix 5).
The need for improved complementarity of investments and increased cross-sectoral cooperation to increase project impacts is confirmed by results from project stocktakings. ESSD investments in agricultural technology, forestry, and land administration can be more effective in reducing poverty if they can be properly coordinated with investments in physical and social infrastructure and public services. For example, improvements in agricultural technology and extension should be linked to improved access to education, markets, and infrastructure such as roads, telecommunications, and finance.
From the perspective of beneficiaries, most projects have tended to provide only
partial solutions to their general lack of assets. They report that “missing” or poorly functioning assets often constrain project impacts. Investments in social services and infrastructure are highly valued, but there is a high demand for productive assets that increase the earning capacity of households. The need for complementary assets was most poignant with respect to the Agricultural Technology Project, where concerns were expressed about the lack of complementary assets, such as business management skills, finance, market knowledge, and roads.
Box 4.5. Project Stocktaking Exercises Participatory meetings and workshops with stakeholders were carried out for projects related to agricultural technology, forestry development, and rural decentralization. Three project stocktakings were undertaken in Nicaragua: for the Agricultural Technology Adaptable Program Lending (APL) (October 2002); the Forestry Development Learning and Innovation Loan (LIL) (March 2003); and the Rural Municipalities Project (April 2003). The project stocktakings began with field visits to interview beneficiaries (and non-beneficiaries), community leaders, and other project stakeholders. These were followed by community meetings and regional workshops (covering several communities) with representatives of the respective groups. The asset-base framework was used as a guide for eliciting responses from participants to compare the situation with and without projects. After explaining the conceptual framework, discussions were organized around a set of standard and simple questions about livelihood strategies, assets, risks, outcomes, vision of the future, limitation and opportunities of project contributions, local government and other institutions’ performance and other factors. Visualization techniques, charts, and boards were used to elicit views from the participants. Approximately 30 to 35 people participated at the community meetings and regional workshops. Special efforts were made to invite women. Project coordinators and staff assisted in the logistics and participated in the workshops and meetings. The selection of participants at meetings and workshops and areas for field visits was not statistically representative, since participants were chosen by project coordinators and staff.

52
Chapter 5. Conclusions and Recommendations
The overall study objective was to develop an appropriate conceptual and analytical framework to better understand how prospects for growth and poverty reduction can be stimulated in rural Central America. The study used complementary quantitative and qualitative methods of analysis, driven by an asset-based approach, to generate a number of key findings with important strategic implications. 5.1. Findings Overall conditions in Nicaragua improved between 1998 and 2001
Between 1998 and 2001, overall poverty declined slightly in Nicaragua. Reductions in the incidence of extreme poverty were responsible for most of the decline. About 58 percent of Nicaraguan households enjoyed an increase in real consumption expenditures per capita during this period. A relatively large number of households (almost 15 percent) moved out of poverty (rising above the poverty line). Even among the chronic poor, well-being improved. Many households below the poverty line experienced an improvement in well-being -- but not by enough to move them out of poverty in all cases. Many households that experienced improvements remain highly vulnerable to poverty
The first finding illustrates the importance of considering changes in well-being along the entire distribution of well-being. Analysts and policymakers are often primarily concerned with poverty-reducing improvements with respect to the poverty line. Yet broad-based growth is also evident in the form of improved well-being for households above the poverty line and for poor households that increase well-being, yet remain below the poverty line. A large proportion of the rural density occurred very close to the poverty line. This bunching close to the poverty line indicates that many households that experienced improvements in well-being between 1998 and 2001 remain vulnerable to poverty (that is, remain in danger of falling below the poverty line). Profound regional differences in levels and changes in well-being in Nicaragua stem from inequalities in the distribution of productive, social, and location-specific assets
While overall conditions improved between 1998 and 2001 and reductions in rural poverty have been significant, some areas and households have prospered, while others have not. This heterogeneity of rural areas is caused by geographic inequalities in the distribution of a range of household assets, risks, opportunities, constraints, and historical investment decisions by households in response to these conditions. The variability in levels and changes in welfare within narrowly defined geographical areas highlights the appropriateness of an asset-based strategy that focuses not only on location-specific assets, but on household assets, as well. Heterogeneity creates challenges for analyses, policy formulation of rural growth policies, investment strategies, and the design of projects.

53
Economic potential has a strong spatial pattern, with high potential areas close to the main cities
To draw implications for regional development strategies and targeting of investments, the study further investigated the themes of location and assets using standard tools of geographic information system and multivariate spatial and household level analyses. An overlay of spatially indexed municipal-level data was done to produce a regional typology of economic potential. By overlaying maps that reflect natural resource assets, access to infrastructure and markets, and climatic risks, the analysis identifies five economic dynamism zones, all hypothesized to have varying degrees of economic and market development. The analysis finds that economic potential has a strong spatial pattern, with high potential areas close to the main cities. The zones are not contiguous, reflecting high heterogeneity within municipios (municipalities) even at this level of aggregation. Economic potential does not automatically translate into improved well-being outcomes for all households
The study is ultimately interested in understanding how greater prospects for growth translate into improved economic performance of households. Key questions include: Are people better off in the high potential areas? If not, why not? An important issue for targeting public investments is to identify the combinations of productive, social, and location-specific assets that best enable households to take advantage of an area’s growth potential and contribute to improvements in their well-being. The striking result was that about half of the extreme rural poor in Nicaragua reside in the quarter of the country that is within four hour-drive from Managua: in the Central and Pacific regions, which are areas with high and medium economic potential. The Central region alone has the highest share of rural extreme poverty. Almost two-thirds (62.4 percent) of the country’s total population of rural extreme poor live there. Investments must focus on the complementary assets that the poor lack to allow them to take advantage of existing economic opportunities
We need to understand why despite the high potential of these regions, so many people living in them are poor, why an area’s economic potential does not automatically translate into greater prospects for improved well-being for the poor, and why so many single-asset investments focusing on these areas have had limited success in reaching the poor or have bypassed them altogether. These questions are of critical importance for the Nicaraguan government’s strategy of rural cluster development. Promoting clusters in areas with good transport and infrastructure access makes sense from the standpoint of business and cost-efficiency. But the strategy cannot reach the poor if does not recognize the factors that prevent them from raising their incomes and taking advantage of prospects for poverty-reducing growth in high potential areas. Some of these factors are missing assets, others are poorly functioning institutions, and some are related to policy shortcomings. Targeting areas with high poverty rates will not necessarily reach areas with high numbers of poor

54
The spatial analysis also yields important insights for future investments. In particular, it raises important issues about the nature of tradeoffs between efficiency and equity in targeting rural development interventions. Investments targeted to areas with high poverty rates such as the Atlantic will not necessarily reach areas with high numbers of poor households such as the Central region. While most people in the Atlantic are indeed poor, most poor people do not live in the Atlantic given the region’s considerably fewer poor people per square kilometer, or much lower poverty densities.
There is need to consider both poverty rates and poverty density for developing growth and poverty reduction strategies. Investment in high poverty-density areas in the municipios located in the immediate circle around Managua and other urban centers in the Central and Pacific regions will reach high numbers of poor (but might imply large leakages to the non-poor). However, such targeting would exacerbate regional disparities in income, neglecting areas with the highest poverty rates, such as the Atlantic. To generate substantial gains in poverty reduction and broad-based growth, complementarites between productive, social, and location-specific assets must be addressed
The spatial analysis explains much variation in assets and outcomes between municipos, but not all. And it does not address variation within–municipios. Its aggregate nature can mask substantial intra-regional differences. Household-level analysis is needed to quantify the links between assets, livelihood strategies, and well-being outcomes. By combining such data with results from qualitative livelihood surveys and participatory ESSD project stocktakings the study gains additional insights into the determinants of rural growth and poverty reduction.
The study found the most important assets to be education, infrastructure (especially access to roads), social capital, landholding size, and other location-specific assets. Other, less tangible assets also play key roles. For example, lack of information about markets and opportunities, and access to public services can represent major constraints to broad-based growth. Not all assets are equal in importance; some are effective only in combination with other assets, so public investment strategies should be coordinated across sectors. Education matters in all areas and for each type of household
Education, particularly completing primary school, has the most consistently positive impacts on household welfare of all assets considered in this study. The analysis found that households headed by people with less than four years of education are 20 percent worse off than others. However, the impacts of education on poverty reduction depend on other key productive assets, such as land, infrastructure, productive capital, and location. These complementarities reinforce the need for investments in complementary assets.
The positive impacts of education are direct and indirect. Education levels influence household decisions about productive investments, such as technology adoption, saving and

55
investing in farm and equipment, diversification of employment sources, use of natural capital (private and common property), and participation in community organizations. All these factors are associated with improvements in household well-being. Policy and institutions should be designed to bolster returns to investments in education by facilitating access to farm and financial services. Improved road access has a positive impact on changes in well-being, but its significance depends on a number of factors
The analysis confirmed expectations about the role of remoteness; remote households tend to be poorer and have fewer prospects for growth than non-remote households. Access to roads and landholding interact to affect welfare; road improvements in combination with larger landholdings have a strong positive impact on welfare. Thus better roads disproportionately benefit people with larger landholding sizes in remote areas, but a road-building program together with land access may be a good means of improving welfare in remote rural areas.
As with education, roads and other market-related infrastructure have direct and indirect impacts on well-being through their influence on household economic decisions and livelihood strategies. Some of these results reflect selectivity: asset rich households tend to choose to live in less remote areas. They also have the ability to choose more productive livelihood strategies. However, infrastructure access promotes technology adoption, diversified farms, wage- and self-employment outside of agriculture, accumulation of land and livestock, participation in community organizations, and development of credit relations. All these factors, working together, can improve levels and changes in household well-being.
Access to land is an important determinant of well-being in rural Nicaragua, but livelihood strategy also matters
Landless rural families constitute the most prominent group at risk of being poor in Nicaragua. Although landless households experience higher rates of poverty, increased landholding is not necessarily associated with lower poverty rates. Livelihood strategies, especially if they include rural non-agricultural activities, are also important. The relationship between landholding size and economic well-being depends, among other things, on land quality, its suitability for agricultural production, its proximity to markets, and on other complementary assets, especially education and infrastructure. The amount of land under irrigation is positively associated with farm-household well-being. Farmers using modern seed and chemical inputs were also better off, holding all else constant, than those who did not use these inputs.
Assets can complement and substitute for one another
No unique minimum or optimal asset bundle applies to every household or region. For example, road access substitutes for landholding size in remote areas, but distance from services makes education even more important. Infrastructure investments are more effective when directed toward areas with better land security and access. Households with low

56
education (and lacking other assets) do not benefit as much from better roads. Social capital of communities compensates for lack of location-specific assets.
Strong local level institutions and social capital can compensate for lack of physical assets
Strong local level institutions are key to managing community affairs such as provision of basic services, regulation of natural resource use, mediation of conflicts, and coordination of community development. Water committees, school committees, credit associations, sharecropper associations, and churches are commonly found in communities. In the absence of formal institutions in isolated rural areas, these organizations fill a critical role. Much of the potential for poverty-reducing growth lies in the dynamism of communities, their local level institutions and social assets.
Evidence from the multivariate household analysis and qualitative studies shows that
social capital can substitute for location disadvantages. Strong communities make greater and more intensive use of their natural capital. They increase productivity and facilitate social action in the face of crises. These actions can generate social innovation and lead to greater participation and interaction with external agents and more coordinated demands to the government. By strengthening their productive, economic, and social organizations, communities enhance their other assets.
Multisectoral approaches tend to be more often advocated than implemented
Findings from ESSD project stocktakings confirm the need for improved complementarity of investments and cross-sectoral cooperation to realize highest levels of project impacts. ESSD investments in agricultural technology, forestry, and land administration can be more effective in reducing poverty if they can be properly coordinated with investments in physical and social infrastructure and public services. For example, improvements in agricultural technology and extension should be linked to improved access to education, markets, and infrastructure, such as roads, telecommunications, and finance.
From the perspective of beneficiaries, most projects have tended to provide only
partial solutions to their general lack of assets. They report that “missing” or poorly functioning assets often limit project impacts. Investments in social services and infrastructure are highly valued, but there is a high demand for productive assets that increase the earning capacity of households. The challenge is to separate the public and private roles in providing productive assets; at a minimum, the public sector should reduce inefficient barriers to productive asset accumulation. 5.2. Recommendations
The following recommendations should be placed in the context of supporting efforts to strengthen the analytical underpinnings of: (a) the World Bank’s assistance program, with the aim of supporting work to implement effectively its Country Assistance Strategy and achieve the expected outcomes in the ESSD and other sectors; and (b) the Government of Nicaragua’s on-going work to operationalize its Poverty Reduction Strategy (National
57
Development Plan) and the Ministry of Agriculture and Forestry’s Rural Productivity Strategy. Move from geographically untargeted investments in single assets to a more integrated and geographically based approach of asset enhancement with proper complementarities
Investments in single assets (e.g. roads, education, agricultural technology) need to be complemented by provision of other assets to achieve broad-based poverty-reducing growth. Otherwise, their benefits can bypass households that lack these complementary assets. Investments in education, roads, and other infrastructure related to access to markets intensify the positive effects of investments in agriculture and other land-based production strategies, which by themselves have limited impacts on growth and poverty reduction. Improved complementarity of investments with increased cross-sectoral cooperation is necessary to realize project impacts. A multisectoral and spatially differentiated investment program is required to upgrade and improve access to household assets. The appropriate roles of the public and private sectors in providing access to assets needs to be carefully considered. At a minimum market failures and information asymmetries should be addressed through public actions and barriers to asset accumulation should be identified.
If the development objective is to reach the largest number of poor, invest in a variety of social and productive household assets in higher potential areas with the highest rural poverty densities
Most poor people in Nicaragua reside in areas that are already favored by relatively good access (internal and long distance), better soil, and more secure land tenure. Because both the general rural population density and the rural poverty density are higher in these areas, virtually any intervention that involves fixed service provision will have a lower unit cost in these areas; however, possible leakages to the non-poor need to be considered. In particular, there are probably agglomeration economies, rather than diminishing marginal returns, to infrastructure improvement in these areas. For instance, better road networks can improve access to markets, health centers, and location assets. If investments are made in services for which use by non-poor can be controlled, targeting high poverty density areas would maximize the benefits to the poor per dollar invested. If the investments produce non-rival goods (those for which consumption by one person does not preclude use or consumption by another—roads, for example) then targeting high poverty density areas also makes sense. Remote areas such as the Atlantic need specialized analyses and differentiated strategies and investments
Targeting infrastructure and service-delivery interventions on less remote, more densely populated areas might benefit more poor people than a similar investment in less dense areas. However, as suggested above, a strategy of targeting “better endowed areas” might exacerbate regional disparities in income, neglecting the more remote areas with the highest poverty rates. Regional inequalities are of particular concern because the most remote areas have high proportions of indigenous populations. Moreover, remote areas such as the

58
Atlantic include some of the larger blocks of natural forested areas and they are of considerable value in terms of biodiversity.
Frequently discussed options in these more remote areas include agroforestry, sustainable forest management for timber or non-timber forest products, ecotourism, forest protection services, and market for different types of “environmental services.” All these options face hurdles of financial viability directly related to low population density and inadequate production volume to warrant large-scale infrastructure investments. The challenge is to identify cost-effective interventions for reaching poor people with few assets of any kind, in areas of low population density.
Because of the high poverty rates in remote areas such as the Atlantic region, a project or investment need not have an explicit targeting mechanism; leakages to the non-poor are reduced in areas with higher rates of poverty. On the other hand, because population densities are low, investments should be spatially targeted to specific population clusters or placed so as to guarantee a reasonable standard of access, even in low population density areas. Land titling and distance delivery of technical services might be appropriate in low density areas because they can be delivered across space at a minimal cost, especially when these areas enjoy relatively good agro-forestry potential and complementary infrastructure already exists. Asset investment programs need to be adapted according to the specific needs of regions and households
Some household assets programs should be national in nature (such as education and health), while others (such as investments in infrastructure, and productive and social capital assets) require more local adaptation and must be carried out in tandem, according to specific needs of regions and households. Household-level heterogeneity limits the appropriateness of “cookie-cutter approaches” to policies and programs designed to foster broad-based growth. Investment strategies should be formulated on broad regional bases, but options within regions should be tailored to local asset bases and other conditions. Investments should support decentralized planning and implementation, but informed central analysis and central funding are still necessary for the poorest, most remote areas
Heterogeneity implies a greater role for local decision-making. Central government should provide guidance for investments and national priorities, but seek local input and analysis before deciding on the final form of such investments. Projects should contain a menu of alternatives whose ultimate choice depends on local assets and conditions. Local development investments should be community-driven, but informed analysis and central guidance and funding are still necessary, especially for poorest, most remote areas. These recommendations are consistent with efforts toward decentralization supported by the Government’s recent “Ley de Decentralization.”

59
There is need for more strategic convergence in linking the investment and impacts of sectoral projects backed by the World Bank and other donors in the diverse geographical regions of the country
Investments in the environmentally and socially sustainable development sectors in
themselves have limited growth and poverty reduction impact unless they can build on complementary basic assets, especially in education, roads, and other market-related infrastructure. The Bank must improve the complementarity of Bank-supported investments and cross-sectoral cooperation. This is important for the Bank’s ability to prioritize new investments and increase its effectiveness in using the existing and proposed lending program to leverage more substantial gains in policy, regulatory, and institutional reforms that the Bank seeks in the country, as stated in the Country Assistance Strategy for Nicaragua (2002). A similar conclusion and overarching recommendation would apply to the investments carried out by the Government of Nicaragua and other collaborating partners. The proposed PRSC II and Sector Wide Approach program (SWAp) for the rural sector are taking programmatic approaches, which lend themselves to applying the asset-based framework.
Although rural productive technology investments have improved productivity and diversification into higher-return activities, it is also clear that one or two productive assets are not sufficient for sustainable poverty reduction. SWAp needs to include a “package” of technology, land, finance, markets, business skills, social capital, and risk management. Where there is no SWAp, projects need to come together to achieve such integration and complementarities. The study confirms the strategic role of the proposed PRORURAL Program, which is currently being prepared as a SWAp for the rural sector in Nicaragua. While this operation is not being designed as a multisectoral operation, it can be an effective vehicle for carrying out many of the above recommendations, particularly if combined with other sectoral investment programs (social, infrastructure).

60
References Berdegue, J. A., T. Reardon, and G. Escobar. 2001. “The Increasing Importance of
Nonagricultural Rural Employment and Income.” In R. Echeverria, ed., Development of Rural Economies. . Washington, D.C.: Inter-American Development Bank.
Chambers, R., and G. Conway. 1992. Sustainable Rural Livelihoods: Practical Concepts for
the 21st Century. IDS Discussion Paper 296. Institute for Development Studies, Brighton, UK.
Corral, L., and T. Reardon. 2001. “Nonfarm Incomes in Nicaragua.” World Development, 29
(3) :427--42. Davis, B., and R. Murgai. 2000. “Between Prosperity and Poverty: Rural Households in Nicaragua.” Food and Agricultural Organization, Rome. Processed. Davis, B., and M. Stampini. 2002. “Pathways toward Prosperity in Rural Nicaragua; Or Why
Households Drop in and out of Poverty, and Some Policy Suggestions on How to Keep Them Out.” ESA Working Paper 10/2002. Food and Agricultural Organization, Rome.
Deininger, K., and P. Olinto. 2000. “Asset Distribution, Inequality, and Growth.” Policy
Research Working Paper 2375. World Bank, Washington, D.C. Deininger, K., and J. S. Chamorro. 2002. “Investments and Income Effects of Land
Regularization: The Case of Nicaragua.” Policy Research Working Paper 2752. World Bank, Washington, D.C.
Deininger, K., E. Zegarra, and I. Lavandez. 2003. “Determinants and Impacts of Rural
Land Market Activity: Evidence from Nicaragua.” World Development, 31 (8) :1385--1404.
De Ferranti, D., G. E. Perry, F. H. G. Ferreira, and M. Walton. 2004. “Inequality in Latin
America: Breaking with History?” World Bank Latin American and Caribbean Studies. World Bank, Washington, D.C.
De Janvry, A. 2002. “Geography of Poverty, Territorial Growth and Rural Development.”
Paper presented to the USAID/LAC Rural Economy Workshop: Promoting Rural Prosperity, February 4, Washington D.C. See www.ruralprosperity.com/presentations.cfm
De Janvry, A. and E. Sadoulet. 2000. “Rural Poverty in Latin America: Determinants and
Exit Paths.” Food Policy 25 : 389--409. ---------. 2001. “Investing in Rural Development is Good Business.” In R. Echeverria, ed.,
Development of Rural Economies.. Washington, D.C.: Inter-American Development Bank.

61
De Janvry, A., E. Sadoulet, and C. Araujo. 2002. “Geography of Poverty, Territorial Growth and Rural Development.” Paper presented at Annual World Bank Conference on Developing Economies Economists’ Forum, April 30, Washington, D.C.
Echeverria, R., ed. 2001a. Development of Rural Economies. Washington, D.C.: Inter-
American Development Bank. ---------. 2001b. “Options for Investing in the Rural Economy” In R. Echeverria, ed.,
Development of Rural Economies. Washington, D.C.: Inter-American Development Bank. Ellis, F. 1998. “Household Strategies and Rural Livelihood Diversification,” Journal of Development Studies 35 (1): 1--38.
Ellis, F. 1998. “Household Strategies and Rural Livelihood Diversification,” Journal of
Development Studies 35 (1): 1--38. FAO (Food and Agricultural Organization). 2001. Farming Systems and Poverty: Improving
Farmers’ Livelihoods in a Changing World. Produced with the World Bank. Rome: Food and Agricultural Organization.
---------. 2002. “Committee on Commodity Problems: Report of the Consultation on
Agricultural Commodity Price Problems” March 18-21, Rome. GON (Government of Nicaragua). 1999. “Of Potholes, Mudslides and Crossroads:
Reflections and Implications of Natural Disasters for the Development of Rural Nicaragua.” Ministry of Agriculture, Livestock and Forestry, Managua.
---------. 2000. “A Strengthened Poverty Reduction Strategy Paper (PRSP).” Secretaría
Técnica de la Presidencia (SETEC), Managua. ---------. 2001a. Bases para Plan Desarrollo Rural de Nicaragua: Una propuesta para la
discusión y para la accion. Published by Universidad Centroamericano. Managua: UCA Publications.
---------. 2001b. Mapa de Pobreza Extrema de Nicaragua: Censo 1995-EMNV 1998. Managua.
---------. 2002. “Estrategia Nacional de Desarrollo: Borrador para Discusión.” Discussion
draft, December. Managua. ---------. 2003a. “Bases para una Nicaragua Prospera.” March 31. Managua. ---------. 2003b. “Estrategia de Desarrollo Rural Productivo, 2003.” Ministry of Agriculture
and Forestry (MAGFOR).

62
Haggblade, S., P. Hazell, and T. Reardon. 2002. “Strategies for Stimulating Poverty- Alleviating Growth in the Rural Nonfarm Economy in Developing Countries.” Environment and Production Technology Division, EPTD Discussion Paper 93. International Food Policy Research Institute, Washington, D.C
Hentschel, J, J.O. Lanjouw, P. Lanjouw, and J. Poggi. 1998. “Combining Census and Survey
Data to Study Spatial Dimensions of Poverty.” Policy Research Working Paper 1928. World Bank, Washington, D.C.
Hereford, R., and R. Echeverria. 2003. “Pobreza Rural en Centroamérica.” Report RUR-03-
102. Inter-American Development Bank, Washington, D.C. IFAD (International Fund and Agricultural Development). 2001. Rural Poverty Report 2001:
The Challenge of Ending Rural Poverty. Rome. ---------. 2002. Enabling the Rural Poor to Overcome their Poverty: Strategic Framework
2002-2006. Rome. IFPRI (International Food and Policy Research Institute. 2000. “Promoting Sustainable
Development in Less-Favored Areas.” Focus 4. Washington, DC. ---------. 2002. “Mesoamerican Representatives and IFPRI Board Draw Up To-Do List for
the Region.” Washington, D.C. Moser, C. 1998. “The Asset Vulnerability Framework: Reassessing Urban Poverty
Reduction Strategies.” World Development 26 (1) : 1--19. Narayan, D., R. Patel, K. Schafft, A. Rademacher, and S. Koch-Schulte. 2000. Voices of the
Poor: Can Anyone Hear Us? Oxford University Press for the World Bank. Rakodi, C. 1999. “A Capital Assets Framework for Analyzing Household Livelihood
Strategies.” Development Policy Review 17 (3) :315--42. Reardon, T., and J. Berdeque. 2002. “The Rapid Rise of Supermarkets in Latin America:
Challenges and Opportunities for Development” Development Policy Review 20 (4) : 371--88.
Reardon, T., J. Berdegue, and G. Escobar. 2001. “Rural Nonfarm Employment and Incomes
in Latin America: Overview and Policy Implications.” World Development 29 (3) :395--409.
Siegel, P.B. 2005. “Using an Asset Base Approach to Identify Drivers of Sustainable Rural
Growth and Poverty Reduction in Central America: Conceptual Framework.” Agriculture and Rural Development Department, Latin America and the Caribbean Regional Office. Policy Research Working Paper Series No. WPS 3475. The World Bank: Washington, D.C. See www.worldbank.org/research

63
Siegel, P. B., and J. Alwang. 1999. An Asset-based Approach to Social Risk Management: A
Concept Approach. Social Protection Discussion Paper 9926. World Bank, Social Protection Unit, Human Development Network. Washington, D.C. See www.worldbank.org/sp
Sobrado, C. 2001. “The Consumption Aggregate.” Annex 1 in Nicaragua Poverty Assessment, Vol. II Annexes. World Bank, Poverty Reduction and Economic Management Sector Unit, Latin America and the Caribbean. Washington, D.C.
Valdes, A., and J. A. Mistiaen. 2001. “Rural Poverty in Latin America: Recent Trends and
New Challenges.” In K. Stamoulis, ed., Food, Agriculture and Rural Development: Current and Emerging Issues for Economic Analysis and Policy Research. Rome: Food and Agriculture Organization (FAO).
Varangis, P., D. Larson, and J. Anderson. 2002. Agricultural Markets and Risks:
Management of the Latter, Not the Former. Policy Research Working Paper 2793. World Bank, Washington, D.C.
Wadsworth, J. 2002. “Rural Livelihoods in Central America: Findings of a Dialogue in
Nicaragua and Honduras” Presentation at World Bank, October 16, Washington, D.C.
World Bank. 1998. “Nicaragua Sustainable Forestry Investment Promotion Project: Project
Appraisal Document.” Report No. 18653. Washington, D.C. ---------. 2000a. World Development Report 2000/1: Attacking Poverty. Washington, D.C. ---------. 2000b. “Nicaragua Agricultural Technology Project.” Report NI-20168.
Washington, D.C. ---------. 2000c. “”Nicaragua Competitiveness Learning and Innovation Loan.” Report NI- 21532. Washington, D.C. ---------. 2001a. Social Protection Sector Strategy: From Safety Net to Spring Board.
Washington D.C. ---------. 2001b. “Nicaragua Poverty Assessment: Challenges and Opportunities for
Poverty Reduction.” Report NI-20488. Washington, D.C.
---------. 2001c. “Nicaragua: Public Expenditure Review: Improving the Poverty Focus of Public Spending.” Report NI-23095. Washington, D.C.
---------. 2001d. “Nicaragua Second Rural Municipalities Development Project.” Report NI-21536. Washington, D.C.

64
---------. 2001e. “Nicaragua Disaster Vulnerability Reduction Project.” Report NI-21859. Washington, D.C.
---------. 2002a. Reaching the Rural Poor. Washington, D.C. ---------. 2002b. Reaching the Rural Poor in the Latin America and Caribbean Region.
Washington, D.C. ---------. 2002c. “Nicaragua: Promoting Competitiveness and Stimulating Broad-based
Growth in Agriculture.” Report No. NI-25115. Environmentally and Socially Sustainable Development Unit, Washington, DC.
---------. 2002d. “Nicaragua: Land Administration Project.” Report No. 22399. Washington,
D.C. ---------. 2002e. “Nicaragua Country Assistance Strategy.” Report No. 25043. Washington,
D.C. ---------. 2002f. World Development Report 2003: Sustainable Development in a Dynamic
World: Transforming Institutions, Growth, and Quality of Life. Overview. Washington, D.C.
---------. 2002g. “Nicaragua Poverty Reduction Strategy Paper Annual Progress Report and
Joint IDA/IMF Staff Assessment.” Report No. 25104. Washington, D.C. ---------. 2002h. “SIGA 1.0: Sistema de Indicatores Guberamentales para el Apoyo a la Toma
Decisiones.” Produced for Proyecto MECOVI, The World Bank: Managua. ---------. 2002i. LaVentana Newsletter. Volume 1. Latin American and Caribbean Social
Development Unit. See www.worldbank.org/afrolatin. ---------. 2003a. “Project Performance Assessment Report: Nicaragua Economic Recovery
Credit and Second Economic Recovery Credit.” Report 25887. Operations Evaluation Department, Washington, D.C.
---------. 2003b. “Nicaragua Poverty Assessment.” Washington, D.C. June. Draft. ---------. 2003c. “Nicaragua: Off-Grid Rural Electrification Project,” Report No. 25114.
Washington, D.C. ---------. 2003d. “Little Green Data Book 2003.” From World Development Indicators.
Washington, D.C. ---------. 2003e. “Thinking Out Loud IV: Innovative Case Studies on Participatory
Instruments.” Latin America and the Caribbean Region, Civil Society Team. Washington, D.C.

65
World Bank and CCAD (Comisión Centroamericana de Ambiente y Desarrollo). 2001.
“Ecosystems of Central America (ArcView regional map files at 1:250,000).” World Bank, CCAD, World Institute for Conservation and Environment (WICE), and the Centro Agronómico Tropical de Investigación y Enseñanza (CATIE), Washington, D.C. See http://www.worldbank.org/ca-env.
Zezza, A., and L. Llambi. 2002. “Meso-Economic Filters Along the Policy Chain:
Understanding the Links Between Policy Reforms and Rural Poverty in Latin America.” World Development 30 (11) :1865--84.

66


