General rights Copyright and moral rights for the publications made accessible in the public portal are retained by the authors and/or other copyright owners and it is a condition of accessing publications that users recognise and abide by the legal requirements associated with these rights. Users may download and print one copy of any publication from the public portal for the purpose of private study or research. You may not further distribute the material or use it for any profit-making activity or commercial gain You may freely distribute the URL identifying the publication in the public portal If you believe that this document breaches copyright please contact us providing details, and we will remove access to the work immediately and investigate your claim. Downloaded from orbit.dtu.dk on: Jun 10, 2019 Nickel oxide reduction studied by environmental TEM Jeangros, Q.; Hansen, Thomas Willum; Wagner, Jakob Birkedal; Damsgaard, Christian Danvad; Dunin- Borkowski, R.E.; Hébert, C.; Van herle, J.; Hessler-Wyser, A. Published in: Proceedings of 10th European SOFC Forum 2012 Publication date: 2012 Link back to DTU Orbit Citation (APA): Jeangros, Q., Hansen, T. W., Wagner, J. B., Damsgaard, C. D., Dunin-Borkowski, R. E., Hébert, C., ... Hessler- Wyser, A. (2012). Nickel oxide reduction studied by environmental TEM. In Proceedings of 10th European SOFC Forum 2012
Transcript
General rights Copyright and moral rights for the publications made accessible in the public portal are retained by the authors and/or other copyright owners and it is a condition of accessing publications that users recognise and abide by the legal requirements associated with these rights.
Users may download and print one copy of any publication from the public portal for the purpose of private study or research.
You may not further distribute the material or use it for any profit-making activity or commercial gain
You may freely distribute the URL identifying the publication in the public portal If you believe that this document breaches copyright please contact us providing details, and we will remove access to the work immediately and investigate your claim.
Downloaded from orbit.dtu.dk on: Jun 10, 2019
Nickel oxide reduction studied by environmental TEM
Jeangros, Q.; Hansen, Thomas Willum; Wagner, Jakob Birkedal; Damsgaard, Christian Danvad; Dunin-Borkowski, R.E.; Hébert, C.; Van herle, J.; Hessler-Wyser, A.Published in:Proceedings of 10th European SOFC Forum 2012
Publication date:2012
Link back to DTU Orbit
Citation (APA):Jeangros, Q., Hansen, T. W., Wagner, J. B., Damsgaard, C. D., Dunin-Borkowski, R. E., Hébert, C., ... Hessler-Wyser, A. (2012). Nickel oxide reduction studied by environmental TEM. In Proceedings of 10th EuropeanSOFC Forum 2012
Abstract In situ reduction of an industrial NiO powder is performed under 1.3 mbar of H2 (2 mlN/min) in a differentially pumped FEI Titan 80-300 environmental transmission electron microscope (ETEM). Images, diffraction patterns and electron energy loss spectra (EELS) are acquired to monitor the structural and chemical evolution of the system during different temperature ramps (at 2, 4 and 7°C/min). High-resolution ETEM is also performed during similar experiments. Ni nucleation on NiO is observed to be either epitaxial in thin areas or randomly oriented on thicker regions and when nucleation is more advanced. The growth of Ni crystallites and the movement of interfaces create pores within the NiO grains to accommodate the volume shrinkage associated with the reduction. EELS analysis illustrates that reduction proceeds quickly at temperatures below 400°C up to a reduced fraction of about 0.6, until the reaction is slowed down by water created upon reduction. Using the data obtained at different heating rates and the Kissinger method, an activation energy for the NiO reduction of 70 ± 20 kJ/mol could be obtained. Densification is then observed at temperatures higher than 550°C: pores created at lower temperatures disappear and Ni grains coarsen. This reorganization of Ni is detrimental to both the connectivity of the Ni catalyst and to the redox stability of the SOFC. A model for the structural evolution of NiO under H2 is proposed.
10th European SOFC Forum 2012 26 – 29 June 2012, Lucerne Switzerland
B0503 / Page 2-10
Introduction Nickel oxide reduction and subsequent Ni behaviour under H2 is of practical importance in the field of the SOFC technology, as it determines the structure of the electronic conductor on the anode side during operation [1]. Despite extensive coverage in the literature since the study of Benton et al. in 1924 [2], several questions remain, notably regarding the NiO reduction kinetics and its structural evolution. Richardson et al., who studied NiO reduction by in situ X-ray diffraction, described NiO reduction as follow [3]: i) H2 first dissociates on two Ni atoms surrounding an oxygen vacancy (the presence of such vacancy leads to an increase in the adsorption energy of H2, which in turn reduces the energy barrier to break the H-H bond [4]), ii) adsorbed H atoms diffuse to the reaction centres, iii) rupture of Ni-O bonds, iv) nucleation and growth of Ni clusters, v) dissociation of H2 directly on the metallic clusters once their size is sufficient, vi) the reaction rate increases autocatalytically, vii) the metal clusters grow into Ni crystallites. The presence of H2O on the surface slows the reaction (this effect depends notably on the sample geometry and is decreased when the temperature increases). The authors obtained an activation value of 85.6 kJ/mol. Other activation energy values found in the literature for NiO reduction vary over one order of magnitude (from 10 to 150 kJ/mol, summarized up to 2003 in reference [3], with more recent studies yielding values of 53.5 kJ/mol [5], 96.4 kJ/mol [6], 91.8-94.5 kJ/mol [7] and 15 kJ/mol [8]). The little uniformity in the NiO samples chemistry and microstructure (powder, pressed porous or dense pellet, thin or thick slab), characterization techniques (thermogravimetry, mass spectroscopy, X-ray diffraction) and other experimental parameters (gas pressure in the reaction chamber and gas flow) may explain the discrepancy in those results. Furthermore, different mathematical models have been used to describe satisfyingly the kinetics of NiO reduction [9]: Avrami (growth of nuclei) [10-13], pseudo-first-order (as H2 is in excess) [3], shrinking core (when the size of the NiO particles is > 10 μm) [14,15], or the Evans–Szekely grain model (porous agglomeration of grains each undertaking a shrinking core reduction) [16]. Environmental transmission electron microscopy (ETEM, Figure 1) can be used to provide dynamic in situ observations of chemical reactions at the nano- to micrometric scale [17]. A differential pumping system allows to introduce a gaseous atmosphere (< 15 mbar) in the microscope column at high temperature (using a heating sample holder), without compromising other aspects of the performance of the microscope [18]. This technique, which has already been applied to problems in catalysis [19], semiconductor nucleation [20], growth kinetics [21] and redox cycling of a Ni-based SOFC anode [22], is here used to link the reaction kinetics with the structural changes occurring during NiO reduction.
2. Experiments
2.1 Electron microscopy An industrial NiO powder from JT Baker™ was dispersed on Cu-SiO2 grids and mounted in a GATAN tantalum heating holder. The TEM sample was plasma cleaned during 7 minutes to remove any carbon contamination. In situ reduction under 1.3 mbar of H2 (2 mlN/min) was then performed in a differentially pumped FEI Titan environmental transmission electron microscope (Figure 1). Images, diffraction patterns and electron energy-loss spectra were acquired at constant time/temperature intervals during separate experiments performed at 2, 4 and 7°C/min (from 300 to 600°C). The temperature was kept constant for 4 to 5 minutes (depending on the desired heating rate) in order to stabilise the thermal drift and perform the measurements. In order to maintain the overall
10th European SOFC Forum 2012 26 – 29 June 2012, Lucerne Switzerland
B0503 / Page 3-10
heating rate, the temperature was then increased quickly by 15, 25 or 35°C (for respectively the 2, 4 and 7°C/min experiments). The heating steps were 1 to 2 minutes long. The region of interest was always taken in the centre of the grid to get the same temperature difference between the one at the observed area and the one indicated by the thermocouple, which is welded on the outside of the furnace, (expected to be around 30°C). The electron dose was kept the same for the three experiments. The same powder was dispersed on holey Au-SiO2 grids, mounted on a Philips heating single tilt holder and plasma cleaned 7 minutes before in situ reduction was performed in the ETEM (1.3 mbar of H2, from 300 to 650°C). The objective of those experiments was to acquire high-resolution images of the characteristic steps observed during previous linear heating rate experiments.
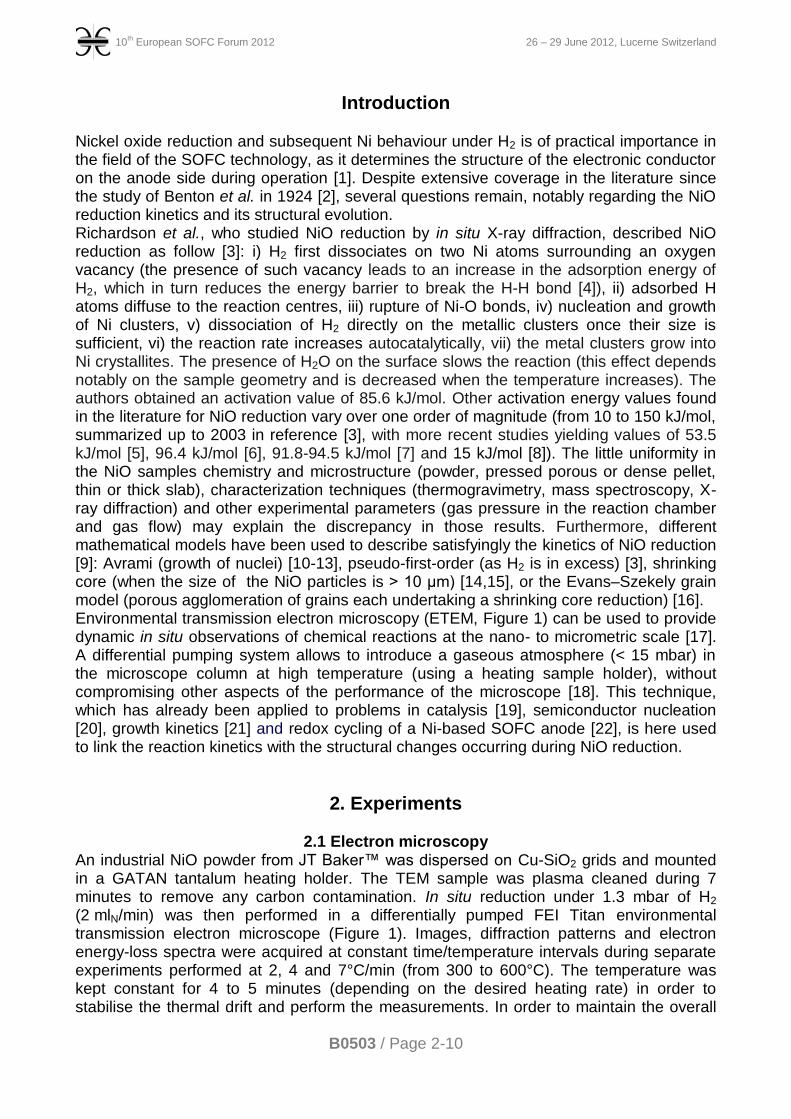
Figure 1: Schematic diagram showing a FEI Titan ETEM. Apertures, turbomolecular pumps (TMPs) and an ion getter pump (IGP) allow a gas pressure of up to < 15 mbar to be achieved at the position of the sample, while retaining an ultra-high vacuum (<10-10 mbar) at the field emission gun (FEG) electron source. Additional components of the ETEM include plasma cleaner (PC) and a residual gas analyzer (RGA).
2.2 NiO reduction kinetics from electron energy loss spectroscopy Electron energy loss spectroscopy (EELS) measures the change of kinetic energy of the electrons after they have passed through and interacted with a sample [23]. Inelastic scattering may occur between the incident electrons (coming from the TEM electron source) and the atomic electrons due to Coulomb interactions. This analytical technique is capable of extracting chemical and structural information about the sample. Here, EELS spectra were acquired during linear heating rate experiment to extract the reaction kinetics using the change in the shape of the Ni L2,3 white lines (corresponding to the energy loss induced by the transitions of atomic electrons from the L2,3 shells to the empty states). The spectra were first normalized just before the L3 edge and the background removed using a power law. Two techniques were then used to obtain the fraction of NiO within the illuminated area: either by taking the ratio of the Ni L3 and L2 intensities integrated with a 2 eV window (polynomial or Gaussian fit for integration) [17,24] or by performing a multiple linear least squares (MLLS) technique, which fits a given spectrum using NiO and Ni experimental reference spectra [25]. The Ni experimental reference was obtained by keeping the sample reduced at 2°C/min during 100 minutes at 615°C under 1.3 mbar of H2
(full reduction confirmed by diffraction). In order to obtain the fraction of NiO or inversely the conversion fraction α (used for the kinetic analysis, equivalent to the fraction of Ni), the
10th European SOFC Forum 2012 26 – 29 June 2012, Lucerne Switzerland
B0503 / Page 4-10
I(L3)/I(L2) ratios were normalized, while the MLLS parameters gave directly the amount of NiO and Ni. The spectra were not deconvolved to remove plural scattering as the specimen thickness was not constant and varied from 50 to > 200 nm. It was possible to determine the activation energy for NiO reduction by applying the Kissinger method [26]. This technique is based on measurements of the shift in the temperature at which the reaction rate is maximum for different heating rates, assuming that α at the peak position doesn’t change with the heating rate. Plotting ln(v/Tm
2) versus 1/Tm, for different heating rates v [K/min] should a give straight line with a slope of -Ea/R, where Tm is the temperature at which the reaction rate is maximum [K], Ea the activation energy [J mol-1] and R the perfect gas constant (8.314 [J mol-1 K-1]).
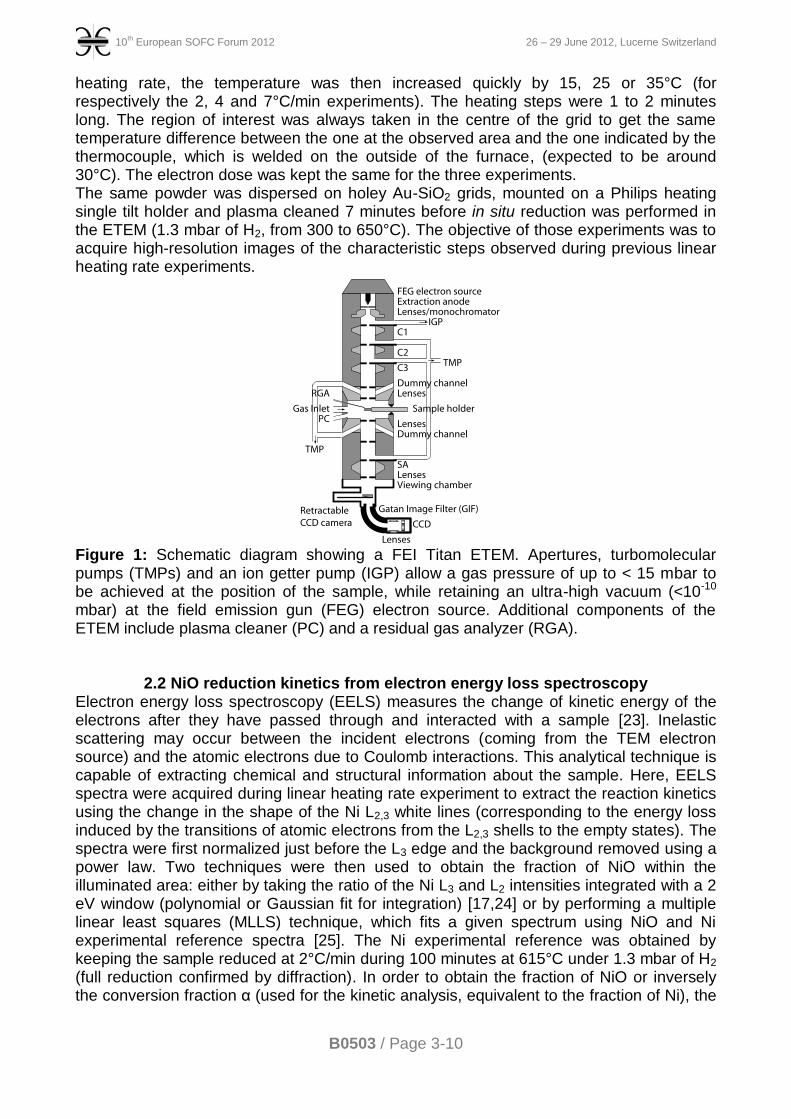
3. Results Figure 2 shows a sequence of TEM images along with the corresponding diffraction patterns illustrating the changes occurring to the NiO microstructure during a 2°C/min ramp from 300°C to 615°C.
Figure 2: Sequence of TEM images and diffraction patterns (2°C/min experiment): a) initial NiO particles at 300°C under 1.3 mbar of H2, b) pores are created within large particles (see arrows) and smaller particles shrink, a large number of Ni reflections appears in the diffraction pattern, c) reduction continues and the structure gets slowly denser, d) densification of the Ni grains, less Ni reflections appear in the diffraction pattern.
10th European SOFC Forum 2012 26 – 29 June 2012, Lucerne Switzerland
B0503 / Page 5-10
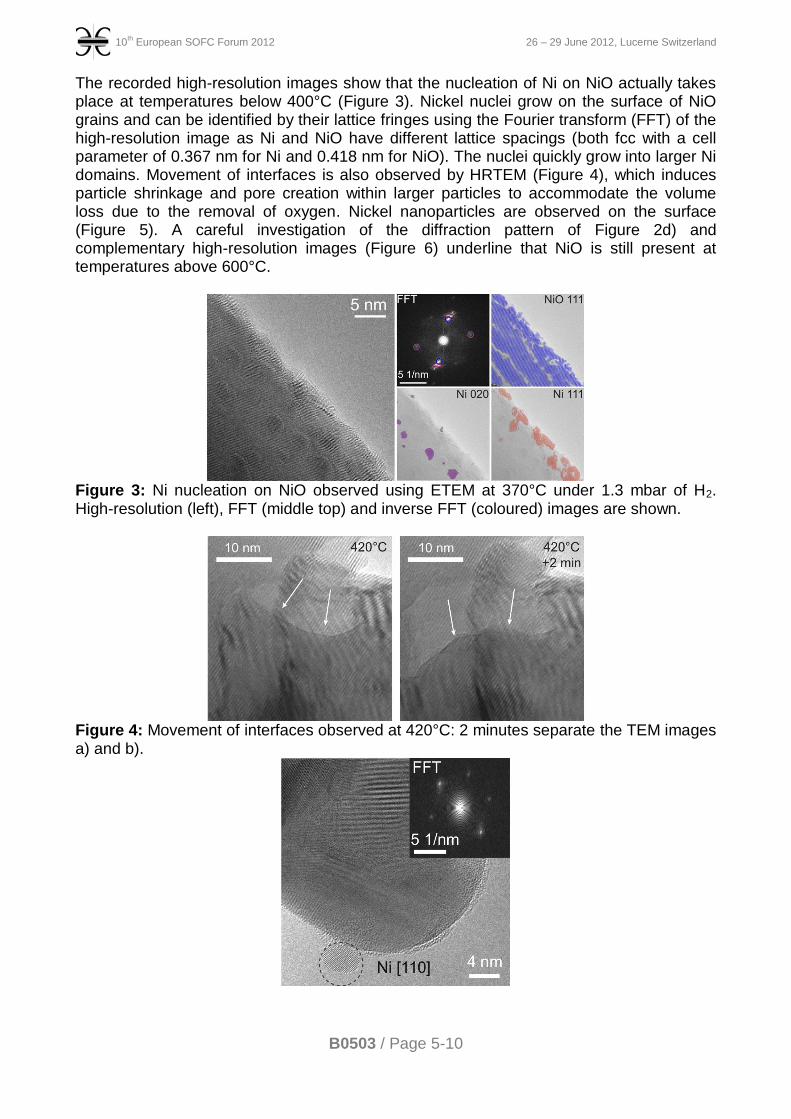
The recorded high-resolution images show that the nucleation of Ni on NiO actually takes place at temperatures below 400°C (Figure 3). Nickel nuclei grow on the surface of NiO grains and can be identified by their lattice fringes using the Fourier transform (FFT) of the high-resolution image as Ni and NiO have different lattice spacings (both fcc with a cell parameter of 0.367 nm for Ni and 0.418 nm for NiO). The nuclei quickly grow into larger Ni domains. Movement of interfaces is also observed by HRTEM (Figure 4), which induces particle shrinkage and pore creation within larger particles to accommodate the volume loss due to the removal of oxygen. Nickel nanoparticles are observed on the surface (Figure 5). A careful investigation of the diffraction pattern of Figure 2d) and complementary high-resolution images (Figure 6) underline that NiO is still present at temperatures above 600°C.
Figure 3: Ni nucleation on NiO observed using ETEM at 370°C under 1.3 mbar of H2. High-resolution (left), FFT (middle top) and inverse FFT (coloured) images are shown.
Figure 4: Movement of interfaces observed at 420°C: 2 minutes separate the TEM images a) and b).
10th European SOFC Forum 2012 26 – 29 June 2012, Lucerne Switzerland
B0503 / Page 6-10
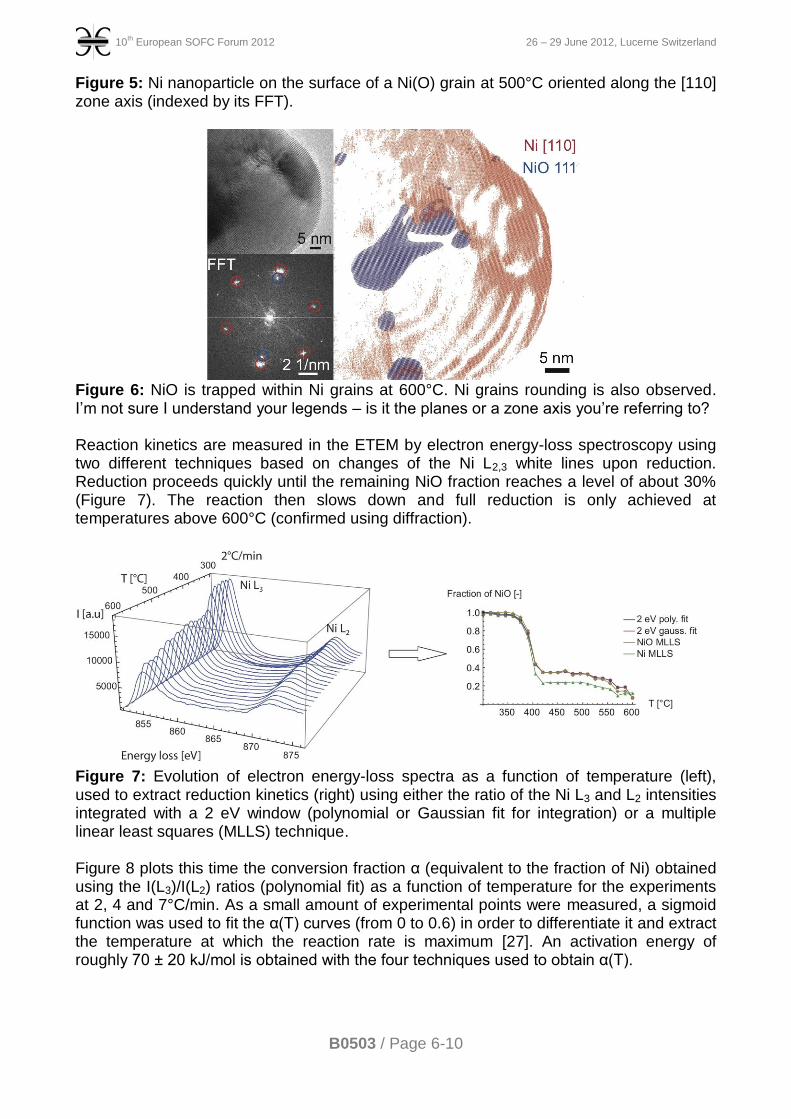
Figure 5: Ni nanoparticle on the surface of a Ni(O) grain at 500°C oriented along the [110] zone axis (indexed by its FFT).
Figure 6: NiO is trapped within Ni grains at 600°C. Ni grains rounding is also observed. I’m not sure I understand your legends – is it the planes or a zone axis you’re referring to? Reaction kinetics are measured in the ETEM by electron energy-loss spectroscopy using two different techniques based on changes of the Ni L2,3 white lines upon reduction. Reduction proceeds quickly until the remaining NiO fraction reaches a level of about 30% (Figure 7). The reaction then slows down and full reduction is only achieved at temperatures above 600°C (confirmed using diffraction).
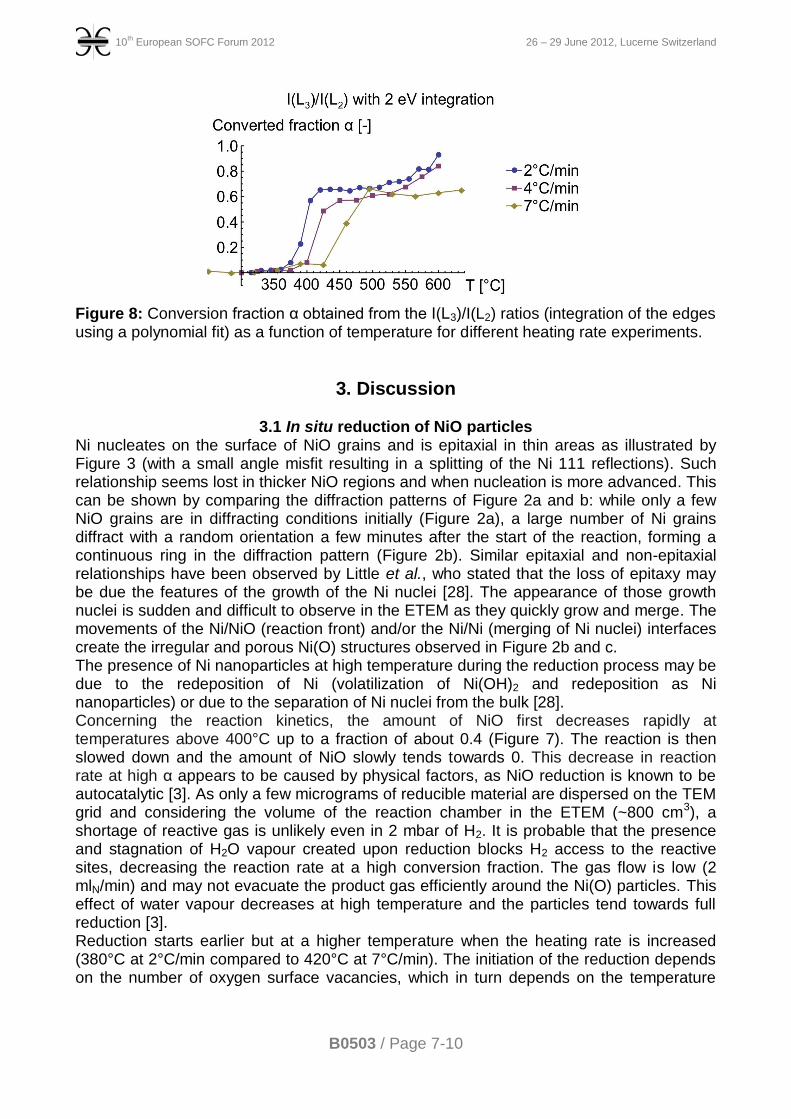
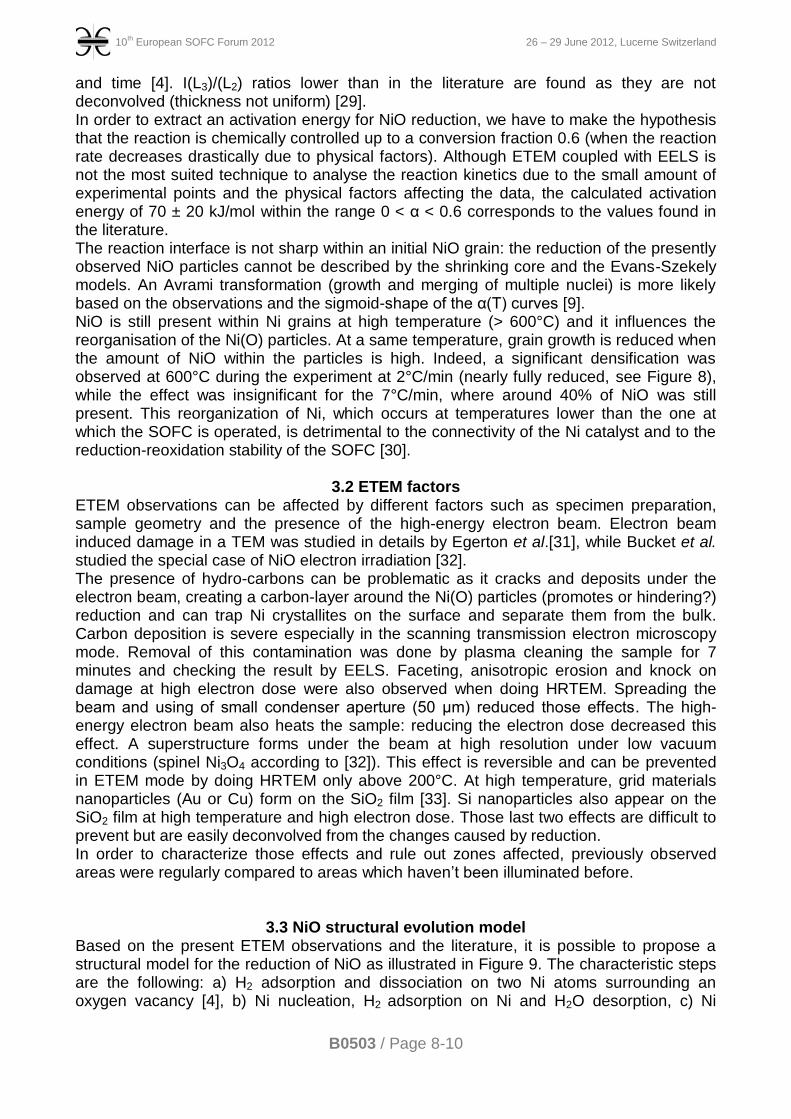
Figure 7: Evolution of electron energy-loss spectra as a function of temperature (left), used to extract reduction kinetics (right) using either the ratio of the Ni L3 and L2 intensities integrated with a 2 eV window (polynomial or Gaussian fit for integration) or a multiple linear least squares (MLLS) technique. Figure 8 plots this time the conversion fraction α (equivalent to the fraction of Ni) obtained using the I(L3)/I(L2) ratios (polynomial fit) as a function of temperature for the experiments at 2, 4 and 7°C/min. As a small amount of experimental points were measured, a sigmoid function was used to fit the α(T) curves (from 0 to 0.6) in order to differentiate it and extract the temperature at which the reaction rate is maximum [27]. An activation energy of roughly 70 ± 20 kJ/mol is obtained with the four techniques used to obtain α(T).
10th European SOFC Forum 2012 26 – 29 June 2012, Lucerne Switzerland
B0503 / Page 7-10
Figure 8: Conversion fraction α obtained from the I(L3)/I(L2) ratios (integration of the edges using a polynomial fit) as a function of temperature for different heating rate experiments.
3. Discussion
3.1 In situ reduction of NiO particles Ni nucleates on the surface of NiO grains and is epitaxial in thin areas as illustrated by Figure 3 (with a small angle misfit resulting in a splitting of the Ni 111 reflections). Such relationship seems lost in thicker NiO regions and when nucleation is more advanced. This can be shown by comparing the diffraction patterns of Figure 2a and b: while only a few NiO grains are in diffracting conditions initially (Figure 2a), a large number of Ni grains diffract with a random orientation a few minutes after the start of the reaction, forming a continuous ring in the diffraction pattern (Figure 2b). Similar epitaxial and non-epitaxial relationships have been observed by Little et al., who stated that the loss of epitaxy may be due the features of the growth of the Ni nuclei [28]. The appearance of those growth nuclei is sudden and difficult to observe in the ETEM as they quickly grow and merge. The movements of the Ni/NiO (reaction front) and/or the Ni/Ni (merging of Ni nuclei) interfaces create the irregular and porous Ni(O) structures observed in Figure 2b and c. The presence of Ni nanoparticles at high temperature during the reduction process may be due to the redeposition of Ni (volatilization of Ni(OH)2 and redeposition as Ni nanoparticles) or due to the separation of Ni nuclei from the bulk [28]. Concerning the reaction kinetics, the amount of NiO first decreases rapidly at temperatures above 400°C up to a fraction of about 0.4 (Figure 7). The reaction is then slowed down and the amount of NiO slowly tends towards 0. This decrease in reaction rate at high α appears to be caused by physical factors, as NiO reduction is known to be autocatalytic [3]. As only a few micrograms of reducible material are dispersed on the TEM grid and considering the volume of the reaction chamber in the ETEM (~800 cm3), a shortage of reactive gas is unlikely even in 2 mbar of H2. It is probable that the presence and stagnation of H2O vapour created upon reduction blocks H2 access to the reactive sites, decreasing the reaction rate at a high conversion fraction. The gas flow is low (2 mlN/min) and may not evacuate the product gas efficiently around the Ni(O) particles. This effect of water vapour decreases at high temperature and the particles tend towards full reduction [3]. Reduction starts earlier but at a higher temperature when the heating rate is increased (380°C at 2°C/min compared to 420°C at 7°C/min). The initiation of the reduction depends on the number of oxygen surface vacancies, which in turn depends on the temperature
10th European SOFC Forum 2012 26 – 29 June 2012, Lucerne Switzerland
B0503 / Page 8-10
and time [4]. I(L3)/(L2) ratios lower than in the literature are found as they are not deconvolved (thickness not uniform) [29]. In order to extract an activation energy for NiO reduction, we have to make the hypothesis that the reaction is chemically controlled up to a conversion fraction 0.6 (when the reaction rate decreases drastically due to physical factors). Although ETEM coupled with EELS is not the most suited technique to analyse the reaction kinetics due to the small amount of experimental points and the physical factors affecting the data, the calculated activation energy of 70 ± 20 kJ/mol within the range 0 < α < 0.6 corresponds to the values found in the literature. The reaction interface is not sharp within an initial NiO grain: the reduction of the presently observed NiO particles cannot be described by the shrinking core and the Evans-Szekely models. An Avrami transformation (growth and merging of multiple nuclei) is more likely based on the observations and the sigmoid-shape of the α(T) curves [9]. NiO is still present within Ni grains at high temperature (> 600°C) and it influences the reorganisation of the Ni(O) particles. At a same temperature, grain growth is reduced when the amount of NiO within the particles is high. Indeed, a significant densification was observed at 600°C during the experiment at 2°C/min (nearly fully reduced, see Figure 8), while the effect was insignificant for the 7°C/min, where around 40% of NiO was still present. This reorganization of Ni, which occurs at temperatures lower than the one at which the SOFC is operated, is detrimental to the connectivity of the Ni catalyst and to the reduction-reoxidation stability of the SOFC [30].
3.2 ETEM factors ETEM observations can be affected by different factors such as specimen preparation, sample geometry and the presence of the high-energy electron beam. Electron beam induced damage in a TEM was studied in details by Egerton et al.[31], while Bucket et al. studied the special case of NiO electron irradiation [32]. The presence of hydro-carbons can be problematic as it cracks and deposits under the electron beam, creating a carbon-layer around the Ni(O) particles (promotes or hindering?) reduction and can trap Ni crystallites on the surface and separate them from the bulk. Carbon deposition is severe especially in the scanning transmission electron microscopy mode. Removal of this contamination was done by plasma cleaning the sample for 7 minutes and checking the result by EELS. Faceting, anisotropic erosion and knock on damage at high electron dose were also observed when doing HRTEM. Spreading the beam and using of small condenser aperture (50 μm) reduced those effects. The high-energy electron beam also heats the sample: reducing the electron dose decreased this effect. A superstructure forms under the beam at high resolution under low vacuum conditions (spinel Ni3O4 according to [32]). This effect is reversible and can be prevented in ETEM mode by doing HRTEM only above 200°C. At high temperature, grid materials nanoparticles (Au or Cu) form on the SiO2 film [33]. Si nanoparticles also appear on the SiO2 film at high temperature and high electron dose. Those last two effects are difficult to prevent but are easily deconvolved from the changes caused by reduction. In order to characterize those effects and rule out zones affected, previously observed areas were regularly compared to areas which haven’t been illuminated before.
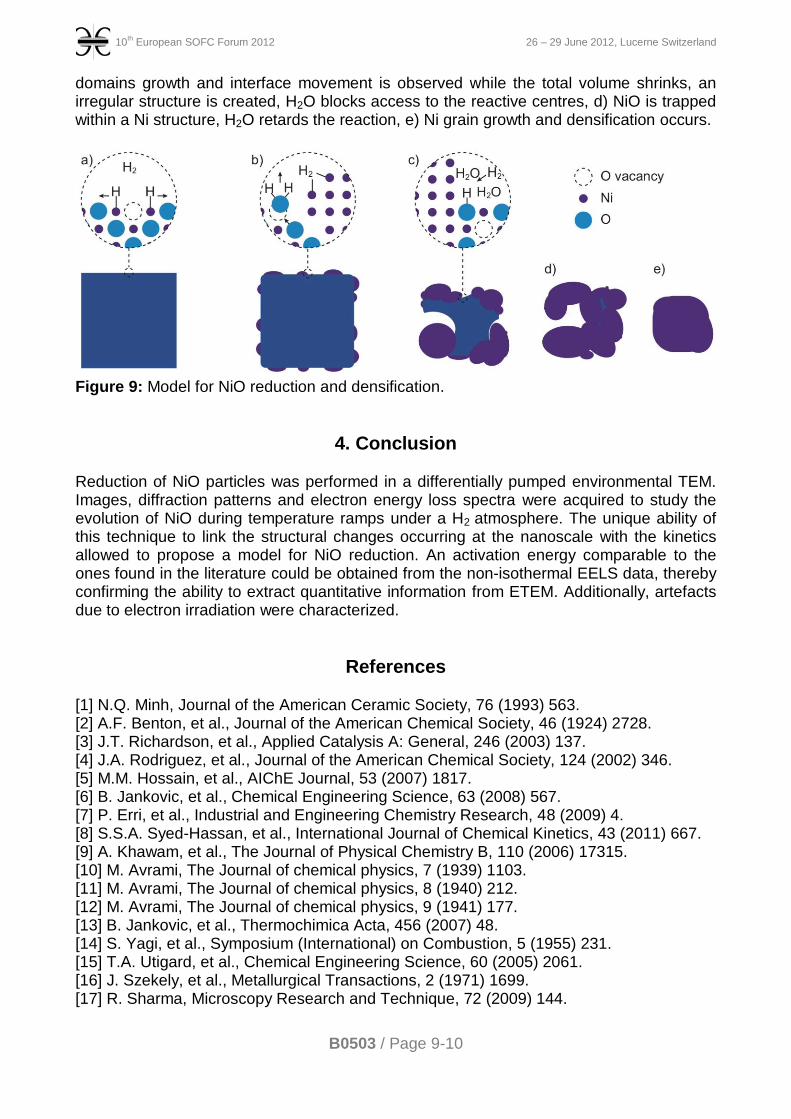
3.3 NiO structural evolution model Based on the present ETEM observations and the literature, it is possible to propose a structural model for the reduction of NiO as illustrated in Figure 9. The characteristic steps are the following: a) H2 adsorption and dissociation on two Ni atoms surrounding an oxygen vacancy [4], b) Ni nucleation, H2 adsorption on Ni and H2O desorption, c) Ni
10th European SOFC Forum 2012 26 – 29 June 2012, Lucerne Switzerland
B0503 / Page 9-10
domains growth and interface movement is observed while the total volume shrinks, an irregular structure is created, H2O blocks access to the reactive centres, d) NiO is trapped within a Ni structure, H2O retards the reaction, e) Ni grain growth and densification occurs.
Figure 9: Model for NiO reduction and densification.
4. Conclusion Reduction of NiO particles was performed in a differentially pumped environmental TEM. Images, diffraction patterns and electron energy loss spectra were acquired to study the evolution of NiO during temperature ramps under a H2 atmosphere. The unique ability of this technique to link the structural changes occurring at the nanoscale with the kinetics allowed to propose a model for NiO reduction. An activation energy comparable to the ones found in the literature could be obtained from the non-isothermal EELS data, thereby confirming the ability to extract quantitative information from ETEM. Additionally, artefacts due to electron irradiation were characterized.
References [1] N.Q. Minh, Journal of the American Ceramic Society, 76 (1993) 563. [2] A.F. Benton, et al., Journal of the American Chemical Society, 46 (1924) 2728. [3] J.T. Richardson, et al., Applied Catalysis A: General, 246 (2003) 137. [4] J.A. Rodriguez, et al., Journal of the American Chemical Society, 124 (2002) 346. [5] M.M. Hossain, et al., AIChE Journal, 53 (2007) 1817. [6] B. Jankovic, et al., Chemical Engineering Science, 63 (2008) 567. [7] P. Erri, et al., Industrial and Engineering Chemistry Research, 48 (2009) 4. [8] S.S.A. Syed-Hassan, et al., International Journal of Chemical Kinetics, 43 (2011) 667. [9] A. Khawam, et al., The Journal of Physical Chemistry B, 110 (2006) 17315. [10] M. Avrami, The Journal of chemical physics, 7 (1939) 1103. [11] M. Avrami, The Journal of chemical physics, 8 (1940) 212. [12] M. Avrami, The Journal of chemical physics, 9 (1941) 177. [13] B. Jankovic, et al., Thermochimica Acta, 456 (2007) 48. [14] S. Yagi, et al., Symposium (International) on Combustion, 5 (1955) 231. [15] T.A. Utigard, et al., Chemical Engineering Science, 60 (2005) 2061. [16] J. Szekely, et al., Metallurgical Transactions, 2 (1971) 1699. [17] R. Sharma, Microscopy Research and Technique, 72 (2009) 144.
10th European SOFC Forum 2012 26 – 29 June 2012, Lucerne Switzerland
B0503 / Page 10-10
[18] T.W. Hansen, et al., Materials Science and Technology, 26 (2010) 1338. [19] P.L. Hansen, et al., Science, 295 (2002) 2053. [20] S. Hofmann, et al., Nat Mater, 7 (2008) 372. [21] R. Sharma, Journal of Materials Research, 20 (2005) 1695. [22] Q. Jeangros, et al., Acta Materialia, 58 (2010) 4578. [23] R.F. Egerton, Reports on Progress in Physics, 72 (2009) 016502. [24] P.A. Van Aken, et al., Physics and Chemistry of Minerals, 25 (1998) 323. [25] P. Rez, et al., Microscopy and Microanalysis, 14 (2008) 1382. [26] H.E. Kissinger, Analytical Chemistry, 29 (1957) 1702. [27] B. Adnadevic, et al., Physica B: Condensed Matter, 403 (2008) 4132. [28] J.A. Little, et al., Metallurgical Transactions B, 11 (1980) 519. [29] R.D. Leapman, et al., Physical Review B, 26 (1982) 614. [30] D. Sarantaridis, et al., Fuel Cells, 7 (2007) 246. [31] R.F. Egerton, et al., Micron, 35 (2004) 399. [32] M.I. Buckett, et al., Surface Science, 232 (1990) 353. [33] Z. Zhang, et al., Ultramicroscopy, 109 (2009) 766.


![[Norbert H. Nickel, Evgenii Terukov] Zinc Oxide](https://static.documents.pub/doc/80x56/56d6be6b1a28ab30169209ee/norbert-h-nickel-evgenii-terukov-zinc-oxide.jpg)


