Niger: Poverty Reduction Strategy Paper—2005 Status Report
Poverty Reduction Strategy Papers (PRSPs) are prepared by member countries in broad consultation with stakeholders and development partners, including the staffs of the World Bank and the IMF. Updated every three years with annual progress reports, they describe the country’s macroeconomic, structural, and social policies in support of growth and poverty reduction, as well as associated external financing needs and major sources of financing. This country document for Niger, dated June 2006, is being made available on the IMF website by agreement with the member country as a service to users of the IMF website.
To assist the IMF in evaluating the publication policy, reader comments are invited and may be sent by e-mail to [email protected].
Copies of this report are available to the public from
International Monetary Fund • Publication Services 700 19th Street, N.W. • Washington, D.C. 20431
List of Acronyms ..........................................................................................................................3 List of Tables ................................................................................................................................4 List of Charts ................................................................................................................................4 List of Annexes.............................................................................................................................4 Executive Summary ....................................................................................................................5 Box 1: 2005 Status Report Methodology .................................................................................9 I. IMPACT OF THE PRS ON PRIORITY SECTORAL STRATEGIES ..............................10 II. PROGRESS ON PRS IMPLEMENTATION......................................................................12
2.1. Environment for PRS implementation ........................................................................12 2.2. The macroeconomic and financial situation ..............................................................14
2.2.1. Economic growth and inflation .............................................................................14 2.2.2. Public finance ..........................................................................................................14
a. Fiscal revenue ...........................................................................................................14 b. Expenditure ................................................................................................................15 c. Government capital budget......................................................................................17 d. Use of HIPC resources.............................................................................................17 e. External and domestic debt .....................................................................................18
2.2.3. Foreign trade and the monetary situation...........................................................19 a. Foreign trade..............................................................................................................19 b. Monetary situation.....................................................................................................19
2.2.4. Implementation of reforms ....................................................................................19 2.2.5. Financing .................................................................................................................20
2.3. Results of sectoral policies and strategies ................................................................20 2.3.1. Rural development .................................................................................................20 2.3.2. Trade, industry, and promotion of the private sector ........................................21 2.3.3. Craft, tourism, and hotel industries ......................................................................22 2.3.4. Mining and energy ..................................................................................................23 2.3.5. Transport, roads, and infrastructure ....................................................................24 2.3.6. Information and communication technologies (ICTs) .......................................26 2.3.7. Health .......................................................................................................................26
2.3.8. STDs, HIV, AIDS ....................................................................................................28 2.3.9. Education .................................................................................................................28 2.3.10. Access to Safe Drinking Water ..........................................................................31 2.3.11. Youth, sports and culture ....................................................................................32 2.3.12. Capacity-Building .................................................................................................32 2.3.13. State Modernization .............................................................................................33
2.4. Poverty and the Tracking-Assessment Mechanism .................................................34 2.4.1. General Population and Housing Census (RGPH) ...............................................34 2.4.2. Basic Needs Satisfaction Survey .............................................................................34 2.4.3. The Unified Core Welfare Indicators Questionnaire (CWIQ)...............................35 2.4.4. Results of the Governance, Democracy and Poverty Reduction Modules .......36 2.4.5. Participatory Survey on Poverty...............................................................................36 2.4.6. The Multiple-Indicator Demographic and Health Survey (EDSN-MICSS III). ...37 2.5. Implementation Constraints .........................................................................................37
III. OUTLOOK FOR PRS IMPLEMENTATION ....................................................................38 ANNEXES...................................................................................................................................44
3
LIST OF ACRONYMS
AEP: Drinking Water Conveyance ARM: Multisectoral Regulation Authority ARMP: Public Procurement Regulation Authority ARV: Anti-retroviral BADEA: Arab Bank for Economic Development in Africa BTP: Construction and Public Works CAFER: Autonomous Road Maintenance Financing Fund CAPED: Development Analysis and Forecasting Unit CET: Common External Tariff CFAF: African Financial Community Franc CFPA: Vocational Training and Apprenticeship Center CFPP: Vocational Training and Professional Development Center CJF: Fifth Francophone Games CNDHLF: National Commission on Human Rights and Fundamental Freedoms CNDP: National Council for Political Dialogue CNDS: National Commission for Social Dialogue COMINAK: Akouta Mining Company CPI: Investment Promotion Center CSI: Integrated Health Center CWIQ: Unified core Welfare Indicators Questionnaire DAO: Bid documentation DSBE: Measure of basic needs satisfaction EAN: “Entreprendre au Niger” (Doing Business in Niger) EIG: Economic interest group ENAM: National School of Administration and Magistracy ENBC: National Consumption Budget Survey GDP: Gross domestic product GCB: Government capital budget GIP: Government investment program HICP: Harmonized Index of Consumer Prices HIPC: Heavily indebted poor country IDA: International Development Agency IGA: Income-generating activity ILO: International Labour Office IMF: International Monetary Fund INS: National Statistics Institute MME: Ministry of Mines and Energy MSP/LCE: Ministry for Public Health and Combating Endemic Diseases MTEF: Medium-Term Expenditure Framework NEPAD: New Partnership for Africa’s Development NGO/AD: Nongovernmental organization and development association NGP: Net government position NICI: National Information and Communication Infrastructure NIGELEC: Nigerien electric company ONPE: National Post and Savings Office ONPPC: National Pharmaceutical and Chemical Products Office OPEC: Organization of Petroleum Exporting Countries PDDE: Ten-Year Education Development Program PDS: Health Development Program PIMAN: Niger Integrated Government Modernization Program PNCD: National Program on Communication for Development PRS: Poverty Reduction Strategy
4
PS/PR: Special Program of the President of the Republic PTMC: Prevention of Transmission from Mother to Child RAIL/SIDA: Network of AIDS associations SEEN: Société d’exploitation des eaux du Niger (water) SNIS: National Health Information System SOMAÏR: Aïr Mining Company SPEN: Société de patrimoine des eaux du Niger (water) UCA: Animal-drawn farming implement WAEMU: West African Economic and Monetary Union
LIST OF TABLES
Table 1. Changes in Key Revenue Items (CFAF billions) Table 2. Changes in Key Expenditure Items (CFAF billions) Table 3. Changes in GCB Program Execution, 2002-2005 (CFAF billions) Table 4. Use of HIPC Loans in the Priority Sectors (CFAF billions) Table 5. Changes in the External Debt Stock and External Debt Service (CFAF billions) Table 6. 2005 Road Work Table 7. Nutritional centers and vaccination coverage Table 8. Change in number of pupils and gross preschool enrollment ratio Table 9. Change in gross rate of access and gross enrollment ratio Table 10. Primary completion and repeater rate Table 11. Implementation of the school infrastructure program Table 12. Implementation of the water infrastructure and drinking water coverage in rural areas
LIST OF CHARTS
Chart 1. Changes in GCB Program Execution, 2003-2005 (CFAF billions)
LIST OF ANNEXES
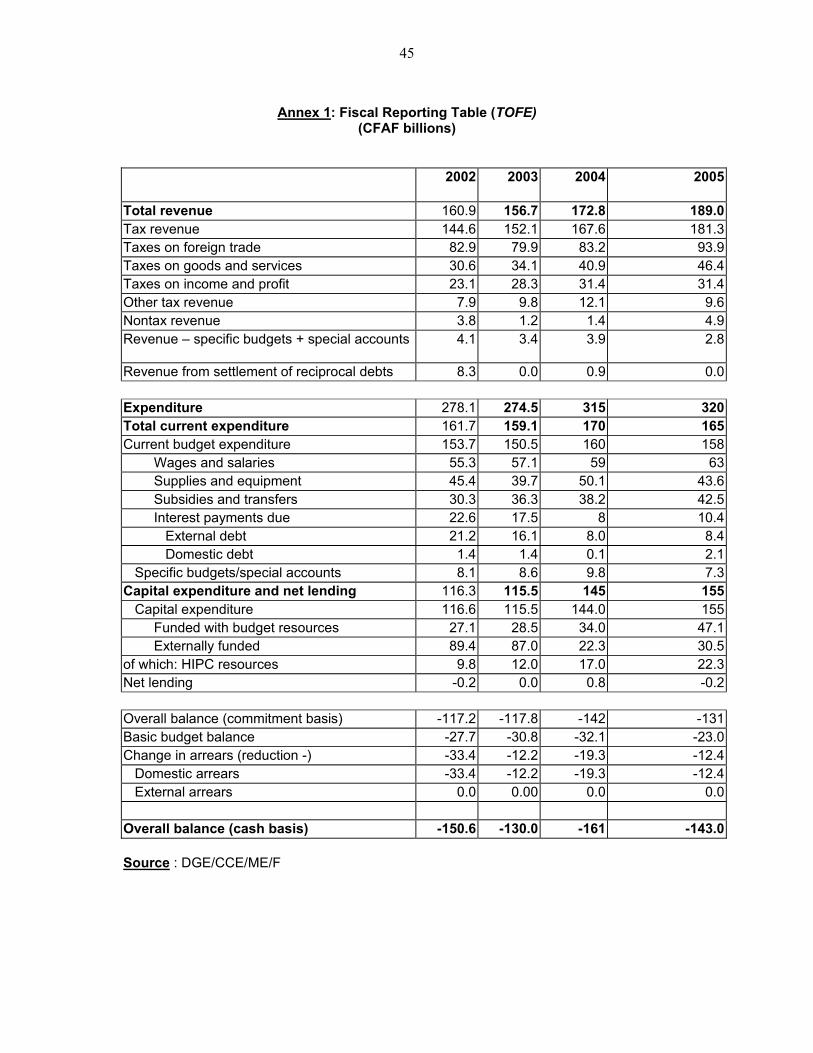
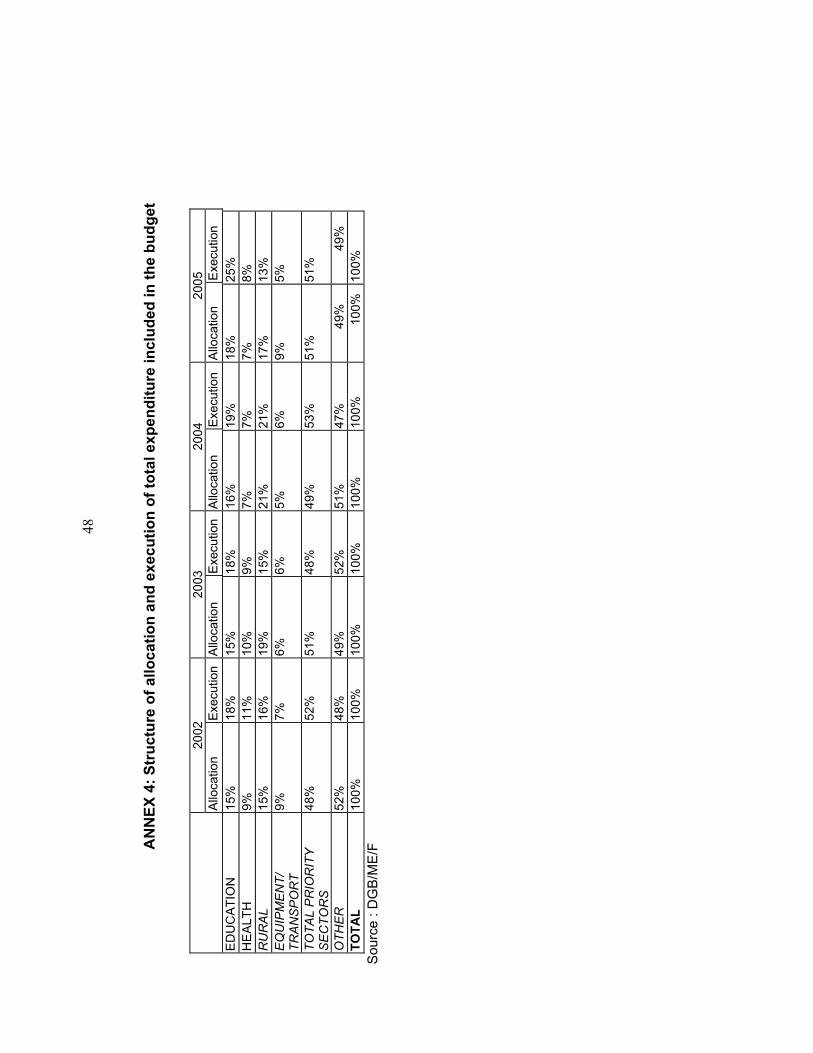
Annex 1. Fiscal Reporting Table (CFAF billion) Annex 2. Macroeconomic monitoring indicators Annex 3. Changes in budget execution 2002-2005 (CFAF billion) Annex 4. Structure of allocation and execution of total expenditure
5
EXECUTIVE SUMMARY
This status report is the product the government of Niger’s willingness to provide annual information on the implementation of the Poverty Reduction Strategy (PRS). It is intended to serve as the fourth annual PRS progress report and covers essentially the period from January to December 2005. Like the previous annual progress reports on PRS implementation, this 2005 status report is based on an assessment of economic and financial performance and sectoral policy and strategy implementation in 2005. It evaluates the government’s efforts by analyzing the changes in key indicators in 2005. The status report also assesses the short and medium-term outlook in view of economic trends. Implementation of the priority sectoral policies and strategies by the various line ministries has been affected to some extent not only by Niger’s geopolitical environment but also by compliance with the economic and financial program agreed upon with the Bretton Woods institutions. Niger’s economic and financial situation was marked by a number of factors in 2005: the poor 2004-2005 harvest and the ensuing food crisis, the increase in oil prices, the scaling up of preparations for the Fifth Francophone Games (CJF), repeated closures of borders with certain countries, and demonstrations against the tax provisions in the first budget law. However, the 2005-2006 harvest was satisfactory and allowed a higher rate of economic growth. Owing to the good crop year, the economy expanded by an estimated 7.1 percent in 2005, compared to minus 0.6 percent in 2004. Agricultural production saw an increase of 20.2 percent. This rise can be attributed essentially to rainy-season production, which constitutes around 65 percent of agricultural production and appears to have increased by 36.6 percent. At December 31, 2005, budget revenue totaled CFAF 189 billion, compared to CFAF 172.8 billion in 2004, or an increase of 10 percent. This increase is explained by improved collection of both tax revenue—up 8.2 percent—and nontax revenue—more than double their 2004 level. Despite demonstrations against the tax provisions in the 2005 budget law, the tax rate was 10.6 percent in 2005 (compared to 11.4 percent in 2004) and remains lower than the norm for the West African Economic and Monetary Union (WAEMU). Total spending and net loans went from CFAF 314.9 billion in 2004 to CFAF 319.8 billion in 2005. It should be noted that the budget year was characterized by spending on the Niger 2005 CJF, as well as major expenditures in connection with the food crisis. Domestic payment arrears were reduced by CFAF 12.4 billion in 2005, compared to CFAF 19.3 billion in 2004. Budget allocations to priority sectors increased from 49 percent to 51 percent. Education, health, and rural development received, respectively, 18 percent, 7 percent, and 17 percent of total appropriations in 2005. Overall, the rate of public expenditure execution was 51 percent in 2005, compared to 75 percent in 2004. This situation is explained by cash-flow constraints. It should be noted that, despite tight budgetary control in 2005, priority-sector expenditure was protected. Thus, for the education, health, and rural sectors, the rate of use of appropriations was 72 percent, 65 percent, and 37 percent, respectively.
6
The 2005 approved government capital budget (GCB) totaled CFAF 204.3 billion, compared to CFAF 185.4 billion for the 2004 budget, or an increase of 10.2 percent. The implementation rate was around 53.55 percent, compared to 73.63 percent, as a result of use of appropriations in the first quarter. Monitoring of GCB execution continues to be hindered by nontransmittal of financial data on donor-managed projects. Exports for 2005 were estimated at CFAF 168.1 billion, compared to CFAF 135.2 billion in 2004, or an increase of 24 percent. Imports fell by 15 percent to CFAF 287.4 billion. The trade deficit was CFAF 119.3 billion, compared to CFAF 203.5 billion in 2004. Thanks to various forms of debt relief, more resources could gradually be mobilized for use in the HIPC Initiative. HIPC resources continued to be allocated to the Special Program of the President of the Republic (PS/PR). A total of CFAF 24.1 billion was used in the priority sectors in 2005, compared to CFAF 14.31 billion in 2004. Education received over 52 percent of resources. The infrastructure and transport sector, which had been passed over in 2004, received CFAF 3.5 billion. In accordance with the recommendations of the Independent Evaluation Office on use of HIPC resources for the PS/PR, the latter’s activities have gradually been integrated into the programs of priority ministries that have a Medium-Term Expenditure Framework (MTEF), i.e. the education and health ministries. During the period under review, the government has continued implementing its reform program. • In the area of public finances, the 2004 action plan on Public Expenditure
Management and Financial Accountability Review (PEMFAR) constituted the principal frame of reference. The following tasks were accomplished in 2005: Preparation of MTEFs for the priority sectors (education, health, and transport and
infrastructure); Preparation of a PRS-consistent macroeconomic framework report for the 2006
budget law; Establishment of an interface between the Treasury and the General Budget
Directorate (DGB); Computerization of five (5) regional payment offices; Preparation of the Treasury balance sheet at December 31, 1996; Integration of HIPC resource expenditure into the budgets of the sectoral ministries; Integration of external resource expenditure for fiscal 2003 and, to a considerable
extent, for fiscal 2004 and 2005. • In the area of financial sector reform, progress was made with respect to Crédit du
Niger (CDN) and the National Post and Savings Office (ONPE).
Privatization of Crédit du Niger. The following operations were accomplished with the support of the Financial Sector Development Program (PDSF): (i) preparation of financial statements to determine the bank’s net worth and (ii) preparation of a report on converting CDN to a housing bank in the context of its privatization.
The ONPE. The ONPE restructuring process resulted in (i) the payment of severance pay to 294 employees at a total cost of CFAF 2,306,000,000 and (ii) the creation of “Niger-Poste” by means of Law No. 2005-21 of June 28, 2005 authorizing the conversion of the ONPE to a semi-public company named “Niger-Poste.”
At the sectoral level, implementation of the PRS continued with the development or finalization of a number of priority policies and strategies:
7
Adoption of the National Urban Development Strategy; Adoption of the National Microfinance Strategy; Adoption of the Framework Program to Provide Initial Employment for Young People; Adoption of the National Policy on Vocational and Technical Education and Training; Initial work on the National Employment Policy; Revision of the National Population Policy and its inclusion in the PRSP.
Overall, continued implementation of the PRS had the following results in the priority sectors:
In the health sector, efforts to implement health policy through the government budget, the PS/PR, the development partners, and the private sector brought about the consolidation of prior accomplishments in this area in 2005. Because improving health indicators is a slow process requiring consistent attention, the government is attempting to better target the various initiatives to the most vulnerable populations and to use resources more effectively. Results were not yet available from the 2005 Demographic and Health Survey, but we do know that health infrastructure coverage remains at 65 percent.
In the education sector, the goals set for preschool development were very modest
considering the magnitude of the needs and preschool’s positive impact on primary school performance. The approach adopted for the Ten-Year Education Development Program (PDDE) is to develop public preschools in rural and periurban areas. Nevertheless, the attainment level for these goals was only 85 percent, and preschool education remained a primarily urban phenomenon. At the primary school level (basic cycle 1), although progress was achieved in enrollment (gross enrollment ratio), the goals were not met (55 percent actual compared to 60 percent programmed). Urban-rural disparities remained pronounced (48 percent in rural areas compared to 92 percent in urban areas in 2005). As regards gender disparities, no significant change was noted over the period. With respect to coverage (gross enrollment ratio), the situation improved, although the goals were not met (52 percent actual compared to 54 percent programmed). In the area of nonformal education, the government’s chosen approach to implementing literacy instruction and adult education has been the “faire-faire” or learning by doing strategy. Analysis of program performance for the 2004-2005 period shows that the goals were not met. Only 52 percent of the programmed 180,000 enrollments were achieved (for women, the rate was 53 percent). On an entirely different topic, it should be noted that the process of finalizing the second block of the PDDE is progressing steadily. This block involves the secondary level—middle and high school—and vocational, and technical education. The diagnosis, the education policy statement (strategic orientations), the outline of the logframe, and the MTEF have already been finalized.
In the area of access to safe drinking water, in 2005 the government continued the
process of implementing various programs corresponding to the major pillars of its water policy. This resulted in a 57 percent increase in drinking water coverage in rural areas.
In the area of infrastructure, the round table conference of partners in the funding of the
Sectoral Transport Program was held, and, in preparation for hosting the Niger 2005 CJF, a vast program to build and repair the roads in Niamey was completed. In addition, major projects involving the repair of paved roads and the construction of rural roads were undertaken and completed throughout the country.
In 2005, a vast action plan to produce statistics and analyze data on household
living conditions was implemented. The new data should provide a better understanding of the determinants of poverty and make it possible to refine the focus of the PRS. Noteworthy achievements under this plan:
8
- Publication of the data from the third general population and housing census - Launching of a multiple-indicator demographic and health survey (EDS-MICS III) - Analysis of the results of the 1-2-3 Survey’s module on Governance, Democracy, and
the Multiple Dimensions of Poverty - Completion of the Measure of Basic Needs Satisfaction (DSBE) survey - Completion of the participatory survey on poverty - Completion of the Unified Core Welfare Indicators Questionnaire (CWIQ) survey
As for the future, this status report stresses that our country’s efforts should rest on the following seven (7) pillars: 1. Preserving an investor-friendly sociopolitical climate, in order to restore strong,
sustainable economic growth.
2. Lifting the constraints on private-sector dynamism and competitiveness by implementing policies to lower the cost of production factors and promote exports, in order to benefit from international initiatives to assist developing countries.
3. Achieving fiscal consolidation through implementation of the PEMFAR recommendations,
in order to encourage macroeconomic stability and restore the government’s ability to institute public investment policies.
4. Deepening structural reforms through implementation of sectoral policies and
restructuring of the agricultural sectors. 5. Seeking to accelerate regional integration, in order to stimulate community trade. 6. Developing the financial sector, in order to foster the financing of economic growth. 7. Promoting good governance by ensuring transparent management of public resources,
guaranteeing individual and collective freedoms, fighting injustice and impunity, and establishing a transparent political system—the basis of political and social stability.
While not subject to intensive consultation among the participants, this 2005 status report on PRS progress is based on the following three pillars:
I. The impact of the PRS on priority sectoral policies
II. The economic and financial situation and status of sectoral policy and strategy
implementation in 2005
III. The short- and medium-term outlook
9
BOX 1: 2005 STATUS REPORT METHODOLOGY
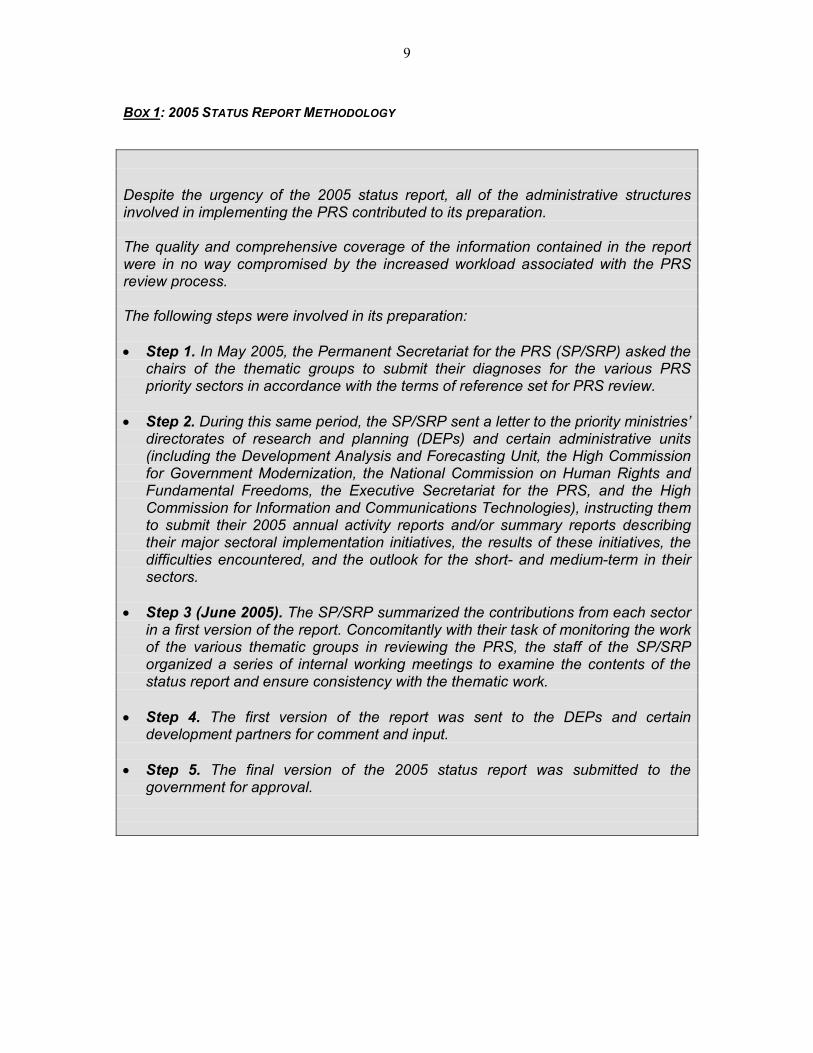
Despite the urgency of the 2005 status report, all of the administrative structures involved in implementing the PRS contributed to its preparation. The quality and comprehensive coverage of the information contained in the report were in no way compromised by the increased workload associated with the PRS review process. The following steps were involved in its preparation: • Step 1. In May 2005, the Permanent Secretariat for the PRS (SP/SRP) asked the
chairs of the thematic groups to submit their diagnoses for the various PRS priority sectors in accordance with the terms of reference set for PRS review.
• Step 2. During this same period, the SP/SRP sent a letter to the priority ministries’
directorates of research and planning (DEPs) and certain administrative units (including the Development Analysis and Forecasting Unit, the High Commission for Government Modernization, the National Commission on Human Rights and Fundamental Freedoms, the Executive Secretariat for the PRS, and the High Commission for Information and Communications Technologies), instructing them to submit their 2005 annual activity reports and/or summary reports describing their major sectoral implementation initiatives, the results of these initiatives, the difficulties encountered, and the outlook for the short- and medium-term in their sectors.
• Step 3 (June 2005). The SP/SRP summarized the contributions from each sector
in a first version of the report. Concomitantly with their task of monitoring the work of the various thematic groups in reviewing the PRS, the staff of the SP/SRP organized a series of internal working meetings to examine the contents of the status report and ensure consistency with the thematic work.
• Step 4. The first version of the report was sent to the DEPs and certain
development partners for comment and input. • Step 5. The final version of the 2005 status report was submitted to the
government for approval.
10
I. IMPACT OF THE PRS ON PRIORITY SECTORAL STRATEGIES
To implement the PRS, the government developed and/or instituted a number of policies, strategies, and programs in the following priority areas: rural development, private-sector revitalization, infrastructure, health, education, living conditions and sanitation, urban development, mining development, microfinance, technical and vocational training, and youth employment. In view of the high concentration of poverty in rural areas (66 percent) and the significant share of the gross domestic product derived from farming, forestry, and animal husbandry (41 percent), the government decided that the rural sector should be the main engine of economic growth. In November 2003, to accelerate growth and improve food security, it adopted a Rural Development Strategy (SDR). Through its fourteen (14) programs, the SDR is intended to achieve the following:
• Foster access to economic opportunities for rural producers • Anticipate risks, improve food security, and provide sustainable development of
natural resources • Build the capacity of rural institutions and organizations
However, given the government’s gradual withdrawal from the business sphere and restriction of the scope of its activities, the private sector has been assigned a leading role in the strategy. With this in mind, the Framework Program to Promote the Private Sector—the key PRS implementation tool—was developed around the following objectives:
• Creating a friendly institutional and legal environment • Strengthening the organizational autonomy of the private sector • Supporting the establishment and development of private enterprises • Training human resources and strengthening managerial and technological capacities • Developing local resources • Promoting the development of opportunities provided by regional integration
To create an economic climate that encourages private investment and the diversification of nonagricultural economic activities, the government has instituted programs for improving the infrastructure. In October 2004 it adopted a National Transport Strategy (SNT) in order to build on the accomplishments of the sectoral policy implemented beginning in 1997. Its goals are as follows:
• Overcoming the country’s geographical barriers, particularly in heavily populated rural areas with economic potential
• Improving urban mobility and developing transport in rural areas • Ensuring the sustainability of sector investments • Improving highway safety
11
To assist these productive sectors and improve living conditions, a Ten-Year Education Development Program (PDDE) and a Health Development Program (PDS) are being implemented. In the education sector, in accordance with the spirit of the World Conference on Education for All (Dakar, 2000) and in keeping with the objectives of the PRS and the Millennium Development Goals (MDGs), in October 2003 the government adopted the PDDE for the 2003-2013 period. The purpose of the PDDE, which is part of the process of implementing the education framework law (1998) and the education policy statement (2001), is to help to reduce poverty by increasing enrollment, reducing illiteracy, and improving the quality of instruction and training. The ministerial structures in charge of education, assisted by the partners, are directly responsible for implementing PDDE activities, which have three (3) main components: access, quality, and institution building. In the health sector, the 2002-2011 Strategic Guidelines for Health Development, adopted in May 2002, set priorities in the following areas: prevention, improving environmental hygiene, increasing the vaccination rate, designing and implementing a plan for combating epidemics, and refocusing investments to improve the country’s health coverage. These orientations laid the foundations for the 2005-2009 Health Development Plan, adopted in February 2005, which is designed to help to reduce maternal, infant, and child mortality by improving the effectiveness and quality of the healthcare system based on current potential. In addition, a number of vertical programs have been implemented to signal the government’s particular attention to the areas of women’s and children’s health, nutrition, family planning, malaria, and AIDS and other sexually transmitted diseases (STDs) They include the National Reproductive Health Program, the National Malaria Program, the Expanded Vaccination Program, the STD/AIDS Program, the National Guinea Worm Eradication Program, and the National Tuberculosis Program.
Additionally, the Special Program of the President of the Republic (PS/PR), funded with HIPC resources, assists all of these priority strategies and policies by building social and productive infrastructure. Its goal is to ensure greater access to basic social services and to establish the conditions for production recovery. Begun in 2001, this initiative should be viewed as an instrument for achieving significant improvement of living conditions in Niger. It is aimed specifically at expanding health coverage, increasing enrollment ratios, and improving production in rural areas. Another goal is to promote economic growth among the poor by increasing women’s earnings and creating jobs for young people through vocational training.
12
II. PROGRESS ON PRS IMPLEMENTATION
Implementation of the priority policies and strategies by the various line ministries has been affected to some extent not only by Niger’s geopolitical environment but also by compliance with the economic and financial program agreed with the Bretton Woods institutions. 2.1. Environment for PRS implementation
International economic trends were positive in 2005, despite an acceleration of inflation due mostly to rising oil prices. The economy also felt the impact of a tightening of U.S. monetary policy and the depreciation of the euro vis-à-vis the major currencies. The world economy grew at a rate of 4.3 percent in 2005, compared to 5.1 percent in 2004. Growth was driven mainly by the United States, China, and to a lesser extent, Japan. In Sub-Saharan Africa, according to the IMF, the growth rate of real GDP slipped from 5.6 percent in 2004 to 5.1 percent in 2005, owing to an economic slowdown in several oil-producing countries. It is expected to rise to 5.3 percent in 2006, but only as a result of the exploitation of new oil deposits in Angola and Mauritania and an increase in Nigerian oil production. In this context of renewed international economic growth, the economies of the African Franc Zone’s member states grew at a steady pace in 2005, although more slowly than in 2004 in the oil-producing countries. While GDP rose 4.0 percent over 2004, Franc Zone economic growth did not keep pace with that of Sub-Saharan Africa (5.1 percent). According to the IMF, GDP growth in the Franc Zone should be 3.5 percent in 2006. However, these overall economic results mask divergent trends among Franc Zone member countries, both between the countries of Central Africa (Central African Economic and Monetary Community, or CAEMC) and those of West Africa (West African Economic and Monetary Union, or WAEMU) and among countries in each of these subregions. Furthermore, trends in the Union of the Comoros were for the most part positive. It is important to note that, in an environment fraught with numerous geopolitical and economic uncertainties, the Franc Zone mechanisms constituted an essential element of cohesion and protection in 2005. The Franc Zone institutions will continue to provide a framework conducive to regional solidarity, economic development, rigorous public financial management, and vigilant monetary policy. In the WAEMU zone, the economic environment in 2005 was marked by socioeconomic unrest in certain countries, higher oil prices, and the restructuring of the cotton industry. The economic performance of member states suffered as a result. Access to debt forgiveness was postponed for several countries (despite an overall improvement in the debt burden in the subregion), deficits and production costs rose, and cotton production declined (down one third in Togo). The year 2005 was also characterized by an acceleration of inflation in the WAEMU zone, coupled with higher food costs due to the drop in grain production in 2004-2005 crop year and the steep rise in oil prices. The inflation rate, measured by changes in the harmonized index of consumer prices (HICP), was 4.5 percent for the WAEMU as a whole, compared to 0.5 percent in 2004. Food prices were responsible for 55 percent of this increase in the price index. The highest inflation rates were observed in Niger (7.8 percent), Togo (6.8 percent), Burkina Faso (6.7 percent), and Mali (6.6 percent). Despite this conjunction of unfavorable factors, which prevented significant progress in the consolidation of macroeconomic stability, the WAEMU zone economy grew at a rate of 3.6 percent in 2005, compared to 3.1 percent in 2004, as a result of favorable climatic conditions, which boosted primary sector production in the Sahel countries. However, with this
13
performance, the economic growth rate remains below the 7 percent required in the long term to bring about a reduction in poverty. In Niger, after economic stagnation (growth rate of minus 0.6 percent) in the wake of the disastrous 2004-2005 crop year, real GDP growth shot up to 7.1 percent in 2005. Following a short rainy season and the locust invasion, the preceding year’s poor harvest had resulted in a 19.0 percent reduction in crop production and a grain harvest shortfall of around 223,000 metric tons. The ensuing food crisis had broad impact, including negative repercussions on preparations for the 2005-2006 crop year. Farmers drew from their seed inventories to supplement inadequate food supplies. Furthermore, the livestock sector, which accounts for 10.0 percent of GDP, suffered from a shortage of pasture as a result of the poor climatic conditions in 2004. However, in 2005 increased rainfall brought about a recovery in agricultural production. As a result, the primary sector would appear to have contributed 1.6 percentage point to GDP growth in 2005, compared to 0.1 percentage point in 2004. Despite the social tensions seen in March and April 2005 and the fire in Niamey’s Katako market, value added by the tertiary sector increased by 6.1 percent and contributed 2.2 percentage points to GDP growth in 2005. The telecommunications subsector appears to be the main force behind the upswing in activities in this sector. Continued construction with a view to the Fifth Francophone Games (CJF) in December 2005 and infrastructure creation (construction of highways, new subsidized water and electric service connections, and rural electrification) in connection with implementation of the HIPC Initiative gave a boost to secondary sector activities. This sector would appear to have contributed 0.8 percentage points to GDP growth in 2005. As a result of the grain shortfall in 2004, several regions of the country experienced a food crisis in 2005. Despite government measures—specifically, the institution of a system for selling grains at moderate prices beginning in late 2004—food prices rose. Another source of rising prices in Niger was the increase in the price of fuel at the pump and its impact on transport costs. At end-November 2005, prices at the pump were up 14.1 percent over the same period of 2004 for regular gasoline, 15.3 percent for diesel, and 77.1 percent for kerosene. The sugar shortage in June and July 2005 also affected price trends. At the political level, dialogue within the National Council for Political Dialogue (CNDP) and the National Council of Private Investors (CNIP), as well as the mediations of the National Commission for Social Dialogue (CNDS) continued throughout the year. The primary goal was to improve communications and the rules for transparency with respect to the government, the private sector and social partners in civil society—the basis for a better socioeconomic climate. In the area of PRS oversight, the following actions are noteworthy: - The legal provisions governing the institutional framework for the PRS were brought up to
date through the adoption of Decree No. 2005-25/PM of October 4, 2005, which makes provision for the new decentralized organs.
- Steps were taken to energize the organs of the institutional framework for the PRS. In
particular, the National PRS Steering Committee, chaired by the Prime Minister, met in December to launch the PRS review process. The Committee on Consensus and Dialogue also met under the aegis of the Minister for Land and Community Development.
14
2.2. The macroeconomic and financial situation
Niger’s economic and financial situation was affected by a number of factors in 2005: the food crisis caused by the poor 2004-2005 harvest, higher oil prices, scaling up of preparations for the CJF, repeated closures of borders with certain countries, and demonstrations against the tax provisions in the first budget law. However, because the 2005-2006 harvest was satisfactory, it was possible to achieve a higher rate of economic growth. 2.2.1. Economic growth and inflation
Owing to the good crop year, the economy experienced an estimated growth rate of 7.1 percent in 2005, compared to minus 0.6 percent in 2004. Agricultural production saw an increase of 20.2 percent. This improvement was due mainly to rainy-season production—around 65 percent of agricultural production—which appears to have risen 36.6 percent. In contrast, the secondary sector grew at a rate of 4.5 percent, compared to 4.3 percent in 2004, as a result of activity in the electricity and natural gas sector (construction, production, and distribution). The tertiary sector experienced an increase of only 3.5 percent in 2005, compared to 6.0 percent in 2004. This deceleration was seen across the entire sector with the exception of communications-related activities, which performed well, with an increase of 22.6 percent compared to 21.4 percent in 2004. Overall, the primary sector (31.1 percent of GDP), the secondary sector (13.8 percent of GDP), and the tertiary sector (47.1 percent) are reported to have contributed 3 percent, 0.6 percent, and 1.7 percent, respectively, to the growth of the economy. With respect to demand, household final consumption appears to have dropped 1.3 percent in 2005 owing to the agricultural shortfall in 2004 and the resulting food crisis. In nominal terms, the gross domestic savings rate was around 8 percent in 2005, compared to 3.5 percent in 2004. At the same time, the investment rate was 19 percent in 2005, compared to 14.7 percent in 2004. The share of total investment funded by gross saving rose from 40.6 percent in 2004 to 47.4 percent in 2005. The general consumer price level, as measured by the HICP, rose an average of 7.8 percent in 2005 compared to 0.2 percent in 2004. Year on year, the inflation rate climbed from 4.7 percent in January to 13.4 percent in August before falling to 4.2 percent in December 2005. This spike in inflation was essentially due to a rise of 15.3 percent in food prices and 4.6 percent in transport and fuel costs. 2.2.2. Public finance
a. Fiscal revenue
At December 31, 2005, fiscal revenue totaled CFAF 189 billion, compared to CFAF 172.8 billion in 2004, or an increase of 10 percent. This increase is explained by improved collection of both tax revenue—up 8.2 percent—and nontax revenue—more than double its 2004 level. The tax ratio, which was 11.4 percent in 2004, stood at 10.6 percent in 2005. This was slightly higher than the 2002 level but lower than the WAEMU community norm.
15
Table 1: Changes in Key Revenue Items (CFAF billions) 2000 2001 2002 2003 2004 2005 Total revenue 110.
1 132.
8 160.9 156.7 172.8 189.0
Tax receipts 102.7
125.5
144.6 152.1 167.6 181.3
Taxes on foreign trade 58.5 64.8 82.9 79.9 83.2 93.9 Taxes on goods and services
21.9 30.9 30.6 34.1 40.9 46.4
Income tax and profit tax 17.1 22.6 23.1 28.3 31.4 31.4 Other tax receipts 5.3 7.2 7.9 9.8 12.1 9.6 Nontax receipts 3.9 4.1 3.8 1.2 1.4 4.9 Specific budgets + special accounts
7.4 3.2 4.1 3.4 3.9 2.8
Revenue from settlement of reciprocal debts
0.0 8.3 0.0 0.9 0.0
Source: CCE/DGE/ME/F b. Expenditure
Total expenditure and net lending rose from CFAF 214.2 billion in 2000 to CFAF 319.8 billion in 2005, or an average increase of 8.5 percent. Efforts to mobilize tax revenue and to adopt a fairly cautious expenditure policy made it possible to keep budget balances at sustainable levels. The basic fiscal balance stood at minus CFAF 23 billion, or minus 1.3 percent of GDP in 2005 (compared to minus CFAF 32.1 billion, or minus 2.2 percent of GDP, in 2004). The overall balance improved, from minus 9.6 percent of GDP in 2004 to minus 7.6 percent of GDP in 2005.
16
Table 2: Changes in Key Expenditure Items (CFAF billions)
Specific budgets/special accounts 5.3 10.3 8.1 8.6 9.8 7.3 Capital expenditure and net loans
70.5 88.1 116.3 115.5 145 155
Capital expenditure 73.6 89.0 116.6 115.5 144 155 - From budget
resources 8.1 25.1 27.1 28.5 34 47.1
- From external resources
65.5 63.9 89.4 87.0 22.3 30.5
Of which: HIPC resources 0.0 7.9 9.8 12.0 17 22.3 Net lending -3.1 -0.8 -0.2 0.0 0.8 -0.2
Source: CCE/DGE/ ME/F Domestic arrears were reduced to CFAF 12.4 billion in 2005, compared to CFAF 19.3 billion in 2004.
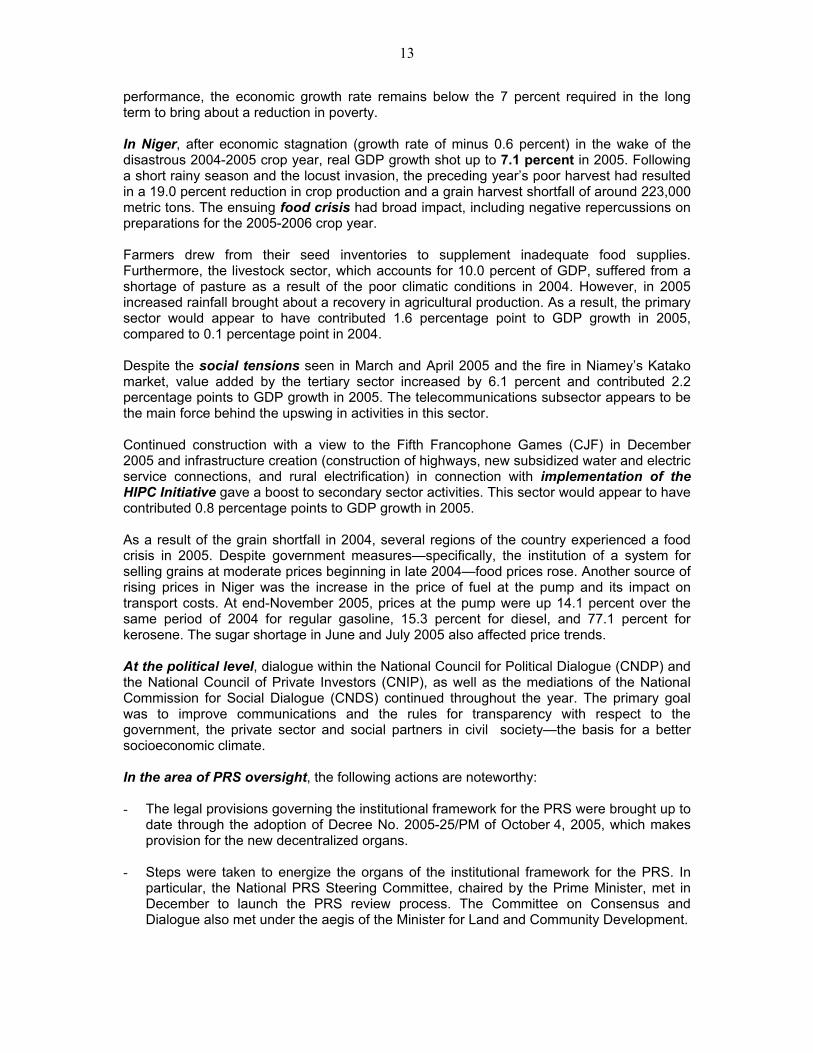
• Structure of public expenditure The share of the budget allocated to the priority sectors rose from 49.07 percent to 51 percent. Education, health, and rural development received, respectively, 18 percent, 7 percent, and 17 percent of total appropriations in 2005. Overall, the rate of public expenditure execution was 51 percent in 2005, compared to 76 percent in 2004. This level is explained by cash-flow constraints. However, by exercising budgetary control, it was possible to safeguard expenditure in the priority sectors. For the education, health, and rural sectors, the rate of consumption of appropriations was 72 percent, 65 percent, and 37 percent, respectively.
17
Chart 1. Changes in the Rate of Execution of the Key Components of Expenditure (2003-2005).
0
20
40
60
80
100
Rat
e of
exe
cutio
n
2003 2004 2005
Year
Education
Health
Rural sector
Infrastructure/transport
Other
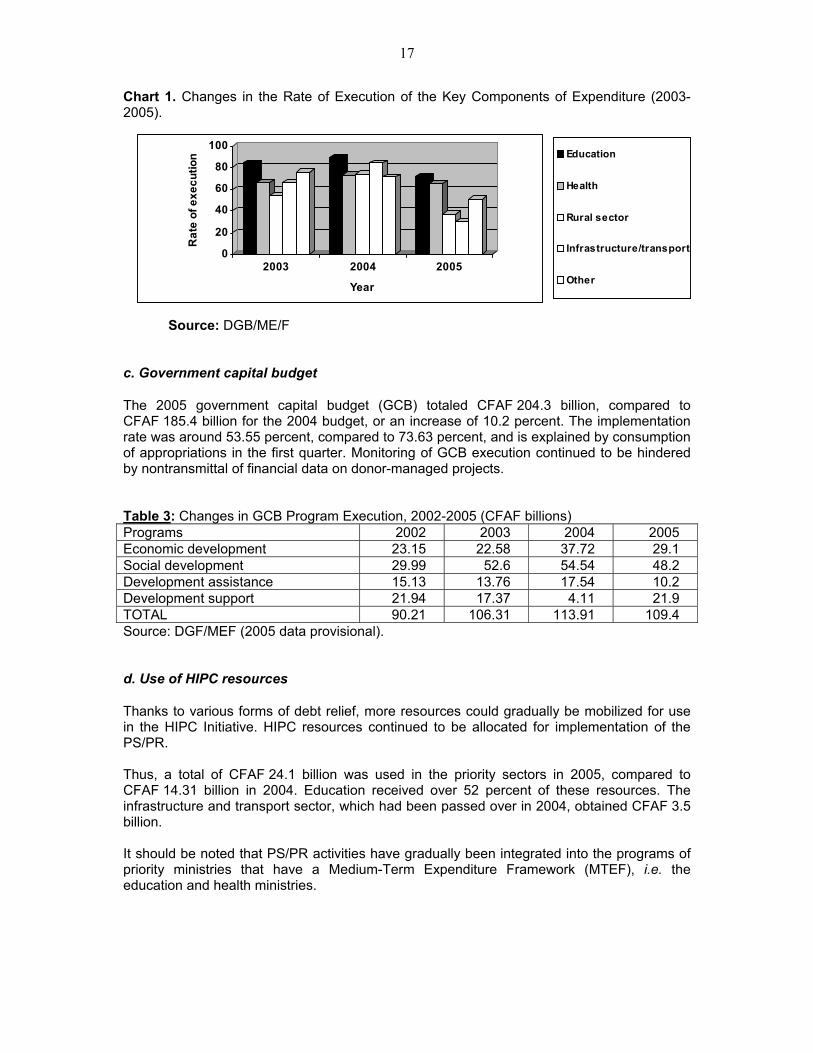
Source: DGB/ME/F c. Government capital budget
The 2005 government capital budget (GCB) totaled CFAF 204.3 billion, compared to CFAF 185.4 billion for the 2004 budget, or an increase of 10.2 percent. The implementation rate was around 53.55 percent, compared to 73.63 percent, and is explained by consumption of appropriations in the first quarter. Monitoring of GCB execution continued to be hindered by nontransmittal of financial data on donor-managed projects. Table 3: Changes in GCB Program Execution, 2002-2005 (CFAF billions) Programs 2002 2003 2004 2005 Economic development 23.15 22.58 37.72 29.1 Social development 29.99 52.6 54.54 48.2 Development assistance 15.13 13.76 17.54 10.2 Development support 21.94 17.37 4.11 21.9 TOTAL 90.21 106.31 113.91 109.4 Source: DGF/MEF (2005 data provisional). d. Use of HIPC resources
Thanks to various forms of debt relief, more resources could gradually be mobilized for use in the HIPC Initiative. HIPC resources continued to be allocated for implementation of the PS/PR. Thus, a total of CFAF 24.1 billion was used in the priority sectors in 2005, compared to CFAF 14.31 billion in 2004. Education received over 52 percent of these resources. The infrastructure and transport sector, which had been passed over in 2004, obtained CFAF 3.5 billion. It should be noted that PS/PR activities have gradually been integrated into the programs of priority ministries that have a Medium-Term Expenditure Framework (MTEF), i.e. the education and health ministries.
18
Table 4: Use of HIPC Loans in the Priority Sectors (CFAF billions)
Total 14.06 10.75 17.65 12.14 25.81 14.31 38.13 24.41
Source: ME/F (DGB), data at May 2, 2006 e. External and domestic debt
The debt stock at December 31, 2005 was estimated at CFAF 965.95 billion, compared to CFAF 888 billion in 2004. Debt service costs fell from CFAF 43.52 billion in 2004 to an estimated CFAF 39.39 billion in 2005. This decrease is explained by the attainment of the completion point of the HIPC Initiative, which permitted cancellation of debt owed to Paris Club creditors in April 2004; by a decrease in the debt owed to the IMF (CFAF 65.9 billion), and by the G8’s decision to cancel the multilateral debt. The World Bank and the African Development Bank (AfDB) Group are expected to cancel additional debts in July 2006. The external debt stock was estimated at CFAF 172,126,000,000 in 2005, compared to CFAF 207,652,000,000. Paid arrears totaled CFAF 35,526,000,000, compared to CFAF 22,540,000,000 in 2004. The structure of the domestic debt shows a predominance of commercial arrears. Table 5: Changes in the External Debt Stock and External Debt Service (CFAF billions)
Partners
2002
2003
2004
2005
DEBT STOCK Of which: 1103.01 100% 978.14 100% 888.0
In 2005, exports were estimated at CFAF 168.1 billion, compared to CFAF 135.2 billion the previous year, or an increase of 24 percent. Imports fell 15 percent below their 2004 level to CFAF 287.4 billion. The trade deficit stood at CFAF 119.3 billion, compared to CFAF 203.5 billion in 2004. The balance of payments showed a surplus of CFAF 11.8 billion in 2005, compared to a deficit of CFAF 10.3 billion in 2004. The current account balance stood at minus CFAF 130 billion, which represents a decline of CFAF 8.0 billion from its 2004 level. b. Monetary situation
With respect to the monetary institutions, 2005 estimates indicated an improvement in net foreign assets and an expansion of both domestic credit and the money supply. The net foreign assets of the banking system were CFAF 60.4 billion in 2004. In 2005, they totaled CFAF 71.9 billion, owing to an increase in the net foreign assets of the Central Bank of West African States (BCEAO) and to the deterioration of the international investment position of banks. The domestic credit stock grew by CFAF 5.4 billion over the period under review, reaching CFAF 191.8 billion at end-2005. This was related to an expansion of credit to the economy, attenuated by an improvement in the net government position (NGP), which went from CFAF 85.3 billion at December 31, 2004 to CFAF 70.5 billion at December 31, 2005, essentially owing to the mobilization of financial assistance and to proceeds from the issue of treasury bills. Currency in circulation accounted for most of the CFA 15.3 billion expansion in the money supply over the period. 2.2.4. Implementation of reforms
The government continued its ongoing reforms during the period under review. In the area of public finance, the PEMFAR action plan adopted in 2004 constituted the principal frame of reference. The following tasks were accomplished in 2005: - Preparation of MTEFs in the priority sectors. - Preparation, for the 2006 budget law, of a macroeconomic framework report consistent
with PRS priorities. - Establishment of an interface between the Treasury and the General Budget Directorate
(DGB). - Computerization of five (5) regional payment offices. - Preparation of the Treasury balance sheet at December 31, 1996. - Integration of HIPC resource expenditure into the budgets of the sectoral ministries. - Integration of external resource expenditure for fiscal 2003 and, to a considerable extent,
for fiscal 2004 and 2005. In the area of financial sector reform, progress was made with Crédit du Niger (CDN) and the National Post and Savings Office (ONPE). With respect to the privatization of CDN, the following actions were taken with the assistance of the Financial Sector Development Program (PDSF): - Preparation of financial statements to determine the bank’s net worth.
20
- Preparation of a report on converting CDN into a housing bank in the context of its privatization.
With respect to the ONPE, the restructuring process resulted in the following actions: - Payment of severance pay to 294 employees at a total cost of CFAF 2,306,000,000. - Creation of “Niger-Poste” by means of No. Law 2005-21 of June 28, 2005 authorizing the
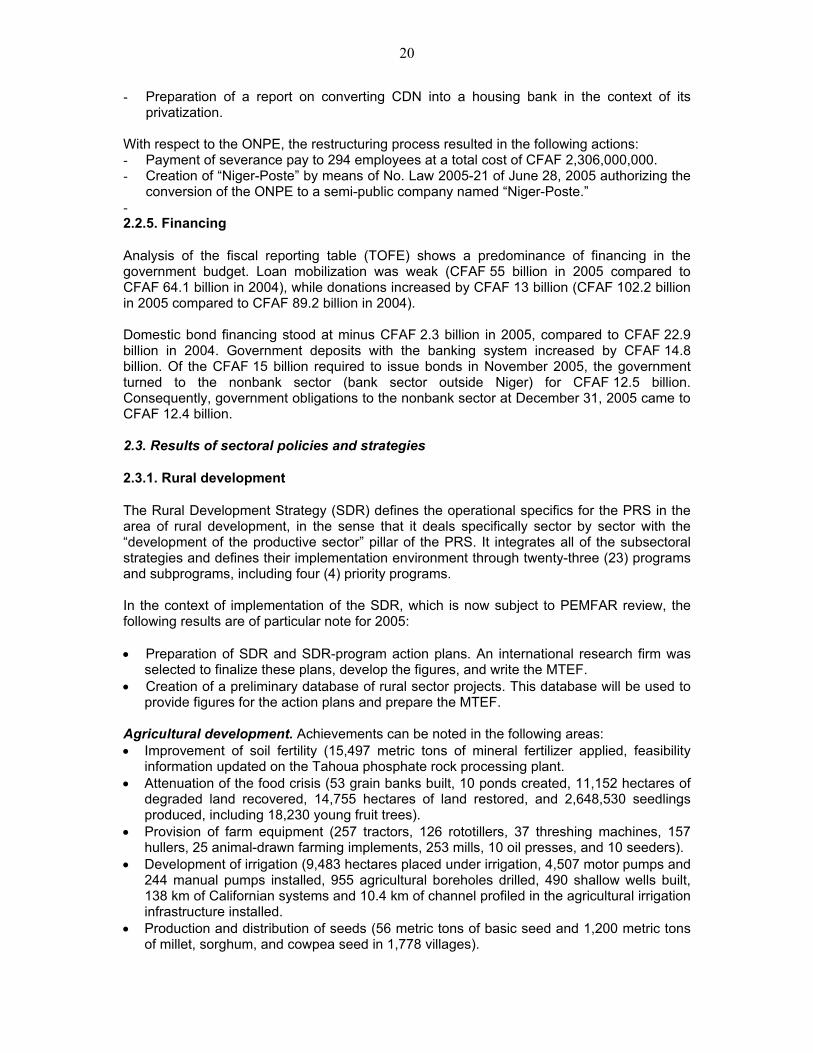
conversion of the ONPE to a semi-public company named “Niger-Poste.” - 2.2.5. Financing
Analysis of the fiscal reporting table (TOFE) shows a predominance of financing in the government budget. Loan mobilization was weak (CFAF 55 billion in 2005 compared to CFAF 64.1 billion in 2004), while donations increased by CFAF 13 billion (CFAF 102.2 billion in 2005 compared to CFAF 89.2 billion in 2004). Domestic bond financing stood at minus CFAF 2.3 billion in 2005, compared to CFAF 22.9 billion in 2004. Government deposits with the banking system increased by CFAF 14.8 billion. Of the CFAF 15 billion required to issue bonds in November 2005, the government turned to the nonbank sector (bank sector outside Niger) for CFAF 12.5 billion. Consequently, government obligations to the nonbank sector at December 31, 2005 came to CFAF 12.4 billion. 2.3. Results of sectoral policies and strategies
2.3.1. Rural development
The Rural Development Strategy (SDR) defines the operational specifics for the PRS in the area of rural development, in the sense that it deals specifically sector by sector with the “development of the productive sector” pillar of the PRS. It integrates all of the subsectoral strategies and defines their implementation environment through twenty-three (23) programs and subprograms, including four (4) priority programs. In the context of implementation of the SDR, which is now subject to PEMFAR review, the following results are of particular note for 2005: • Preparation of SDR and SDR-program action plans. An international research firm was
selected to finalize these plans, develop the figures, and write the MTEF. • Creation of a preliminary database of rural sector projects. This database will be used to
provide figures for the action plans and prepare the MTEF. Agricultural development. Achievements can be noted in the following areas: • Improvement of soil fertility (15,497 metric tons of mineral fertilizer applied, feasibility
information updated on the Tahoua phosphate rock processing plant. • Attenuation of the food crisis (53 grain banks built, 10 ponds created, 11,152 hectares of
degraded land recovered, 14,755 hectares of land restored, and 2,648,530 seedlings produced, including 18,230 young fruit trees).
• Development of irrigation (9,483 hectares placed under irrigation, 4,507 motor pumps and 244 manual pumps installed, 955 agricultural boreholes drilled, 490 shallow wells built, 138 km of Californian systems and 10.4 km of channel profiled in the agricultural irrigation infrastructure installed.
• Production and distribution of seeds (56 metric tons of basic seed and 1,200 metric tons of millet, sorghum, and cowpea seed in 1,778 villages).
21
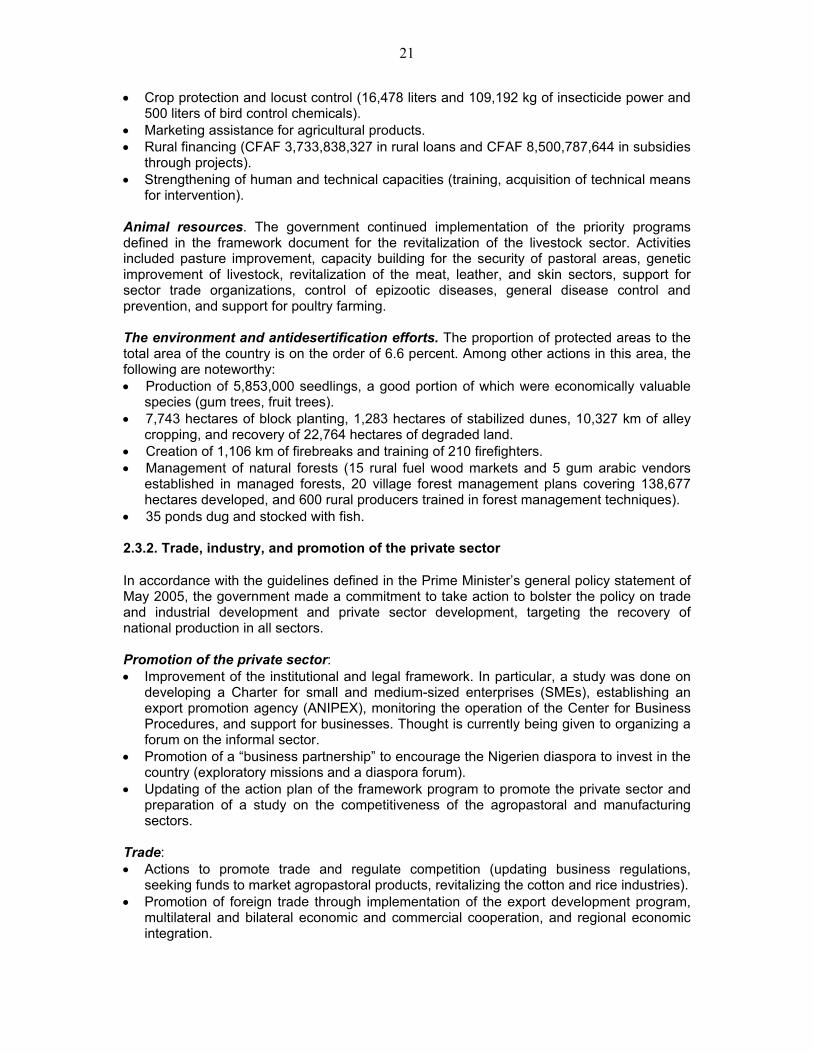
• Crop protection and locust control (16,478 liters and 109,192 kg of insecticide power and 500 liters of bird control chemicals).
• Marketing assistance for agricultural products. • Rural financing (CFAF 3,733,838,327 in rural loans and CFAF 8,500,787,644 in subsidies
through projects). • Strengthening of human and technical capacities (training, acquisition of technical means
for intervention). Animal resources. The government continued implementation of the priority programs defined in the framework document for the revitalization of the livestock sector. Activities included pasture improvement, capacity building for the security of pastoral areas, genetic improvement of livestock, revitalization of the meat, leather, and skin sectors, support for sector trade organizations, control of epizootic diseases, general disease control and prevention, and support for poultry farming. The environment and antidesertification efforts. The proportion of protected areas to the total area of the country is on the order of 6.6 percent. Among other actions in this area, the following are noteworthy: • Production of 5,853,000 seedlings, a good portion of which were economically valuable
species (gum trees, fruit trees). • 7,743 hectares of block planting, 1,283 hectares of stabilized dunes, 10,327 km of alley
cropping, and recovery of 22,764 hectares of degraded land. • Creation of 1,106 km of firebreaks and training of 210 firefighters. • Management of natural forests (15 rural fuel wood markets and 5 gum arabic vendors
established in managed forests, 20 village forest management plans covering 138,677 hectares developed, and 600 rural producers trained in forest management techniques).
• 35 ponds dug and stocked with fish.
2.3.2. Trade, industry, and promotion of the private sector
In accordance with the guidelines defined in the Prime Minister’s general policy statement of May 2005, the government made a commitment to take action to bolster the policy on trade and industrial development and private sector development, targeting the recovery of national production in all sectors. Promotion of the private sector: • Improvement of the institutional and legal framework. In particular, a study was done on
developing a Charter for small and medium-sized enterprises (SMEs), establishing an export promotion agency (ANIPEX), monitoring the operation of the Center for Business Procedures, and support for businesses. Thought is currently being given to organizing a forum on the informal sector.
• Promotion of a “business partnership” to encourage the Nigerien diaspora to invest in the country (exploratory missions and a diaspora forum).
• Updating of the action plan of the framework program to promote the private sector and preparation of a study on the competitiveness of the agropastoral and manufacturing sectors.
Trade: • Actions to promote trade and regulate competition (updating business regulations,
seeking funds to market agropastoral products, revitalizing the cotton and rice industries). • Promotion of foreign trade through implementation of the export development program,
multilateral and bilateral economic and commercial cooperation, and regional economic integration.
22
Standardization, quality, and metrology. Major initiatives involved preparation and dissemination of publications on standards by the standardization bodies; updating of the legal texts governing metrology and drafting of a bill; inspection of the measuring instruments used in commercial transactions, and institution of a Nigerien quality award. Industrial development. Activities included the oversight of industrial units and regulation of enterprises approved under the investment code, the holding of a forum on revitalizing the manufacturing sector in the Maradi region, and the promotion of copyright law. On an entirely different topic, restructuring and privatizing of enterprises continued under the tutelage of the trade ministry: • OPVN (Niger Office for Food Products): Initial assessment of the new, restructured
• SONIDEP (Nigerien Petroleum Products Company): Privatization process underway, capital subscription for the new company.
• RINI (Niger Rice): Elimination of 31 positions. In addition, in the context of implementation of the Rural Development Strategy (SDR), the ministry developed the action plan and logframe, for which the figures are still being prepared. There were also noteworthy developments with respect to effective implementation of the ministry’s program to combat STDs/HIV/AIDS: the training of peer educators, merchants, and managers in five regions (Maradi, Diffa, Agadez, Tahoua, and Zinder), as well as information meetings at the seven large markets in the capital. 2.3.3. Craft, tourism, and hotel industries
The craft industry plays an important role in Niger as a creator of wealth and employment. However, because reliable, detailed statistics are lacking, it is difficult to evaluate its contribution to the economy. But while different sources may advance different figures, they all acknowledge the steady, sustainable growth of this sector. The following aspects are of note: • The industry is a major source of employment. There are around 367,000 craft
microenterprises involved in more than 115 activities and employing over 600,000 people. (RGP/H 2001)
• A total of CFAF 2,031,741,018 was invested in infrastructure in 2005 to develop the sector’s contribution to the creation of national wealth.
• Sales by entities under the Program to Develop Niger’s Craft Industry (DANI) totaled CFAF 1,186,698,533 in 2005 (compared to CFAF 895,746,532 in 2004) and were essentially of arts and crafts made by the 3,000 artisans assisted by the DANI Program.
• Phasing in of standards in 2005, specifically standards for dried, seasoned meat (kilichi). Evaluation of implementation of the National Policy on Development of the Craft Industry in 2005 showed strong progress in complying with its provisions and goals, particularly in the areas of training, technology transfer, financing, marketing, and organization of artisans. The capacity of the tourism/hotel industry to create jobs, generate income at the community level, and yield foreign exchange makes it important in leveraging economic growth and, therefore, poverty reduction. In preparation for the Niger 2005 CJF, many of the capital’s economic operators received government loans to start, renovate, and expand their operations. Sector business owners invested approximately CFAF 7 billion to increase tourism capacity, as follows:
23
• Renovation: CFAF 2,879,395,623 • Additional tourist capacity: CFAF 3,152,313,176 • Renewal of travel agency auto fleets: CFAF 901,845,000.17 [sic] • Restaurant equipment: CFAF 127,600 As a result of this investment, Niger now has: • 108 travel agencies, of which more than 95 percent are concentrated in Niamey and
Agadez • 76 hotels, of which 8 are four-star • Hotel capacity of 1,873 rooms for a total of 3,285 beds In addition, 7,607 people were employed in the industry (compared to 6,615 in 2004). Tourist arrivals numbered 57,624 in 2005 (compared to 53,729 in 2004), resulting in 140,000 overnight stays (compared to 124,246 in 2004). Tourism revenue was estimated at around CFAF 29,975,000,000 in 2005 (compared to CFAF 27,577,000,000 in 2004). 2.3.4. Mining and energy
In the area of mining, the major activities in 2005 involved diversifying mining production, maintaining the competitiveness of current production units, and strengthening the legal and institutional framework. The following results were achieved: • Completion of 498,128.52 km (of a total 551,674 km) of airborne geophysical surveys of
Aïr, Damagaram Mounio, and South Maradi in the context of the Niger Program to Strengthen and Diversify the Mining Industry (PRDRM). (SYSMIN, 8th EDF)
• Production of 2,961 kg of gold by the Société des Mines du Liptako (Liptako Mining Company).
• Low technology production of 1,961 kg of gold (compared to 921 kg in 2004 and only 34 kg in 2003).
• Achievement of economies of production and production gains through the development of synergies between SOMAÏR (Aïr Mining Company) and COMINAK (Akouta Mining Company), reduction of the healthcare costs of the affected populations, and reduction of the debt service of SONICHAR (Nigerien Coal Company). This made it possible to bring the cost of producing uranium down to a level compatible with the world market, thereby improving the competitiveness of these companies.
• Approval of Niger’s radioactive waste management plan for 2005-2006 by the International Atomic Energy Agency (IAEA).
• Preparation of the Mining Development Strategy. In the area of energy, the major activities involved improving the electrification coverage rate and access rate, decreasing fuel wood consumption, and strengthening the legal and institutional framework. The following results were achieved: • Electrification of 65 new localities under the PS/PR, bringing the coverage of localities to
around 2 percent. • Raising the electricity access rate to 8.1 percent (compared to 6.8 percent in 2004). • Signing of a cooperation agreement with ADEME (Energy Development and
Management Agency) for assistance in preparing proposals to submit to the European Union’s Energy Facility initiative to combat poverty.
• Holding of a national workshop on improving the National Rural Electrification Strategy paper and action plan.
24
• Validation of the diagnostic report prepared for the study on the National Domestic Fuel Strategy.
• Promotion and popularization of the use of coal by the SNCC (National Coking Company).
• Completion of energy assessments for 2000 to 2004. • Approval of the oil exploration agreement in connection with the Kafra permit awarded to
Algeria’s SONATRACH (National Company for Hydrocarbon Research, Production, Transport, Transformation, and Marketing).
• Creation of a working group to head up the establishment of an energy management office.
2.3.5. Transport, roads, and infrastructure
In accordance with the guidelines of the President’s program statement in January 2005, the Prime Minister’s general policy statement in May 2005, and the directives contained in the letters of assigning missions to each ministerial department, the transport, highways, and infrastructure sectors each prepared specific action plans for contributing to poverty reduction. Implementation of these plans was satisfactory, thanks to the efforts of the government, the support of the development partners, and the active participation of private sector professionals. In the area of transport (land, sea, river, and air transport), the following achievements are of particular note: • Continued modernization of interurban passenger transport with the establishment of
regular service between the major urban centers. Two (2) new companies, Africa Express and Frontières Africaines de Transport, set up for business and, together with the five (5) existing companies, were providing regular service between Niger and the capitals of certain neighboring countries using new buses that were both safer and more comfortable.
• Adoption of legal texts establishing a Freight Exchange and the associated management structures.
• Reform of the system for training and testing driver’s license applicants. • Holding of a round table conference of donors to the Sectoral Transport Program (based
on the National Transport Strategy). • Improvement of air service by licensing new companies and increasing flight frequencies
in the first half of 2005 (Toumaï Air Chad, Air Senegal International, Air Algerie, Royal Air Maroc, GO Voyages’ Charter Horizon, Point Afrique (charters), United Arab Emirates Airline).
• Extension of Diori Hamani International Airport’s operating capacity (including roadway improvement, installation of a secondary surveillance radar, purchase of three passenger transport buses, review and extension of lighting, construction of 1.5 kilometers of fencing, and cosmetic improvements).
Aside from that, the transport minister oversaw the following activities in the context of developing meteorological services: • Repair and improvement of meteorological observation networks through the acquisition
of measurement equipment and equipment for the transmission of meteorological observations.
• Technical training of employees. • Acquisition of equipment for processing, broadcasting, and archiving data. • Improvement of capabilities for preparing and broadcasting weather predictions to ensure
the safety of people and property, environmental protection, and food security.
25
With respect to roads, the goal of having “a well-maintained highways network providing the level of service expected by its users” has become a key factor in the National Transport Strategy and the PRS. For this reason, the infrastructure ministry implemented a 2005-2006 priority action program to facilitate the elimination of geographical barriers both within the country and to the outside world as the best way of promoting achievement of the MDGs. Given that the highways network is recognized as one of the more important infrastructure in the public trust, the infrastructure ministry took steps in 2005 towards fiscal consolidation and safeguarding the nation’s roads. It also reorganized the Autonomous Road Maintenance Financing Fund (CAFER) in order to improve the nation’s roads and lessen the impact of maintenance delays on the Niger economy and the users. In addition, in preparation for hosting the Niger 2005 CJF, a vast program to build and repair roads in Niamey was completed. Major projects involving the repair of paved roads and the construction of rural roads were also undertaken and completed throughout the country. Studies in the context of the vast 9th European Development Fund (EDF) program and the second AfDB road maintenance project were finalized. The studies in connection with International Development Bank (IDB) financing (a portion of Unity Road) and Nigerian cooperative assistance (Maïné Soroa/Gaïdam, Diffa/Damassak, and Matamèye/Takiéta roads) were completely finished. Those for the Téra/Dori road and the Arlit/Assamaka section had yet to be finalized. With respect to the Sectoral Transport Program, in which the infrastructure ministry is an active participant, the round table conference held to fund it in June 2005 brought funding pledges totaling approximately CFAF 250 billion, including the funds committed by Niger. Table 6: 2005 Road Work
Improvement and paving • 104.68 km Repair • Paved roads • Urban road network
• 216 km • 57.3 km
Road construction • 40 km Rural roads • Construction projects • Repair projects
• 210 km • 594 km
Bridge construction • 150 Ml Regular road maintenance Highway network Paved roads Modern dirt roads Basic dirt roads Dirt tracks
18.843 km 3.797 km 2,551.4 km 3.748 km 8.346 km
NIP – 9th EDF (draft study) • 517.3 km Periodic RTA maintenance • 138 km Source: DEP/MEQ In addition, in order to improve public expenditure management and the budget management process, the infrastructure ministry initiated the multiyear exercise of preparing public expenditure reviews and MTEFs. This also allowed it to participate in the joint annual review conducted by the World Bank, the European Union, and the AfDB.
26
2.3.6. Information and communication technologies (ICTs)
In 2005, ICT development activities mainly involved implementation of Niger’s National Information and Communications Infrastructure (NICI) Plan, administration of the Internet network in the Office of the Prime Minister with the goal of gradually setting up a government intranet, and capacity building. Accomplishments in these areas are as follows: • Validation of the implementation scheme for the Niger NICI Plan. • Creation and formation of ICT networks (legislative, media, gender-based, private-sector,
NGO, youth). • Feasibility study on interconnecting ministries to implement a government intranet. • Establishment of a steering committee to harmonize the legal and institutional ICT
framework. • Stabilization and extension of the Internet network in the Office of the Prime Minister
(implementation of a high-speed (2 Mbps) connection). • Institutional and technical support for administrative structures (secure smart ID card
project, intranet, and master plan).
2.3.7. Health
Improvement of the peoples’ health is a constant concern for the authorities of the Fifth Republic, as evidenced by the priority accorded the sector in both the PRS (February 2002) and the 2005-2009 Health Development Plan (February 2005). In addition, both the Prime Minister’s General Policy Statement (May 2005) and the mission letter to the minister in charge of the sector cited improvement of the health system as a central component, particularly to help reduce maternal and infant mortality rate by improving the efficiency and quality of health care. Efforts deployed in 2005 through the government budget, the Special Program of the President of the Republic (PS/PR), the development partners and the private sector to implement the health policy served to consolidate previous results achieved in the sector. These include: • Efforts aimed at increasing the population’s access to quality services and care.
- Extension of health coverage (currently 65 percent) through the construction of
infrastructure, conversion of rural health stations (“cases de santé”) into Type I CSIs and the procurement of equipment.
- Increased use of health services through infrastructure rehabilitation work (Type II
CSIs), the procurement of specialized equipment (scanners, automated biochemical laboratory, CD4 meter), the training of specialists and the provision of free health care financed by the PS/PR (14,450 persons examined and treated, 1,225 of them for cataracts and 2153 for general surgery).
- The adoption of a decree making caesarean sections available free of charge in
Niger. • Efforts to intensify reproductive health activities, particularly family-planning awareness
campaigns, training and operational research. • Actions to further the decentralization of the health system (regional action plans and
decentralization of financial resources).
27
• Actions to increase community participation (raising awareness of cost recovery, training of CSI health and management committees).
• Actions to promote strategic capacity-building for the sector (adoption of the 2005-2009
Health Development Plan, ministerial reorganization, MTEF). • Actions to alleviate the shortage of qualified personnel, including:
- The recruitment of 225 physicians (10 specialists and 215 general practitioners, the latter figure including 7 pharmacists and 2 oral surgeons).
- The recruitment of 27 medical technicians (7 anesthesiology assistants, 8 x-ray
technicians, 5 microbiologists and 7 OB/GYN surgeons).
- The hiring of 483 health professionals as civil servants (32 physicians, 3 pharmacists, 183 nurses, 83 midwives, 38 laboratory technicians, 15 hygiene/sanitation specialists and 129 certified nurses).
• Actions to increase the effectiveness and efficiency of infrastructure and physical resources management (maintenance policy, architectural plan and master plan for CSIs and district hospitals, logistics training, etc.).
• Actions to improve the management and availability of medications and consumables in
healthcare training programs (national pharmaceutical master plan, promotion of pharmacies, improvement in the importing and distribution system, etc.).
• Actions to improve the coordination of interventions (tracking-assessment mechanism
for the Health Development Plan, implementation manual, establishment of a partnership framework with the technical and financial partners).
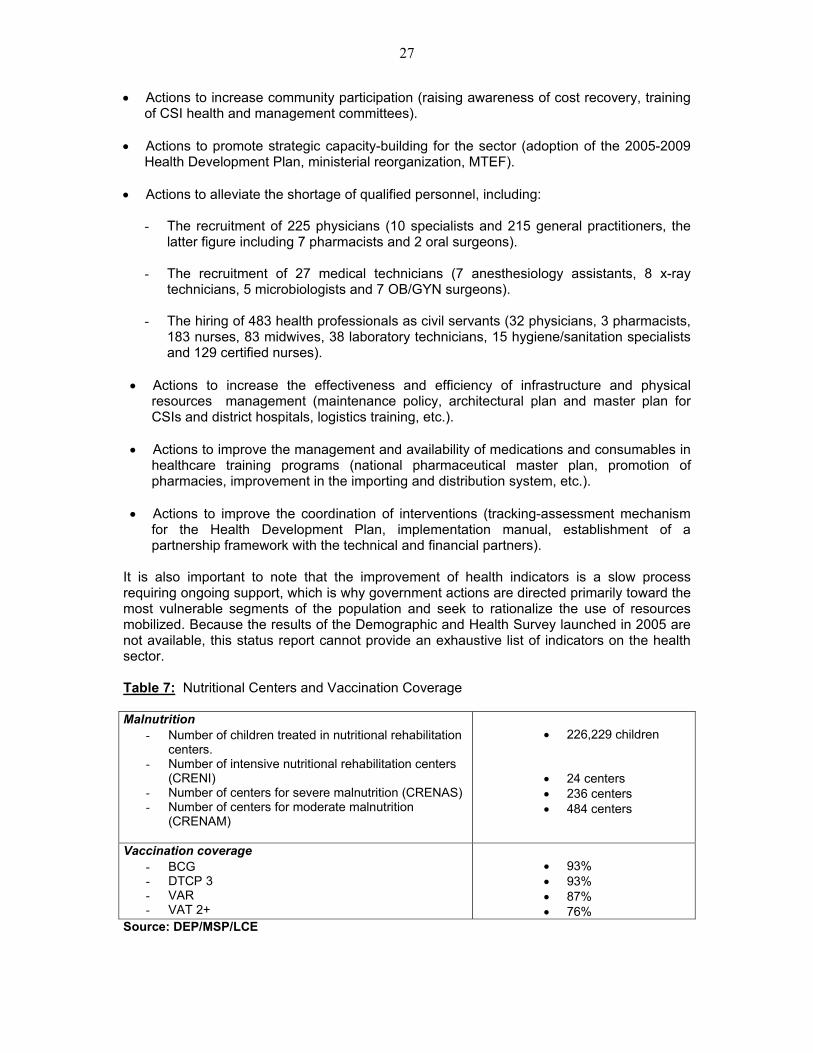
It is also important to note that the improvement of health indicators is a slow process requiring ongoing support, which is why government actions are directed primarily toward the most vulnerable segments of the population and seek to rationalize the use of resources mobilized. Because the results of the Demographic and Health Survey launched in 2005 are not available, this status report cannot provide an exhaustive list of indicators on the health sector. Table 7: Nutritional Centers and Vaccination Coverage Malnutrition
- Number of children treated in nutritional rehabilitation centers.
- Number of intensive nutritional rehabilitation centers (CRENI)
- Number of centers for severe malnutrition (CRENAS) - Number of centers for moderate malnutrition
The imperatives of “making existing structures work” and “implementing a performance-based management approach” require regular, continual inputs of resources; accordingly, efforts to shield funding for the Ministry of Health and activities to combat endemic disease from budget control should be continued and strengthened. 2.3.8. STDs, HIV, AIDS
It should be noted that Niger established an Intersectoral Coordination Office to Combat STDs/HIV/AIDS with the support of its bilateral and multilateral partners. The adoption of a Strategic National Framework emphasizing the multi-sectoral, decentralized nature of the fight against AIDS led to the establishment of the following bodies: • 24 sectoral committees to combat STDs/HIV/AIDS. • 8 anti-STD/HIV/AIDS regional coordination offices. • 1 anti-STD/HIV/AIDS national intersectoral coordination office. In addition, the highly participative approach to preparing a strategic plan to combat STDs/HIV/AIDS has made the following policy documents available: • Access to anti-retroviral (ARV) treatments. • Combating AIDS in mobile populations (migrants, sex workers, truck drivers, military
personnel, etc.). • Strategy for prevention of HIV transmission from mother to child. • Standards and directives on voluntary HIV counseling and screening.. • Guide and training manual on voluntary, confidential counseling and screening. Noteworthy with regard to the “capacity-building,” “prevention,” and “raising awareness” components are the following: • the training of 30,922 persons, with 876 in the organization component (project
preparation, micro plan, management, tracking-assessment), 24,128 in the prevention component (peer educators, village midwives (matrones), traditional practitioners, awareness campaign) and 5,918 in the counseling and treatment component (counseling, screening, ARV prescriptions, treatment, prevention at the workplace).
• an awareness campaign reaching 1,400,288 persons (youth, women, military personnel, detainees, religious and traditional groups) through 2,415 film screenings and 598 radio broadcasts.
• Counseling and treatment in 60 voluntary counseling and treatment centers and 10 ARV prescriber centers and the monitoring of 1,026 patients.
Socioeconomic support financed for vulnerable groups should also be mentioned, particularly support for 304 orphans and 815 young girls at risk.
2.3.9. Education
The Ten-Year Education Development Program (PDDE) inaugurated in 2003 includes two subprograms corresponding to different levels and types of instruction:
- Preschool and Basic Cycle 1. - Nonformal Education.
The implementation of the PDDE is structured around three principal components:
- An “access” component concerned with improving course offerings and stimulating societal demand for education.
- A “quality” component relating to the improvement and effectiveness of the system and the quality of student learning.
29
- An “institutional development” component which covers all aspects related to planning and resource management.
For purposes of this status report, the analysis of the education sector will address the performance of each of the two subprograms. 2 .3.9.1. Performance Analysis of Preschool and Basic Cycle 1 Education
a. Access and participation The objectives established for preschool development are quite modest in comparison with the needs and the impact of pre-schooling on improved achievement in Basic Cycle 1. The option chosen by the PDDE is the development of public preschools in rural and suburban areas. Despite this fact, only 85 percent of the objectives were achieved. There are no longer significant disparities between boys and girls. On the other hand, this level of schooling remains an essentially urban phenomenon. Table 8: Change in number of pupils and gross preschool enrollment ratio
2003/2004 2004/2005 Estimated Actual Estimated Actual
Total (no. students) 18,000 18,234 23,048 19,597 Girls (% of total) 48.9 49.8 No. students from rural areas (% of total)
12.6 17
No. public school students 12,213 12,479 12,862 12,624 Overall gross enrollment ratio 1.6 1.6 For basic cycle 1, the change in the gross rate of access (GRA) in introductory courses and the gross rate of enrollment (GRE) is as follows: Table 9: Change in GRA and GRE
2003/2004 2004/2005 Boys Girls Total Boys Girls Total
Gross rate of access - Rural - Urban
59.5 53.6 90.2
42.5 35
83.8
51 44.3 87.1
63 - -
46 - -
55.4 48 92
Gross enrollment rate - Rural - Urban
54.2 53.4 55.8
36.5 31.7 49.5
45.4 42.6 52.7
62 - -
43 - -
52 51 57
With respect to admission (GRE), although progress was made, the established objectives were not achieved (55 percent achieved compared to 60 percent planned). The disparities between regions remain quite high (48 percent in rural areas compared to 92 percent in urban areas in 2005). With respect to disparities between boys and girls, there was no significant change over the period. With respect to coverage (GRE), the situation improved although the established objectives were not achieved (52 percent compared to 54 percent expected). The disparities between rural and urban areas declined (from a difference of 10 to 6 points) between 2003 and 2005. However, disparities between boys and girls persist (a difference of approximately 20 points throughout the period).
30
b. Quality In keeping with the objectives to raise the completion rate and reduce the repeater rate, the status of implementation is as follows: Table 10: Primary School Completion and Repeater Rates
2002/2003 2004/2005 INDICATORS Basic Planned Actual
Total 25 40 36 Girls 20 - 28
Completion rate
Rural 18 - 33 % of repeaters 10 9 5 It should be noted with respect to internal system performance that: - the completion rate increased 11 points, from 25 percent to 36 percent. However, the
expected result was not achieved: - the percentage of repeaters in the system declined significantly from 10 percent to 5
percent, whereas the desired objective was 9 percent.
c. Infrastructure program In parallel with the PDDE, the government, in cooperation with its technical and financial partners, implemented an ambitious infrastructure and school equipment program. The implementation status of this program is as follows:
Table 11 : Implementation of the school infrastructure program
Planned Actual % actual Total classrooms 4,966 2,352 47 Metal classrooms 380 180 47 Offices and storerooms 299 99 33 Lavatories 784 561 72 Tables – benches 133,650 60,375 45 Educational sector construction + equipment 113 6 5 In addition, recruiting of teaching and supervisory personnel continued, including: - 4,266 under contract (compared to 2,650 in 2004) - 55 basic education inspectors (compared to 55 in 2004) - 40 educational counselors (compared to 29 in 2004) 2 .3.9.2. Performance Analysis of Nonformal Education The “nonformal education” subprogram of the PDDE covers the following components: - Adult literacy and education activities - Career-oriented postgraduate programs in community training and development centers
(CFDC). The government’s choice for the implementation of literacy and adult education activities is the “learning by doing” strategy; This is a form of contractual relationship between the government, the NGOs/ADs (as private operators) and the technical and financial partners.
31
The CFDCs plan to promote access to basic vocational education for dropouts and the unschooled in order to better integrate them into the productive fabric of the community. These centers are currently being tested and an assessment of them will be available in the near future.
a. Access and Participation Given the difficulty of measuring access to and participation in nonformal education based on literacy, the number of persons enrolled per year has been taken as the unit of measurement. Accordingly, during the first phase of the program, an annual average of 90,000 persons, 65 percent of them women, were counted as enrollees in literacy programs. The analysis of the level of program implementation for the period 2004-2005 indicates that the established objectives were not achieved. Only 52 percent of the planned 180,000 persons were enrolled; and 53 percent of the target enrolment for women was reached.
b. Quality Assessment of Literacy Programs In this area, an analysis of the success rate on end-of-campaign testing and the dropout rate indicate mediocre results: - 63 percent of persons enrolled in literacy centers failed to achieve the desired level of
literacy (80 percent). - The success rate for women is below that of men (35 percent compared to 41 percent). - The dropout rate was 18 percent of persons enrolled, of which 19 percent were men. At the same time, it should be noted that the finalization process for the PDDE_Second Block, which includes secondary—middle and high school—and vocational and technical education, is proceeding normally. The assessment, educational policy letter (strategic objectives), logframe outline and MTEF are already finalized. 2.3.10. Access to Safe Drinking Water
In 2005, the government continued to implement several programs under the key pillars of the water policy. These include, among others, actions relating to the equipment and monitoring of ponds for irrigation, the implementation and operation of networks of observation wells in connection with private irrigation, physical and chemical analyses of water samples, the development of Nigerien standards for drinking water quality, and significant infrastructure works. Table 12: Implementation of Water Infrastructure Program and Drinking Water Coverage in Rural Areas. Cement wells New construction Rehabilitation
223 64
Boreholes equipped (small and medium systems) New construction Rehabilitation
160 184
Small-scale waterworks (mini-AEP) New construction Rehabilitation
23 48
Pumping stations • 45 Latrines Public School
14 37
32
Household 6,900 Rates of coverage of safe water needs in rural areas • 59% (compared to 57%
in 2004) Source : DEP/MHE/LCD
2.3.11. Youth, sports and culture
The results with respect to youth, sports and culture were unquestionably the organization and success of the Fifth Francophone Games - Niger 2005, despite the government’s budgetary constraints. Other major efforts were also carried out, particularly in the following areas: • Promotion of youth initiatives (mobilization for the Fifth Francophone Games, capacity
building, raising awareness about STDs/HIV/AIDS, entrepreneurship). • Sports and culture (construction and renovation of athletic and cultural infrastructure,
etc.). 2.3.12. Capacity-Building
The government’s approach in the area of capacity-building consists of (i) the determination, within the government, of those capacities which are of crucial importance to the implementation of the PRS; (ii) the establishment of a critical mass of national management level staff to provide economic management; and (iii) the development of a national action plan for capacity-building including local elected officials as well as new development agents. In fact, the establishment of the Development Analysis and Forecasting Unit (CAPED) to advise the Prime Minister’s office stems from this intention on the part of the government. Thus the government’s vision is supported extensively by the efforts of the development partners and the NGOs/ADs in the form of various institutional support programs, training seminars, internships, assistance and advice. For the year 2005, then, this status report will address only the principal results of implementation of the capacity-building program developed by the CAPED; in particular, these are the results relating to the “training,” “conferences,” “advisory assistance,” and “working meetings and workshops” components.
- Training conducted: Nine of the planned 25 training sessions were held, benefiting 214 persons; the training addressed a number of different subjects, in particular new information and communication technologies (NICT), career development, management skills, research methodology, preparation and analysis of development projects, and the award and performance of government contracts.
- Videoconferences: A total of 14 videoconference sessions were arranged at the
headquarters of the World Bank resident mission; decision-makers, senior government personnel and development partners participated in the sessions. The videoconferences were held mainly between Pierre-Richard Agénor (London), the World Bank team and the macro modeling group (staff members of the SP/SRP, CAPED, INS, UNDP and ME/F). The subjects addressed included Niger’s macroeconomic model (integration of the Millennium Development Goals (MDGs), parameterization, calibration and simulations, etc.), review and critical analysis of the conclusions of the Blair report of the Commission for Africa and Professor J. Sachs’s report on progress toward achieving the MDGs, prospective studies and analyses of
33
various options (public infrastructure investment program, cancellation of Niger’s external debt, acceleration of growth and achievement of the MDGs in Niger, economic assessment and policy agenda in Niger). The videoconferences served to deepen the group members’ aptitudes in macroeconomic modeling and poverty analysis.
- Macro modeling group activities: The macro modeling group held discussions to
improve the macroeconomic framework of the PRS and to conduct simulations of certain aspects of economic policies, particularly tax policy. The group also participated in discussions by videoconference, in particular through (i) Mr. Agénor’s presentation of the macroeconomic model to the World Bank’s Africa Department in January 2005, and (ii) the day of reflection on accelerated growth and achievement of MDGs in Niger held in September 2005 in Washington.
- Seminar on macro modeling: This seminar, led by Mr. Agénor, focused on the
resumption of work under the macroeconomic modeling assistance program during the period 2004-2005, and featured the presentation of the new model for Niger, fact sheets (poverty trap, Dutch disease, infrastructure program, budget assistance, etc.), and simulation methodologies.
- Studies: Of the ten studies planned, five were completed, four are in progress and
one was abandoned. In addition, six fact sheets were prepared and four studies were conducted in connection with macro modeling activities under the PRS.
2.3.13. State Modernization
By Decree 2005-003/PM of January 7, 2005 organizing the departments reporting to the Prime Minister and their respective functions, a High Commission on State Modernization (HCME) was created. The role of this unit as the mission’s administrator is to plan, supervise, coordinate, monitor and assess all actions to modernize central and local government in cooperation with the ministries concerned, in accordance with the objectives defined by the government. All of the activities conducted by the HCME in 2005 concentrated on furthering the decentralization process in Niger. These included, among others, activities relating to a number of studies made possible through the support of the Community Action Program (PAC), the German Technical Cooperation (GZT) and the European Union. These studies encompassed the following: • Definition of a blueprint for deconcentration in Niger. • Addressing the issue of decentralization and nomadic communities in Niger. • Establishment of a Support Fund for decentralization and the Equalization Fund in Niger. • Financing of investments in infrastructure and equipment for the local authorities in Niger. It should be noted that in the context of the European Union’s support to the HCME, particularly through the Project to Support the Establishment of Pertinent Strategies and Tools for Implementing Decentralization Reform (PASOPRD), a study on “land and decentralization in Niger” and field missions are in progress; these field missions plan to identify the expectations of local governments and local offices of central agencies in terms of laws and regulations to be revised, report on the operations of municipal councils, and monitor the training received with respect to decentralization.
34
2.4. Poverty and the Tracking-Assessment Mechanism
During 2005, an ambitious action plan was implemented to produce statistics and analyze data on household living conditions. The new data are expected to facilitate a better understanding of the determinants of poverty and refine the focus of the PRS. The following initiatives were carried out under the action plan: - data from the third General Population and Housing Census was published - a multiple-indicator demographic and health survey (EDS- MICS III) was initiated - results from the governance, democracy and poverty-reduction module of the 1-2-3
survey were analyzed - the survey on Measuring Basic Needs Satisfaction (DSBE) was conducted - the participatory survey on poverty was conducted - the survey based on the Unified Core Welfare Indicators Questionnaire was conducted. 2.4.1. General Population and Housing Census (RGPH)
The final results are available, and the analyses of six aspects of population movements and demographic projections serving as the basis for calculating the majority of the indicators were completed. The census results indicate that the Nigerien population grew from 5,102,980 inhabitants in 1977 to 7,251,626 in 1988 and 11,060,291 in 2001. The rate of population growth, which was 3.38 percent for the period 1977-1988, stood at 3.30 percent during the period 1988-2001. The results of the third general census indicate a nationwide average population density of 8.5 inhabitants per km², a figure that is quite low but still twice the density determined in 1977 (4.03 inhabitants per km²). However, this density indicator, calculated on a nationwide basis, gives a rather incomplete picture of the spatial distribution of the country’s population. The results from the third general census also indicate that in 2001, 47.5 percent of the total population was under 15 years of age, in contrast with the 2.9 percent who were over the age of 65. The potential labor force (15-64 years of age) represents 49.6 percent of the total population. Women represent 50.1 percent of the population 2.4.2. Basic Needs Satisfaction Survey
This is a relatively new approach, which allows the individuals surveyed to define poverty themselves during the interview rather than using a predetermined definition of poverty. It was conducted from December 24, 2004 to January 25, 2005 based on a sample of approximately 3,000 households. During the survey, each interviewee was required to choose from a provisional list1 those needs he or she considered most essential and without which no household could live decently. The interviewee also identified the needs that his or her household succeeded in meeting.
1The list was established following a participatory process (group discussions) conducted at the national level prior to conducting the survey itself. Sixty discussion groups were held in the eight administrative regions, in both rural and urban areas.
35
Through an analysis of responses, a composite poverty indicator (DSBE score) was calculated for each household using only those needs identified by at least 50 percent of interviewees. The results show that poverty affects an average of 70 percent of Nigerien households, and that the incidence of poverty is greater in rural areas (75 percent poor) than in urban areas (48 percent). The incidence of poverty also varies from region to region. The incidence of poverty is highest in the regions of Dosso, Diffa and Tillaberi, where it exceeds the national average: 85, 81 and 80 percent, respectively. The results of the study also show that small households (1 to 3 persons) are less affected by poverty than medium-sized or large households (4 to 12 persons), and that households headed by an individual with some level of education are generally better off than those headed by an individual with no education. The uniqueness of the survey lies in the ability to know the level of unmet basic needs. This analysis now provides an average rate that serves as the baseline for measuring the satisfaction of each need nationally, by residential area, region and welfare category. In other words, the magnitude of the problem to be addressed in order to meet every basic need is now known. Not only do we know the number of persons unable to meet each basic need, but also we know the area, region and welfare category to which the greatest number of these persons belong. This information is extremely valuable for decision-makers in planning sectoral poverty-reduction actions. In addition, the calculations show that an average of CFAF 69,193 per person is required per year to meet all unmet basic needs. Nearly half this amount (CFAF 31,600) would be allocated to food, CFAF 8,141 to social spending, CFAF 6,802 to health care, CFAF 6,242 to clothing and CFAF 5,034 to agricultural expenses. The remainder would be allocated to educating children, farming, housing and other expenses. 2.4.3. The Unified Core Welfare Indicators Questionnaire (CWIQ)
This survey was designed and conducted by the National Institute of Statistics (INS) with the support of the World Bank. It is a new instrument to make information on living conditions among the population available quickly and on a regular basis. The survey is conducted on a sample of 6,690 ordinary households in all regions of Niger. Data collection was carried out over a period of three months (April-July 2005). It helped establish a monetary profile of poverty in Niger using the cost-of-basic-needs method. It also provided information on access to and provision of basic social services. The study defined as poor an individual who receives less than the required 2,100 calories per day (recommended by the United Nations system for Niger). Based on the survey data, covering this basic need requires an annual expenditure of at least CFAF 144,750 in urban areas and CFAF 105,827 in rural areas. This amount is therefore used as the poverty threshold, and corresponds to a daily expenditure of CFAF 397 in urban areas and CFAF 290 in rural areas, both amounts being below the World Bank’s income poverty threshold ($1 per person per day, corresponding to CFAF 583 at the time of the survey) for extreme poverty. The survey results indicate that 62.1 percent of the Nigerien population is poor, i.e., more than 6 of every 10 persons. These results also show very marked regional disparities in levels of poverty. For example, while 40 percent of the population in the Diffa region is poor, the proportion is 79.7 percent in the Maradi region, or nearly 8 of every 10 persons. This region alone is home to over one-fourth (20.5 percent) [sic] of the Nigerien population. The region of Zinder, with 18.6 percent of the national population, has a poverty rate of 71 percent. Poverty is also higher in rural areas (more than 6 of every 10 persons) that in urban areas (55.5 percent poor excluding Niamey).
36
The results of the study also show that the larger the household, the greater the proportion of poor. The study also confirmed in general that access to social and economic infrastructure remains very limited, while its availability appears to be a factor in reducing the incidence of poverty. The survey also reveals sharp inequities owing to the fact that the consumption expenditure of the poorest 20 percent represent only one-fifth of the consumption expenditure of the richest 20 percent, and while the poorest 20 percent represent only 8.6 percent of total expenditure, the richest 20 percent account for 42.5 percent of total expenditure. 2.4.4. Results of the Governance, Democracy and Poverty Reduction Modules
This also includes a module on subjective poverty, governance and democracy. The survey involved a sample of 2,500 households from the urban community of Niamey. The results of the survey indicate that 70 percent of the population feels that the policies implemented to reduce poverty are yielding some results. However, only 20 percent are actually convinced of the effectiveness of the policies. Fifty-four percent consider this administration effective, compared to 46 percent who expressed the opposite opinion. Only about 40 percent of those surveyed were satisfied with the legal system and tax administration. The public health system is a conspicuous target, since a clear majority of respondents (62 percent) lack confidence in it. Ninety-three percent of Niamey inhabitants are convinced that it is plagued by corruption, 88 percent complain of politicization of management, and 74 percent complain of staff absenteeism. Eight percent of the population were direct victims of staff corruption in 2002. Close to one-third (30 percent) declare that they view democracy “very favorably,” while 40 percent view it “somewhat favorably.” With regard to development priorities for the next 10 years, maintaining order in the country and combating inflation occupy first and second place among the four options proposed, garnering 55 percent and 27 percent, respectively. The two other options considered trailed far behind with a small minority of responses. Barely 13 percent stated that the first priority should be to “increase citizen participation in government decisions,” while less than 5 percent were in favor of policies to “guarantee freedom of expression.” 2.4.5. Participatory Survey on Poverty
The study provided information on the perception of poverty among populations, developments in the situation over recent years, strategies used to escape from poverty and the impact of activities implemented in connection with the PRS, more specifically, the program of the President of the Republic, which utilizes resources from the Heavily Indebted Poor Countries (HIPC) Initiative. The EPP 2 subsample itself totals 2,724 persons distributed among the following subcategories: 860 individual interviews, 1,317 persons through focus groups and 647 resource persons. According to the results of EPP 2, poverty is perceived as a lack (of land, capital, money, livestock, resources, work, housing, etc.) in 83 percent of cases. According to 75 percent of respondents in individual interviews and nearly all focus groups, this phenomenon is reflected by an inability (to feed and clothe oneself, to participate fully in ceremonies and other cultural rites, in short, to cover the cost of self-sufficiency). According to the respondents, structural causes occupy first place (77 percent), followed by cyclical causes (68 percent) and endemic causes (55 percent). The respondents also cited a number of
37
vulnerability factors affecting households. The mobility trend for communities shown in the following grid indicates that in the past 10 years, 63 percent of the villages/sites experienced a trend toward greater prosperity, compared to 31 percent whose level of prosperity declined. It shows that fewer households, only 9 percent, were upwardly mobile or prosperous more than five years ago. Most of the households in the subsample saw an improvement in their living conditions in the last four years. Approximately one-third of households recently started their upward movement in the past two years. Seventy-one percent of households that experienced a decline in their status, suffered that deterioration in the past two years. Among the sample of interviewees who provided their life story, only 3 percent stated that they had managed to rise above poverty, 6 percent had joined the middle class and the ranks of the wealthy had shrunk by 3 percent. Approximately 62 percent of respondents at the household level positively assessed the Program approach, finding it to be based on meeting the communities’ priority needs. The PS/PR intervention strategy was deemed satisfactory by 31 percent of the interviewees because there were no delays in executing the work. Of the respondents who gave the PS/PR strategy and approach a negative assessment, nearly half found that the installation of management bodies lagged behind the pace of construction and/or upgrading of infrastructure. The deficiencies in monitoring and quality of work were criticized by 21 percent of respondents in the subsample, particularly with regard to the construction of water-powered systems. 2.4.6. The Multiple-Indicator Demographic and Health Survey (EDSN-MICSS III).
The purpose of the survey is to provide socio-demographic information on the population, particularly women and children in Niger, for tracking of the PRS and MDGs. The survey was postponed to 2006 due to the food crisis, which could have short-term effects on social indicators. 2.5. Implementation Constraints
Despite the commitment made by the partners on numerous occasions (e.g., June 2003 forum on the PRS, sectoral reviews) to give priority to budgetary assistance rather than project assistance, it was found that budget assistance remained below project assistance levels during budget execution. In addition, external assistance is unpredictable and inadequate for the challenges of poverty reduction. Furthermore, difficulties linked to the absorption of credit results in low levels of investment execution. In general, these constraints represent a drag on the growth of income and access by the poor to basic social services; they diminish the quality of life of the most vulnerable segments of the population and are linked to the following factors: • the persistence of climatic hazards that exacerbate the severe climate. • weak mobilization of domestic and external resources. • strong demographic growth, the effects of which result in unsustainable pressure on
natural energy resources and the soil, as well as heightened domestic demand for supplies of safe water, health care, education, training and jobs.
• weakness of human resources and technical capacities, which considerably reduce the quality of public services and the capacity to absorb external aid, as well as weak institutional capacities.
• the divergent approaches of the partners and lack of harmonization of their interventions.
38
III. OUTLOOK FOR PRS IMPLEMENTATION
The process of implementing the PRS is continuing, in particular, through the development or finalization of a number of sectoral policies and strategies including: • Adoption of the National Urban Development Strategy. • Adoption of the National Microfinance Strategy. • Adoption of the Framework Program to Provide Initial Employment for Young People • Adoption of the National Policy on Vocational and Technical Education and Training. • Initial work on the National Employment Policy • Revision of the National Population Policy and its inclusion in the PRSP. In general, the monitoring of four years of PRS implementation reveals the need for improvement IN the following areas: • Continued reforms through the new economic and financial program and the
implementation of the PEMFAR recommendations and action plan. • Continued development of the MTEF in priority sectors. • Mobilization of additional resources due to structural constraints and weaknesses in basic
infrastructure. • Implementation of action plans for harmonization of the partners’ interventions. • Building the capacity of the participants involved, to implement the planned measures
under the best possible conditions. In terms of outlook, this 2005 status report is specifically based on the following: Macroeconomic framework.
With respect to macroeconomic policy, the government has established the objective of achieving a real average annual growth rate of 4 percent during the period 2005-2007. This growth objective would increase per capita income by an annual average of 0.9 percent over the same period, compared to a decline of over 1 percent between 1994 and 2000. This would result in an average annual increase of 4 percent in private consumption, or an increase of nearly 1 percent in per capita consumption. In general, improved income distribution through public expenditure would provide the population with greater access to basic social services. For 2005, real growth in GDP would be 7.1 percent, based primarily on the agricultural sector. Average growth in GDP over the period 2006-2007 would be 4.2 percent. Tax policy would aim specifically to improve the country’s comparative advantage by reducing market distortions and more generally the tax burden on economic operators. Fiscal policy, in turn, should aim above all to develop economic infrastructure and provide basic public assets. Finally, the monetary and exchange-rate policy should complement the above and provide the stable macroeconomic framework essential for the credibility of the currency and for limiting investors’ risks. However, the exchange policy should have the flexibility needed to enable the country to maintain its global competitiveness in an integrated, changing international context in which the economy will continue, as in the past, to be exposed to internal and external shocks. How can economic growth be accelerated in an economy still burdened by major constraints on reducing poverty and achieving the Millennium Development Goals? The macroeconomic and financial policies to be implemented during the coming years should identify the key sectors able to boost economic
39
growth. To be effective, these policies should be supported by appropriate exchange policies and effective trade policies. With respect to fiscal policy, Niger has generally pursued a prudent macroeconomic policy. The authorities have devoted significant efforts to fiscal consolidation and reducing the budget deficit. In particular, expenditure was reduced as a proportion of GDP through control of payroll expenditure and the size of the civil service. Despite this progress, however, the budget deficit remains high and is financed basically through external resources, leading to ever-higher borrowing costs or increased dependence on concessional assistance. The government’s strategy for achieving its objective of reducing borrowing costs and its dependence on external financing should be to step up its efforts to control public expenditure in order to reduce the budget deficit. This could be brought to bear in three key areas (payroll, transfers and public investment expenditure): (i) To control payroll costs, the government will continue to control expenditure while aiming to increase the efficiency of agency personnel. This could be accomplished through improved selection of government employees combined with more competitive compensation to stimulate productivity. (ii)Transfers to Niger have decreased in proportion to domestic expenditure. The government’s strategy will be to target priority social spending at the expense of subsidies to the productive sector. This will consist of establishing institutions and providing funding to facilitate access to basic health and education services. (iii) The preceding analyses have already shown the low productivity of investments in Niger, against a backdrop of relatively low investment rates. Public investment accounts for close to 50 percent of total investment in Niger, and if quasi-public investment is included (in particular, public corporations), it represents four-fifths of total investment. It follows that the overall ineffectiveness of investment is due in large part to public investment. The ongoing review of public expenditure in Niger and further studies on the subject will determine the reasons for the ineffectiveness of investment and the reforms needed to address this. In any event, however, the public investment effort should be better targeted and focus on essential social services (education, health) and economic infrastructure. In terms of tax policy, the available data indicate that Niger’s tax revenue derives largely from import/export duties. Tax reforms and recovery efforts instituted by the government have served to significantly increase the contribution of domestic taxes to government revenue. Tax revenue has therefore increased. Such a development is favorable if based on expansion of the tax base rather than tax increases. Corporate taxation remains higher than in other countries of the subregion. Despite efforts to collect taxes from the informal sector, Niger’s assessment is based primarily on the formal sector. However, the country cannot continue to maintain such a high tax burden, which serves to discourage private investment in the modern sector – particularly among SMEs, on which the economy’s long-term growth and transformation depend. In this regard, the government’s strategy should promote overall efficiency of the tax system – increase resources without increasing the average tax burden and distortions. This involves efforts in four key areas: (i) simplify the system in order to reduce waste and improve collection; (ii) expand the tax base by reducing exemptions to the absolute minimum; (iii) lower the average rate on the expanded base; and (iv) maintain stable, predictable rates to the extent possible. With respect to monetary policy, emphasis will be placed on the exchange rate, the cornerstone of monetary management. Niger has little leeway in terms of monetary policy due to its membership in WAEMU. It can nevertheless engage its partners in discussion of the strengths and weaknesses of the current system and avenues for improvement. First of all, the principal monetary policy objectives must be defined for the region in the current context: (i) provide an adequate level of liquidity to support economic activity; (ii) ensure macroeconomic stability and convertibility of the common currency; (iii) make all economies of the region competitive. As to these three essential points, it must be acknowledged that monetary management has faltered frequently in the recent past as evidenced by:
40
(i) mechanisms to determine the money supply (stable ratio of approximately 28-30 percent of GDP) and the overall deficit (government borrowing limited to 20 percent of previous revenue) are grossly inflexible and simplistic. They have yet to produce the stabilization effects desired and have failed to prevent significant fiscal and BOP imbalances in the region’s countries; (ii) convertibility, which is considered one of the region’s major advantages, is not fully established; (iii) above all, the rigidity of the fixed exchange rate system resulted in a considerable rise in real exchange rates, which served to exacerbate rather than mitigate the economic crisis of 1980-1993. To this end, the exchange policy for the WAEMU states should be better defined in order to ensure their regional and international competitiveness. In regard to trade policy, the analysis of Niger’s external trade revealed a low level of exports, accompanied by a structural deficit in the trade balance. This is indicative of poor performance and undermines the potential value of the country’s competitive advantages. Foreign investment is also negligible, and more than 80 percent of domestic investment continues to depend on foreign assistance. To address these concerns, Niger should pursue an open and more aggressive trade policy during the coming years. The policy would be based on the following considerations: (i) an aggressive policy of promoting exports is desirable; (ii) however, it would reach its limitations very quickly without an overall strategy of open markets and good neighborly relations. Such a strategy is particularly essential because Niger is both vast and landlocked. It is this strategy of open markets that Niger should pursue and persuade its neighbors to pursue in the context of current regionalization experiences. The multiplier effect may be considerable and, depending on the nature of shocks affecting the country, may afford greater stability and accelerated growth; (iii) another aspect of the good neighbor/open market policy is the ability it affords states to use multinational companies as instruments to implement (over a larger area) regional strategies rather than strategies specific to each country, particularly for the development of transport, energy and telecommunications infrastructure. Niger should realize that its future depends greatly on its degree of openness to the outside world. The fact that the country is landlocked has often been used to justify its slow progress in the area of foreign trade. It should actually be the inverse. In the current context of globalization, it is essential that Niger develop aggressive policies to carve out its market share in the areas in which it can develop comparative advantages. To develop trade, the government should take the following actions: (i) adopt an open policy: just as the country adopted a Development Policy Letter, it should adopt a letter of intent on an international trade development policy. Such a letter would lead the country to establish a mechanism to facilitate development, for example, the implementation of facilities such as a free trade area for businesses producing goods for export; (ii) diversify the content and destination of exports: Niger’s exports are based on primary products for which prices are particularly volatile. It is important that Niger diversify its export sources, both within the agricultural sector and abroad; (iv) simplify customs procedures: the customs service is the immediately visible arm of the tax system that can turn away potential investors or exporters. The government should devote the necessary efforts to simplifying procedures and standardizing and reducing customs tariffs. Rural development. • The government’s adoption of rural development strategy (SDR) action plans and
programs. • Development of program budgets for the rural sector based on action plans for the SDR
programs and information compiled during the updated project reviews; the program budgets will be presented in the form of a three-year MTEF (2007-2009) which underpin budget discussions for preparation of the 2007 budget law.
41
• Implementation of steering mechanisms (oversight of SDR programs and subprograms and oversight for each specific objective).
• Initiation of SDR regionalization by conducting a preliminary study. • Review of public expenditure for the rural sector during the third quarter of 2006. • Studies conducted within the context of implementing the SDR (tracking/assessment and
integration of MDGs, regionalization of SDR programs, sector strategies, harmonization of development plans, etc.).
• Organization of workshops on the MTEF, the program approach and local development. Trade, industry and private sector development • Gradual incorporation of the informal sector into the organized, modern sector. • Implementation of the fund to promote SMEs, in cooperation with all partners. • Mobilization of the Nigerien diaspora to promote the creation of businesses,
microenterprises and SMEs in Niger. • Preparation of the framework document to revive the marketing of agricultural products. • Implementation of a permanent framework for cooperation between economic operators
and the tax and customs administration. • Strengthening and monitoring of the recommendations of the National Investors Council. Mining and Energy. • Maintain the competitiveness of mining companies. • Mobilize the country’s private sector with a view to its involvement in mining research and
operations. • Make the mining sector contribute to local development. • Develop artisanal and small-scale mining operations. • Conduct a feasibility study for the mining of coal deposits in Salkadamna and, if feasible,
begin operations for the production of electricity and charcoal briquettes. • Provide 100 percent of villages of over 1,000 inhabitants with electric power by 2015. • Increase the population’s electricity coverage rate to 66 percent by 2015. • Provide the entire population with access to modern cooking fuel by 2015. Transport. • Continue the modernizing the industry of road transport of goods (reorganization of
transport contracts, renovation of the vehicle fleet, implementation of a freight information system, facilitation of transport and transit).
• Creation of a National Highway Security Center. • Signature of a concession agreement for technical control of automobiles. • Procurement of a second amphibious raft in Farié in the 2006 budget.
42
New information and communications technologies. • Develop a government intranet. • Ensure the success of the fiber optics communication project. • Expand high-speed Internet usage in all public agencies. Health and Endemic Disease Control. • Conversion of 50 rural health stations into Type I CSIs. • Start of operations of 23 district hospitals. • Implementation of hospital reforms. • Establishment of a social fund to provide healthcare for the poor. • Revision of texts relating to healthcare cost recovery. • Promotion of community health mutual societies. • Effective implementation of the National Reproductive Health Program • Establishment of regional mother and child health centers • Regionalization of the PDS and regional MTEFs put into operation. Combating STDs/HIV/AIDS • Clarification of the various institutions’ roles during development of the 2007-2010
strategy paper. • Increased availability of counseling services and voluntary screening through mobile
screening activities and involvement of community health agents trained in connection with the PS/PR.
• Decentralization of care. • Efforts to reduce the vulnerability of young persons (unemployment, migration) by
stepping up the “high-intensity labor” component of the PS/PR. Tracking-assessment and knowledge of poverty. • Complete the surveys in progress. • Conduct a national household consumption budget survey (ENBC) • Finalize the National Statistics Development Strategy • Develop a new poverty profile. Revision of the PRS. The need for a new PRS, particularly with current data including the finalized sectoral strategies, as well as aspects of employment, gender, youth and the imperative of controlling demographic growth, prompted the government to launch the process of revising the PRSP following the National Steering Committee meeting held on December 1, 2005. This process, which is expected to result in a revised PRSP, will involve:
43
• Drawing lessons from the four years of implementation of the PRS through an exhaustive examination.
• Energizing the bodies involved in the PRS implementation mechanism (National Steering Committee, Government/Partners Committee, Consensus-building and Dialogue Committee, regional committees).
• Beginning work on revision of the PRS (terms of reference, establishment of central thematic groups and regional working groups, group capacity building, etc.).
In conclusion, given the economic policy guidelines for the coming years in Niger the government must step up its efforts to consolidate macroeconomic stability and strengthen policies to reduce poverty and pursue the Millennium Development Goals.
44
ANNEXES
45
Annex 1: Fiscal Reporting Table (TOFE)
(CFAF billions)
2002 2003 2004 2005
Total revenue 160.9 156.7 172.8 189.0Tax revenue 144.6 152.1 167.6 181.3Taxes on foreign trade 82.9 79.9 83.2 93.9Taxes on goods and services 30.6 34.1 40.9 46.4Taxes on income and profit 23.1 28.3 31.4 31.4Other tax revenue 7.9 9.8 12.1 9.6Nontax revenue 3.8 1.2 1.4 4.9Revenue – specific budgets + special accounts 4.1 3.4 3.9 2.8
Table 2: Macroeconomic monitoring indicators Indicators 2002 2003 2004 2005 Rate of growth of real per capita GDP (%) 2.0 0.5 -3.9 3.8Proportion of budget allocated to priority sectors (%)