63
Nigeria Education Data Survey (NEDS) 2010 STATE REPORT: Benue
Nigeria Education Data Survey (NEDS) 2010STATE REPORT:Benue

NIGERIANigeria Education Data Survey (NEDS) 2010
STATE REPORT: Benue
National Population CommissionAbuja, Nigeria
NEDS 2010 Plus, c/o Federal Ministry of Education Annex , Plot 245 Samuel A. Ademulegun St. , Central Business District, Opposite Arewa Suites, Abuja, Nigeria
July 2014
National Population Commission Federal Republic of Nigeria
Federal Ministry of Education Federal Republic of Nigeria
Education SectorSupport Programme in Nigeria (ESSPIN)

1. Introduction a. Introductionb. How to Read This Report
p. 1p. 2
2. Parents/Guardians a. Demographicsb. Literacy and Education Attainment
p. 3p. 4
3. Children a. Demographicsb. Literacy c. Numeracy
p. 5p. 6p. 7
4. School Attendance Ratios a. Net and Gross Attendance Ratiosb. Age-Specific Schooling Statusc. Over-Age, Under-Age, and On-Time Pupils
p. 8p. 10p. 11
5. Proximity to Schools a. Primary and Junior Secondary Schoolsb. Primary School Selection and Reasons c. Junior Secondary School Selection and Reasons
p. 12p. 13p. 14
6. Factors Affecting Attendance
a. Age at First Primary School Attendanceb. Never Attended School c. Primary School Dropouts
p. 15p. 16p. 17
7. Household Expenditures on Schooling
a. Primary Schoolb. Junior Secondary School
p. 18p. 19
8. Other Contributions a. Time Spent on School Activities—Primary Schoolb. Time Spent on School Activities—Jr. Secondary Schoolc. No Homework
p. 20p. 21p. 22
9. School Quality Perceptions a. Primary School p. 23
10. Absenteeism a. Attended all Days p. 24
11. Annex p. 26
Table of Contents
1 Introduction
1
The 2010 Nigeria Education Data Survey (NEDS) was a nationally representative sample
survey implemented primarily by the National Population Commission (NPC) in collabo-
ration with the Federal Ministry Of Education (FMOE) and the Universal Basic Education
Commission (UBEC).
The 2010 NEDS has the following specific objectives:
Provide data on the schooling status of Nigerian children of basic education
age, including factors influencing whether children ever enroll in school and
why students drop out of school
Quantify household expenditures on children’s schooling by examining dif-
ferent patterns of expenditure by various background characteristics
Measure parents’ attitudes to schooling, including the quality of schooling and
provide an understanding of attitudes that shape their willingness to send
their children to school
Measure the frequency of student absenteeism and reasons for missing
school in order to suggest possible approaches to maximizing attendance
Provide data that allows for trend analysis and State comparisons
A very high overall response rate of 98% was achieved with interviews completed in
26,934 households.
MORE INFORMATION
Detailed tables for all sections shown in this report are available on the NEDS companion website.
https://www.EdDataGlobal.org/
2
How to Read This Report 1
RURALURBANMALE FEMALE
Parents/Guardians
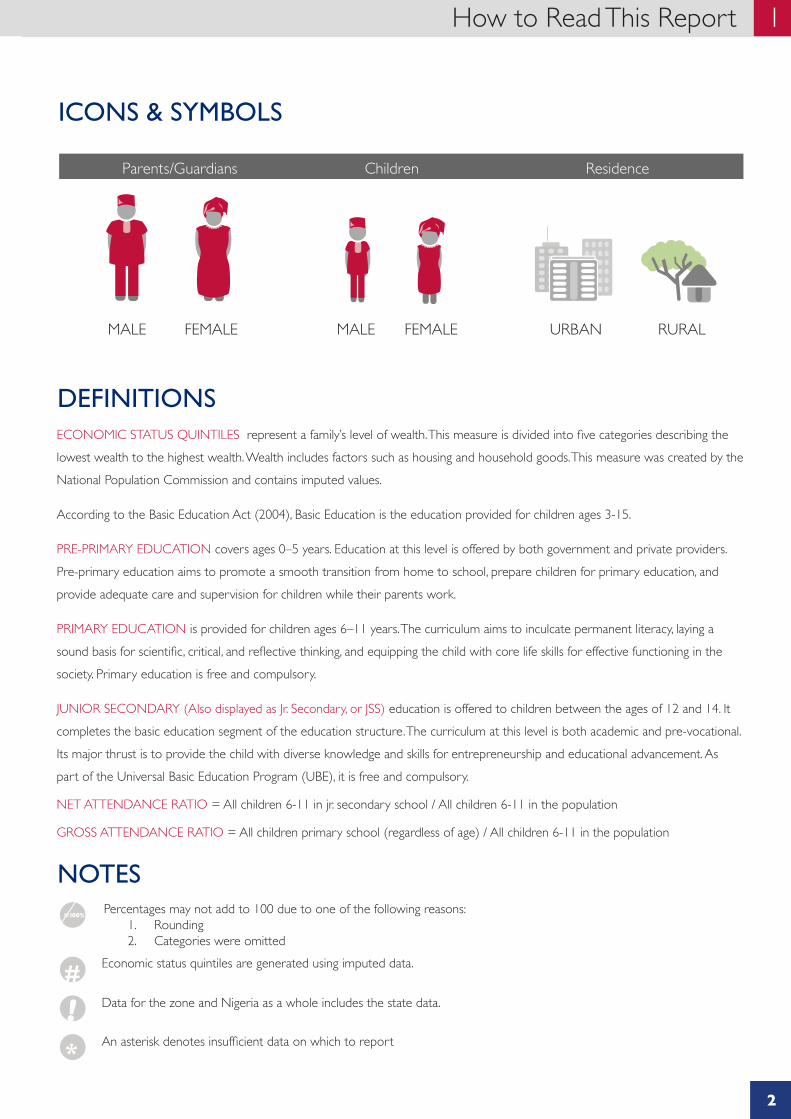
ICONS & SYMBOLS
Residence
MALE FEMALE
Percentages may not add to 100 due to one of the following reasons:1. Rounding2. Categories were omitted
DEFINITIONSECONOMIC STATUS QUINTILES represent a family’s level of wealth. This measure is divided into five categories describing the lowest wealth to the highest wealth. Wealth includes factors such as housing and household goods. This measure was created by the National Population Commission and contains imputed values.
According to the Basic Education Act (2004), Basic Education is the education provided for children ages 3-15.
PRE-PRIMARY EDUCATION covers ages 0–5 years. Education at this level is offered by both government and private providers. Pre-primary education aims to promote a smooth transition from home to school, prepare children for primary education, and provide adequate care and supervision for children while their parents work.
PRIMARY EDUCATION is provided for children ages 6–11 years. The curriculum aims to inculcate permanent literacy, laying a sound basis for scientific, critical, and reflective thinking, and equipping the child with core life skills for effective functioning in the society. Primary education is free and compulsory.
JUNIOR SECONDARY (Also displayed as Jr. Secondary, or JSS) education is offered to children between the ages of 12 and 14. It completes the basic education segment of the education structure. The curriculum at this level is both academic and pre-vocational. Its major thrust is to provide the child with diverse knowledge and skills for entrepreneurship and educational advancement. As part of the Universal Basic Education Program (UBE), it is free and compulsory.
NET ATTENDANCE RATIO = All children 6-11 in jr. secondary school / All children 6-11 in the population
GROSS ATTENDANCE RATIO = All children primary school (regardless of age) / All children 6-11 in the population
MORE INFORMATION
Economic status quintiles are generated using imputed data.
Children
Data for the zone and Nigeria as a whole includes the state data.
NOTES
An asterisk denotes insufficient data on which to report*
2 Parents/Guardians: Demographics
3
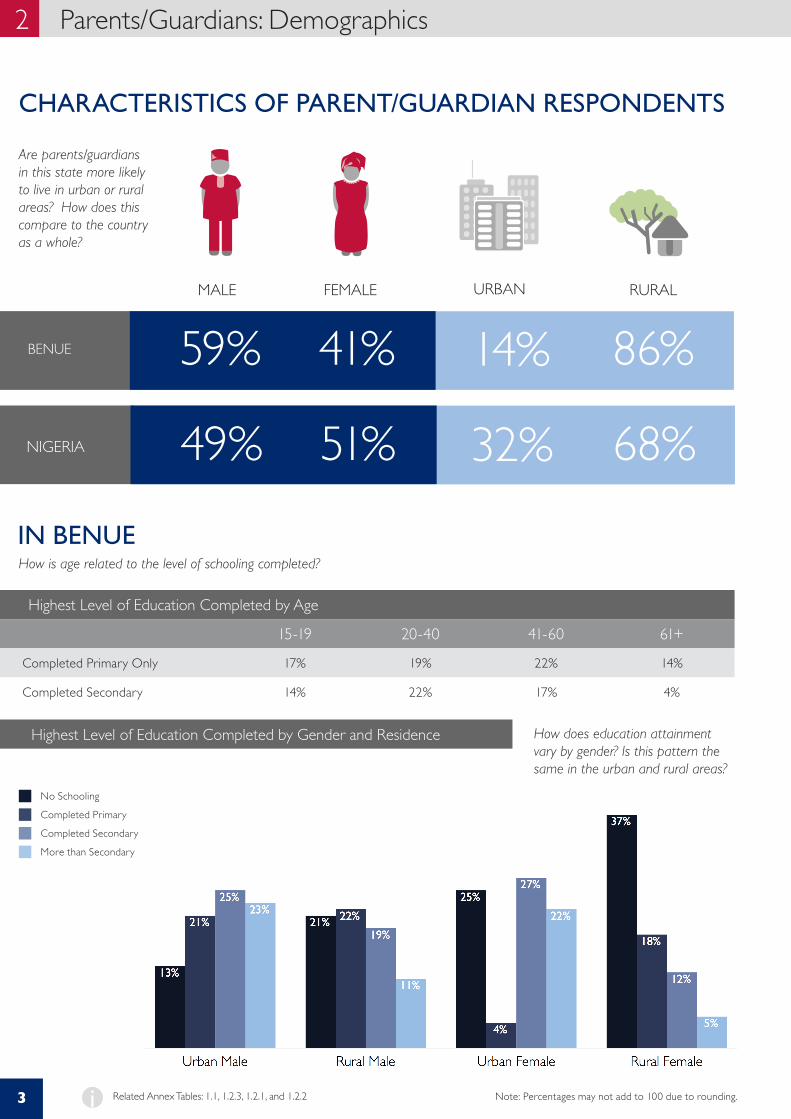
Highest Level of Education Completed by Gender and Residence
How is age related to the level of schooling completed?
How does education attainment vary by gender? Is this pattern the same in the urban and rural areas?
IN BENUE
Highest Level of Education Completed by Age
15-19 20-40 41-60 61+
Completed Primary Only 17% 19% 22% 14%
Completed Secondary 14% 22% 17% 4%
No Schooling
Completed Primary
Completed Secondary
More than Secondary
Related Annex Tables: 1.1, 1.2.3, 1.2.1, and 1.2.2i Note: Percentages may not add to 100 due to rounding.
Are parents/guardians in this state more likely to live in urban or rural areas? How does this compare to the country as a whole?
NIGERIA
RURALURBANMALE FEMALE
CHARACTERISTICS OF PARENT/GUARDIAN RESPONDENTS
49% 51% 32% 68%
BENUE 59% 41% 14% 86%
4
Parents/Guardians: Literacy & Education Attainment 2
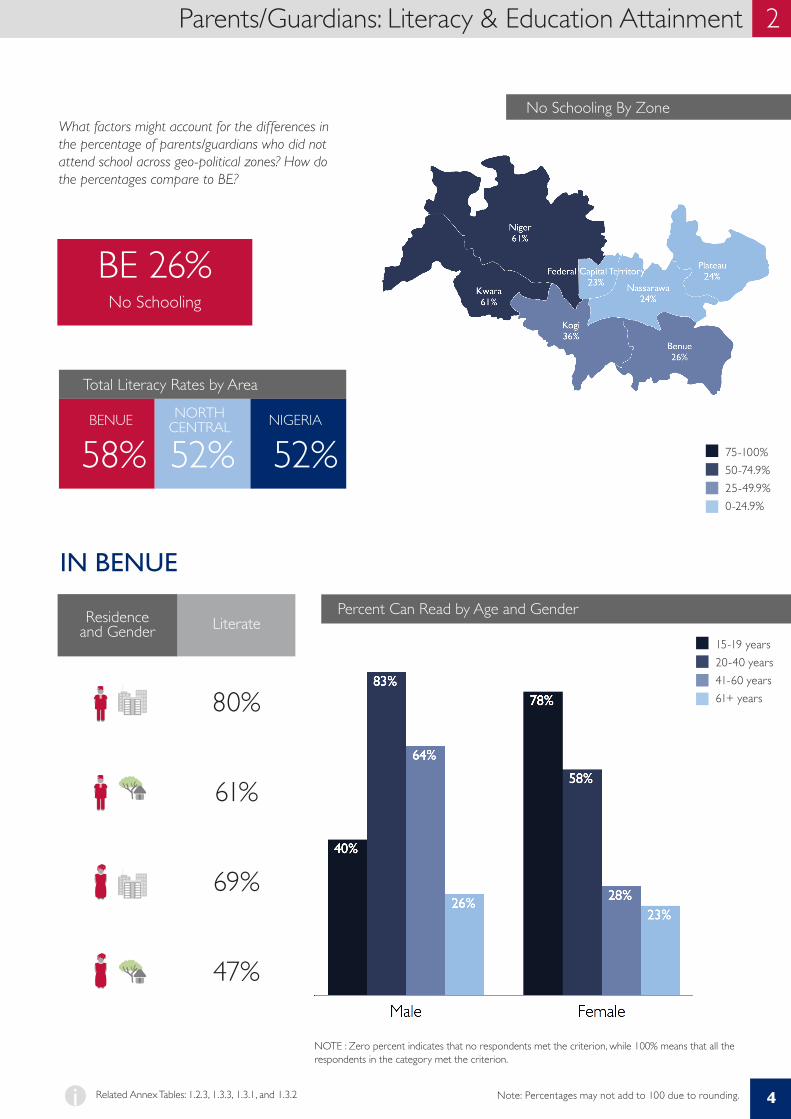
Percent Can Read by Age and GenderLiterateResidence
and Gender15-19 years20-40 years41-60 years61+ years80%
61%
69%
47%
NOTE : Zero percent indicates that no respondents met the criterion, while 100% means that all the respondents in the category met the criterion.
IN BENUE
What factors might account for the differences in the percentage of parents/guardians who did not attend school across geo-political zones? How do the percentages compare to BE?
No Schooling By Zone
BE 26%No Schooling
Total Literacy Rates by Area
BENUE NORTH CENTRAL NIGERIA
58% 52% 52%
Related Annex Tables: 1.2.3, 1.3.3, 1.3.1, and 1.3.2i
75-100% 50-74.9% 25-49.9% 0-24.9%
Note: Percentages may not add to 100 due to rounding.
3 Children: Demographics
5
NIGERIA
RURALURBAN
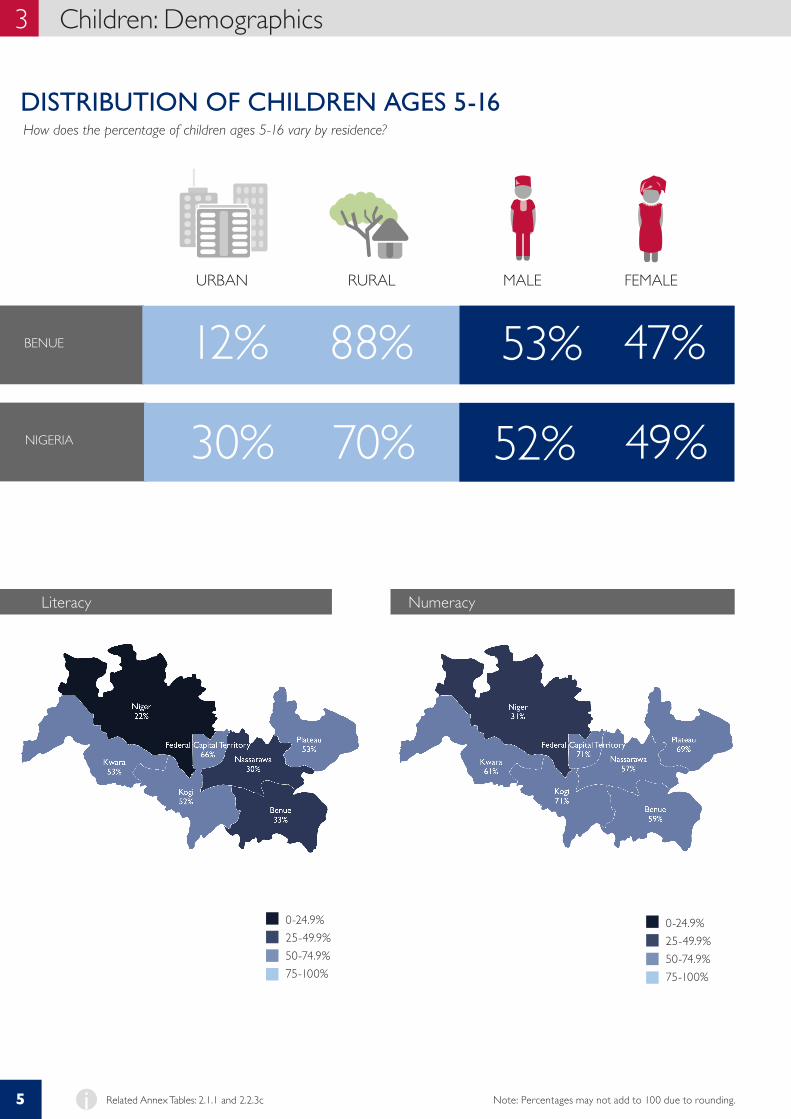
How does the percentage of children ages 5-16 vary by residence?
MALE FEMALE
DISTRIBUTION OF CHILDREN AGES 5-16
30% 70% 52% 49%
BENUE 12% 88% 53% 47%
Related Annex Tables: 2.1.1 and 2.2.3ci
Literacy Numeracy
0-24.9%25-49.9%50-74.9%75-100%
0-24.9%25-49.9%50-74.9%75-100%
Note: Percentages may not add to 100 due to rounding.
15+ years
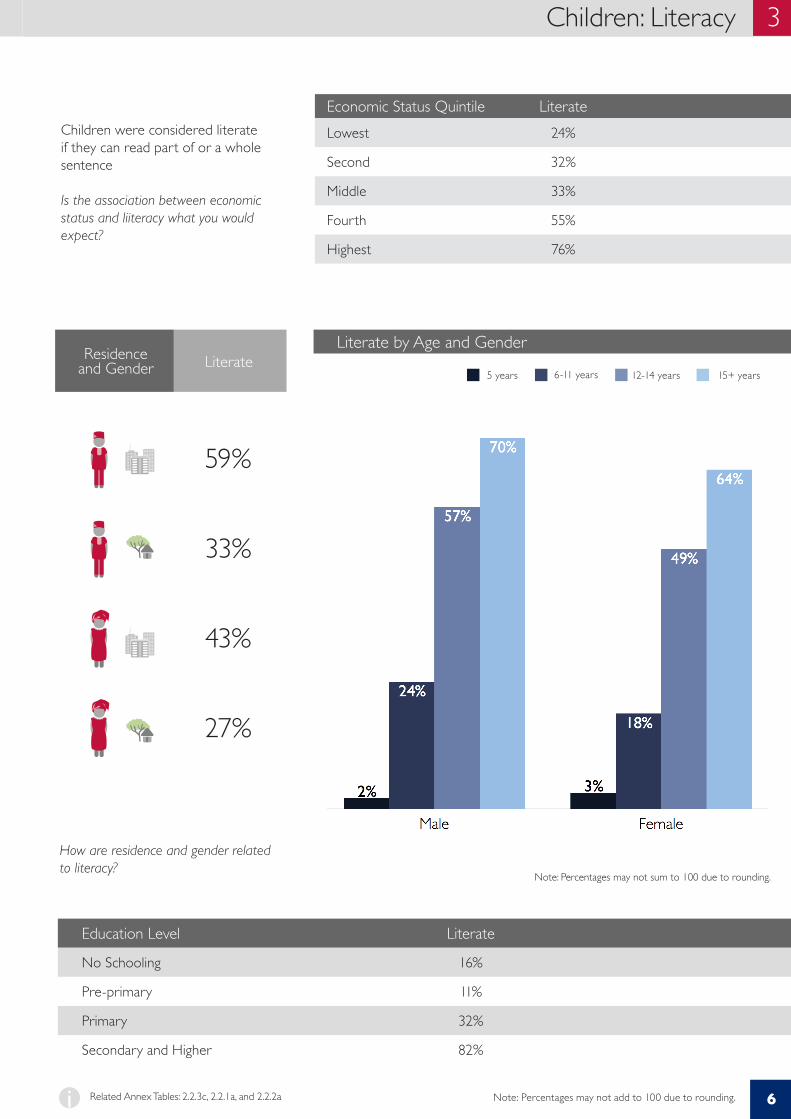
Residence and Gender Literate
Literate by Age and Gender
Children were considered literate if they can read part of or a whole sentence
Is the association between economic status and liiteracy what you would expect?
Economic Status Quintile LiterateLowest 24%
Second 32%
Middle 33%
Fourth 55%
Highest 76%
Education Level Literate
No Schooling 16%
Pre-primary 11%
Primary 32%
Secondary and Higher 82%
5 years 6-11 years 12-14 years
Note: Percentages may not sum to 100 due to rounding.
How are residence and gender related to literacy?
Children: Literacy 3
6Related Annex Tables: 2.2.3c, 2.2.1a, and 2.2.2ai Note: Percentages may not add to 100 due to rounding.
59%
33%
43%
27%
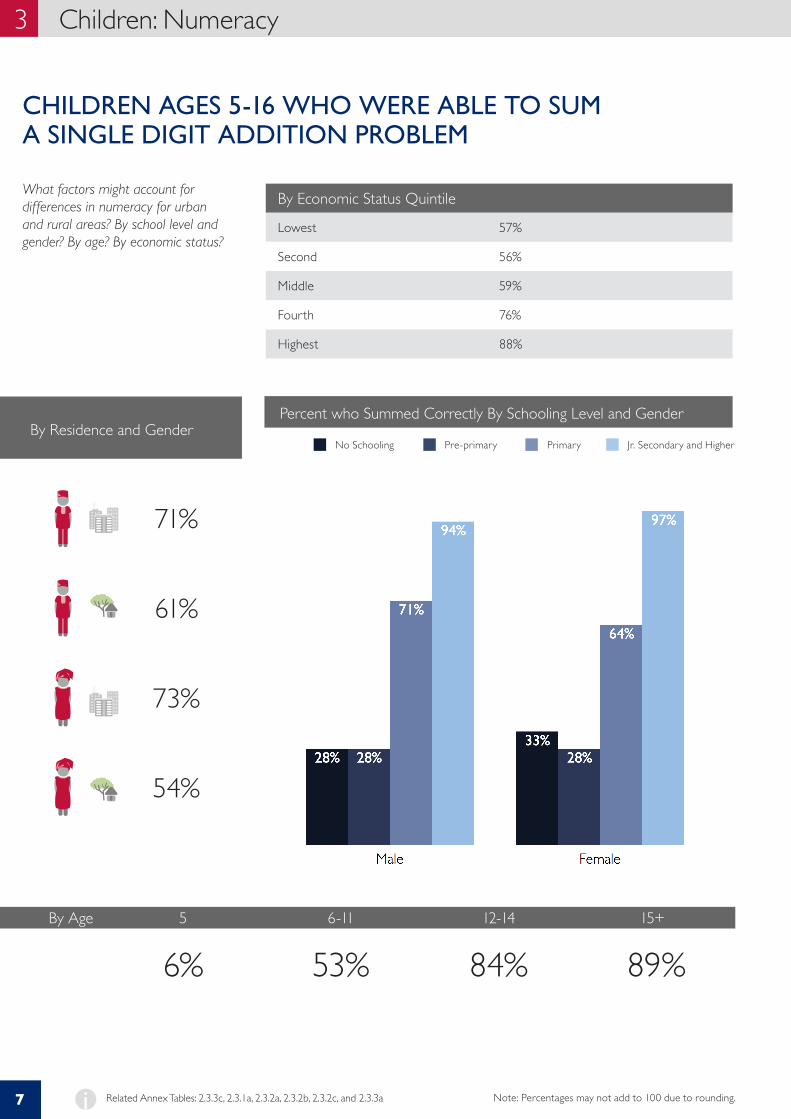
What factors might account for differences in numeracy for urban and rural areas? By school level and gender? By age? By economic status?
No Schooling
CHILDREN AGES 5-16 WHO WERE ABLE TO SUM A SINGLE DIGIT ADDITION PROBLEM
By Economic Status Quintile
Lowest 57%
Second 56%
Middle 59%
Fourth 76%
Highest 88%
Pre-primary Primary Jr. Secondary and HigherBy Residence and Gender
Percent who Summed Correctly By Schooling Level and Gender
71%
61%
73%
54%
By Age 5 6-11 12-14 15+
6% 53% 84% 89%
Related Annex Tables: 2.3.3c, 2.3.1a, 2.3.2a, 2.3.2b, 2.3.2c, and 2.3.3ai Note: Percentages may not add to 100 due to rounding.
3 Children: Numeracy
7
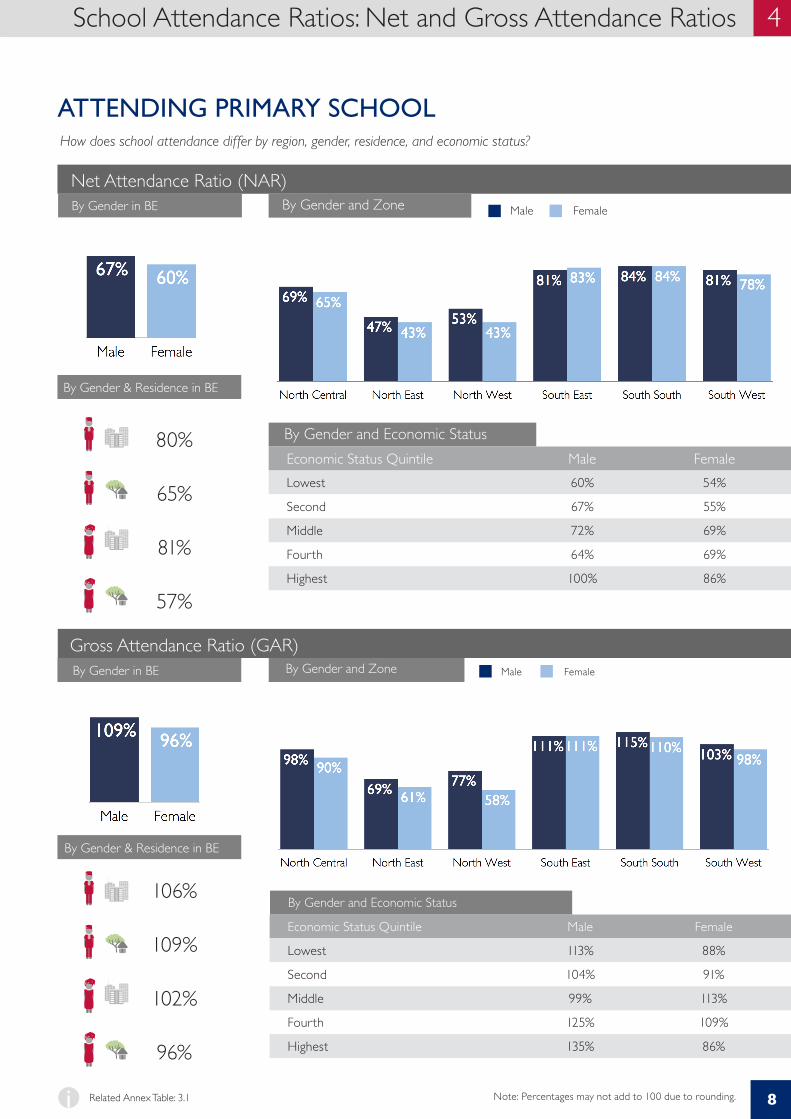
How does school attendance differ by region, gender, residence, and economic status?
By Gender and Economic Status
Net Attendance Ratio (NAR)By Gender and Zone
Gross Attendance Ratio (GAR)
By Gender and Economic Status
By Gender and Zone
106%
109%
102%
96%
80%
65%
81%
57%
Economic Status Quintile Male FemaleLowest 60% 54%
Second 67% 55%
Middle 72% 69%
Fourth 64% 69%
Highest 100% 86%
Economic Status Quintile Male Female
Lowest 113% 88%
Second 104% 91%
Middle 99% 113%
Fourth 125% 109%
Highest 135% 86%
By Gender & Residence in BE
By Gender & Residence in BE
Male Female
Male Female
ATTENDING PRIMARY SCHOOL
By Gender in BE
By Gender in BE
Related Annex Table: 3.1i Note: Percentages may not add to 100 due to rounding.
School Attendance Ratios: Net and Gross Attendance Ratios 4
8
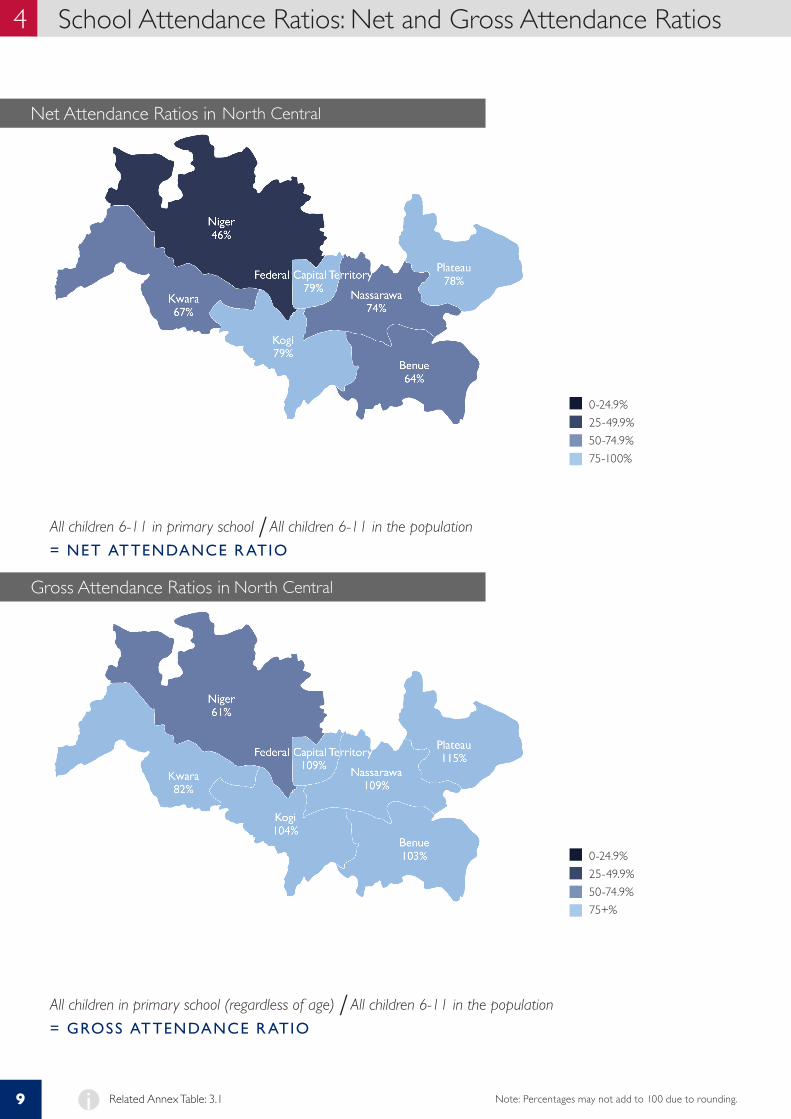
All children 6-11 in primary school / All children 6-11 in the population
= NET ATTENDANCE R ATIO
All children in primary school (regardless of age) / All children 6-11 in the population
= GROSS ATTENDANCE R ATIO
Net Attendance Ratios in North Central
Gross Attendance Ratios in North Central
0-24.9% 25-49.9% 50-74.9% 75-100%
0-24.9% 25-49.9% 50-74.9% 75+%
Related Annex Table: 3.1i Note: Percentages may not add to 100 due to rounding.
4 School Attendance Ratios: Net and Gross Attendance Ratios
9
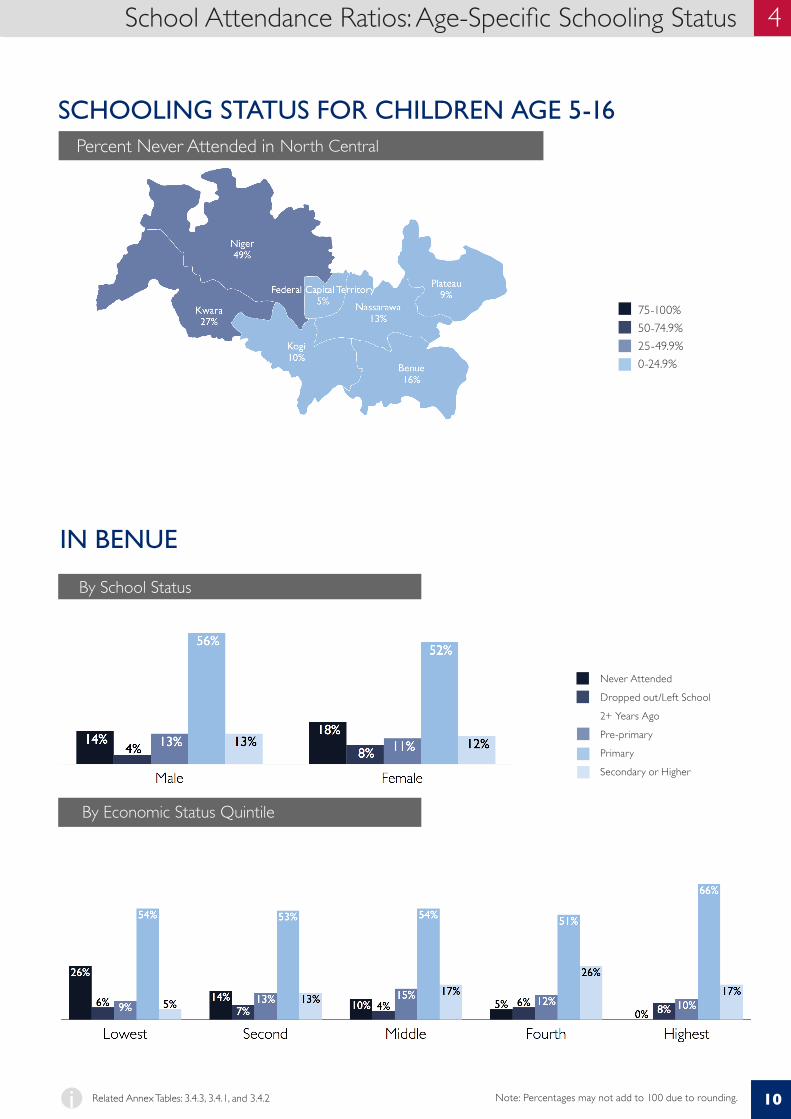
Never Attended
Dropped out/Left School
2+ Years Ago
Pre-primary
Primary
Secondary or Higher
By School Status
By Economic Status Quintile
SCHOOLING STATUS FOR CHILDREN AGE 5-16Percent Never Attended in North Central
75-100% 50-74.9% 25-49.9% 0-24.9%
Related Annex Tables: 3.4.3, 3.4.1, and 3.4.2i Note: Percentages may not add to 100 due to rounding.
School Attendance Ratios: Age-Specific Schooling Status 4
10
IN BENUE
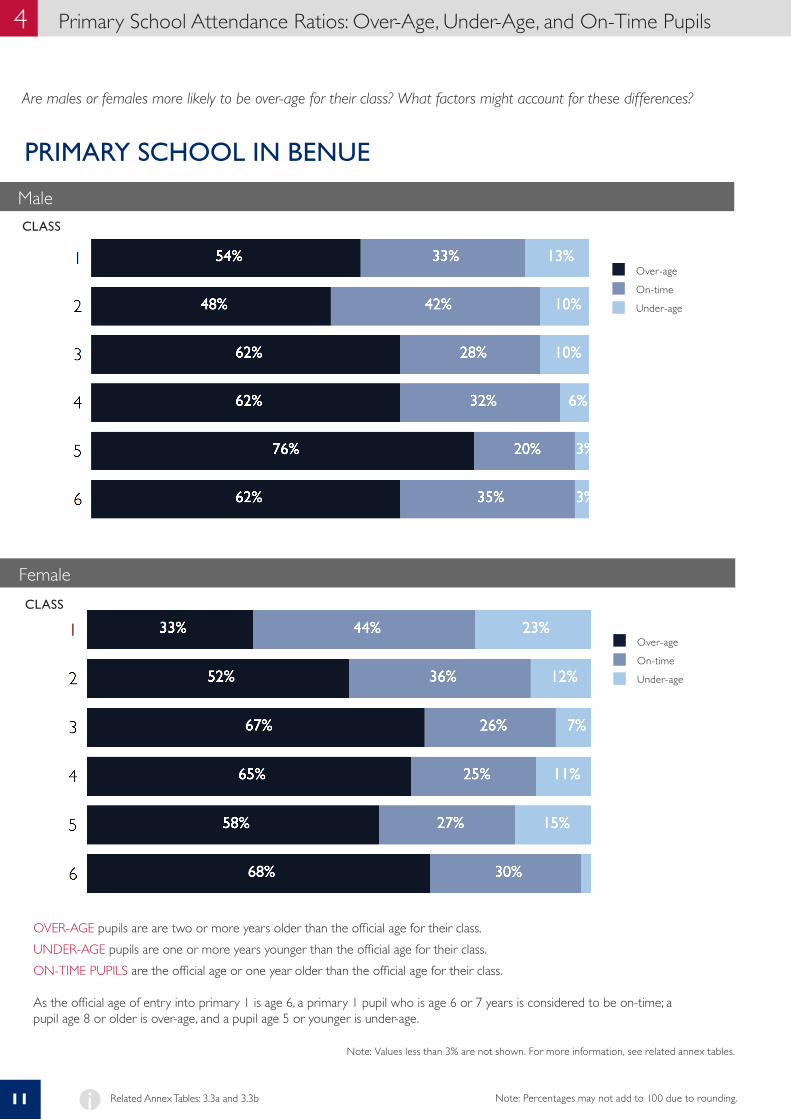
PRIMARY SCHOOL IN BENUE
Are males or females more likely to be over-age for their class? What factors might account for these differences?
Over-age
On-time
Under-age
Male
Over-age
On-time
Under-age
Female
OVER-AGE pupils are are two or more years older than the official age for their class.UNDER-AGE pupils are one or more years younger than the official age for their class. ON-TIME PUPILS are the official age or one year older than the official age for their class.
As the official age of entry into primary 1 is age 6, a primary 1 pupil who is age 6 or 7 years is considered to be on-time; a pupil age 8 or older is over-age, and a pupil age 5 or younger is under-age.
CLASS
CLASS
Note: Values less than 3% are not shown. For more information, see related annex tables.
Related Annex Tables: 3.3a and 3.3bi Note: Percentages may not add to 100 due to rounding.
Proximity to Schools: Primary and Junior Secondary Schools 54 Primary School Attendance Ratios: Over-Age, Under-Age, and On-Time Pupils
11
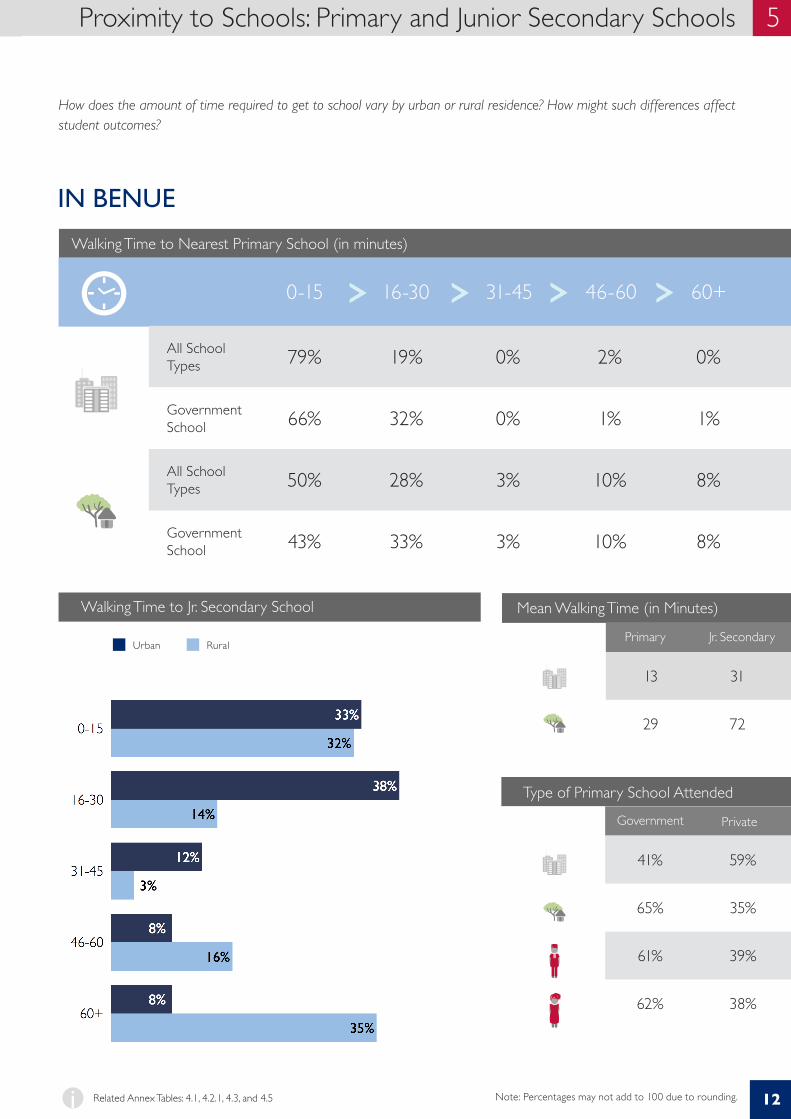
How does the amount of time required to get to school vary by urban or rural residence? How might such differences affect student outcomes?
Walking Time to Nearest Primary School (in minutes)
Mean Walking Time (in Minutes)
Type of Primary School Attended
Walking Time to Jr. Secondary School
0-15 16-30 31-45 46-60 60+
Primary Jr. SecondaryUrban
Government Private
All School Types 79% 19% 0% 2% 0%
Government School 66% 32% 0% 1% 1%
All School Types 50% 28% 3% 10% 8%
Government School 43% 33% 3% 10% 8%
41% 59%
65% 35%
61% 39%
62% 38%
13 31
29 72
IN BENUE
PRIMARY SCHOOL IN BENUE
Rural
Related Annex Tables: 4.1, 4.2.1, 4.3, and 4.5i Note: Percentages may not add to 100 due to rounding.
Proximity to Schools: Primary and Junior Secondary Schools 5
12
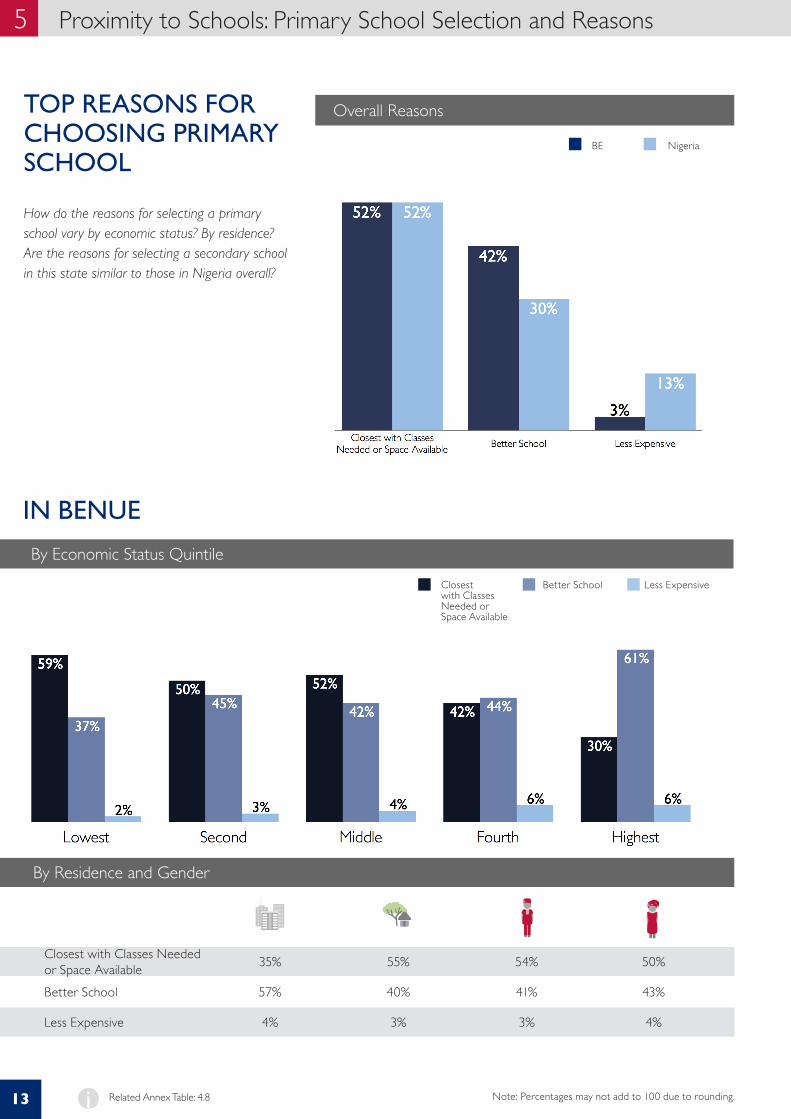
Closest with Classes Needed or Space Available
Better School Less Expensive
By Residence and Gender
By Economic Status Quintile
Overall ReasonsTOP REASONS FOR CHOOSING PRIMARY SCHOOL
How do the reasons for selecting a primary school vary by economic status? By residence? Are the reasons for selecting a secondary school in this state similar to those in Nigeria overall?
Closest with Classes Needed or Space Available 35% 55% 54% 50%
Better School 57% 40% 41% 43%
Less Expensive 4% 3% 3% 4%
Nigeria
IN BENUE
Related Annex Table: 4.8i
BE
Note: Percentages may not add to 100 due to rounding.
5 Proximity to Schools: Primary School Selection and Reasons
13
Proximity to Schools: Junior Secondary School Selection and Reasons 5
By Residence and Gender
By Economic Status Quintile
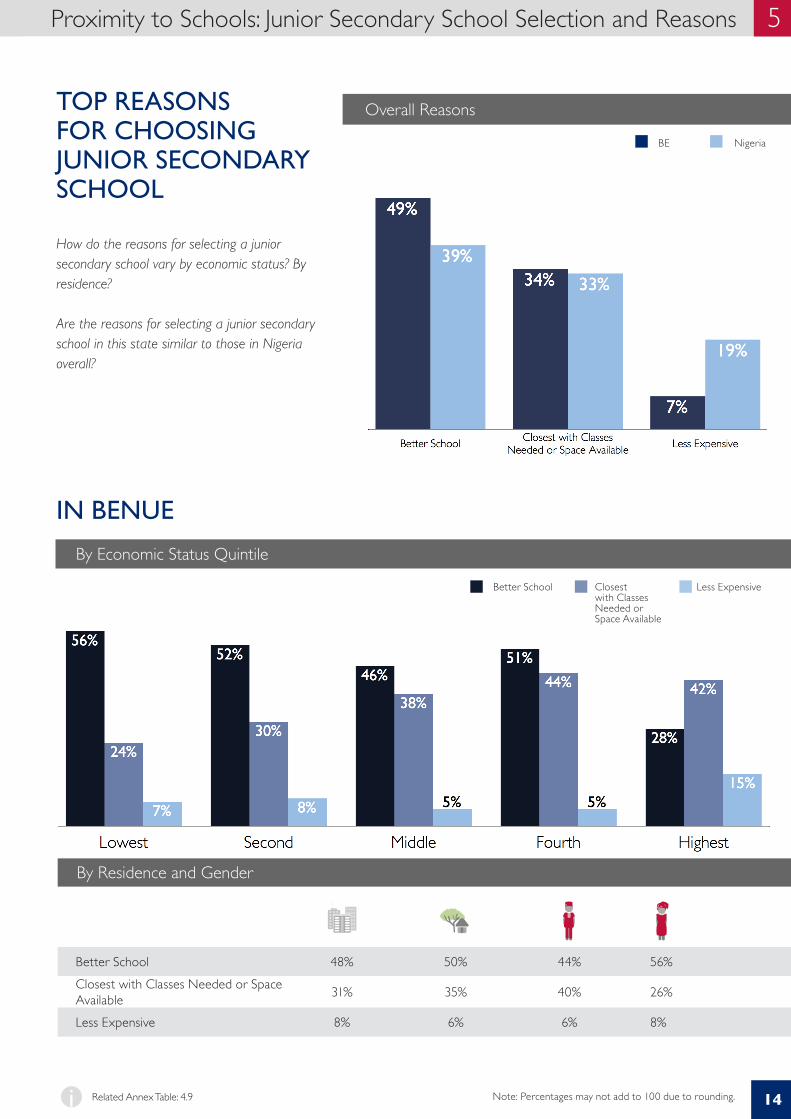
Overall Reasons
How do the reasons for selecting a junior secondary school vary by economic status? By residence?
Are the reasons for selecting a junior secondary school in this state similar to those in Nigeria overall?
Better School 48% 50% 44% 56%Closest with Classes Needed or Space Available 31% 35% 40% 26%
Less Expensive 8% 6% 6% 8%
IN BENUE
TOP REASONS FOR CHOOSING JUNIOR SECONDARY SCHOOL
Better School Closest with Classes Needed or Space Available
Less Expensive
Related Annex Table: 4.9i
NigeriaBE
Note: Percentages may not add to 100 due to rounding.
Proximity to Schools: Junior Secondary School Selection and Reasons 5
14
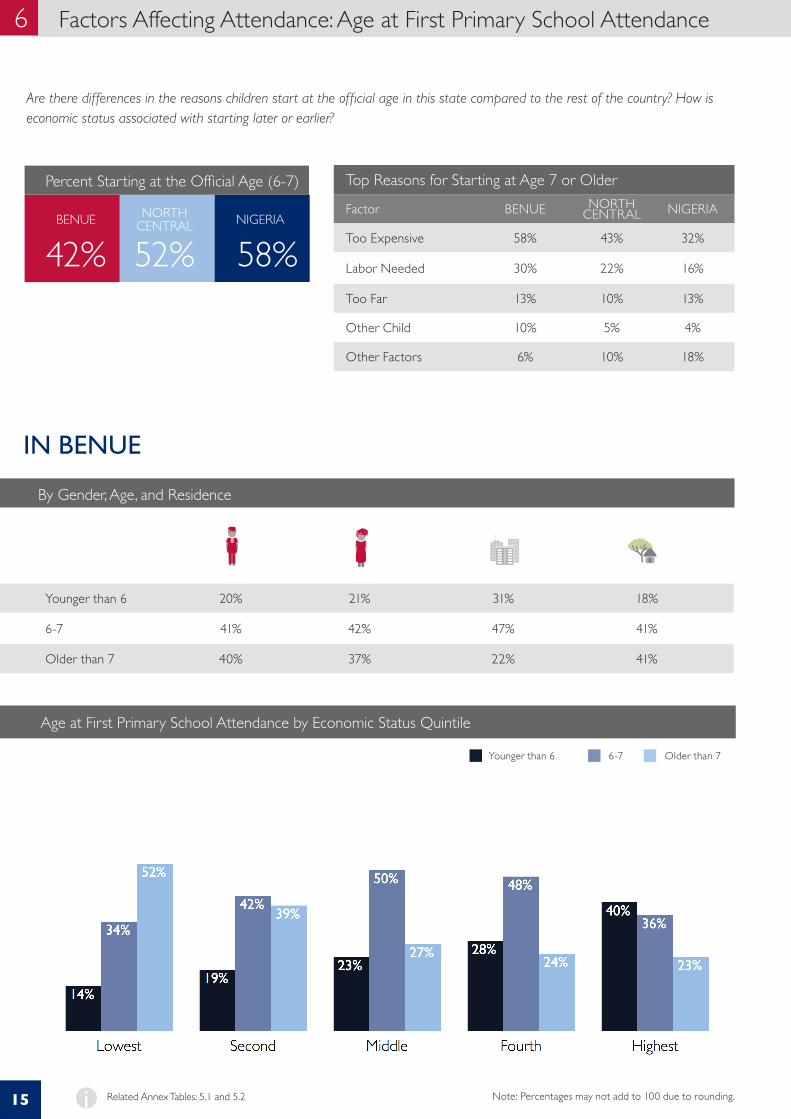
Top Reasons for Starting at Age 7 or Older
Factor BENUE NORTH CENTRAL NIGERIA
Too Expensive 58% 43% 32%
Labor Needed 30% 22% 16%
Too Far 13% 10% 13%
Other Child 10% 5% 4%
Other Factors 6% 10% 18%
Percent Starting at the Official Age (6-7)
Are there differences in the reasons children start at the official age in this state compared to the rest of the country? How is economic status associated with starting later or earlier?
Age at First Primary School Attendance by Economic Status Quintile
By Gender, Age, and Residence
Older than 7
BENUE NORTH CENTRAL NIGERIA
42% 52% 58%
Younger than 6 20% 21% 31% 18%
6-7 41% 42% 47% 41%
Older than 7 40% 37% 22% 41%
IN BENUE
Younger than 6 6-7
Related Annex Tables: 5.1 and 5.2i Note: Percentages may not add to 100 due to rounding.
6 Factors Affecting Attendance: Age at First Primary School Attendance
15
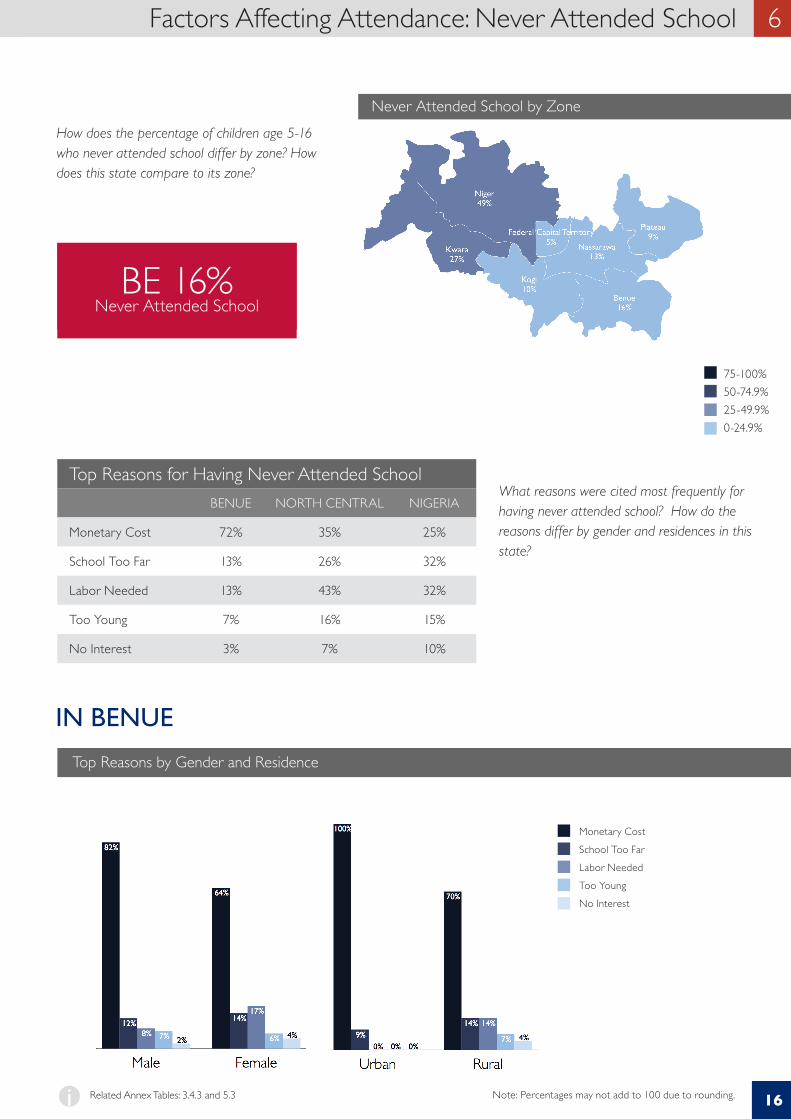
Never Attended School by ZoneHow does the percentage of children age 5-16 who never attended school differ by zone? How does this state compare to its zone?
What reasons were cited most frequently for having never attended school? How do the reasons differ by gender and residences in this state?
Top Reasons by Gender and Residence
BE 16%Never Attended School
Top Reasons for Having Never Attended SchoolBENUE NORTH CENTRAL NIGERIA
Monetary Cost 72% 35% 25%
School Too Far 13% 26% 32%
Labor Needed 13% 43% 32%
Too Young 7% 16% 15%
No Interest 3% 7% 10%
IN BENUE
Monetary CostSchool Too FarLabor NeededToo YoungNo Interest
Related Annex Tables: 3.4.3 and 5.3i Note: Percentages may not add to 100 due to rounding.
Factors Affecting Attendance: Never Attended School 6
16
75-100% 50-74.9% 25-49.9% 0-24.9%
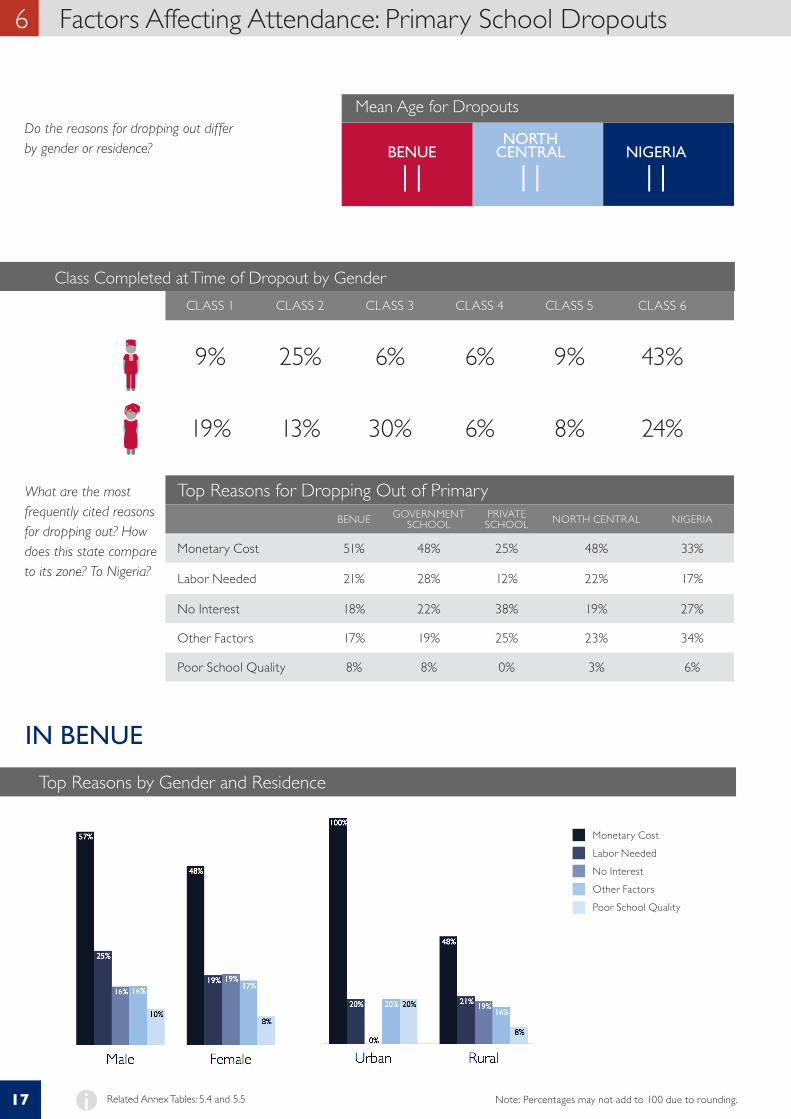
CLASS 1 CLASS 2 CLASS 3 CLASS 4 CLASS 5 CLASS 6
9% 25% 6% 6% 9% 43%
19% 13% 30% 6% 8% 24%
Mean Age for DropoutsDo the reasons for dropping out differ by gender or residence?
Class Completed at Time of Dropout by Gender
Top Reasons by Gender and Residence
What are the most frequently cited reasons for dropping out? How does this state compare to its zone? To Nigeria?
BENUENORTH
CENTRAL NIGERIA
11 11 11
IN BENUE
Monetary CostLabor NeededNo InterestOther FactorsPoor School Quality
Top Reasons for Dropping Out of PrimaryBENUE GOVERNMENT
SCHOOLPRIVATE SCHOOL NORTH CENTRAL NIGERIA
Monetary Cost 51% 48% 25% 48% 33%
Labor Needed 21% 28% 12% 22% 17%
No Interest 18% 22% 38% 19% 27%
Other Factors 17% 19% 25% 23% 34%
Poor School Quality 8% 8% 0% 3% 6%
Related Annex Tables: 5.4 and 5.5i Note: Percentages may not add to 100 due to rounding.
6 Factors Affecting Attendance: Primary School Dropouts
17
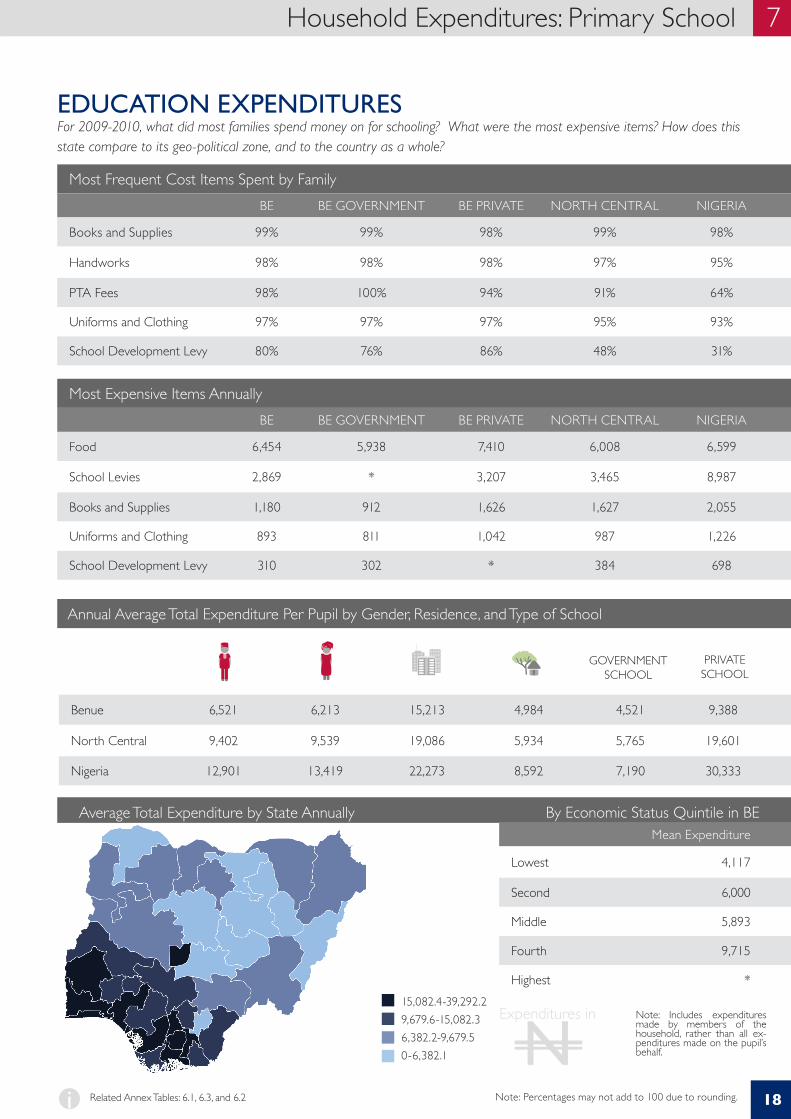
For 2009-2010, what did most families spend money on for schooling? What were the most expensive items? How does this state compare to its geo-political zone, and to the country as a whole?
GOVERNMENTSCHOOL
PRIVATESCHOOL
Annual Average Total Expenditure Per Pupil by Gender, Residence, and Type of School
By Economic Status Quintile in BE
Note: Includes expenditures made by members of the household, rather than all ex-penditures made on the pupil’s behalf.
By Economic Status Quintile in BEAverage Total Expenditure by State Annually
Benue 6,521 6,213 15,213 4,984 4,521 9,388
North Central 9,402 9,539 19,086 5,934 5,765 19,601
Nigeria 12,901 13,419 22,273 8,592 7,190 30,333
Mean Expenditure
Lowest 4,117
Second 6,000
Middle 5,893
Fourth 9,715
Highest *
NExpenditures in
Most Frequent Cost Items Spent by FamilyBE BE GOVERNMENT BE PRIVATE NORTH CENTRAL NIGERIA
Books and Supplies 99% 99% 98% 99% 98%
Handworks 98% 98% 98% 97% 95%
PTA Fees 98% 100% 94% 91% 64%
Uniforms and Clothing 97% 97% 97% 95% 93%
School Development Levy 80% 76% 86% 48% 31%
Most Expensive Items AnnuallyBE BE GOVERNMENT BE PRIVATE NORTH CENTRAL NIGERIA
Food 6,454 5,938 7,410 6,008 6,599
School Levies 2,869 * 3,207 3,465 8,987
Books and Supplies 1,180 912 1,626 1,627 2,055
Uniforms and Clothing 893 811 1,042 987 1,226
School Development Levy 310 302 * 384 698
EDUCATION EXPENDITURES
Related Annex Tables: 6.1, 6.3, and 6.2i Note: Percentages may not add to 100 due to rounding.
Household Expenditures: Primary School 7
18
15,082.4-39,292.2 9,679.6-15,082.3 6,382.2-9,679.50-6,382.1
Note: Includes expenditures made by members of the household, rather than all expenditures made on the pupil’s behalf.
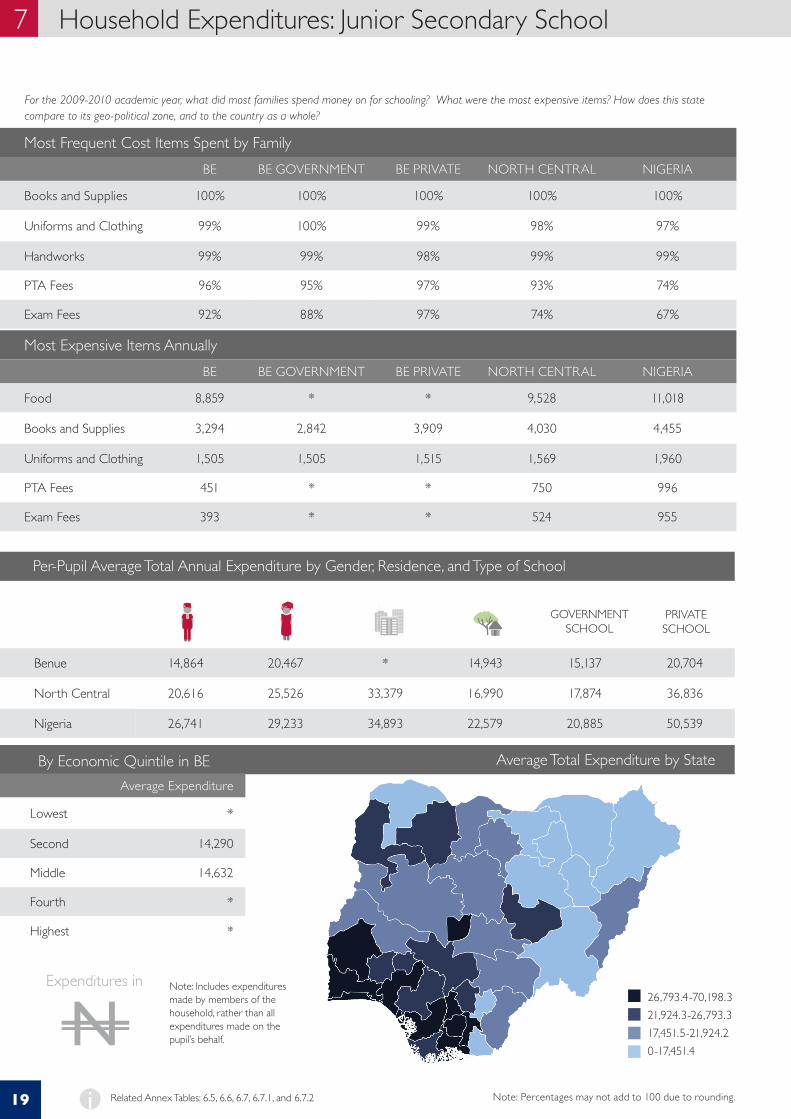
Per-Pupil Average Total Annual Expenditure by Gender, Residence, and Type of School
Average Total Expenditure by State
For the 2009-2010 academic year, what did most families spend money on for schooling? What were the most expensive items? How does this state compare to its geo-political zone, and to the country as a whole?
By Economic Quintile in BEAverage Expenditure
Lowest *
Second 14,290
Middle 14,632
Fourth *
Highest *
GOVERNMENTSCHOOL
PRIVATESCHOOL
26,793.4-70,198.3 21,924.3-26,793.317,451.5-21,924.20-17,451.4
NExpenditures in
Most Frequent Cost Items Spent by FamilyBE BE GOVERNMENT BE PRIVATE NORTH CENTRAL NIGERIA
Books and Supplies 100% 100% 100% 100% 100%
Uniforms and Clothing 99% 100% 99% 98% 97%
Handworks 99% 99% 98% 99% 99%
PTA Fees 96% 95% 97% 93% 74%
Exam Fees 92% 88% 97% 74% 67%
Most Expensive Items AnnuallyBE BE GOVERNMENT BE PRIVATE NORTH CENTRAL NIGERIA
Food 8,859 * * 9,528 11,018
Books and Supplies 3,294 2,842 3,909 4,030 4,455
Uniforms and Clothing 1,505 1,505 1,515 1,569 1,960
PTA Fees 451 * * 750 996
Exam Fees 393 * * 524 955
Benue 14,864 20,467 * 14,943 15,137 20,704
North Central 20,616 25,526 33,379 16,990 17,874 36,836
Nigeria 26,741 29,233 34,893 22,579 20,885 50,539
Related Annex Tables: 6.5, 6.6, 6.7, 6.7.1, and 6.7.2i Note: Percentages may not add to 100 due to rounding.
8 Other Contributions: Time on School-Related Activites—Primary School Other Contributions: Time on School-Related Activites—Primary School 87 Household Expenditures: Junior Secondary School
19
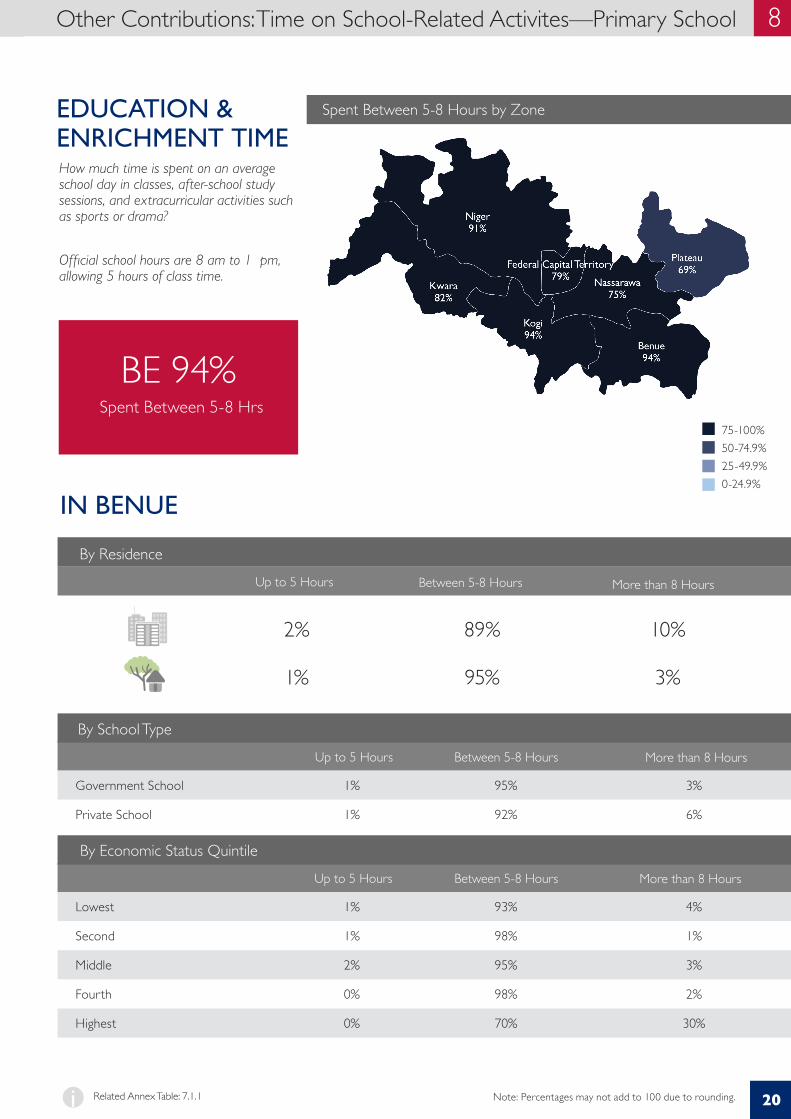
How much time is spent on an average school day in classes, after-school study sessions, and extracurricular activities such as sports or drama?
Official school hours are 8 am to 1 pm, allowing 5 hours of class time.
More than 8 HoursUp to 5 Hours Between 5-8 Hours
By Economic Status Quintile
More than 8 HoursUp to 5 Hours Between 5-8 Hours
By Residence
Spent Between 5-8 Hours by Zone
More than 8 HoursUp to 5 Hours Between 5-8 Hours
By School Type
BE 94%Spent Between 5-8 Hrs
IN BENUE
75-100% 50-74.9% 25-49.9% 0-24.9%
EDUCATION & ENRICHMENT TIME
Related Annex Table: 7.1.1i Note: Percentages may not add to 100 due to rounding.
2% 89% 10%
1% 95% 3%
Lowest 1% 93% 4%
Second 1% 98% 1%
Middle 2% 95% 3%
Fourth 0% 98% 2%
Highest 0% 70% 30%
Government School 1% 95% 3%
Private School 1% 92% 6%
8 Other Contributions: Time on School-Related Activites—Primary School Other Contributions: Time on School-Related Activites—Primary School 8
20
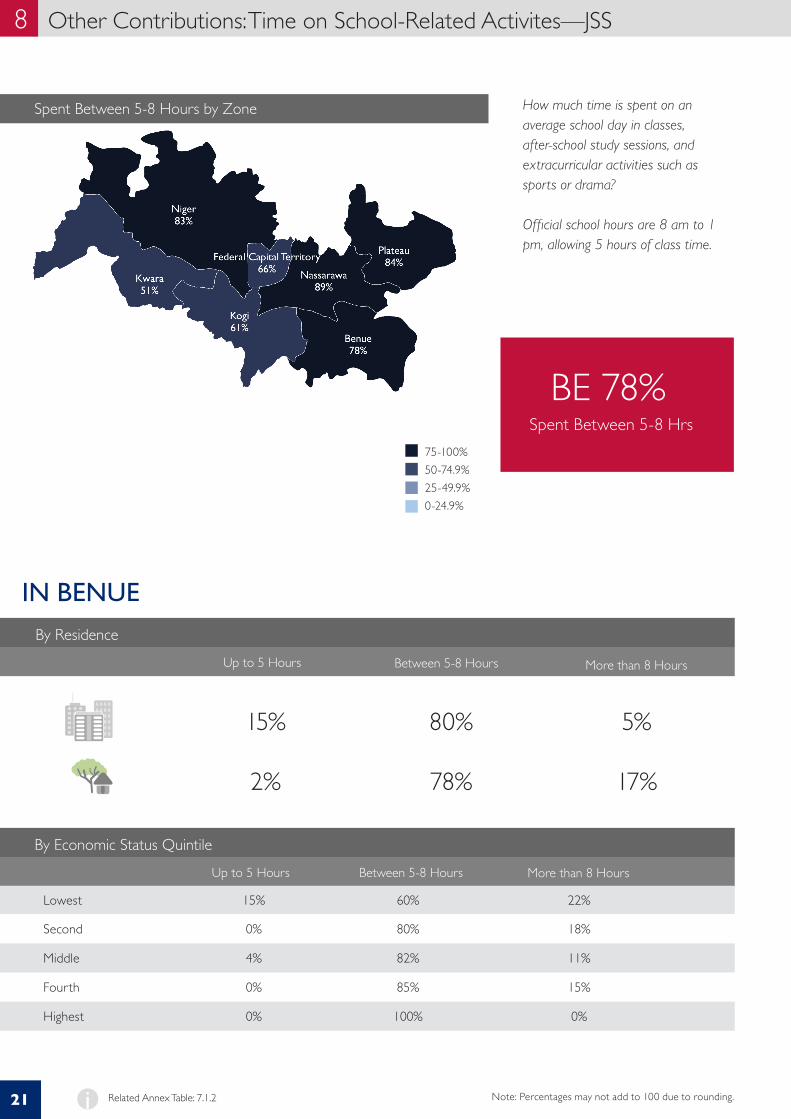
How much time is spent on an average school day in classes, after-school study sessions, and extracurricular activities such as sports or drama?
Official school hours are 8 am to 1 pm, allowing 5 hours of class time.
More than 8 HoursUp to 5 Hours Between 5-8 Hours
By Economic Status Quintile
More than 8 HoursUp to 5 Hours Between 5-8 Hours
By Residence
Spent Between 5-8 Hours by Zone
BE 78%Spent Between 5-8 Hrs
15% 80% 5%
2% 78% 17%
IN BENUE
75-100% 50-74.9% 25-49.9% 0-24.9%
Related Annex Table: 7.1.2i Note: Percentages may not add to 100 due to rounding.
Lowest 15% 60% 22%
Second 0% 80% 18%
Middle 4% 82% 11%
Fourth 0% 85% 15%
Highest 0% 100% 0%
8 Other Contributions: Time on School-Related Activites—JSS
21
Other Contributions: Time on School-Related Activites: No Homework 8
BE 78%Spent Between 5-8 Hrs
No Homework—Primary School
By Zone
By Zone
No Homework—Junior Secondary School
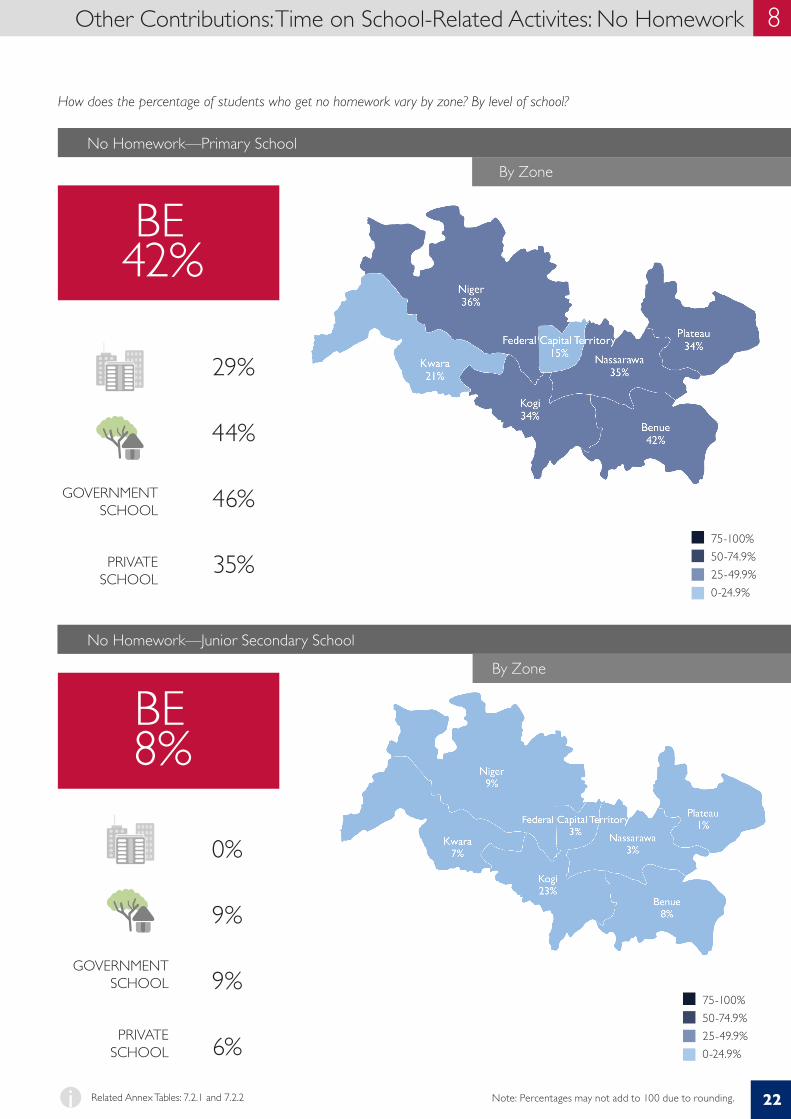
How does the percentage of students who get no homework vary by zone? By level of school?
BE42%
BE8%
29%
44%
46%
35%
0%
9%
9%
6%
GOVERNMENTSCHOOL
PRIVATESCHOOL
75-100% 50-74.9% 25-49.9% 0-24.9%
75-100% 50-74.9% 25-49.9% 0-24.9%
GOVERNMENTSCHOOL
PRIVATESCHOOL
Related Annex Tables: 7.2.1 and 7.2.2i Note: Percentages may not add to 100 due to rounding.
8 Other Contributions: Time on School-Related Activites—JSS Other Contributions: Time on School-Related Activites: No Homework 8
22
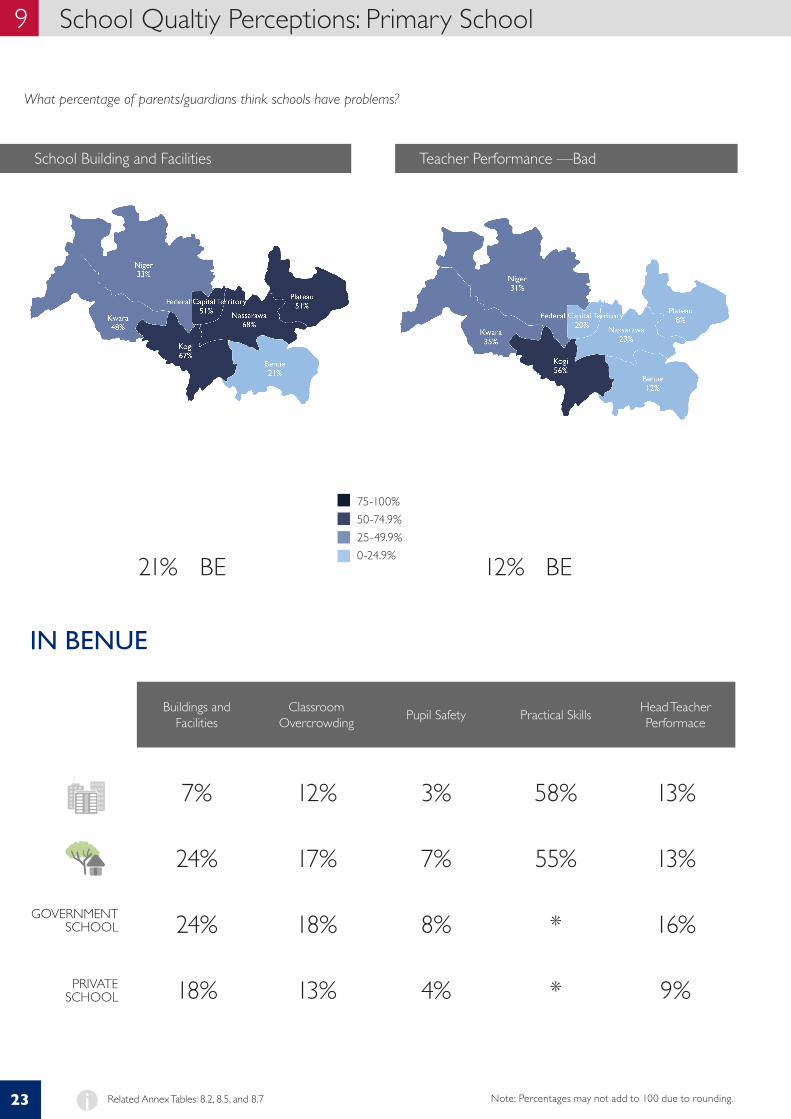
What percentage of parents/guardians think schools have problems?
School Building and Facilities
GOVERNMENTSCHOOL
PRIVATESCHOOL
Buildings and Facilities
Classroom Overcrowding Pupil Safety Practical Skills Head Teacher
Performace
7% 12% 3% 58% 13%
24% 17% 7% 55% 13%
24% 18% 8% * 16%
18% 13% 4% * 9%
IN BENUE
21% BE
Teacher Performance —Bad
12% BE
75-100% 50-74.9% 25-49.9% 0-24.9%
Related Annex Tables: 8.2, 8.5, and 8.7i Note: Percentages may not add to 100 due to rounding.
9 School Qualtiy Perceptions: Primary School
23
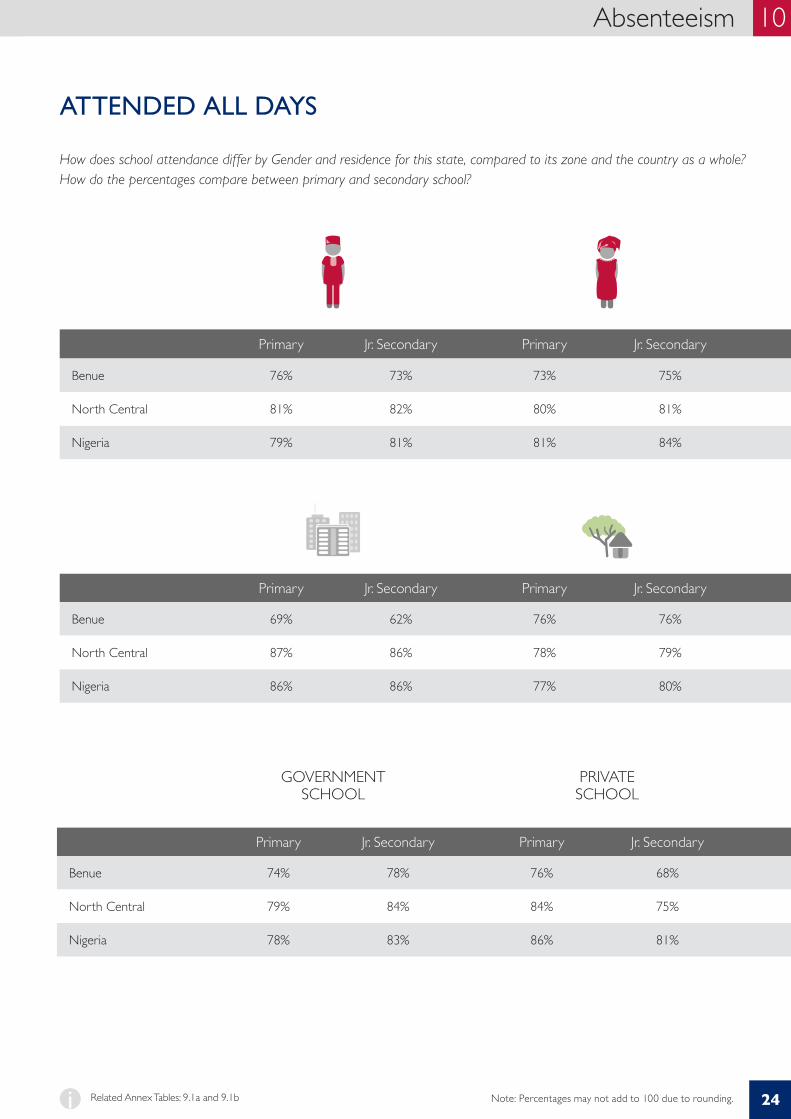
How does school attendance differ by Gender and residence for this state, compared to its zone and the country as a whole? How do the percentages compare between primary and secondary school?
Primary Jr. Secondary Primary Jr. Secondary
Benue 74% 78% 76% 68%
North Central 79% 84% 84% 75%
Nigeria 78% 83% 86% 81%
GOVERNMENT SCHOOL
PRIVATE SCHOOL
ATTENDED ALL DAYS
Primary Jr. Secondary Primary Jr. Secondary
Benue 76% 73% 73% 75%
North Central 81% 82% 80% 81%
Nigeria 79% 81% 81% 84%
Primary Jr. Secondary Primary Jr. Secondary
Benue 69% 62% 76% 76%
North Central 87% 86% 78% 79%
Nigeria 86% 86% 77% 80%
Related Annex Tables: 9.1a and 9.1bi Note: Percentages may not add to 100 due to rounding.
Absenteeism 10
24
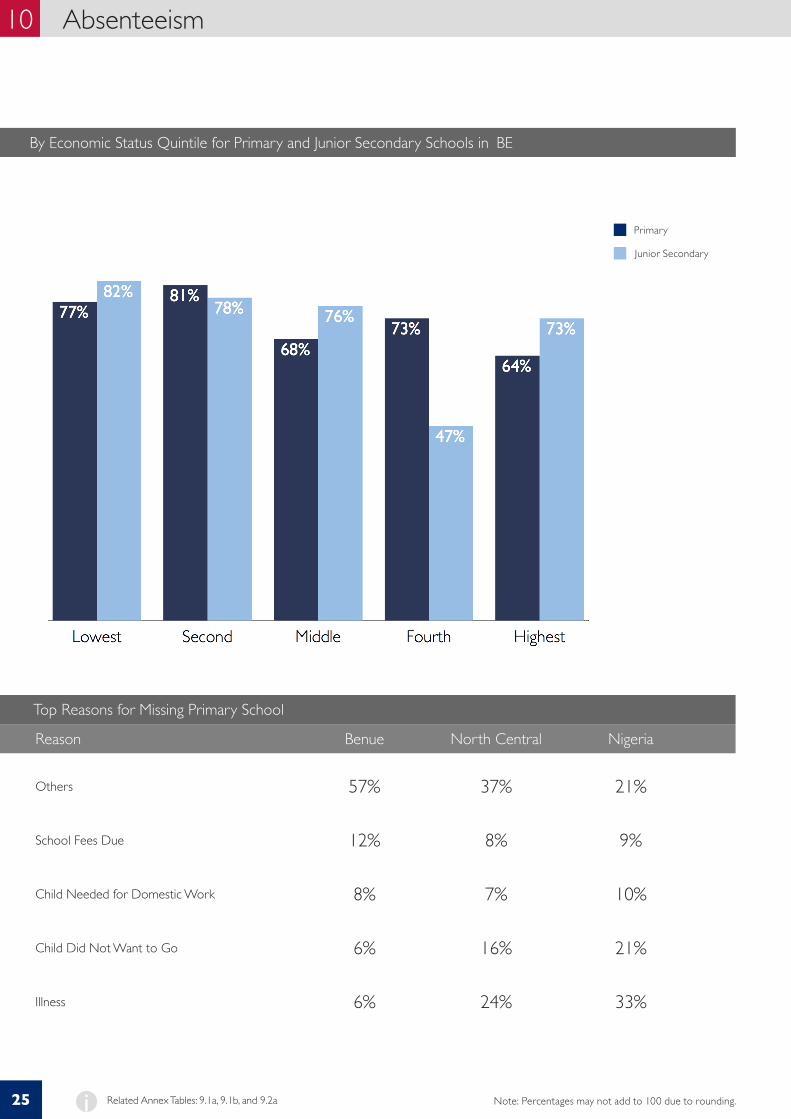
Top Reasons for Missing Primary School
Primary
Junior Secondary
Reason Benue North Central Nigeria
Others 57% 37% 21%
School Fees Due 12% 8% 9%
Child Needed for Domestic Work 8% 7% 10%
Child Did Not Want to Go 6% 16% 21%
Illness 6% 24% 33%
Related Annex Tables: 9.1a, 9.1b, and 9.2a i Note: Percentages may not add to 100 due to rounding.
10 Absenteeism
25
By Economic Status Quintile for Primary and Junior Secondary Schools in BE
ANNEX
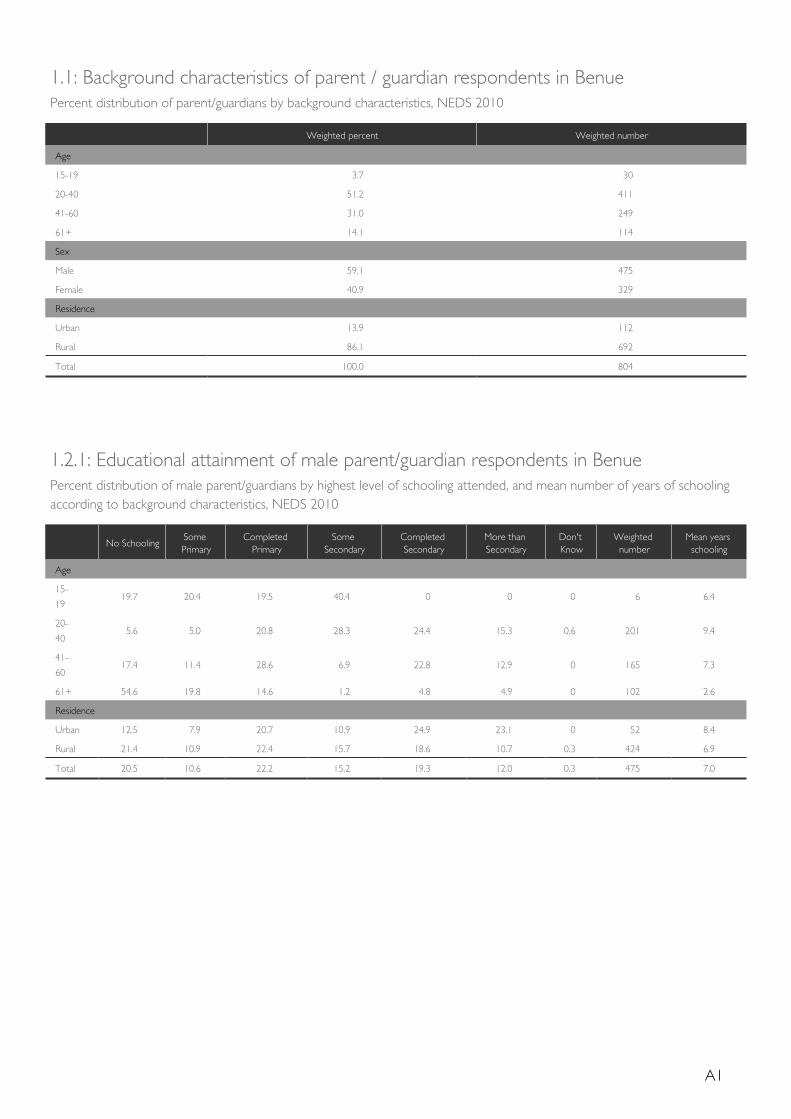
1.1: Background characteristics of parent / guardian respondents in BenuePercent distribution of parent/guardians by background characteristics, NEDS 2010
Weighted percent Weighted number
Age
15-19 3.7 30
20-40 51.2 411
41-60 31.0 249
61+ 14.1 114
Sex
Male 59.1 475
Female 40.9 329
Residence
Urban 13.9 112
Rural 86.1 692
Total 100.0 804
1.2.1: Educational attainment of male parent/guardian respondents in BenuePercent distribution of male parent/guardians by highest level of schooling attended, and mean number of years of schooling according to background characteristics, NEDS 2010
No SchoolingSome Primary
Completed Primary
Some Secondary
Completed Secondary
More than Secondary
Don't Know
Weighted number
Mean years schooling
Age
15-
1919.7 20.4 19.5 40.4 0 0 0 6 6.4
20-
405.6 5.0 20.8 28.3 24.4 15.3 0.6 201 9.4
41-
6017.4 11.4 28.6 6.9 22.8 12.9 0 165 7.3
61+ 54.6 19.8 14.6 1.2 4.8 4.9 0 102 2.6
Residence
Urban 12.5 7.9 20.7 10.9 24.9 23.1 0 52 8.4
Rural 21.4 10.9 22.4 15.7 18.6 10.7 0.3 424 6.9
Total 20.5 10.6 22.2 15.2 19.3 12.0 0.3 475 7.0
A1
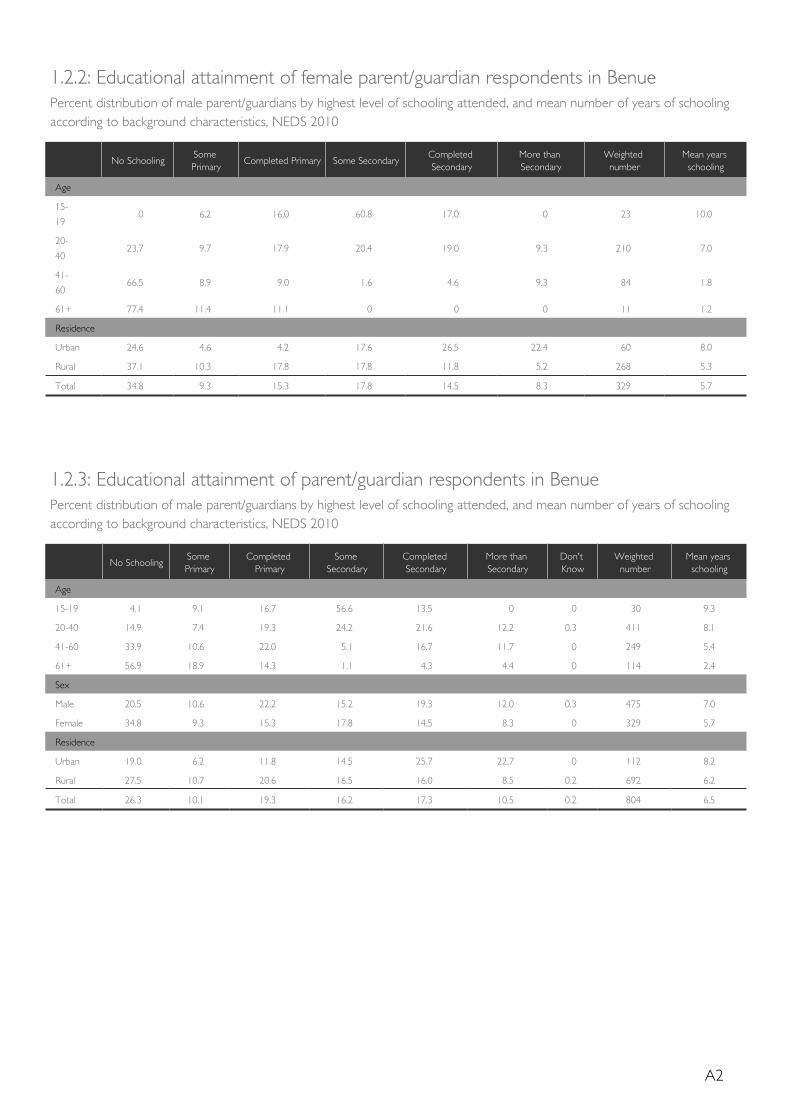
1.2.2: Educational attainment of female parent/guardian respondents in BenuePercent distribution of male parent/guardians by highest level of schooling attended, and mean number of years of schooling according to background characteristics, NEDS 2010
No SchoolingSome Primary
Completed Primary Some SecondaryCompleted Secondary
More than Secondary
Weighted number
Mean years schooling
Age
15-
190 6.2 16.0 60.8 17.0 0 23 10.0
20-
4023.7 9.7 17.9 20.4 19.0 9.3 210 7.0
41-
6066.5 8.9 9.0 1.6 4.6 9.3 84 1.8
61+ 77.4 11.4 11.1 0 0 0 11 1.2
Residence
Urban 24.6 4.6 4.2 17.6 26.5 22.4 60 8.0
Rural 37.1 10.3 17.8 17.8 11.8 5.2 268 5.3
Total 34.8 9.3 15.3 17.8 14.5 8.3 329 5.7
1.2.3: Educational attainment of parent/guardian respondents in BenuePercent distribution of male parent/guardians by highest level of schooling attended, and mean number of years of schooling according to background characteristics, NEDS 2010
No SchoolingSome Primary
Completed Primary
Some Secondary
Completed Secondary
More than Secondary
Don't Know
Weighted number
Mean years schooling
Age
15-19 4.1 9.1 16.7 56.6 13.5 0 0 30 9.3
20-40 14.9 7.4 19.3 24.2 21.6 12.2 0.3 411 8.1
41-60 33.9 10.6 22.0 5.1 16.7 11.7 0 249 5.4
61+ 56.9 18.9 14.3 1.1 4.3 4.4 0 114 2.4
Sex
Male 20.5 10.6 22.2 15.2 19.3 12.0 0.3 475 7.0
Female 34.8 9.3 15.3 17.8 14.5 8.3 0 329 5.7
Residence
Urban 19.0 6.2 11.8 14.5 25.7 22.7 0 112 8.2
Rural 27.5 10.7 20.6 16.5 16.0 8.5 0.2 692 6.2
Total 26.3 10.1 19.3 16.2 17.3 10.5 0.2 804 6.5
A2
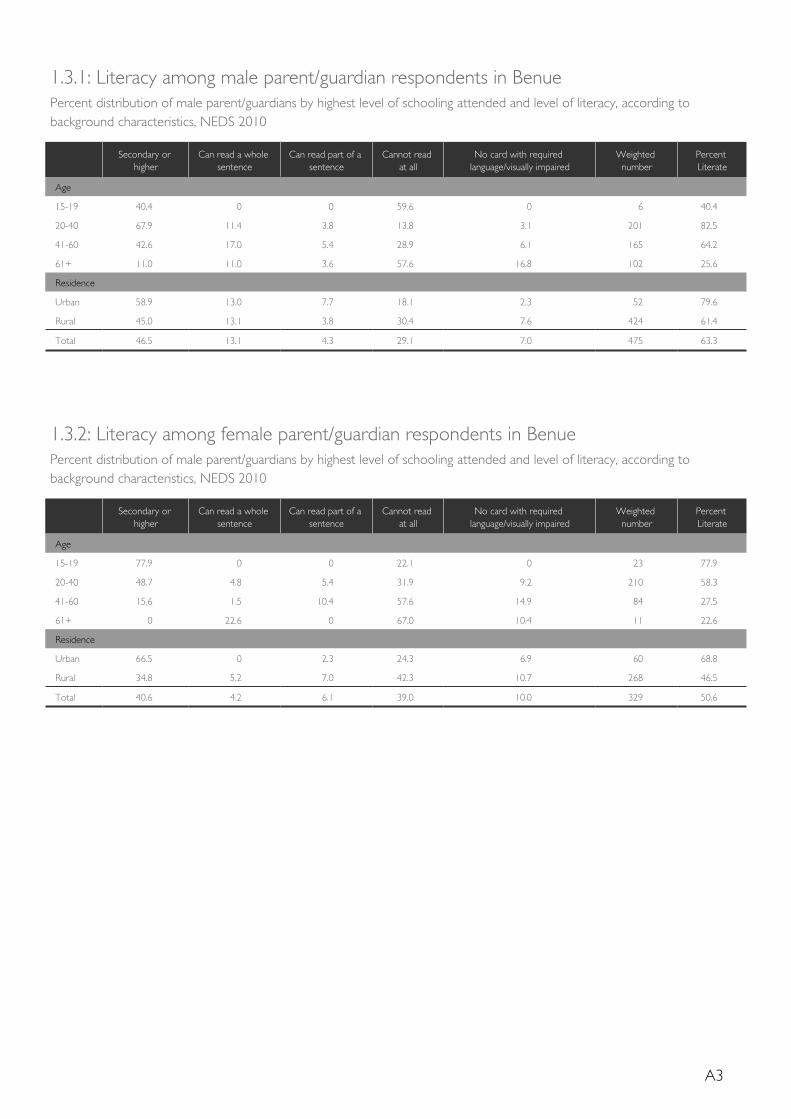
1.3.1: Literacy among male parent/guardian respondents in BenuePercent distribution of male parent/guardians by highest level of schooling attended and level of literacy, according to background characteristics, NEDS 2010
Secondary or higher
Can read a whole sentence
Can read part of a sentence
Cannot read at all
No card with required language/visually impaired
Weighted number
Percent Literate
Age
15-19 40.4 0 0 59.6 0 6 40.4
20-40 67.9 11.4 3.8 13.8 3.1 201 82.5
41-60 42.6 17.0 5.4 28.9 6.1 165 64.2
61+ 11.0 11.0 3.6 57.6 16.8 102 25.6
Residence
Urban 58.9 13.0 7.7 18.1 2.3 52 79.6
Rural 45.0 13.1 3.8 30.4 7.6 424 61.4
Total 46.5 13.1 4.3 29.1 7.0 475 63.3
1.3.2: Literacy among female parent/guardian respondents in BenuePercent distribution of male parent/guardians by highest level of schooling attended and level of literacy, according to background characteristics, NEDS 2010
Secondary or higher
Can read a whole sentence
Can read part of a sentence
Cannot read at all
No card with required language/visually impaired
Weighted number
Percent Literate
Age
15-19 77.9 0 0 22.1 0 23 77.9
20-40 48.7 4.8 5.4 31.9 9.2 210 58.3
41-60 15.6 1.5 10.4 57.6 14.9 84 27.5
61+ 0 22.6 0 67.0 10.4 11 22.6
Residence
Urban 66.5 0 2.3 24.3 6.9 60 68.8
Rural 34.8 5.2 7.0 42.3 10.7 268 46.5
Total 40.6 4.2 6.1 39.0 10.0 329 50.6
A3
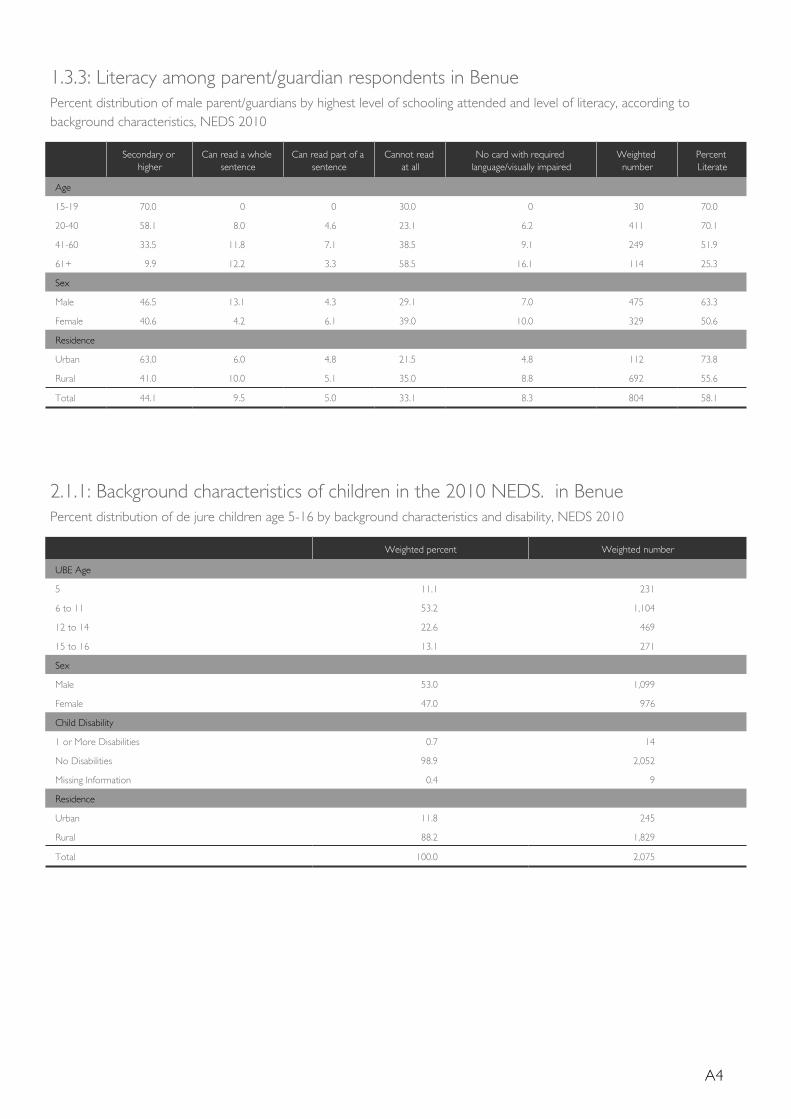
1.3.3: Literacy among parent/guardian respondents in BenuePercent distribution of male parent/guardians by highest level of schooling attended and level of literacy, according to background characteristics, NEDS 2010
Secondary or higher
Can read a whole sentence
Can read part of a sentence
Cannot read at all
No card with required language/visually impaired
Weighted number
Percent Literate
Age
15-19 70.0 0 0 30.0 0 30 70.0
20-40 58.1 8.0 4.6 23.1 6.2 411 70.1
41-60 33.5 11.8 7.1 38.5 9.1 249 51.9
61+ 9.9 12.2 3.3 58.5 16.1 114 25.3
Sex
Male 46.5 13.1 4.3 29.1 7.0 475 63.3
Female 40.6 4.2 6.1 39.0 10.0 329 50.6
Residence
Urban 63.0 6.0 4.8 21.5 4.8 112 73.8
Rural 41.0 10.0 5.1 35.0 8.8 692 55.6
Total 44.1 9.5 5.0 33.1 8.3 804 58.1
2.1.1: Background characteristics of children in the 2010 NEDS. in BenuePercent distribution of de jure children age 5-16 by background characteristics and disability, NEDS 2010
Weighted percent Weighted number
UBE Age
5 11.1 231
6 to 11 53.2 1,104
12 to 14 22.6 469
15 to 16 13.1 271
Sex
Male 53.0 1,099
Female 47.0 976
Child Disability
1 or More Disabilities 0.7 14
No Disabilities 98.9 2,052
Missing Information 0.4 9
Residence
Urban 11.8 245
Rural 88.2 1,829
Total 100.0 2,075
A4
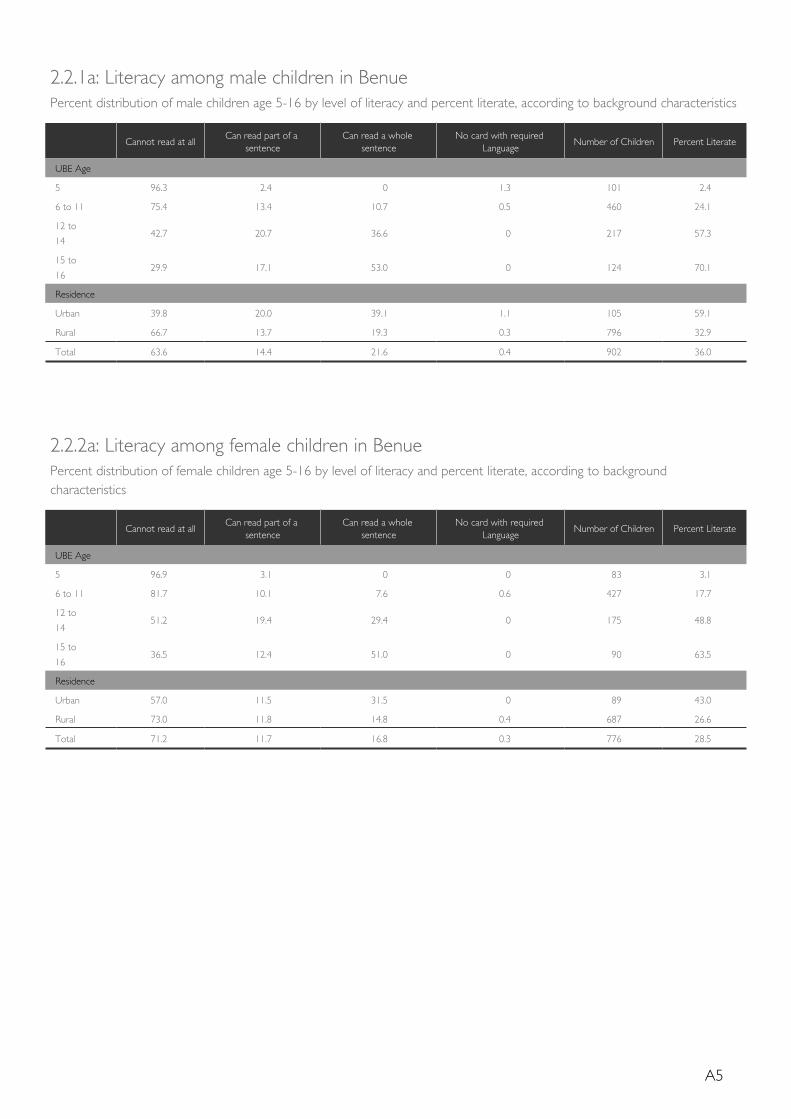
2.2.1a: Literacy among male children in BenuePercent distribution of male children age 5-16 by level of literacy and percent literate, according to background characteristics
Cannot read at allCan read part of a
sentenceCan read a whole
sentenceNo card with required
LanguageNumber of Children Percent Literate
UBE Age
5 96.3 2.4 0 1.3 101 2.4
6 to 11 75.4 13.4 10.7 0.5 460 24.1
12 to
1442.7 20.7 36.6 0 217 57.3
15 to
1629.9 17.1 53.0 0 124 70.1
Residence
Urban 39.8 20.0 39.1 1.1 105 59.1
Rural 66.7 13.7 19.3 0.3 796 32.9
Total 63.6 14.4 21.6 0.4 902 36.0
2.2.2a: Literacy among female children in BenuePercent distribution of female children age 5-16 by level of literacy and percent literate, according to background characteristics
Cannot read at allCan read part of a
sentenceCan read a whole
sentenceNo card with required
LanguageNumber of Children Percent Literate
UBE Age
5 96.9 3.1 0 0 83 3.1
6 to 11 81.7 10.1 7.6 0.6 427 17.7
12 to
1451.2 19.4 29.4 0 175 48.8
15 to
1636.5 12.4 51.0 0 90 63.5
Residence
Urban 57.0 11.5 31.5 0 89 43.0
Rural 73.0 11.8 14.8 0.4 687 26.6
Total 71.2 11.7 16.8 0.3 776 28.5
A5
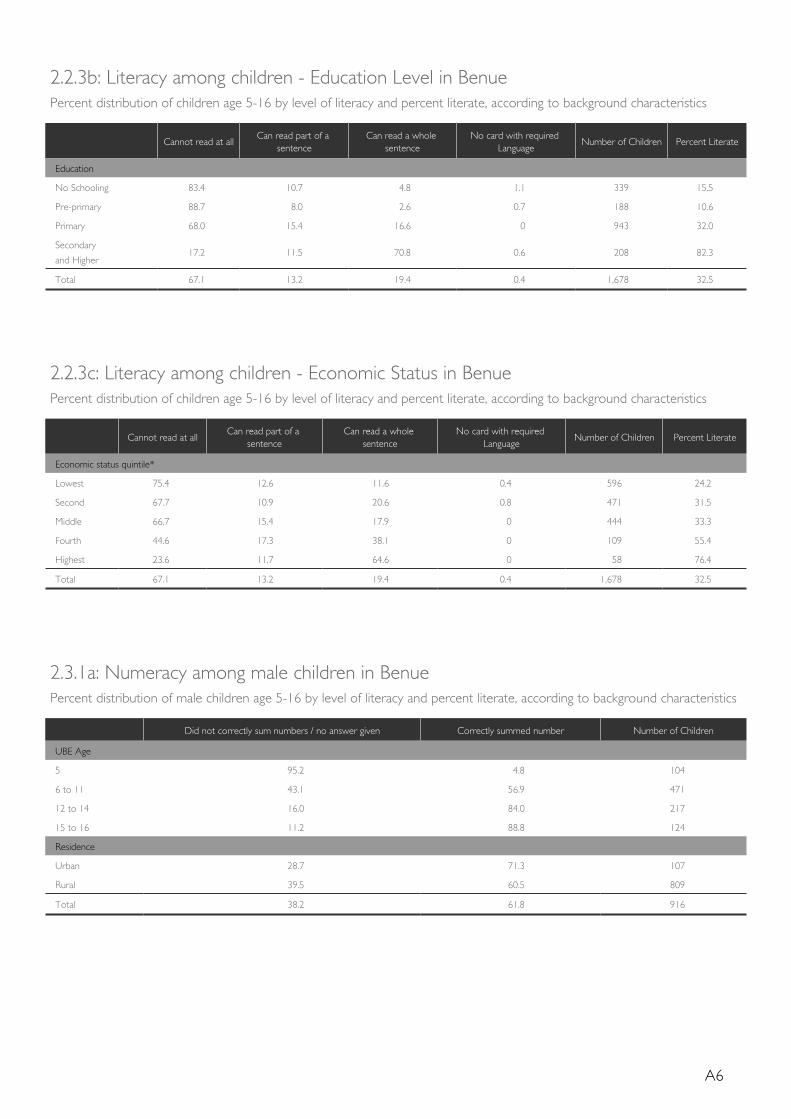
2.2.3b: Literacy among children - Education Level in BenuePercent distribution of children age 5-16 by level of literacy and percent literate, according to background characteristics
Cannot read at allCan read part of a
sentenceCan read a whole
sentenceNo card with required
LanguageNumber of Children Percent Literate
Education
No Schooling 83.4 10.7 4.8 1.1 339 15.5
Pre-primary 88.7 8.0 2.6 0.7 188 10.6
Primary 68.0 15.4 16.6 0 943 32.0
Secondary
and Higher17.2 11.5 70.8 0.6 208 82.3
Total 67.1 13.2 19.4 0.4 1,678 32.5
2.2.3c: Literacy among children - Economic Status in BenuePercent distribution of children age 5-16 by level of literacy and percent literate, according to background characteristics
Cannot read at allCan read part of a
sentenceCan read a whole
sentenceNo card with required
LanguageNumber of Children Percent Literate
Economic status quintile*
Lowest 75.4 12.6 11.6 0.4 596 24.2
Second 67.7 10.9 20.6 0.8 471 31.5
Middle 66.7 15.4 17.9 0 444 33.3
Fourth 44.6 17.3 38.1 0 109 55.4
Highest 23.6 11.7 64.6 0 58 76.4
Total 67.1 13.2 19.4 0.4 1,678 32.5
2.3.1a: Numeracy among male children in BenuePercent distribution of male children age 5-16 by level of literacy and percent literate, according to background characteristics
Did not correctly sum numbers / no answer given Correctly summed number Number of Children
UBE Age
5 95.2 4.8 104
6 to 11 43.1 56.9 471
12 to 14 16.0 84.0 217
15 to 16 11.2 88.8 124
Residence
Urban 28.7 71.3 107
Rural 39.5 60.5 809
Total 38.2 61.8 916
A6
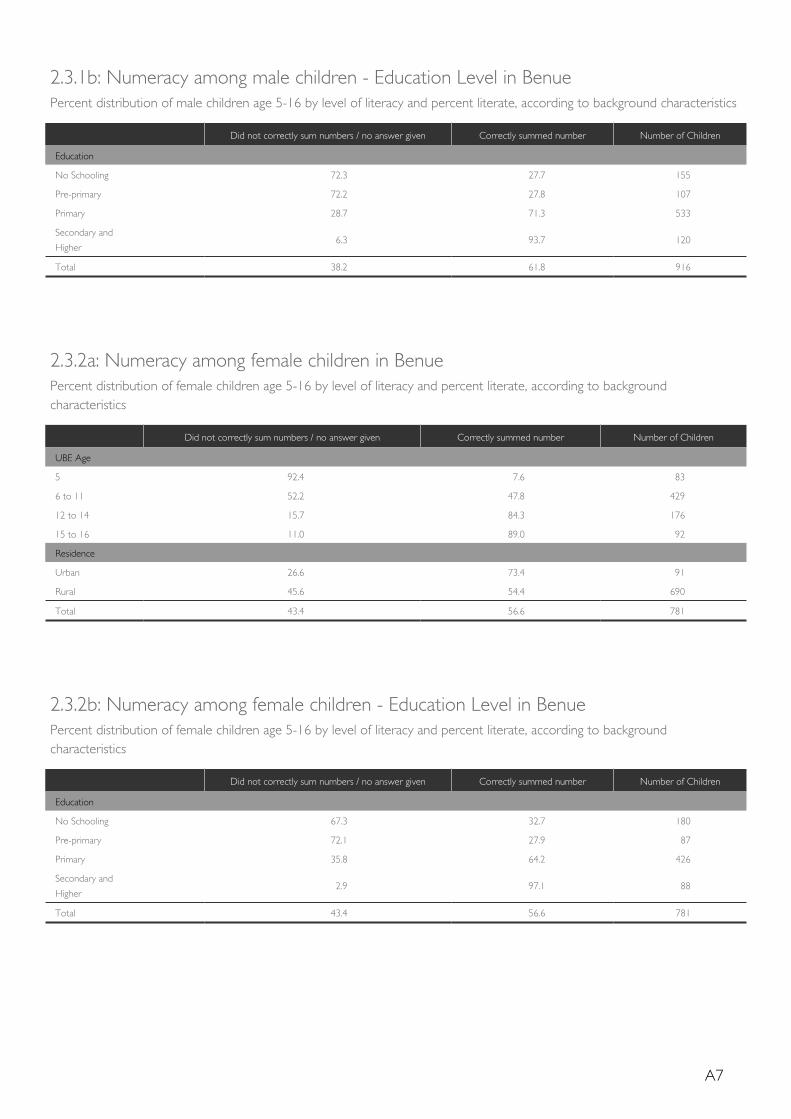
2.3.1b: Numeracy among male children - Education Level in BenuePercent distribution of male children age 5-16 by level of literacy and percent literate, according to background characteristics
Did not correctly sum numbers / no answer given Correctly summed number Number of Children
Education
No Schooling 72.3 27.7 155
Pre-primary 72.2 27.8 107
Primary 28.7 71.3 533
Secondary and
Higher6.3 93.7 120
Total 38.2 61.8 916
2.3.2a: Numeracy among female children in BenuePercent distribution of female children age 5-16 by level of literacy and percent literate, according to background characteristics
Did not correctly sum numbers / no answer given Correctly summed number Number of Children
UBE Age
5 92.4 7.6 83
6 to 11 52.2 47.8 429
12 to 14 15.7 84.3 176
15 to 16 11.0 89.0 92
Residence
Urban 26.6 73.4 91
Rural 45.6 54.4 690
Total 43.4 56.6 781
2.3.2b: Numeracy among female children - Education Level in BenuePercent distribution of female children age 5-16 by level of literacy and percent literate, according to background characteristics
Did not correctly sum numbers / no answer given Correctly summed number Number of Children
Education
No Schooling 67.3 32.7 180
Pre-primary 72.1 27.9 87
Primary 35.8 64.2 426
Secondary and
Higher2.9 97.1 88
Total 43.4 56.6 781
A7
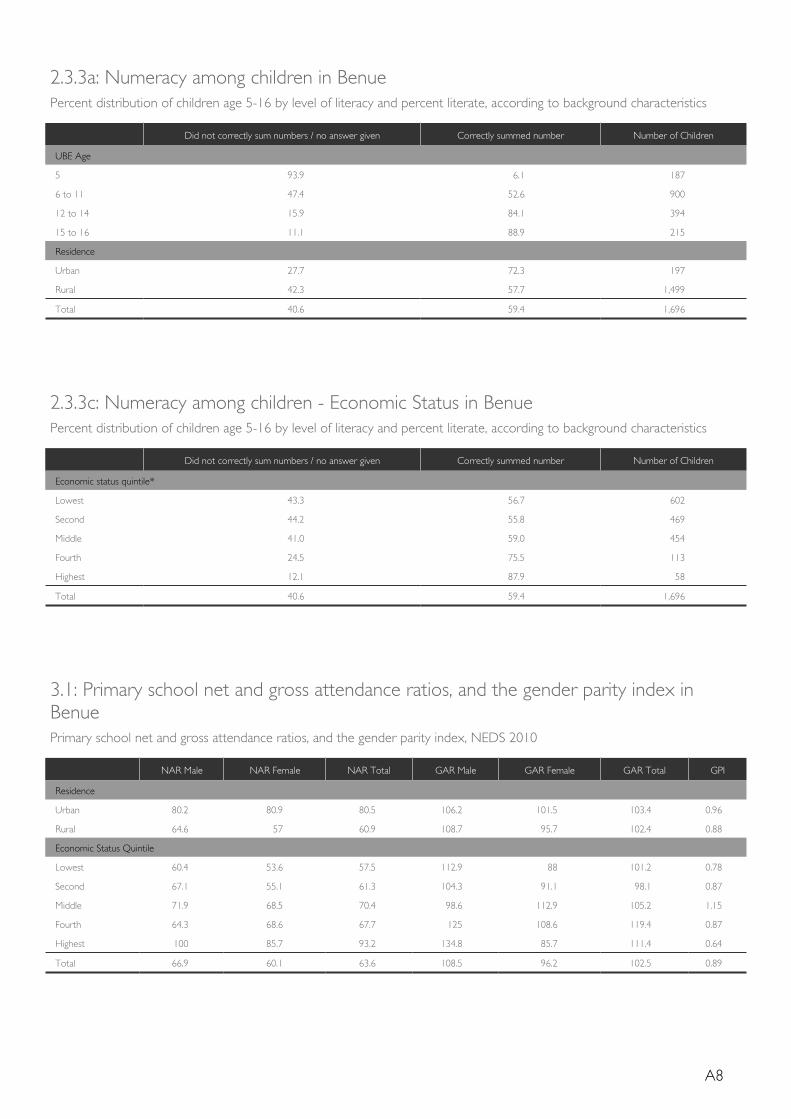
2.3.3a: Numeracy among children in BenuePercent distribution of children age 5-16 by level of literacy and percent literate, according to background characteristics
Did not correctly sum numbers / no answer given Correctly summed number Number of Children
UBE Age
5 93.9 6.1 187
6 to 11 47.4 52.6 900
12 to 14 15.9 84.1 394
15 to 16 11.1 88.9 215
Residence
Urban 27.7 72.3 197
Rural 42.3 57.7 1,499
Total 40.6 59.4 1,696
2.3.3c: Numeracy among children - Economic Status in BenuePercent distribution of children age 5-16 by level of literacy and percent literate, according to background characteristics
Did not correctly sum numbers / no answer given Correctly summed number Number of Children
Economic status quintile*
Lowest 43.3 56.7 602
Second 44.2 55.8 469
Middle 41.0 59.0 454
Fourth 24.5 75.5 113
Highest 12.1 87.9 58
Total 40.6 59.4 1,696
3.1: Primary school net and gross attendance ratios, and the gender parity index in BenuePrimary school net and gross attendance ratios, and the gender parity index, NEDS 2010
NAR Male NAR Female NAR Total GAR Male GAR Female GAR Total GPI
Residence
Urban 80.2 80.9 80.5 106.2 101.5 103.4 0.96
Rural 64.6 57 60.9 108.7 95.7 102.4 0.88
Economic Status Quintile
Lowest 60.4 53.6 57.5 112.9 88 101.2 0.78
Second 67.1 55.1 61.3 104.3 91.1 98.1 0.87
Middle 71.9 68.5 70.4 98.6 112.9 105.2 1.15
Fourth 64.3 68.6 67.7 125 108.6 119.4 0.87
Highest 100 85.7 93.2 134.8 85.7 111.4 0.64
Total 66.9 60.1 63.6 108.5 96.2 102.5 0.89
A8
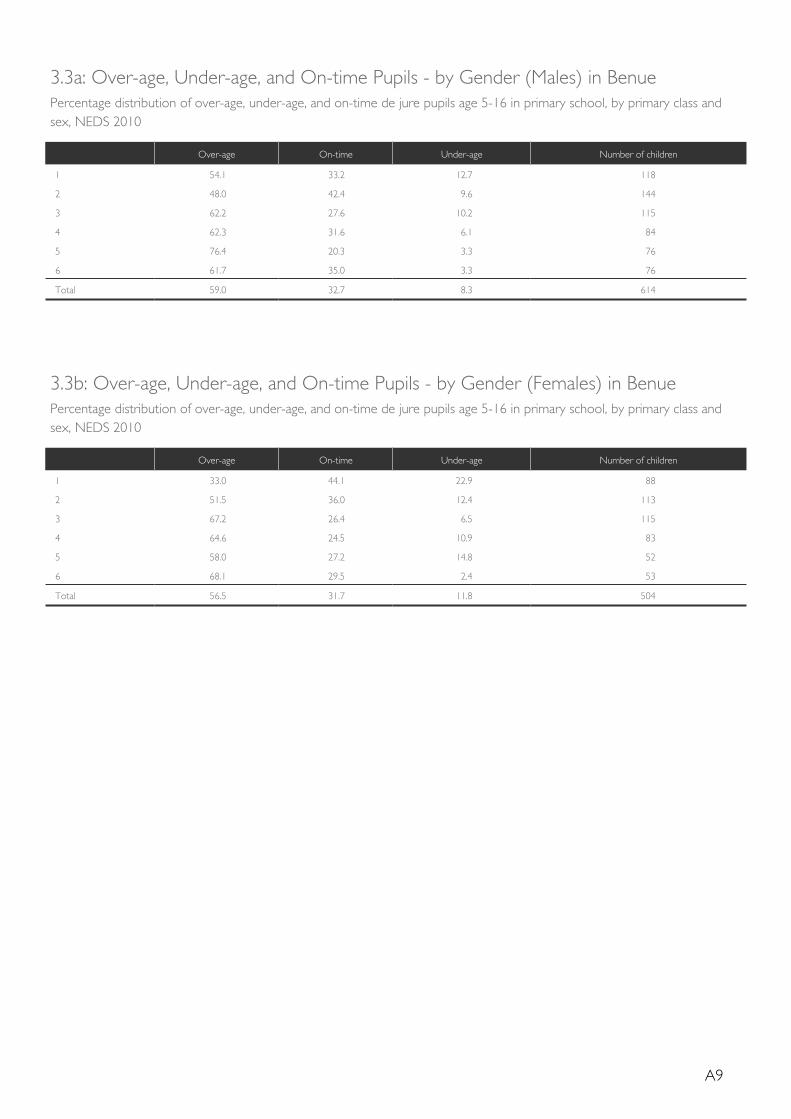
3.3a: Over-age, Under-age, and On-time Pupils - by Gender (Males) in BenuePercentage distribution of over-age, under-age, and on-time de jure pupils age 5-16 in primary school, by primary class and sex, NEDS 2010
Over-age On-time Under-age Number of children
1 54.1 33.2 12.7 118
2 48.0 42.4 9.6 144
3 62.2 27.6 10.2 115
4 62.3 31.6 6.1 84
5 76.4 20.3 3.3 76
6 61.7 35.0 3.3 76
Total 59.0 32.7 8.3 614
3.3b: Over-age, Under-age, and On-time Pupils - by Gender (Females) in BenuePercentage distribution of over-age, under-age, and on-time de jure pupils age 5-16 in primary school, by primary class and sex, NEDS 2010
Over-age On-time Under-age Number of children
1 33.0 44.1 22.9 88
2 51.5 36.0 12.4 113
3 67.2 26.4 6.5 115
4 64.6 24.5 10.9 83
5 58.0 27.2 14.8 52
6 68.1 29.5 2.4 53
Total 56.5 31.7 11.8 504
A9
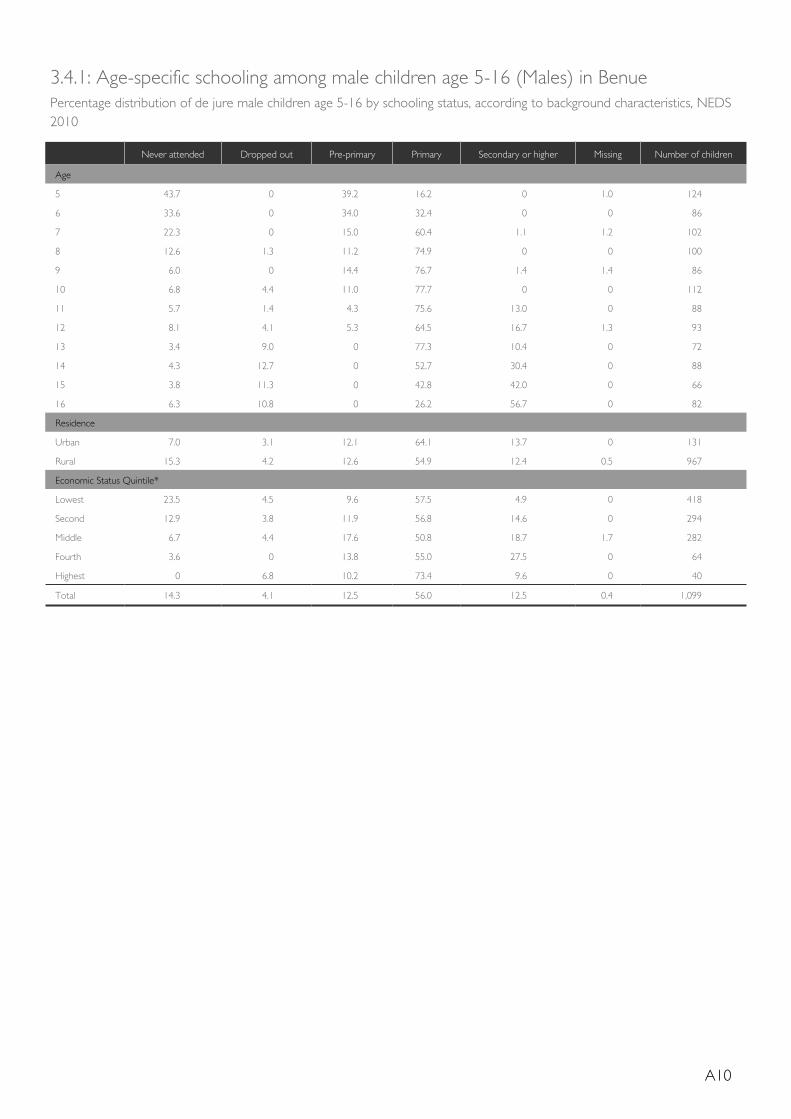
3.4.1: Age-specific schooling among male children age 5-16 (Males) in BenuePercentage distribution of de jure male children age 5-16 by schooling status, according to background characteristics, NEDS 2010
Never attended Dropped out Pre-primary Primary Secondary or higher Missing Number of children
Age
5 43.7 0 39.2 16.2 0 1.0 124
6 33.6 0 34.0 32.4 0 0 86
7 22.3 0 15.0 60.4 1.1 1.2 102
8 12.6 1.3 11.2 74.9 0 0 100
9 6.0 0 14.4 76.7 1.4 1.4 86
10 6.8 4.4 11.0 77.7 0 0 112
11 5.7 1.4 4.3 75.6 13.0 0 88
12 8.1 4.1 5.3 64.5 16.7 1.3 93
13 3.4 9.0 0 77.3 10.4 0 72
14 4.3 12.7 0 52.7 30.4 0 88
15 3.8 11.3 0 42.8 42.0 0 66
16 6.3 10.8 0 26.2 56.7 0 82
Residence
Urban 7.0 3.1 12.1 64.1 13.7 0 131
Rural 15.3 4.2 12.6 54.9 12.4 0.5 967
Economic Status Quintile*
Lowest 23.5 4.5 9.6 57.5 4.9 0 418
Second 12.9 3.8 11.9 56.8 14.6 0 294
Middle 6.7 4.4 17.6 50.8 18.7 1.7 282
Fourth 3.6 0 13.8 55.0 27.5 0 64
Highest 0 6.8 10.2 73.4 9.6 0 40
Total 14.3 4.1 12.5 56.0 12.5 0.4 1,099
A10
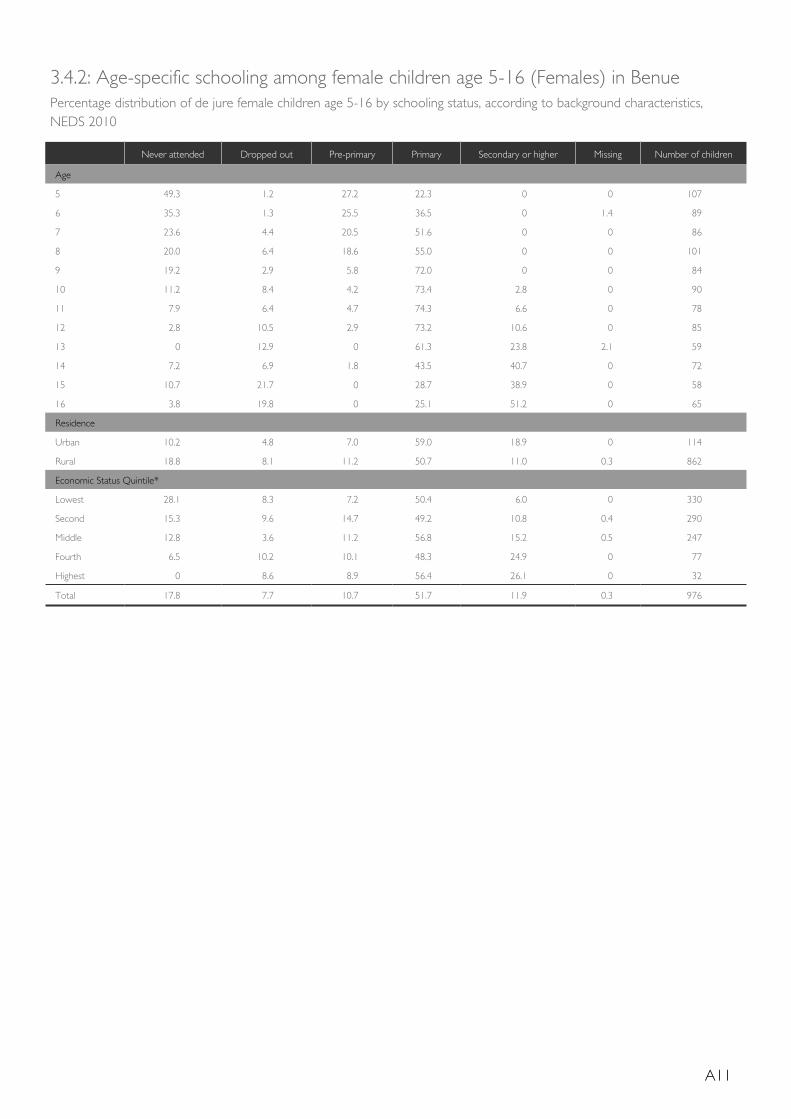
3.4.2: Age-specific schooling among female children age 5-16 (Females) in BenuePercentage distribution of de jure female children age 5-16 by schooling status, according to background characteristics, NEDS 2010
Never attended Dropped out Pre-primary Primary Secondary or higher Missing Number of children
Age
5 49.3 1.2 27.2 22.3 0 0 107
6 35.3 1.3 25.5 36.5 0 1.4 89
7 23.6 4.4 20.5 51.6 0 0 86
8 20.0 6.4 18.6 55.0 0 0 101
9 19.2 2.9 5.8 72.0 0 0 84
10 11.2 8.4 4.2 73.4 2.8 0 90
11 7.9 6.4 4.7 74.3 6.6 0 78
12 2.8 10.5 2.9 73.2 10.6 0 85
13 0 12.9 0 61.3 23.8 2.1 59
14 7.2 6.9 1.8 43.5 40.7 0 72
15 10.7 21.7 0 28.7 38.9 0 58
16 3.8 19.8 0 25.1 51.2 0 65
Residence
Urban 10.2 4.8 7.0 59.0 18.9 0 114
Rural 18.8 8.1 11.2 50.7 11.0 0.3 862
Economic Status Quintile*
Lowest 28.1 8.3 7.2 50.4 6.0 0 330
Second 15.3 9.6 14.7 49.2 10.8 0.4 290
Middle 12.8 3.6 11.2 56.8 15.2 0.5 247
Fourth 6.5 10.2 10.1 48.3 24.9 0 77
Highest 0 8.6 8.9 56.4 26.1 0 32
Total 17.8 7.7 10.7 51.7 11.9 0.3 976
A11
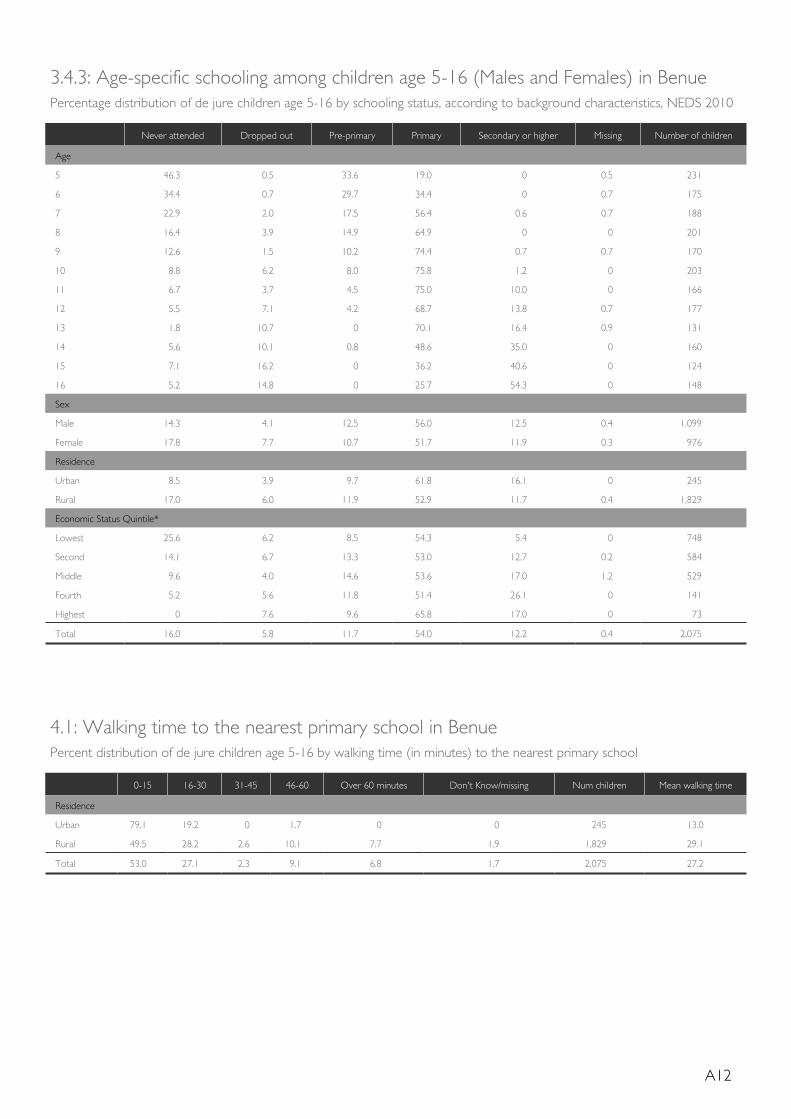
3.4.3: Age-specific schooling among children age 5-16 (Males and Females) in BenuePercentage distribution of de jure children age 5-16 by schooling status, according to background characteristics, NEDS 2010
Never attended Dropped out Pre-primary Primary Secondary or higher Missing Number of children
Age
5 46.3 0.5 33.6 19.0 0 0.5 231
6 34.4 0.7 29.7 34.4 0 0.7 175
7 22.9 2.0 17.5 56.4 0.6 0.7 188
8 16.4 3.9 14.9 64.9 0 0 201
9 12.6 1.5 10.2 74.4 0.7 0.7 170
10 8.8 6.2 8.0 75.8 1.2 0 203
11 6.7 3.7 4.5 75.0 10.0 0 166
12 5.5 7.1 4.2 68.7 13.8 0.7 177
13 1.8 10.7 0 70.1 16.4 0.9 131
14 5.6 10.1 0.8 48.6 35.0 0 160
15 7.1 16.2 0 36.2 40.6 0 124
16 5.2 14.8 0 25.7 54.3 0 148
Sex
Male 14.3 4.1 12.5 56.0 12.5 0.4 1,099
Female 17.8 7.7 10.7 51.7 11.9 0.3 976
Residence
Urban 8.5 3.9 9.7 61.8 16.1 0 245
Rural 17.0 6.0 11.9 52.9 11.7 0.4 1,829
Economic Status Quintile*
Lowest 25.6 6.2 8.5 54.3 5.4 0 748
Second 14.1 6.7 13.3 53.0 12.7 0.2 584
Middle 9.6 4.0 14.6 53.6 17.0 1.2 529
Fourth 5.2 5.6 11.8 51.4 26.1 0 141
Highest 0 7.6 9.6 65.8 17.0 0 73
Total 16.0 5.8 11.7 54.0 12.2 0.4 2,075
4.1: Walking time to the nearest primary school in BenuePercent distribution of de jure children age 5-16 by walking time (in minutes) to the nearest primary school
0-15 16-30 31-45 46-60 Over 60 minutes Don't Know/missing Num children Mean walking time
Residence
Urban 79.1 19.2 0 1.7 0 0 245 13.0
Rural 49.5 28.2 2.6 10.1 7.7 1.9 1,829 29.1
Total 53.0 27.1 2.3 9.1 6.8 1.7 2,075 27.2
A12
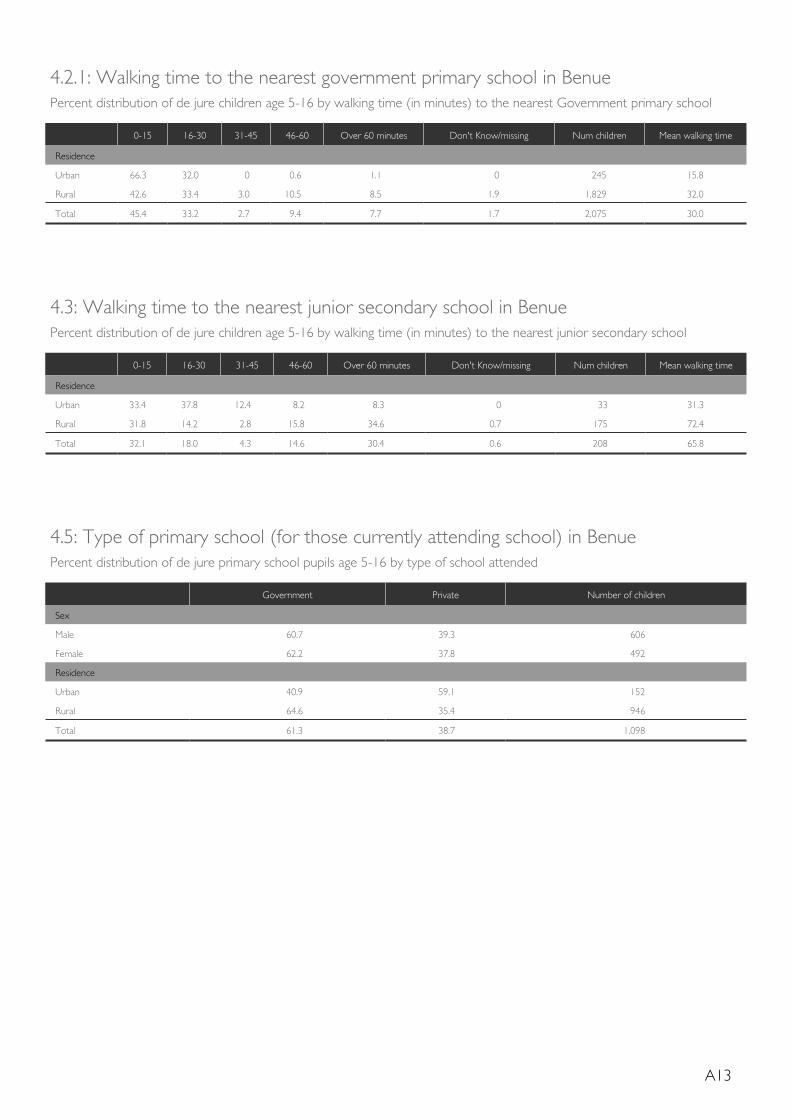
4.2.1: Walking time to the nearest government primary school in BenuePercent distribution of de jure children age 5-16 by walking time (in minutes) to the nearest Government primary school
0-15 16-30 31-45 46-60 Over 60 minutes Don't Know/missing Num children Mean walking time
Residence
Urban 66.3 32.0 0 0.6 1.1 0 245 15.8
Rural 42.6 33.4 3.0 10.5 8.5 1.9 1,829 32.0
Total 45.4 33.2 2.7 9.4 7.7 1.7 2,075 30.0
4.3: Walking time to the nearest junior secondary school in BenuePercent distribution of de jure children age 5-16 by walking time (in minutes) to the nearest junior secondary school
0-15 16-30 31-45 46-60 Over 60 minutes Don't Know/missing Num children Mean walking time
Residence
Urban 33.4 37.8 12.4 8.2 8.3 0 33 31.3
Rural 31.8 14.2 2.8 15.8 34.6 0.7 175 72.4
Total 32.1 18.0 4.3 14.6 30.4 0.6 208 65.8
4.5: Type of primary school (for those currently attending school) in BenuePercent distribution of de jure primary school pupils age 5-16 by type of school attended
Government Private Number of children
Sex
Male 60.7 39.3 606
Female 62.2 37.8 492
Residence
Urban 40.9 59.1 152
Rural 64.6 35.4 946
Total 61.3 38.7 1,098
A13
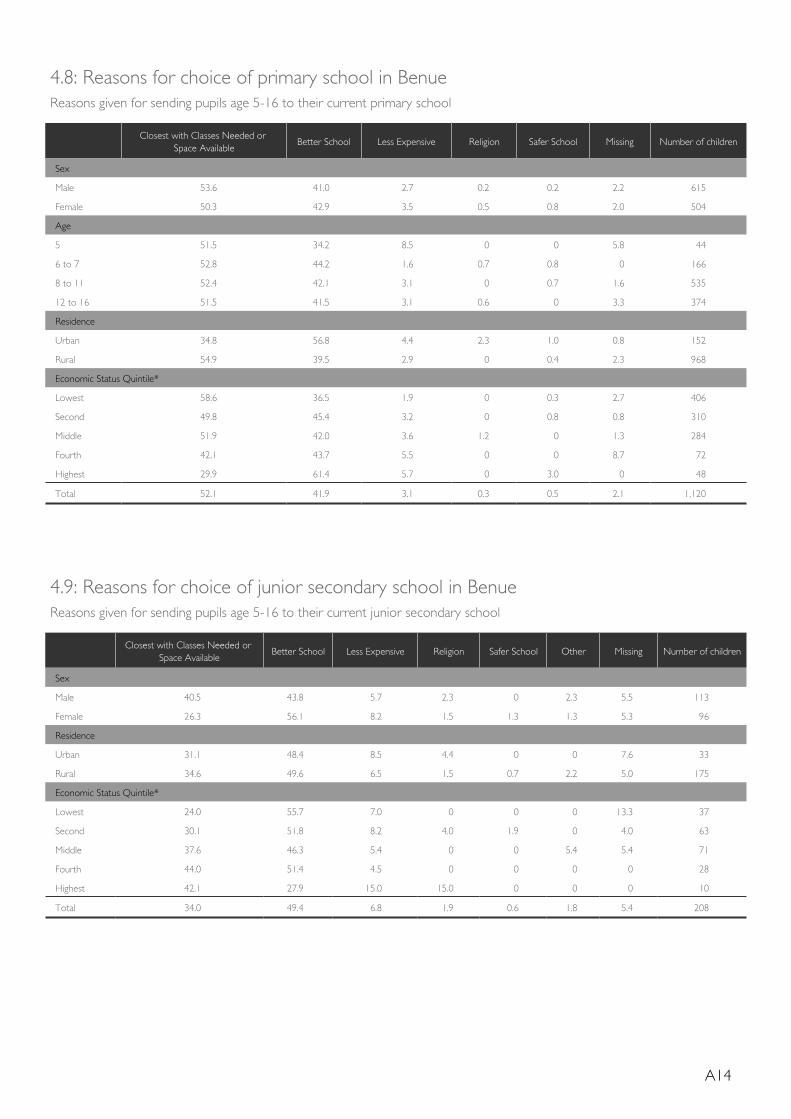
4.8: Reasons for choice of primary school in BenueReasons given for sending pupils age 5-16 to their current primary school
Closest with Classes Needed or Space Available
Better School Less Expensive Religion Safer School Missing Number of children
Sex
Male 53.6 41.0 2.7 0.2 0.2 2.2 615
Female 50.3 42.9 3.5 0.5 0.8 2.0 504
Age
5 51.5 34.2 8.5 0 0 5.8 44
6 to 7 52.8 44.2 1.6 0.7 0.8 0 166
8 to 11 52.4 42.1 3.1 0 0.7 1.6 535
12 to 16 51.5 41.5 3.1 0.6 0 3.3 374
Residence
Urban 34.8 56.8 4.4 2.3 1.0 0.8 152
Rural 54.9 39.5 2.9 0 0.4 2.3 968
Economic Status Quintile*
Lowest 58.6 36.5 1.9 0 0.3 2.7 406
Second 49.8 45.4 3.2 0 0.8 0.8 310
Middle 51.9 42.0 3.6 1.2 0 1.3 284
Fourth 42.1 43.7 5.5 0 0 8.7 72
Highest 29.9 61.4 5.7 0 3.0 0 48
Total 52.1 41.9 3.1 0.3 0.5 2.1 1,120
4.9: Reasons for choice of junior secondary school in BenueReasons given for sending pupils age 5-16 to their current junior secondary school
Closest with Classes Needed or Space Available
Better School Less Expensive Religion Safer School Other Missing Number of children
Sex
Male 40.5 43.8 5.7 2.3 0 2.3 5.5 113
Female 26.3 56.1 8.2 1.5 1.3 1.3 5.3 96
Residence
Urban 31.1 48.4 8.5 4.4 0 0 7.6 33
Rural 34.6 49.6 6.5 1.5 0.7 2.2 5.0 175
Economic Status Quintile*
Lowest 24.0 55.7 7.0 0 0 0 13.3 37
Second 30.1 51.8 8.2 4.0 1.9 0 4.0 63
Middle 37.6 46.3 5.4 0 0 5.4 5.4 71
Fourth 44.0 51.4 4.5 0 0 0 0 28
Highest 42.1 27.9 15.0 15.0 0 0 0 10
Total 34.0 49.4 6.8 1.9 0.6 1.8 5.4 208
A14
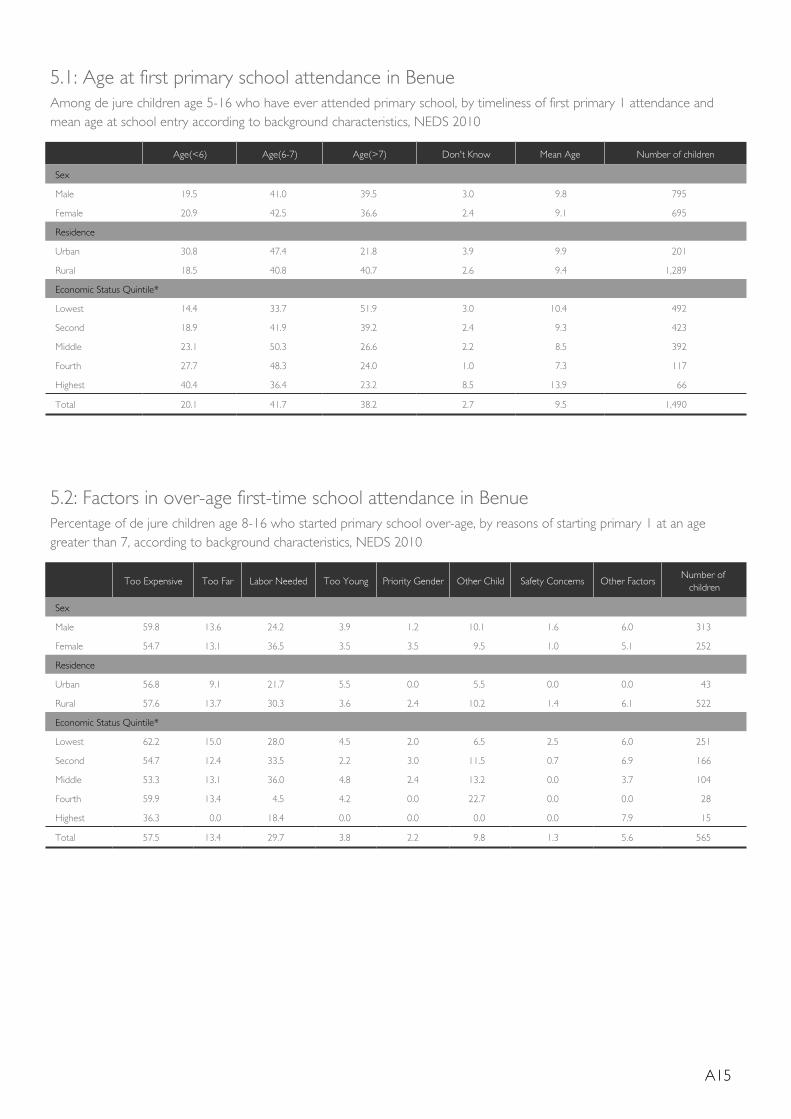
5.1: Age at first primary school attendance in BenueAmong de jure children age 5-16 who have ever attended primary school, by timeliness of first primary 1 attendance and mean age at school entry according to background characteristics, NEDS 2010
Age(<6) Age(6-7) Age(>7) Don't Know Mean Age Number of children
Sex
Male 19.5 41.0 39.5 3.0 9.8 795
Female 20.9 42.5 36.6 2.4 9.1 695
Residence
Urban 30.8 47.4 21.8 3.9 9.9 201
Rural 18.5 40.8 40.7 2.6 9.4 1,289
Economic Status Quintile*
Lowest 14.4 33.7 51.9 3.0 10.4 492
Second 18.9 41.9 39.2 2.4 9.3 423
Middle 23.1 50.3 26.6 2.2 8.5 392
Fourth 27.7 48.3 24.0 1.0 7.3 117
Highest 40.4 36.4 23.2 8.5 13.9 66
Total 20.1 41.7 38.2 2.7 9.5 1,490
5.2: Factors in over-age first-time school attendance in BenuePercentage of de jure children age 8-16 who started primary school over-age, by reasons of starting primary 1 at an age greater than 7, according to background characteristics, NEDS 2010
Too Expensive Too Far Labor Needed Too Young Priority Gender Other Child Safety Concerns Other FactorsNumber of
children
Sex
Male 59.8 13.6 24.2 3.9 1.2 10.1 1.6 6.0 313
Female 54.7 13.1 36.5 3.5 3.5 9.5 1.0 5.1 252
Residence
Urban 56.8 9.1 21.7 5.5 0.0 5.5 0.0 0.0 43
Rural 57.6 13.7 30.3 3.6 2.4 10.2 1.4 6.1 522
Economic Status Quintile*
Lowest 62.2 15.0 28.0 4.5 2.0 6.5 2.5 6.0 251
Second 54.7 12.4 33.5 2.2 3.0 11.5 0.7 6.9 166
Middle 53.3 13.1 36.0 4.8 2.4 13.2 0.0 3.7 104
Fourth 59.9 13.4 4.5 4.2 0.0 22.7 0.0 0.0 28
Highest 36.3 0.0 18.4 0.0 0.0 0.0 0.0 7.9 15
Total 57.5 13.4 29.7 3.8 2.2 9.8 1.3 5.6 565
A15
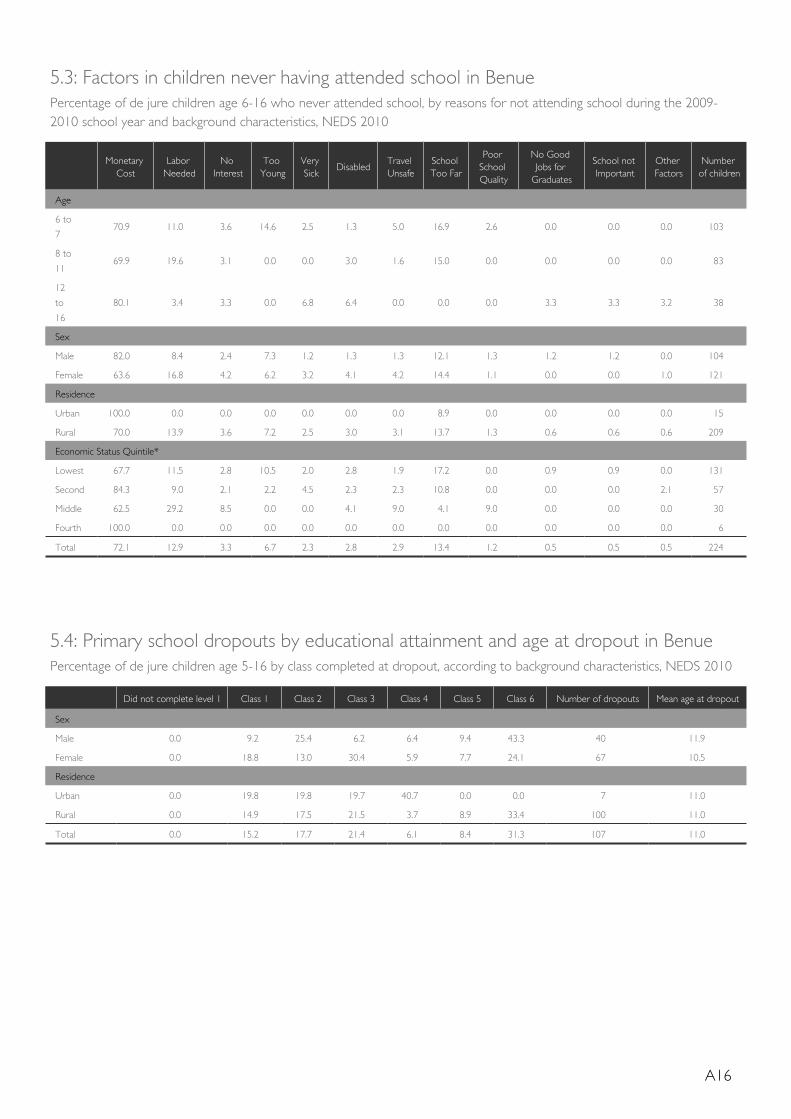
5.3: Factors in children never having attended school in BenuePercentage of de jure children age 6-16 who never attended school, by reasons for not attending school during the 2009-2010 school year and background characteristics, NEDS 2010
Monetary Cost
Labor Needed
No Interest
Too Young
Very Sick
DisabledTravel Unsafe
School Too Far
Poor School Quality
No Good Jobs for
Graduates
School not Important
Other Factors
Number of children
Age
6 to
770.9 11.0 3.6 14.6 2.5 1.3 5.0 16.9 2.6 0.0 0.0 0.0 103
8 to
1169.9 19.6 3.1 0.0 0.0 3.0 1.6 15.0 0.0 0.0 0.0 0.0 83
12
to
16
80.1 3.4 3.3 0.0 6.8 6.4 0.0 0.0 0.0 3.3 3.3 3.2 38
Sex
Male 82.0 8.4 2.4 7.3 1.2 1.3 1.3 12.1 1.3 1.2 1.2 0.0 104
Female 63.6 16.8 4.2 6.2 3.2 4.1 4.2 14.4 1.1 0.0 0.0 1.0 121
Residence
Urban 100.0 0.0 0.0 0.0 0.0 0.0 0.0 8.9 0.0 0.0 0.0 0.0 15
Rural 70.0 13.9 3.6 7.2 2.5 3.0 3.1 13.7 1.3 0.6 0.6 0.6 209
Economic Status Quintile*
Lowest 67.7 11.5 2.8 10.5 2.0 2.8 1.9 17.2 0.0 0.9 0.9 0.0 131
Second 84.3 9.0 2.1 2.2 4.5 2.3 2.3 10.8 0.0 0.0 0.0 2.1 57
Middle 62.5 29.2 8.5 0.0 0.0 4.1 9.0 4.1 9.0 0.0 0.0 0.0 30
Fourth 100.0 0.0 0.0 0.0 0.0 0.0 0.0 0.0 0.0 0.0 0.0 0.0 6
Total 72.1 12.9 3.3 6.7 2.3 2.8 2.9 13.4 1.2 0.5 0.5 0.5 224
5.4: Primary school dropouts by educational attainment and age at dropout in BenuePercentage of de jure children age 5-16 by class completed at dropout, according to background characteristics, NEDS 2010
Did not complete level 1 Class 1 Class 2 Class 3 Class 4 Class 5 Class 6 Number of dropouts Mean age at dropout
Sex
Male 0.0 9.2 25.4 6.2 6.4 9.4 43.3 40 11.9
Female 0.0 18.8 13.0 30.4 5.9 7.7 24.1 67 10.5
Residence
Urban 0.0 19.8 19.8 19.7 40.7 0.0 0.0 7 11.0
Rural 0.0 14.9 17.5 21.5 3.7 8.9 33.4 100 11.0
Total 0.0 15.2 17.7 21.4 6.1 8.4 31.3 107 11.0
A16
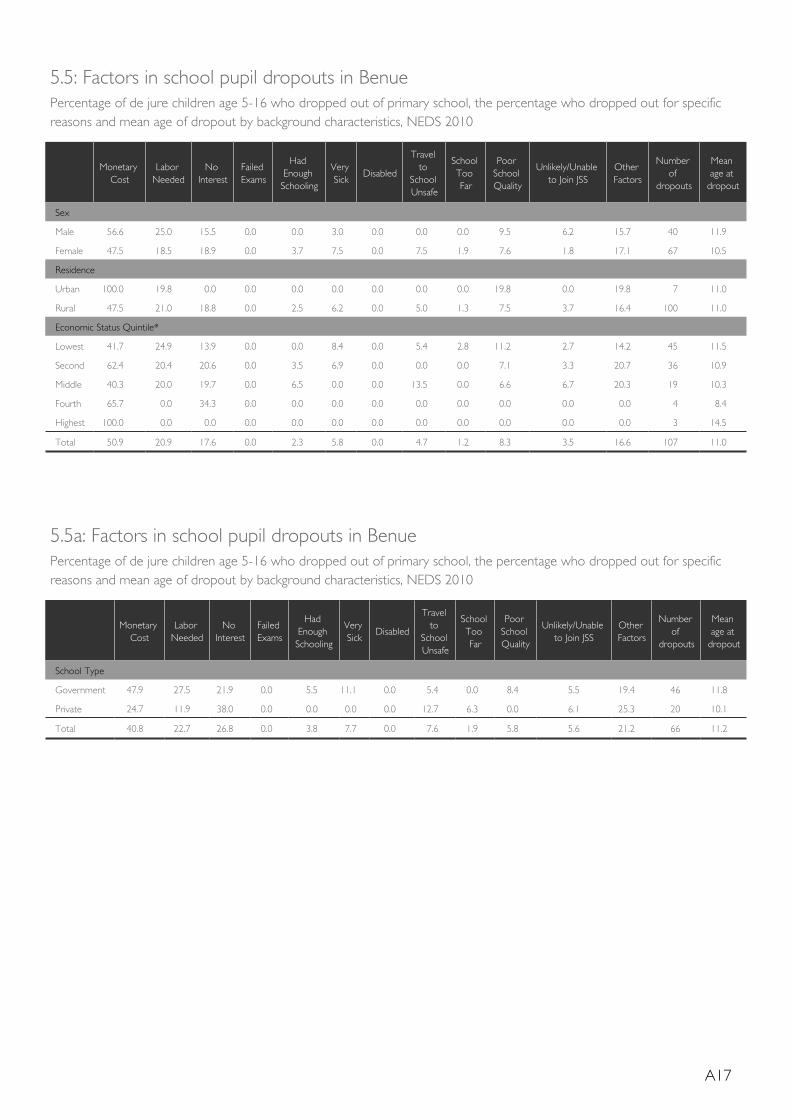
5.5: Factors in school pupil dropouts in BenuePercentage of de jure children age 5-16 who dropped out of primary school, the percentage who dropped out for specific reasons and mean age of dropout by background characteristics, NEDS 2010
Monetary Cost
Labor Needed
No Interest
Failed Exams
Had Enough Schooling
Very Sick
Disabled
Travel to
School Unsafe
School Too Far
Poor School Quality
Unlikely/Unable to Join JSS
Other Factors
Number of
dropouts
Mean age at
dropout
Sex
Male 56.6 25.0 15.5 0.0 0.0 3.0 0.0 0.0 0.0 9.5 6.2 15.7 40 11.9
Female 47.5 18.5 18.9 0.0 3.7 7.5 0.0 7.5 1.9 7.6 1.8 17.1 67 10.5
Residence
Urban 100.0 19.8 0.0 0.0 0.0 0.0 0.0 0.0 0.0 19.8 0.0 19.8 7 11.0
Rural 47.5 21.0 18.8 0.0 2.5 6.2 0.0 5.0 1.3 7.5 3.7 16.4 100 11.0
Economic Status Quintile*
Lowest 41.7 24.9 13.9 0.0 0.0 8.4 0.0 5.4 2.8 11.2 2.7 14.2 45 11.5
Second 62.4 20.4 20.6 0.0 3.5 6.9 0.0 0.0 0.0 7.1 3.3 20.7 36 10.9
Middle 40.3 20.0 19.7 0.0 6.5 0.0 0.0 13.5 0.0 6.6 6.7 20.3 19 10.3
Fourth 65.7 0.0 34.3 0.0 0.0 0.0 0.0 0.0 0.0 0.0 0.0 0.0 4 8.4
Highest 100.0 0.0 0.0 0.0 0.0 0.0 0.0 0.0 0.0 0.0 0.0 0.0 3 14.5
Total 50.9 20.9 17.6 0.0 2.3 5.8 0.0 4.7 1.2 8.3 3.5 16.6 107 11.0
5.5a: Factors in school pupil dropouts in BenuePercentage of de jure children age 5-16 who dropped out of primary school, the percentage who dropped out for specific reasons and mean age of dropout by background characteristics, NEDS 2010
Monetary Cost
Labor Needed
No Interest
Failed Exams
Had Enough Schooling
Very Sick
Disabled
Travel to
School Unsafe
School Too Far
Poor School Quality
Unlikely/Unable to Join JSS
Other Factors
Number of
dropouts
Mean age at
dropout
School Type
Government 47.9 27.5 21.9 0.0 5.5 11.1 0.0 5.4 0.0 8.4 5.5 19.4 46 11.8
Private 24.7 11.9 38.0 0.0 0.0 0.0 0.0 12.7 6.3 0.0 6.1 25.3 20 10.1
Total 40.8 22.7 26.8 0.0 3.8 7.7 0.0 7.6 1.9 5.8 5.6 21.2 66 11.2
A17
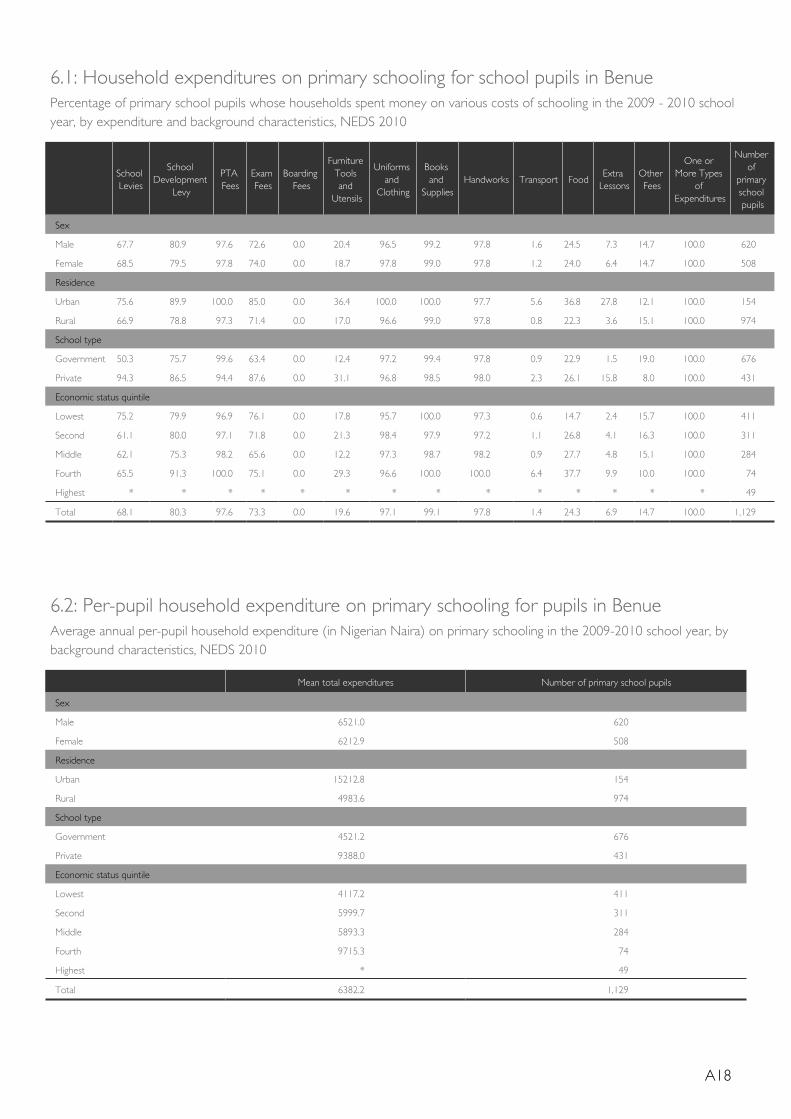
6.1: Household expenditures on primary schooling for school pupils in BenuePercentage of primary school pupils whose households spent money on various costs of schooling in the 2009 - 2010 school year, by expenditure and background characteristics, NEDS 2010
School Levies
School Development
Levy
PTA Fees
Exam Fees
Boarding Fees
Furniture Tools and
Utensils
Uniforms and
Clothing
Books and
SuppliesHandworks Transport Food
Extra Lessons
Other Fees
One or More Types
of Expenditures
Number of
primary school pupils
Sex
Male 67.7 80.9 97.6 72.6 0.0 20.4 96.5 99.2 97.8 1.6 24.5 7.3 14.7 100.0 620
Female 68.5 79.5 97.8 74.0 0.0 18.7 97.8 99.0 97.8 1.2 24.0 6.4 14.7 100.0 508
Residence
Urban 75.6 89.9 100.0 85.0 0.0 36.4 100.0 100.0 97.7 5.6 36.8 27.8 12.1 100.0 154
Rural 66.9 78.8 97.3 71.4 0.0 17.0 96.6 99.0 97.8 0.8 22.3 3.6 15.1 100.0 974
School type
Government 50.3 75.7 99.6 63.4 0.0 12.4 97.2 99.4 97.8 0.9 22.9 1.5 19.0 100.0 676
Private 94.3 86.5 94.4 87.6 0.0 31.1 96.8 98.5 98.0 2.3 26.1 15.8 8.0 100.0 431
Economic status quintile
Lowest 75.2 79.9 96.9 76.1 0.0 17.8 95.7 100.0 97.3 0.6 14.7 2.4 15.7 100.0 411
Second 61.1 80.0 97.1 71.8 0.0 21.3 98.4 97.9 97.2 1.1 26.8 4.1 16.3 100.0 311
Middle 62.1 75.3 98.2 65.6 0.0 12.2 97.3 98.7 98.2 0.9 27.7 4.8 15.1 100.0 284
Fourth 65.5 91.3 100.0 75.1 0.0 29.3 96.6 100.0 100.0 6.4 37.7 9.9 10.0 100.0 74
Highest * * * * * * * * * * * * * * 49
Total 68.1 80.3 97.6 73.3 0.0 19.6 97.1 99.1 97.8 1.4 24.3 6.9 14.7 100.0 1,129
6.2: Per-pupil household expenditure on primary schooling for pupils in BenueAverage annual per-pupil household expenditure (in Nigerian Naira) on primary schooling in the 2009-2010 school year, by background characteristics, NEDS 2010
Mean total expenditures Number of primary school pupils
Sex
Male 6521.0 620
Female 6212.9 508
Residence
Urban 15212.8 154
Rural 4983.6 974
School type
Government 4521.2 676
Private 9388.0 431
Economic status quintile
Lowest 4117.2 411
Second 5999.7 311
Middle 5893.3 284
Fourth 9715.3 74
Highest * 49
Total 6382.2 1,129
A18
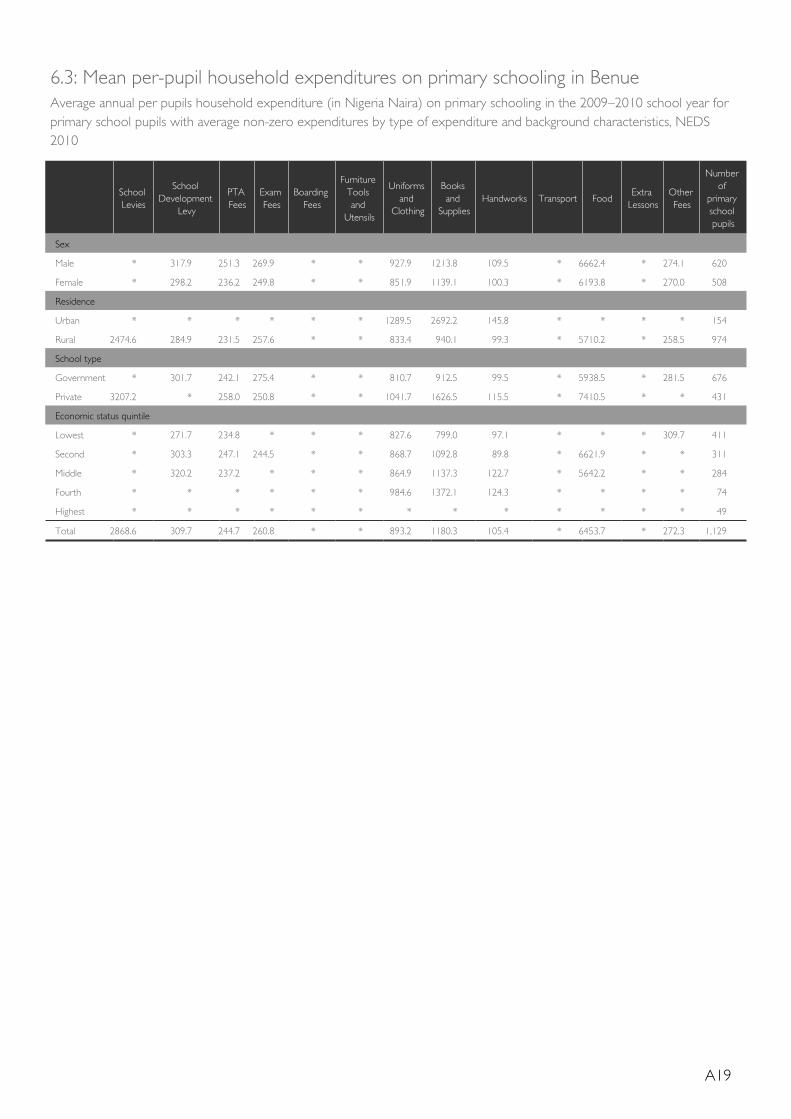
6.3: Mean per-pupil household expenditures on primary schooling in BenueAverage annual per pupils household expenditure (in Nigeria Naira) on primary schooling in the 2009–2010 school year for primary school pupils with average non-zero expenditures by type of expenditure and background characteristics, NEDS 2010
School Levies
School Development
Levy
PTA Fees
Exam Fees
Boarding Fees
Furniture Tools and
Utensils
Uniforms and
Clothing
Books and
SuppliesHandworks Transport Food
Extra Lessons
Other Fees
Number of
primary school pupils
Sex
Male * 317.9 251.3 269.9 * * 927.9 1213.8 109.5 * 6662.4 * 274.1 620
Female * 298.2 236.2 249.8 * * 851.9 1139.1 100.3 * 6193.8 * 270.0 508
Residence
Urban * * * * * * 1289.5 2692.2 145.8 * * * * 154
Rural 2474.6 284.9 231.5 257.6 * * 833.4 940.1 99.3 * 5710.2 * 258.5 974
School type
Government * 301.7 242.1 275.4 * * 810.7 912.5 99.5 * 5938.5 * 281.5 676
Private 3207.2 * 258.0 250.8 * * 1041.7 1626.5 115.5 * 7410.5 * * 431
Economic status quintile
Lowest * 271.7 234.8 * * * 827.6 799.0 97.1 * * * 309.7 411
Second * 303.3 247.1 244.5 * * 868.7 1092.8 89.8 * 6621.9 * * 311
Middle * 320.2 237.2 * * * 864.9 1137.3 122.7 * 5642.2 * * 284
Fourth * * * * * * 984.6 1372.1 124.3 * * * * 74
Highest * * * * * * * * * * * * * 49
Total 2868.6 309.7 244.7 260.8 * * 893.2 1180.3 105.4 * 6453.7 * 272.3 1,129
A19
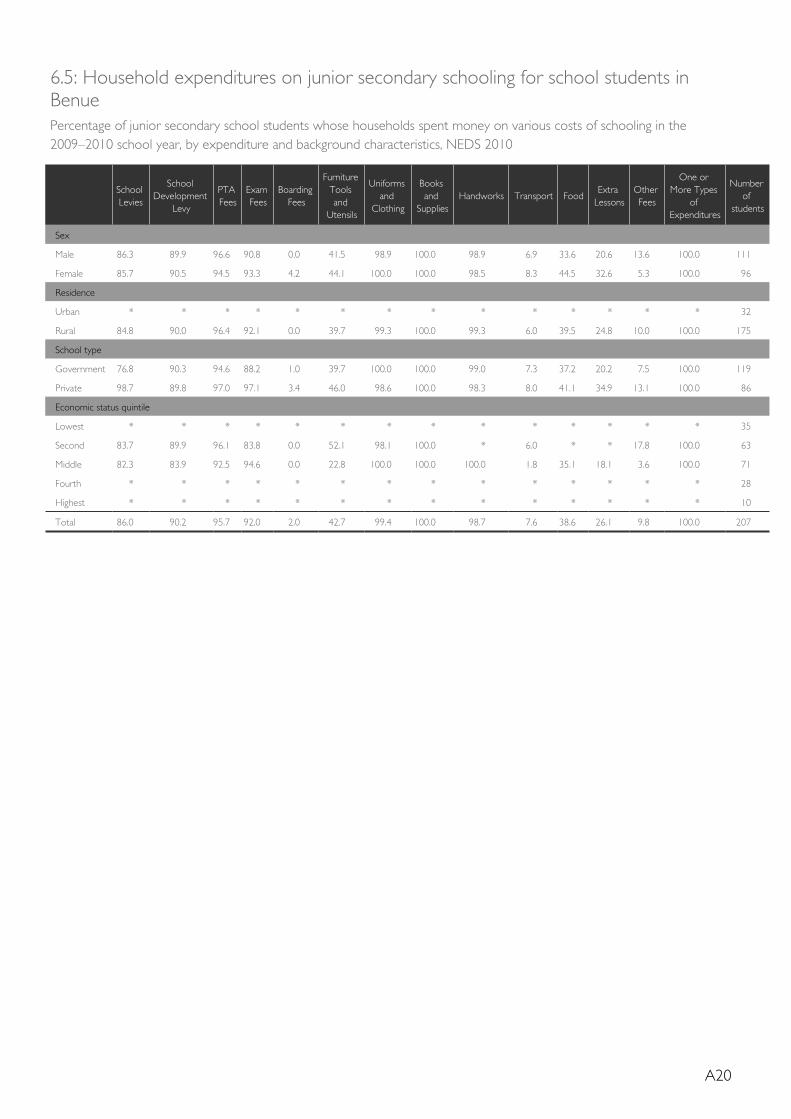
6.5: Household expenditures on junior secondary schooling for school students in BenuePercentage of junior secondary school students whose households spent money on various costs of schooling in the 2009–2010 school year, by expenditure and background characteristics, NEDS 2010
School Levies
School Development
Levy
PTA Fees
Exam Fees
Boarding Fees
Furniture Tools and
Utensils
Uniforms and
Clothing
Books and
SuppliesHandworks Transport Food
Extra Lessons
Other Fees
One or More Types
of Expenditures
Number of
students
Sex
Male 86.3 89.9 96.6 90.8 0.0 41.5 98.9 100.0 98.9 6.9 33.6 20.6 13.6 100.0 111
Female 85.7 90.5 94.5 93.3 4.2 44.1 100.0 100.0 98.5 8.3 44.5 32.6 5.3 100.0 96
Residence
Urban * * * * * * * * * * * * * * 32
Rural 84.8 90.0 96.4 92.1 0.0 39.7 99.3 100.0 99.3 6.0 39.5 24.8 10.0 100.0 175
School type
Government 76.8 90.3 94.6 88.2 1.0 39.7 100.0 100.0 99.0 7.3 37.2 20.2 7.5 100.0 119
Private 98.7 89.8 97.0 97.1 3.4 46.0 98.6 100.0 98.3 8.0 41.1 34.9 13.1 100.0 86
Economic status quintile
Lowest * * * * * * * * * * * * * * 35
Second 83.7 89.9 96.1 83.8 0.0 52.1 98.1 100.0 * 6.0 * * 17.8 100.0 63
Middle 82.3 83.9 92.5 94.6 0.0 22.8 100.0 100.0 100.0 1.8 35.1 18.1 3.6 100.0 71
Fourth * * * * * * * * * * * * * * 28
Highest * * * * * * * * * * * * * * 10
Total 86.0 90.2 95.7 92.0 2.0 42.7 99.4 100.0 98.7 7.6 38.6 26.1 9.8 100.0 207
A20
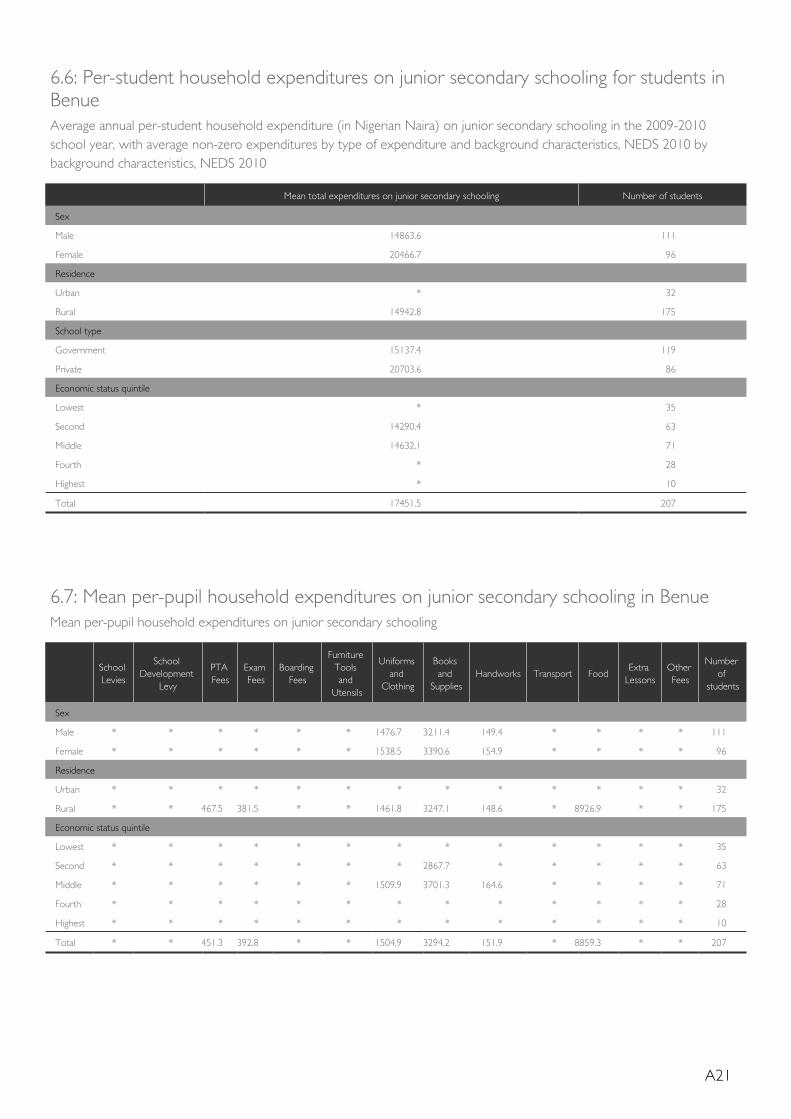
6.6: Per-student household expenditures on junior secondary schooling for students in BenueAverage annual per-student household expenditure (in Nigerian Naira) on junior secondary schooling in the 2009-2010 school year, with average non-zero expenditures by type of expenditure and background characteristics, NEDS 2010 by background characteristics, NEDS 2010
Mean total expenditures on junior secondary schooling Number of students
Sex
Male 14863.6 111
Female 20466.7 96
Residence
Urban * 32
Rural 14942.8 175
School type
Government 15137.4 119
Private 20703.6 86
Economic status quintile
Lowest * 35
Second 14290.4 63
Middle 14632.1 71
Fourth * 28
Highest * 10
Total 17451.5 207
6.7: Mean per-pupil household expenditures on junior secondary schooling in BenueMean per-pupil household expenditures on junior secondary schooling
School Levies
School Development
Levy
PTA Fees
Exam Fees
Boarding Fees
Furniture Tools and
Utensils
Uniforms and
Clothing
Books and
SuppliesHandworks Transport Food
Extra Lessons
Other Fees
Number of
students
Sex
Male * * * * * * 1476.7 3211.4 149.4 * * * * 111
Female * * * * * * 1538.5 3390.6 154.9 * * * * 96
Residence
Urban * * * * * * * * * * * * * 32
Rural * * 467.5 381.5 * * 1461.8 3247.1 148.6 * 8926.9 * * 175
Economic status quintile
Lowest * * * * * * * * * * * * * 35
Second * * * * * * * 2867.7 * * * * * 63
Middle * * * * * * 1509.9 3701.3 164.6 * * * * 71
Fourth * * * * * * * * * * * * * 28
Highest * * * * * * * * * * * * * 10
Total * * 451.3 392.8 * * 1504.9 3294.2 151.9 * 8859.3 * * 207
A21
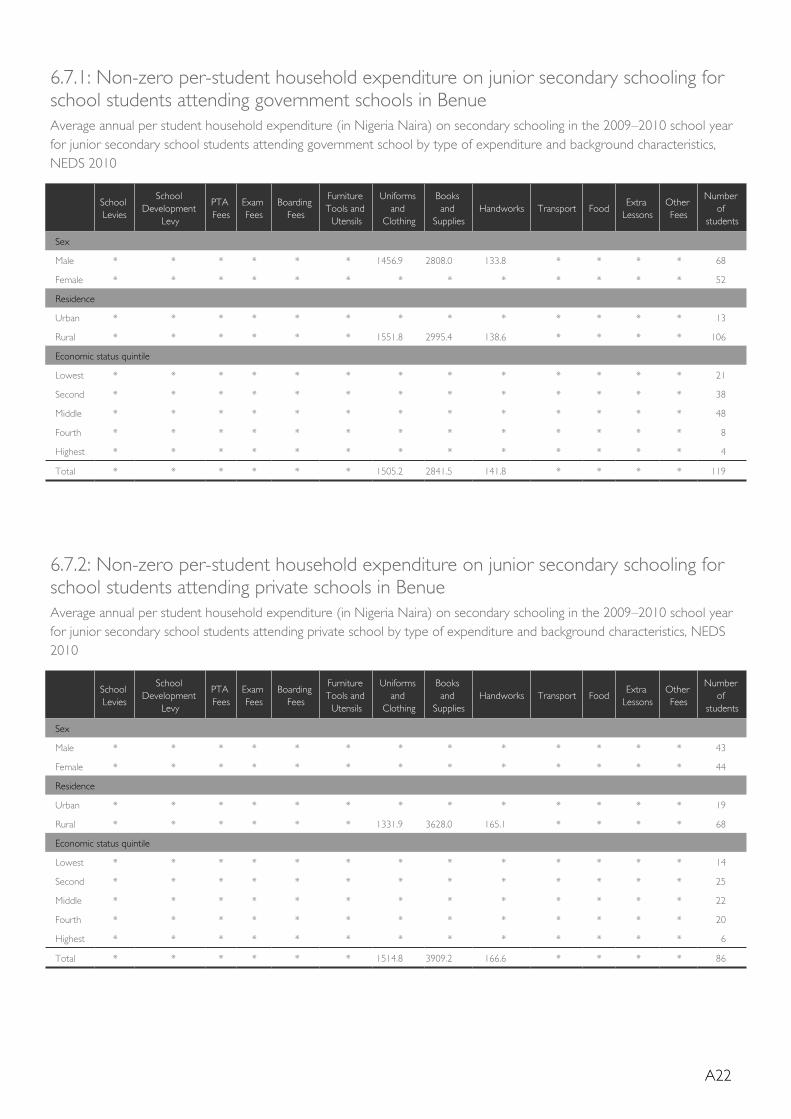
6.7.1: Non-zero per-student household expenditure on junior secondary schooling for school students attending government schools in BenueAverage annual per student household expenditure (in Nigeria Naira) on secondary schooling in the 2009–2010 school year for junior secondary school students attending government school by type of expenditure and background characteristics, NEDS 2010
School Levies
School Development
Levy
PTA Fees
Exam Fees
Boarding Fees
Furniture Tools and
Utensils
Uniforms and
Clothing
Books and
SuppliesHandworks Transport Food
Extra Lessons
Other Fees
Number of
students
Sex
Male * * * * * * 1456.9 2808.0 133.8 * * * * 68
Female * * * * * * * * * * * * * 52
Residence
Urban * * * * * * * * * * * * * 13
Rural * * * * * * 1551.8 2995.4 138.6 * * * * 106
Economic status quintile
Lowest * * * * * * * * * * * * * 21
Second * * * * * * * * * * * * * 38
Middle * * * * * * * * * * * * * 48
Fourth * * * * * * * * * * * * * 8
Highest * * * * * * * * * * * * * 4
Total * * * * * * 1505.2 2841.5 141.8 * * * * 119
6.7.2: Non-zero per-student household expenditure on junior secondary schooling for school students attending private schools in BenueAverage annual per student household expenditure (in Nigeria Naira) on secondary schooling in the 2009–2010 school year for junior secondary school students attending private school by type of expenditure and background characteristics, NEDS 2010
School Levies
School Development
Levy
PTA Fees
Exam Fees
Boarding Fees
Furniture Tools and
Utensils
Uniforms and
Clothing
Books and
SuppliesHandworks Transport Food
Extra Lessons
Other Fees
Number of
students
Sex
Male * * * * * * * * * * * * * 43
Female * * * * * * * * * * * * * 44
Residence
Urban * * * * * * * * * * * * * 19
Rural * * * * * * 1331.9 3628.0 165.1 * * * * 68
Economic status quintile
Lowest * * * * * * * * * * * * * 14
Second * * * * * * * * * * * * * 25
Middle * * * * * * * * * * * * * 22
Fourth * * * * * * * * * * * * * 20
Highest * * * * * * * * * * * * * 6
Total * * * * * * 1514.8 3909.2 166.6 * * * * 86
A22
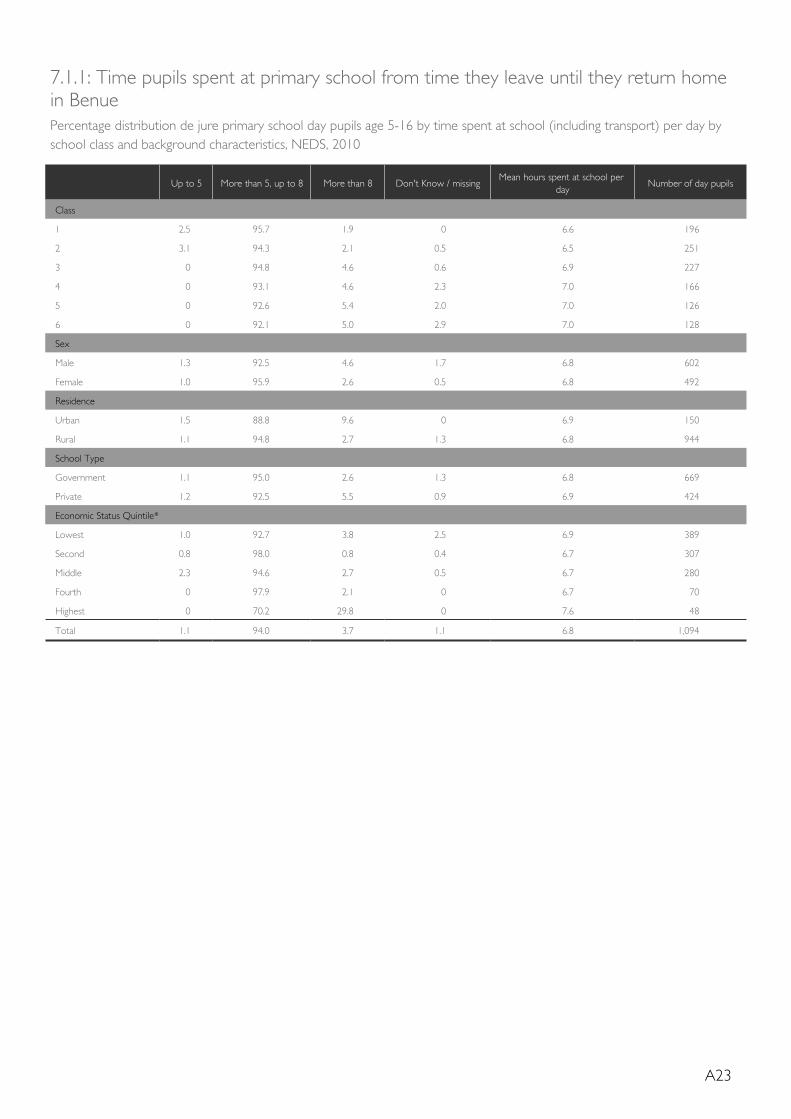
7.1.1: Time pupils spent at primary school from time they leave until they return home in BenuePercentage distribution de jure primary school day pupils age 5-16 by time spent at school (including transport) per day by school class and background characteristics, NEDS, 2010
Up to 5 More than 5, up to 8 More than 8 Don't Know / missingMean hours spent at school per
dayNumber of day pupils
Class
1 2.5 95.7 1.9 0 6.6 196
2 3.1 94.3 2.1 0.5 6.5 251
3 0 94.8 4.6 0.6 6.9 227
4 0 93.1 4.6 2.3 7.0 166
5 0 92.6 5.4 2.0 7.0 126
6 0 92.1 5.0 2.9 7.0 128
Sex
Male 1.3 92.5 4.6 1.7 6.8 602
Female 1.0 95.9 2.6 0.5 6.8 492
Residence
Urban 1.5 88.8 9.6 0 6.9 150
Rural 1.1 94.8 2.7 1.3 6.8 944
School Type
Government 1.1 95.0 2.6 1.3 6.8 669
Private 1.2 92.5 5.5 0.9 6.9 424
Economic Status Quintile*
Lowest 1.0 92.7 3.8 2.5 6.9 389
Second 0.8 98.0 0.8 0.4 6.7 307
Middle 2.3 94.6 2.7 0.5 6.7 280
Fourth 0 97.9 2.1 0 6.7 70
Highest 0 70.2 29.8 0 7.6 48
Total 1.1 94.0 3.7 1.1 6.8 1,094
A23
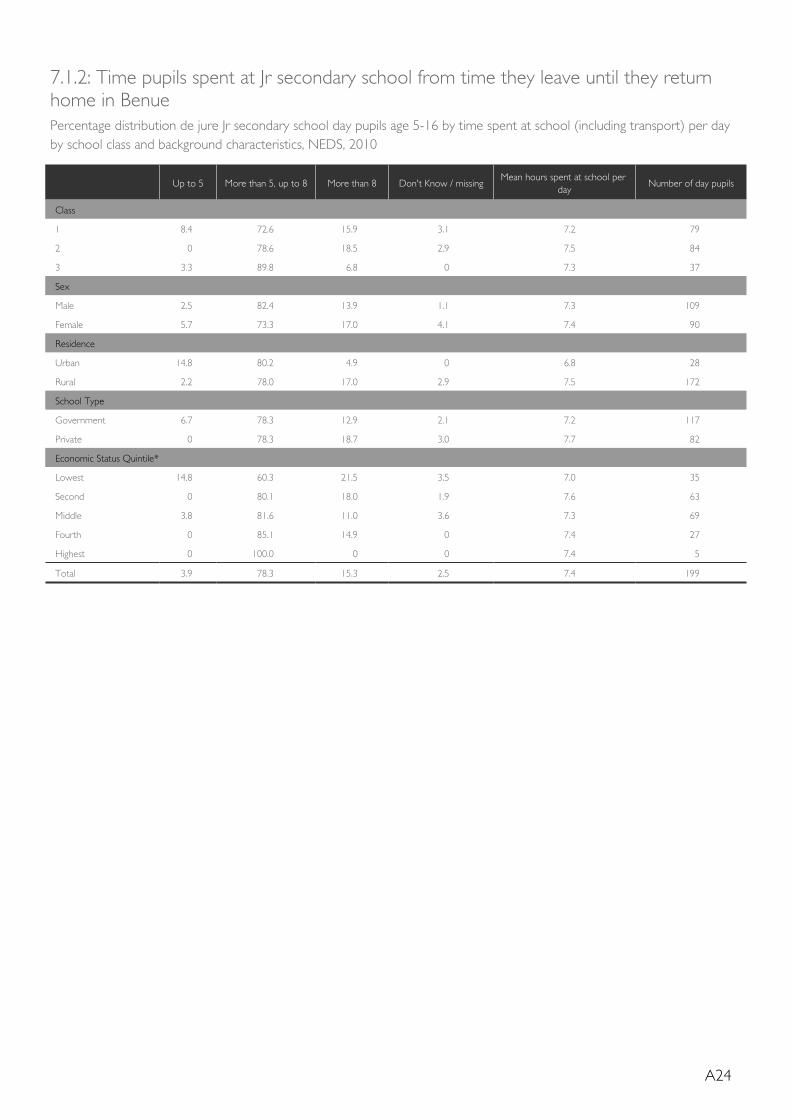
7.1.2: Time pupils spent at Jr secondary school from time they leave until they return home in BenuePercentage distribution de jure Jr secondary school day pupils age 5-16 by time spent at school (including transport) per day by school class and background characteristics, NEDS, 2010
Up to 5 More than 5, up to 8 More than 8 Don't Know / missingMean hours spent at school per
dayNumber of day pupils
Class
1 8.4 72.6 15.9 3.1 7.2 79
2 0 78.6 18.5 2.9 7.5 84
3 3.3 89.8 6.8 0 7.3 37
Sex
Male 2.5 82.4 13.9 1.1 7.3 109
Female 5.7 73.3 17.0 4.1 7.4 90
Residence
Urban 14.8 80.2 4.9 0 6.8 28
Rural 2.2 78.0 17.0 2.9 7.5 172
School Type
Government 6.7 78.3 12.9 2.1 7.2 117
Private 0 78.3 18.7 3.0 7.7 82
Economic Status Quintile*
Lowest 14.8 60.3 21.5 3.5 7.0 35
Second 0 80.1 18.0 1.9 7.6 63
Middle 3.8 81.6 11.0 3.6 7.3 69
Fourth 0 85.1 14.9 0 7.4 27
Highest 0 100.0 0 0 7.4 5
Total 3.9 78.3 15.3 2.5 7.4 199
A24
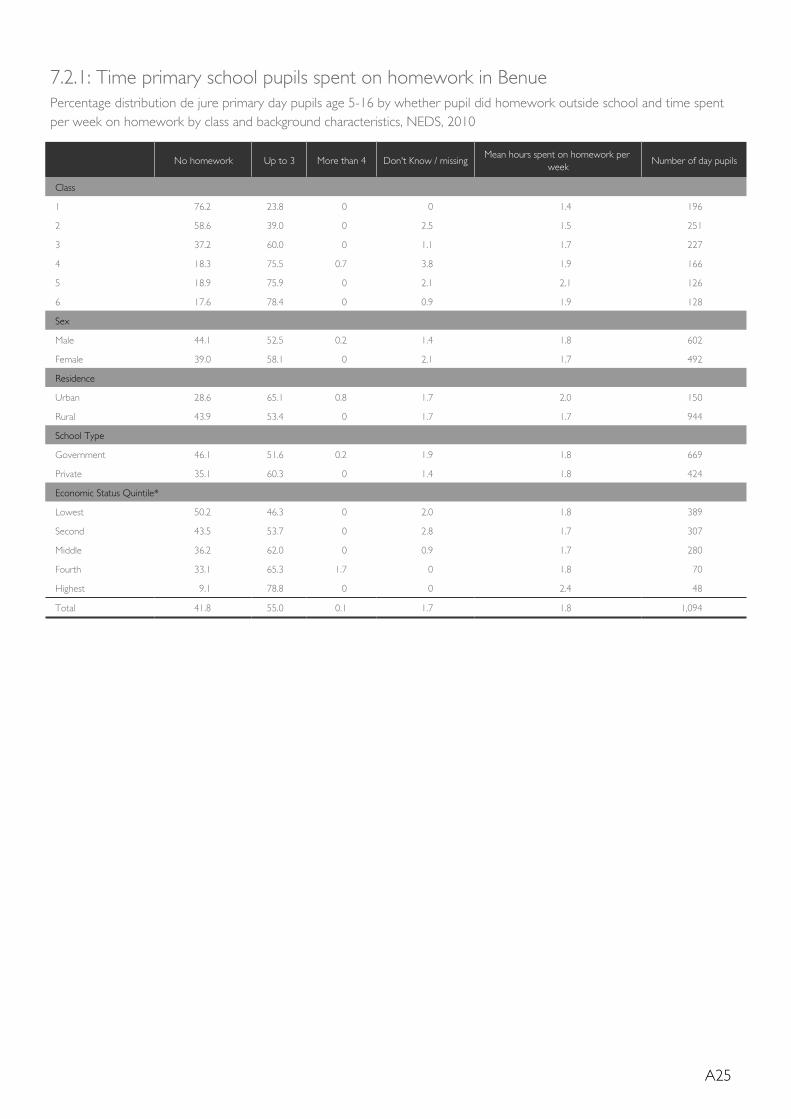
7.2.1: Time primary school pupils spent on homework in BenuePercentage distribution de jure primary day pupils age 5-16 by whether pupil did homework outside school and time spent per week on homework by class and background characteristics, NEDS, 2010
No homework Up to 3 More than 4 Don't Know / missingMean hours spent on homework per
weekNumber of day pupils
Class
1 76.2 23.8 0 0 1.4 196
2 58.6 39.0 0 2.5 1.5 251
3 37.2 60.0 0 1.1 1.7 227
4 18.3 75.5 0.7 3.8 1.9 166
5 18.9 75.9 0 2.1 2.1 126
6 17.6 78.4 0 0.9 1.9 128
Sex
Male 44.1 52.5 0.2 1.4 1.8 602
Female 39.0 58.1 0 2.1 1.7 492
Residence
Urban 28.6 65.1 0.8 1.7 2.0 150
Rural 43.9 53.4 0 1.7 1.7 944
School Type
Government 46.1 51.6 0.2 1.9 1.8 669
Private 35.1 60.3 0 1.4 1.8 424
Economic Status Quintile*
Lowest 50.2 46.3 0 2.0 1.8 389
Second 43.5 53.7 0 2.8 1.7 307
Middle 36.2 62.0 0 0.9 1.7 280
Fourth 33.1 65.3 1.7 0 1.8 70
Highest 9.1 78.8 0 0 2.4 48
Total 41.8 55.0 0.1 1.7 1.8 1,094
A25
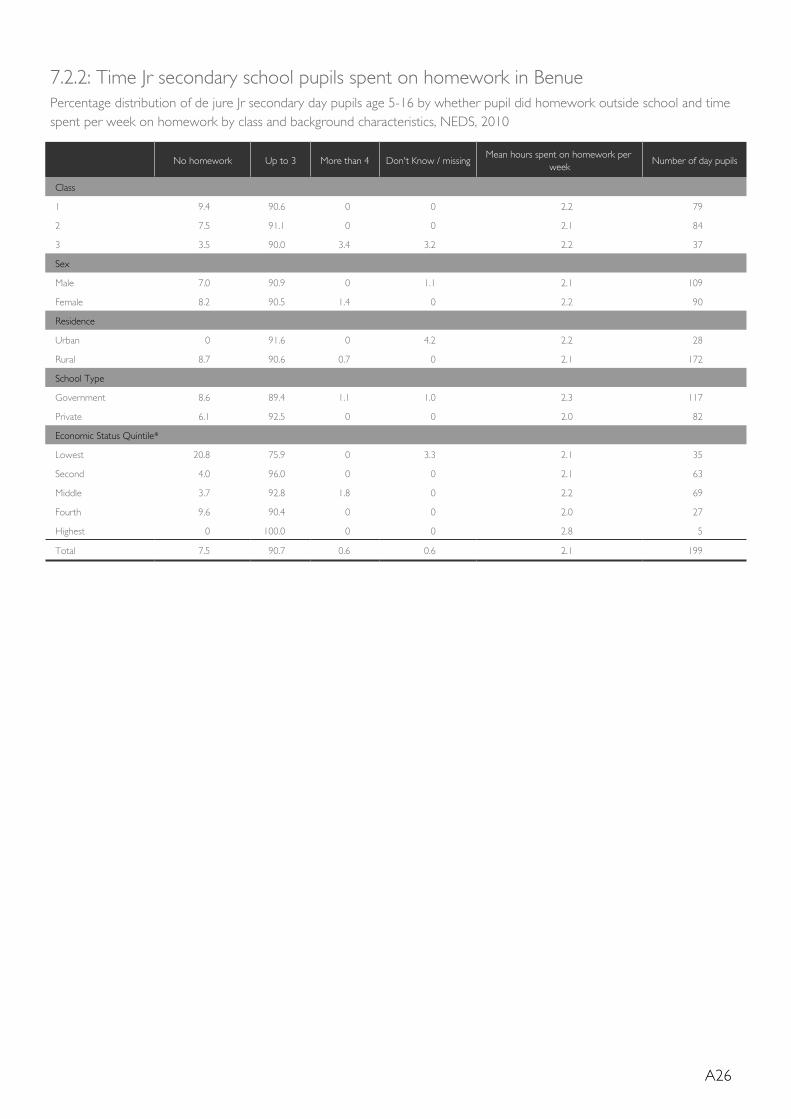
7.2.2: Time Jr secondary school pupils spent on homework in BenuePercentage distribution of de jure Jr secondary day pupils age 5-16 by whether pupil did homework outside school and time spent per week on homework by class and background characteristics, NEDS, 2010
No homework Up to 3 More than 4 Don't Know / missingMean hours spent on homework per
weekNumber of day pupils
Class
1 9.4 90.6 0 0 2.2 79
2 7.5 91.1 0 0 2.1 84
3 3.5 90.0 3.4 3.2 2.2 37
Sex
Male 7.0 90.9 0 1.1 2.1 109
Female 8.2 90.5 1.4 0 2.2 90
Residence
Urban 0 91.6 0 4.2 2.2 28
Rural 8.7 90.6 0.7 0 2.1 172
School Type
Government 8.6 89.4 1.1 1.0 2.3 117
Private 6.1 92.5 0 0 2.0 82
Economic Status Quintile*
Lowest 20.8 75.9 0 3.3 2.1 35
Second 4.0 96.0 0 0 2.1 63
Middle 3.7 92.8 1.8 0 2.2 69
Fourth 9.6 90.4 0 0 2.0 27
Highest 0 100.0 0 0 2.8 5
Total 7.5 90.7 0.6 0.6 2.1 199
A26
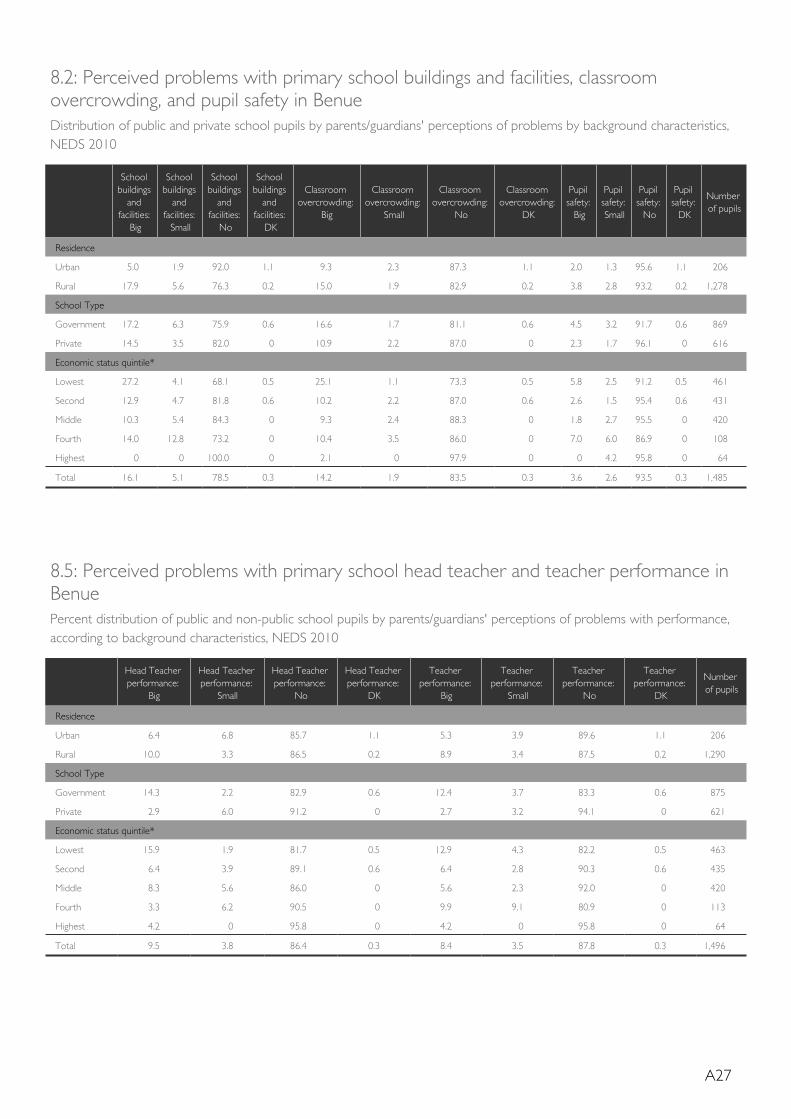
8.2: Perceived problems with primary school buildings and facilities, classroom overcrowding, and pupil safety in BenueDistribution of public and private school pupils by parents/guardians' perceptions of problems by background characteristics, NEDS 2010
School buildings
and facilities:
Big
School buildings
and facilities:
Small
School buildings
and facilities:
No
School buildings
and facilities:
DK
Classroom overcrowding:
Big
Classroom overcrowding:
Small
Classroom overcrowding:
No
Classroom overcrowding:
DK
Pupil safety:
Big
Pupil safety: Small
Pupil safety:
No
Pupil safety:
DK
Number of pupils
Residence
Urban 5.0 1.9 92.0 1.1 9.3 2.3 87.3 1.1 2.0 1.3 95.6 1.1 206
Rural 17.9 5.6 76.3 0.2 15.0 1.9 82.9 0.2 3.8 2.8 93.2 0.2 1,278
School Type
Government 17.2 6.3 75.9 0.6 16.6 1.7 81.1 0.6 4.5 3.2 91.7 0.6 869
Private 14.5 3.5 82.0 0 10.9 2.2 87.0 0 2.3 1.7 96.1 0 616
Economic status quintile*
Lowest 27.2 4.1 68.1 0.5 25.1 1.1 73.3 0.5 5.8 2.5 91.2 0.5 461
Second 12.9 4.7 81.8 0.6 10.2 2.2 87.0 0.6 2.6 1.5 95.4 0.6 431
Middle 10.3 5.4 84.3 0 9.3 2.4 88.3 0 1.8 2.7 95.5 0 420
Fourth 14.0 12.8 73.2 0 10.4 3.5 86.0 0 7.0 6.0 86.9 0 108
Highest 0 0 100.0 0 2.1 0 97.9 0 0 4.2 95.8 0 64
Total 16.1 5.1 78.5 0.3 14.2 1.9 83.5 0.3 3.6 2.6 93.5 0.3 1,485
8.5: Perceived problems with primary school head teacher and teacher performance in BenuePercent distribution of public and non-public school pupils by parents/guardians' perceptions of problems with performance, according to background characteristics, NEDS 2010
Head Teacher performance:
Big
Head Teacher performance:
Small
Head Teacher performance:
No
Head Teacher performance:
DK
Teacher performance:
Big
Teacher performance:
Small
Teacher performance:
No
Teacher performance:
DK
Number of pupils
Residence
Urban 6.4 6.8 85.7 1.1 5.3 3.9 89.6 1.1 206
Rural 10.0 3.3 86.5 0.2 8.9 3.4 87.5 0.2 1,290
School Type
Government 14.3 2.2 82.9 0.6 12.4 3.7 83.3 0.6 875
Private 2.9 6.0 91.2 0 2.7 3.2 94.1 0 621
Economic status quintile*
Lowest 15.9 1.9 81.7 0.5 12.9 4.3 82.2 0.5 463
Second 6.4 3.9 89.1 0.6 6.4 2.8 90.3 0.6 435
Middle 8.3 5.6 86.0 0 5.6 2.3 92.0 0 420
Fourth 3.3 6.2 90.5 0 9.9 9.1 80.9 0 113
Highest 4.2 0 95.8 0 4.2 0 95.8 0 64
Total 9.5 3.8 86.4 0.3 8.4 3.5 87.8 0.3 1,496
A27
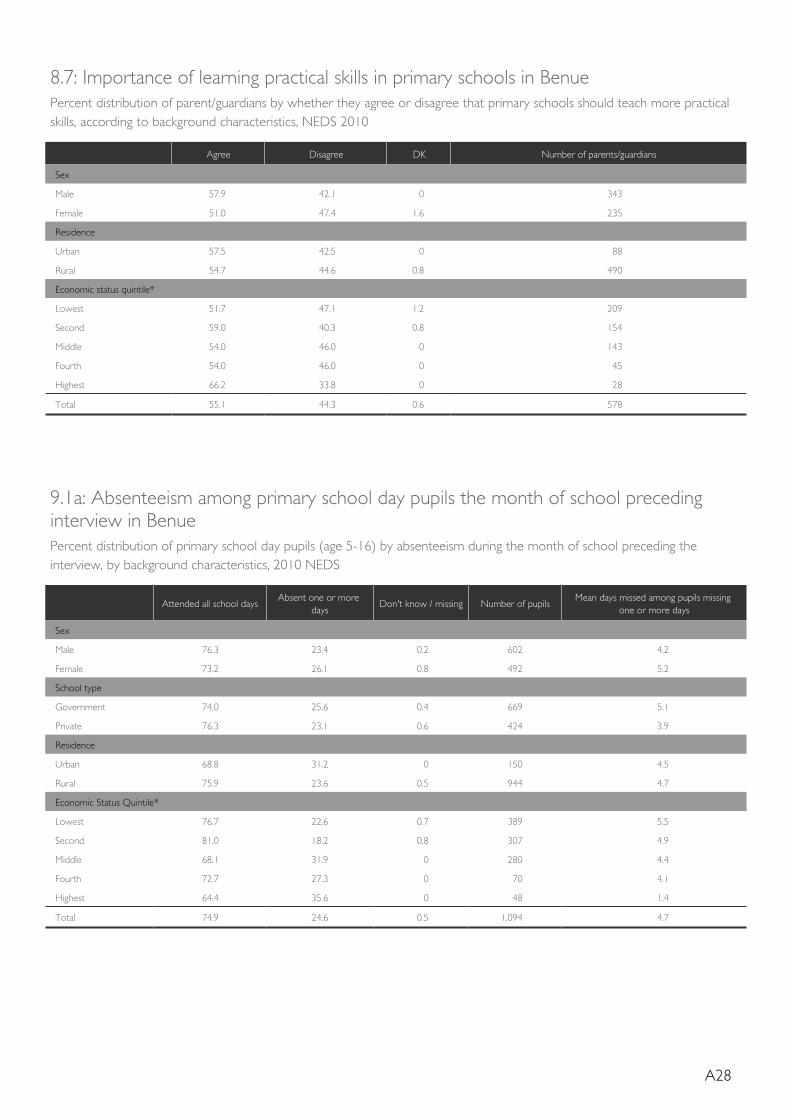
8.7: Importance of learning practical skills in primary schools in BenuePercent distribution of parent/guardians by whether they agree or disagree that primary schools should teach more practical skills, according to background characteristics, NEDS 2010
Agree Disagree DK Number of parents/guardians
Sex
Male 57.9 42.1 0 343
Female 51.0 47.4 1.6 235
Residence
Urban 57.5 42.5 0 88
Rural 54.7 44.6 0.8 490
Economic status quintile*
Lowest 51.7 47.1 1.2 209
Second 59.0 40.3 0.8 154
Middle 54.0 46.0 0 143
Fourth 54.0 46.0 0 45
Highest 66.2 33.8 0 28
Total 55.1 44.3 0.6 578
9.1a: Absenteeism among primary school day pupils the month of school preceding interview in BenuePercent distribution of primary school day pupils (age 5-16) by absenteeism during the month of school preceding the interview, by background characteristics, 2010 NEDS
Attended all school daysAbsent one or more
daysDon't know / missing Number of pupils
Mean days missed among pupils missing one or more days
Sex
Male 76.3 23.4 0.2 602 4.2
Female 73.2 26.1 0.8 492 5.2
School type
Government 74.0 25.6 0.4 669 5.1
Private 76.3 23.1 0.6 424 3.9
Residence
Urban 68.8 31.2 0 150 4.5
Rural 75.9 23.6 0.5 944 4.7
Economic Status Quintile*
Lowest 76.7 22.6 0.7 389 5.5
Second 81.0 18.2 0.8 307 4.9
Middle 68.1 31.9 0 280 4.4
Fourth 72.7 27.3 0 70 4.1
Highest 64.4 35.6 0 48 1.4
Total 74.9 24.6 0.5 1,094 4.7
A28
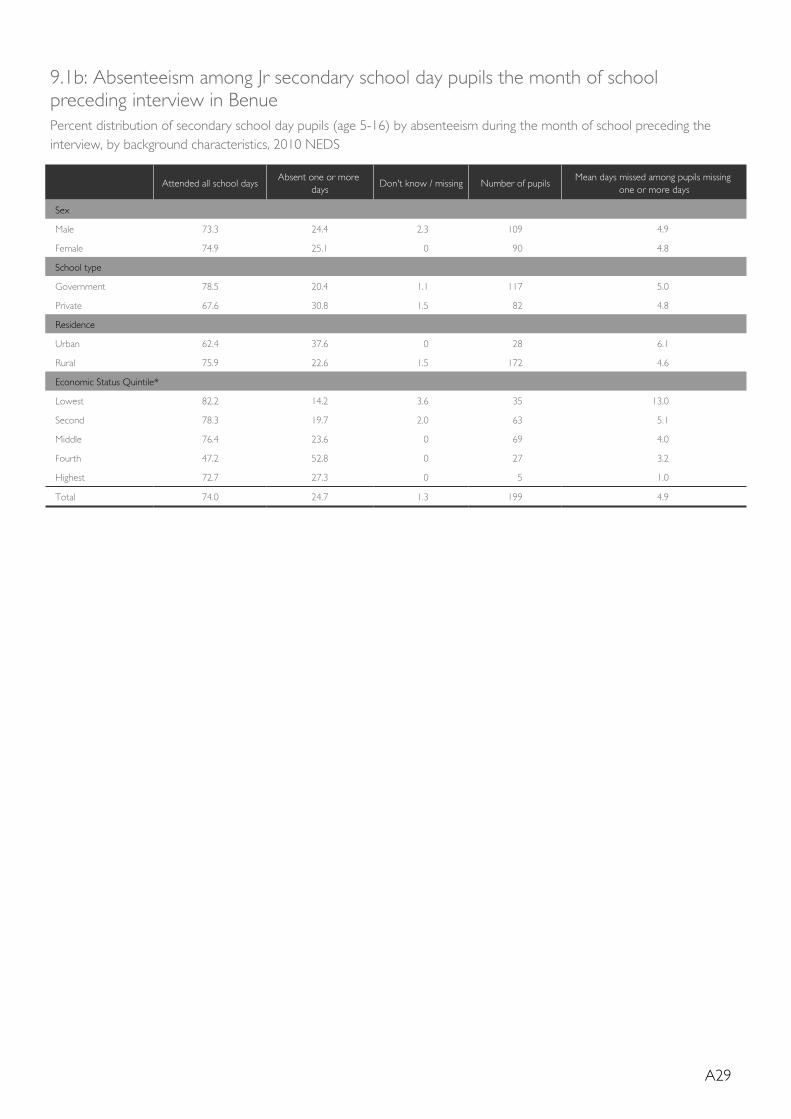
9.1b: Absenteeism among Jr secondary school day pupils the month of school preceding interview in BenuePercent distribution of secondary school day pupils (age 5-16) by absenteeism during the month of school preceding the interview, by background characteristics, 2010 NEDS
Attended all school daysAbsent one or more
daysDon't know / missing Number of pupils
Mean days missed among pupils missing one or more days
Sex
Male 73.3 24.4 2.3 109 4.9
Female 74.9 25.1 0 90 4.8
School type
Government 78.5 20.4 1.1 117 5.0
Private 67.6 30.8 1.5 82 4.8
Residence
Urban 62.4 37.6 0 28 6.1
Rural 75.9 22.6 1.5 172 4.6
Economic Status Quintile*
Lowest 82.2 14.2 3.6 35 13.0
Second 78.3 19.7 2.0 63 5.1
Middle 76.4 23.6 0 69 4.0
Fourth 47.2 52.8 0 27 3.2
Highest 72.7 27.3 0 5 1.0
Total 74.0 24.7 1.3 199 4.9
A29
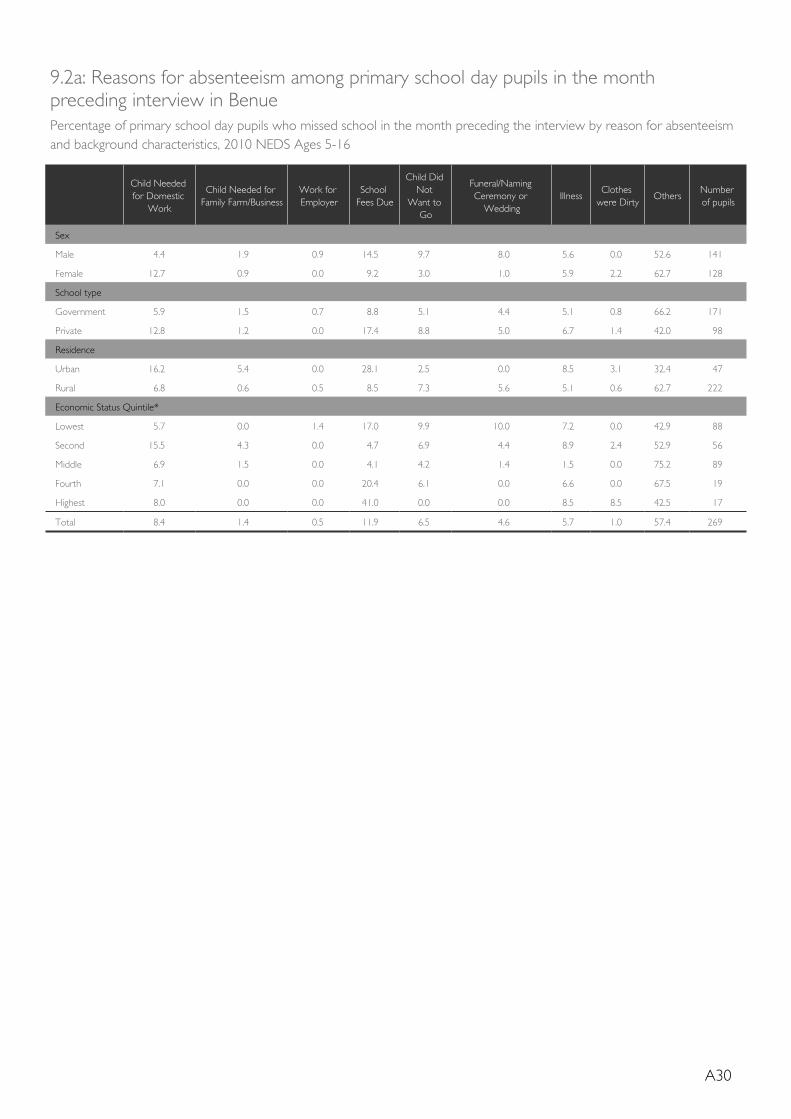
9.2a: Reasons for absenteeism among primary school day pupils in the month preceding interview in BenuePercentage of primary school day pupils who missed school in the month preceding the interview by reason for absenteeism and background characteristics, 2010 NEDS Ages 5-16
Child Needed for Domestic
Work
Child Needed for Family Farm/Business
Work for Employer
School Fees Due
Child Did Not
Want to Go
Funeral/Naming Ceremony or
WeddingIllness
Clothes were Dirty
OthersNumber of pupils
Sex
Male 4.4 1.9 0.9 14.5 9.7 8.0 5.6 0.0 52.6 141
Female 12.7 0.9 0.0 9.2 3.0 1.0 5.9 2.2 62.7 128
School type
Government 5.9 1.5 0.7 8.8 5.1 4.4 5.1 0.8 66.2 171
Private 12.8 1.2 0.0 17.4 8.8 5.0 6.7 1.4 42.0 98
Residence
Urban 16.2 5.4 0.0 28.1 2.5 0.0 8.5 3.1 32.4 47
Rural 6.8 0.6 0.5 8.5 7.3 5.6 5.1 0.6 62.7 222
Economic Status Quintile*
Lowest 5.7 0.0 1.4 17.0 9.9 10.0 7.2 0.0 42.9 88
Second 15.5 4.3 0.0 4.7 6.9 4.4 8.9 2.4 52.9 56
Middle 6.9 1.5 0.0 4.1 4.2 1.4 1.5 0.0 75.2 89
Fourth 7.1 0.0 0.0 20.4 6.1 0.0 6.6 0.0 67.5 19
Highest 8.0 0.0 0.0 41.0 0.0 0.0 8.5 8.5 42.5 17
Total 8.4 1.4 0.5 11.9 6.5 4.6 5.7 1.0 57.4 269
A30
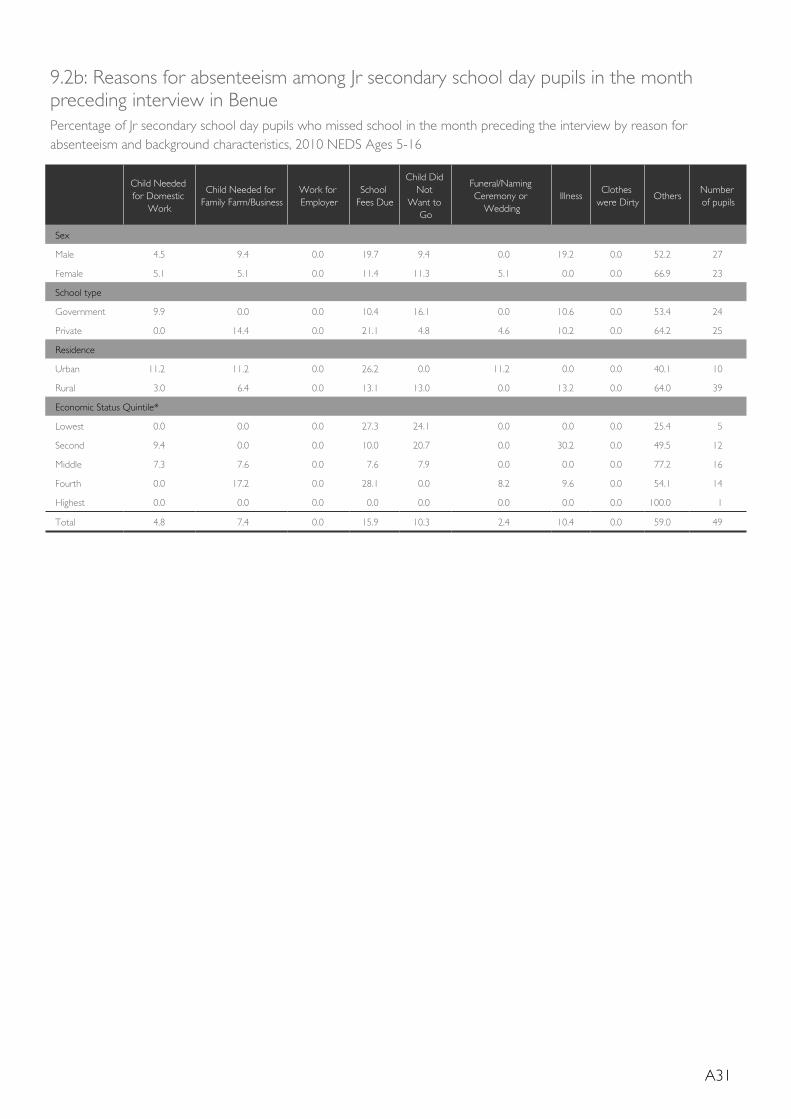
9.2b: Reasons for absenteeism among Jr secondary school day pupils in the month preceding interview in BenuePercentage of Jr secondary school day pupils who missed school in the month preceding the interview by reason for absenteeism and background characteristics, 2010 NEDS Ages 5-16
Child Needed for Domestic
Work
Child Needed for Family Farm/Business
Work for Employer
School Fees Due
Child Did Not
Want to Go
Funeral/Naming Ceremony or
WeddingIllness
Clothes were Dirty
OthersNumber of pupils
Sex
Male 4.5 9.4 0.0 19.7 9.4 0.0 19.2 0.0 52.2 27
Female 5.1 5.1 0.0 11.4 11.3 5.1 0.0 0.0 66.9 23
School type
Government 9.9 0.0 0.0 10.4 16.1 0.0 10.6 0.0 53.4 24
Private 0.0 14.4 0.0 21.1 4.8 4.6 10.2 0.0 64.2 25
Residence
Urban 11.2 11.2 0.0 26.2 0.0 11.2 0.0 0.0 40.1 10
Rural 3.0 6.4 0.0 13.1 13.0 0.0 13.2 0.0 64.0 39
Economic Status Quintile*
Lowest 0.0 0.0 0.0 27.3 24.1 0.0 0.0 0.0 25.4 5
Second 9.4 0.0 0.0 10.0 20.7 0.0 30.2 0.0 49.5 12
Middle 7.3 7.6 0.0 7.6 7.9 0.0 0.0 0.0 77.2 16
Fourth 0.0 17.2 0.0 28.1 0.0 8.2 9.6 0.0 54.1 14
Highest 0.0 0.0 0.0 0.0 0.0 0.0 0.0 0.0 100.0 1
Total 4.8 7.4 0.0 15.9 10.3 2.4 10.4 0.0 59.0 49
A31