1 Development of High Frequency Ultrasound Transducers for Medical Imaging Jon Cannata, Qifa Zhou, Jay Williams, Jesse Yen, Chang-Hong Hu and K. Kirk Shung Biomedical Engineering Department University of Southern California NIH Center for Medical Ultrasonic Transducer Technology 2 Mission to develop: – High frequency (>20 MHz) ultrasonic transducers for biomedical applications – Novel transducer materials (piezoelectric and passive) – High frequency imaging electronics Inception: 1997 – NIH/NIBIB funding – EB002182 Our team: • Professors Kirk Shung (PI), Jon Cannata (Transducers), Qifa Zhou (Materials), Jesse Yen and Chang-Hong Hu (Electronics) • Jay Williams (Transducer Engineer), Peter Lee (Finance) • 2 Post-Docs, 2 Visiting Scholars, 8 Graduate Students A NIH Resource Center on Medical Ultrasonic Transducer Technology (UTRC) 3 Rationale Increase ultrasound frequency to improve image resolution – Comes at a cost of limited penetration depth due to frequency dependent attenuation – Good access to target tissues are necessary for success Primary Applications • Ophthalmology • Dermatology • Intravascular studies • Small animal models Laterial Resolution vs. Center Frequency 0 50 100 150 200 250 300 0 25 50 75 100 125 150 Center Frequency f0 (MHz) R laterial ( μ μ μ μ m) f#=2.9 f#=0.7 4 Current High Frequency Ultrasonic Transducers for Medical Imaging Single Element Annular Array Linear Array • Fixed geometric focus • Mechanically scanned to form image Variable electronic focus • Mechanically scanned to form image Variable electronic focus Electronically scanned to form image
Transcript
1
Development of High Frequency Ultrasound Transducers for
Medical Imaging
Jon Cannata, Qifa Zhou, Jay Williams, Jesse Yen, Chang-Hong Hu and K.
Kirk ShungBiomedical Engineering Department
University of Southern California
NIH Center for Medical Ultrasonic Transducer Technology
2
Mission to develop:– High frequency (>20 MHz) ultrasonic transducers for
biomedical applications– Novel transducer materials (piezoelectric and passive)– High frequency imaging electronics
Inception: 1997– NIH/NIBIB funding– EB002182
Our team:• Professors Kirk Shung (PI), Jon Cannata (Transducers), Qifa
Zhou (Materials), Jesse Yen and Chang-Hong Hu (Electronics)• Jay Williams (Transducer Engineer), Peter Lee (Finance)• 2 Post-Docs, 2 Visiting Scholars, 8 Graduate Students
A NIH Resource Center on Medical Ultrasonic Transducer Technology (UTRC)
3
Rationale
Increase ultrasound frequency to improve image resolution– Comes at a cost of limited
penetration depth due to frequency dependent attenuation
– Good access to target tissues are necessary for success
Primary Applications• Ophthalmology
• Dermatology
• Intravascular studies• Small animal models
Laterial Resolution vs. Center Frequency
0
50
100
150
200
250
300
0 25 50 75 100 125 150Center Frequency f0 (MHz)
Rla
teri
al( µµ µµ
m) f#=2.9
f#=0.7
4
Current High Frequency Ultrasonic Transducers for Medical Imaging
Single Element Annular Array Linear Array
• Fixed geometric focus
• Mechanically scanned to form image
Variable electronic focus
• Mechanically scanned to form image
Variable electronic focus
Electronically scanned to form image
2
5
Outline
• Traditional Ultrasound Biomicroscope (UBM)
• Single Element Transducers• UBM Applications• Annular Arrays• Linear Arrays• Future Technologies
6
Ultrasonic Biomicroscope (UBM)
2-D Motor
Function Generator
Motor Control Unit
Pulser + Receiver
A/D Card
HF transducerHF transducer
Target
7
UBM Imaging (Typical Image Scan Types)
a) Linear Scan
c) Sector Scan
Image display
Transducer
b) Arc Scan
d) Rotational Scan
8
Single Element Transducers
1) Standard• Linear and Arc Scanning
2) Light-weight• High Frame Rate Sector
Scanner
3) Catheter• Rotational Scanning
(IVUS)
12
3
3
9
Typical Single Element Transducer
Major Components• Piezoelectric Element
– Convert electrical signals to mechanical/acoustical signals and vise versa
• Matching Layers– Acoustically match piezo-
element to load medium (soft-tissue)
• Backing Layer– Provide rigid support to
piezo-element and attenuate sound
Second MatchingLayer
+
-
RF Connector
Metal Housing
Backing Layer
Insulating Epoxy
Piezoelectric Element
First Matching Layer (conductive)
10
Choosing a Piezoelectric for…
Large Aperture Transducers (Single Element)– Low Dielectric Permittivity (ε33
S/ε0)• For electrical impedance (ZE ) matching (large element area)
– High kij (Electro-mechanical Coupling Coefficient)• Improvement in bandwidth/resolution and image SNR
– Low Acoustic Impedance • To match the impedance of soft tissue (~1.5 MRayls)
Small Aperture Transducers (Array Elements)– High Dielectric Permittivity (ε33
* Ref: Yuan J.R., Jiang X., Cao P.J., Sadaka A., Bautista R., Snook K., Rehrig P.W., “High frequency piezo composites microfabricated ultrasound transducers for intravascular imaging, Proceed. of the 2006 IEEE Ultrason. Symp., pp. 264-268. 12
UBM Applications: Ophthalmology
In vivo Images are courtesy of Dr. Ron Silverman at Weill Medical College at Cornell University
Normal Eye
Iris Tumor
Arc scan image @ 50 MHz
30-80 MHz
4
13Images are from www.bostonscientific.com
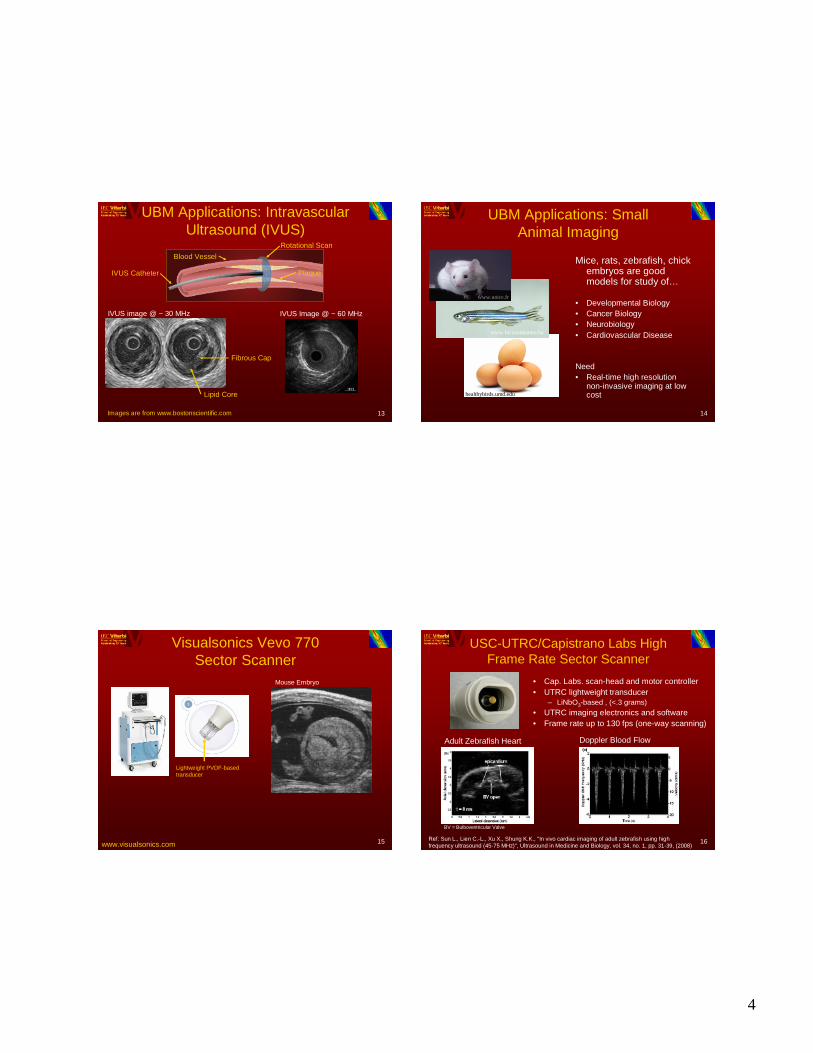
UBM Applications: Intravascular Ultrasound (IVUS)
Lipid Core
Fibrous Cap
IVUS Catheter
Blood Vessel
Plaque
IVUS image @ ~ 30 MHz IVUS Image @ ~ 60 MHz
Rotational Scan
14
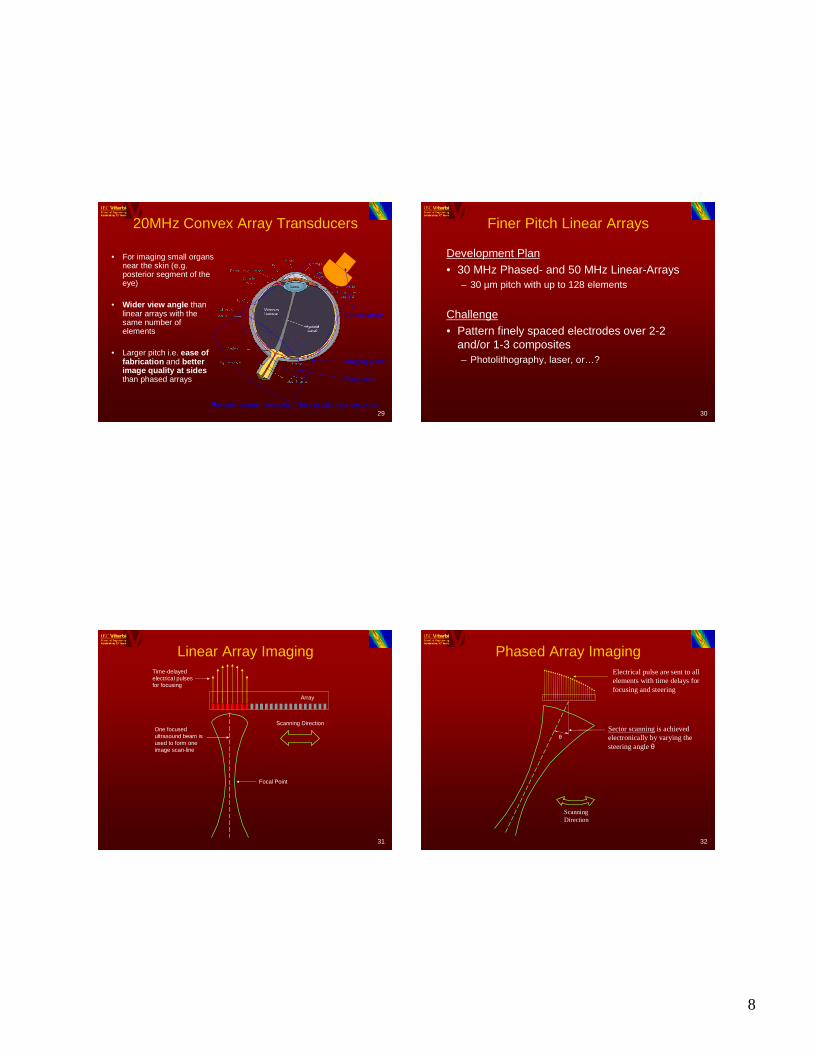
UBM Applications: Small Animal Imaging
Mice, rats, zebrafish, chick embryos are good models for study of…
• Developmental Biology• Cancer Biology• Neurobiology• Cardiovascular Disease
Need• Real-time high resolution
non-invasive imaging at low cost
www.unice.fr
www.focusonnature.be
healthybirds.umd.edu
15
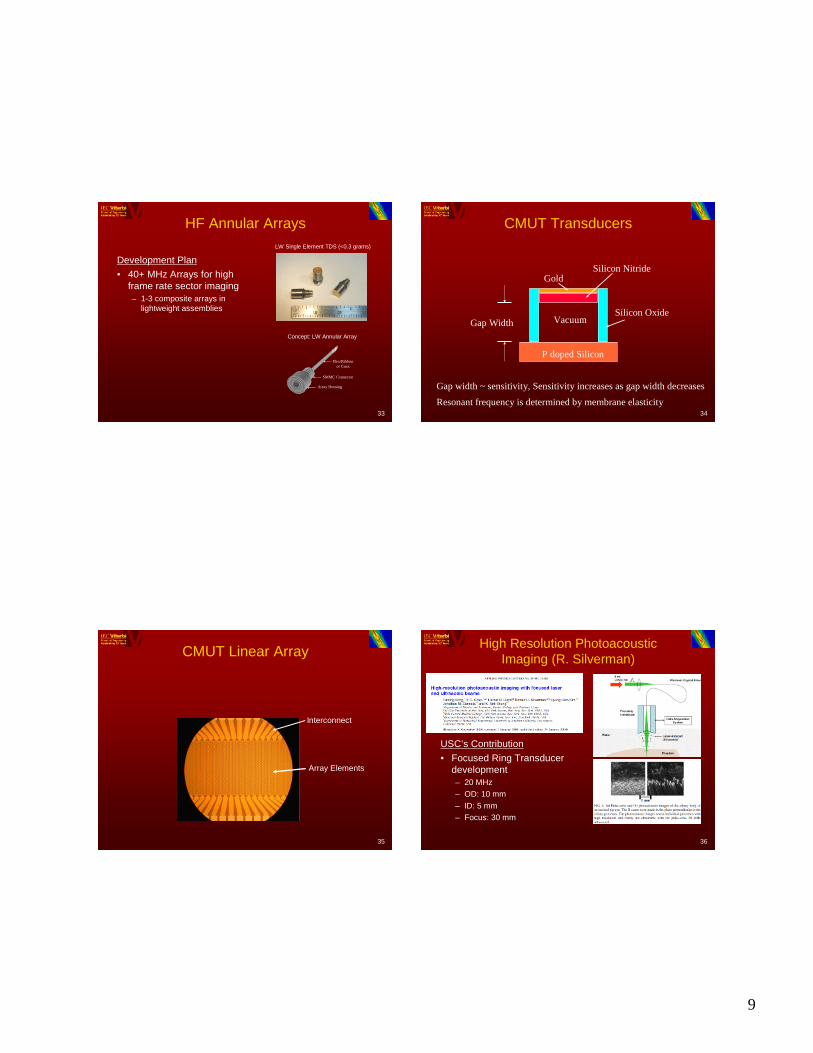
Visualsonics Vevo 770 Sector Scanner
Lightweight PVDF-based transducer
www.visualsonics.com
Mouse Embryo
16
USC-UTRC/Capistrano Labs High Frame Rate Sector Scanner
• Cap. Labs. scan-head and motor controller• UTRC lightweight transducer
– LiNbO3-based , (<.3 grams)• UTRC imaging electronics and software• Frame rate up to 130 fps (one-way scanning)
Adult Zebrafish Heart Doppler Blood Flow
Ref: Sun L., Lien C.-L., Xu X., Shung K.K., "In vivo cardiac imaging of adult zebrafish using high frequency ultrasound (45-75 MHz)", Ultrasound in Medicine and Biology, vol. 34, no. 1, pp. 31-39, (2008)
BV = Bulboventricular Valve
5
17
UBM Improvements Needed
Needs• ↑ Depth of Field
– Quantitative measurements of structures
• ↑ Frame Rate– Cardiac Imaging
• Color Doppler Blood Flow Visualization
Solutions• High Frequency Annular and Linear Arrays
18
Annular Arrays Improve Image Depth of Field (DOF)
Single Element Transducer • Fixed focus and limited
Ref: Gottlieb E.J., Cannata J.M., Hu C.-H., Shung K.K., "Development of a high-frequency (>50 MHz) copolymer annular-array, ultrasound transducer", IEEE Transactions on Ultrasonics, Ferroelectrics, and Frequency Control, vol. 53, no. 5, pp. 1037-1045, (2006)
20
Mouse Embryo Images with a 40 MHz Annular Array
Ref: Aristizábal O., Turnbull D.H., Ketterling J.A., “Mouse embryo imaging with a 40 MHz annular array", Proceedings of the 2005 IEEE Ultrasonics Symposium, pp. 361-364.
Clinical Images: Single vs. Dual (Courtesy of Ron Silverman)
More clearly depicted optic nerve (ON) cup
Improved depiction of the overlying retina and scleral border
Greater shadowing by the lesion
DualSingle
6.3 mm
Ref: H. H. Kim, J. M. Cannata, R. Liu, J. H. Chang, R. H. Silverman, and K. K. Shung, “20 MHz / 40 MHz dual element transducers for high frequency harmonic imaging,” accepted to IEEE Trans. Ultrason. Ferroelect. Freq. Contr., 2008.
43
100 MHz Sputtered ZnO Transducers
ParyleneMatching Layer
Pre-CurvedAluminum Backing
ZnO
SMA Connector
Metal Housing
Insulating Epoxy
Design• ZnO is sputtered directly
on a pre-curved aluminum backing layer
• Two Device Geometries– 2mm Aperture, f#=1
– 3mm Aperture, f#=1
44
ZnO Film Deposition
• MRC (Mat. Res. Corp.) 822 Sputtersphere
– ~300 °C operating temp.– ~0.5 µm/hr deposition rate
– 50 % O2 and 50 % Ar @ 10 mTorr
– 230 W RF-Power
12
45
Al Backing Preparation
1. Machined Al Rod 2. Lap/Polish Flat End 3. Press Spherical Shape
4. Machine to Final Dimensions
46
ZnO Film
Al Backing
ZnO
18 µm
Note: Crystal growth is perpendicular to Al surface
47
ZnO TD Performance
Lateral distance (mm)
Axi
al d
ista
nce
(mm
)
-0.04 -0.02 0 0.02 0.04
2.02
2.04
2.06
2.08
2.10
-414610625
-42429634
-475110523
-444910122
14.4/16.7454310721
Axial/Lat. Resolution -6dB (µm)
IL (dB)
-6 dB BW (%)
CF (MHz)
Aperture (mm)
Transducer #
Time (µs)
2.70 2.75 2.80 2.85
Am
plit
ude
(mV
)
-30
-15
0
15
30
Frequency (MHz)
20 40 60 80 100 120 140 160 180
Am
plitu
de (d
B)
-40
-30
-20
-10
0
Echo Response: TD #2
Wire Phantom Image: TD #1
48
Zebrafish Eye Images2mm dia. TD (#1)
Lateral dimension (mm)
Axi
al d
imen
sion
(mm
)
0 0.5 1.0 1.5 2.0 2.5 3.0 3.5 4.0
1.8
2.0
2.2
2.4
2.6
2.8
Lateral dimension (mm)
Axi
al d
imen
sion
(mm
)
0 0.5 1.0 1.5 2.0 2.5
1.8
2
2.2
2.4
Displayed Dynamic Range: 45 dB
Ref: Cannata J., Williams J., Zhou Q., Yu H., Sun L., Kim E.S., Shung K.K., “Self-Focused ZnOTransducers for Ultrasonic Biomicroscopy", Journal of Applied Physics, Accepted Feb. 2008.