• Evaluation – prospective– Center for Evaluation and Coordination (CEC) as a model:– BUILD; NRMN
• Tracking – Electronic submission (Diversity supplements; Progress Reports)– Monitoring through eRA Commons ID– ORCID ID
Awards made October 2014BUILD: 10 sites/experimentsNRMNCECTotal: $250 million (5 years)
BUILD • California State University Long
Beach• California State University
Northridge• Morgan State University• Portland State University• San Francisco State University• University of Alaska Fairbanks• University of Detroit Mercy• University of Maryland Baltimore
County• University of Texas El Paso• Xavier University of Louisiana
National Research Mentoring Network (NRMN)• Boston College; Morehouse
SM; U. Min.; U. North Texas; U. Wisconsin
Mentoring, Career Development, Recruitment, Retention: Building Infrastructure Leading to Diversity (BUILD)
Hispanic-Serving
Institutions
HistoricallyBlack
Colleges and
Universities
State Colleges
PublicUniversities
Total of 10 Sites/Experiments
Coordination and Evaluation Center (CEC)
University of California Los Angeles
Scientific Approach to Enhancing the Diversity of the Biomedical Research Workforce
• BUILD:10 experiments each with:- Hypothesis- Intervention and control groups- BUILD vs Non-BUILD institutions
• Three levels of impact: student, faculty, and institution
• Integration of social science research and psychosocial interventions into the process of training and mentoring
• Rigorous assessment and evaluation of the training and mentoring interventions implemented across the program
- Hallmarks and metrics of success
BUILD: “Clinical Trial” Model of Investigation Short to Medium-Term
Outcomes
Satisfaction with Faculty Mentorship
Enhanced Self-Efficacy & Science Identity
Engagement in Research
Social Integration
Pursuit & Persistence in Biomedical Science Disciplines
Scientific Presentations and Authorship of Manuscripts
Intent to Pursue Biomedical Research Career
Medium to Long-Term Outcomes
Completion of Undergraduate Degree in Biomedical Science
Application & Acceptance to Graduate Programs
Research Fellowships & Scholarships
Evidence of Biomedical Career Preparedness
Independent Variables
GenderRace/Ethnicity
Disability StatusSocio-economic Status
Institutional FactorsTest Scores
MajorGPA
Activities or Interventions
Financial Support Academic Advising & Support Research Training & Support
Novel Curricula Mentoring
Diversity Training Career Development
Grantee institution
Time 1
BUILD
non-BUILD
Grantee institution
BUILD
non-BUILD
Times 2, 3, …
Comparison institution
non-BUILD
Comparison institution
non-BUILD
Grantee institution
Prior to BUILD (HERI)
non-BUILD
Comparison institution
non-BUILD
Consortium-Wide Evaluation Design: *BUILD; BUILD vs non-BUILD Institutions
*Intervention vs control groups within BUILD institutionsHERI:
HIGHER EDUCATION RESEARCH INSTITUTE
BUILD: Testable InterventionsImpact on pre-defined outcomes of:
DPC Progress, Challenges and Future Directions, September 2016
• Reducing stereotype threat• Diminishing imposter syndrome• Overcoming microaggressions• Mitigating unconscious bias• Increasing cultural awareness and sensitivity• Emphasizing cultural assets• Engaging family and support systems
• Science identity• Providing financial assistance • Providing authentic research experiences• Implementing active learning courses• Forming supportive cohorts and learning communities• Mentor training• Creating professional networks
• Social contextual phenomenon that occurs when environmental signals and being in the numerical minority elicit worries that one’s actions will reinforce negative stereotypes about one’s race/ethnicity, leading to underperformance – “Cognitive tax”
• ST is a stronger predictor for URM early exit from STEM majors than lack of academic preparation
BUILD Experiment on Stereotype Threat (ST)San Francisco State University
• Speaking Truth to EmPower (STEP)• Hypothesis: STEP will protect URMs’ intellectual
performance from ST and bolster URMs’ intellectual safety
• Randomized controlled trial, 3 conditions (URM, non-URM for each)––
–
1. Baseline threat (control)2. Values affirmation (“standard of care”):
• Focus, reflect, and write about positive life factors: friends, family, personal interests
3. STEP intervention• Combines knowledge (tutorial) and actions (imagine
individualized ST “lived experiences” and plan what to do)
Results: BUILD Experiment on Stereotype Threat
A ‘Speaking Truth’ Intervention Protects Underrepresented Minorities’ Intellectual Performance and Safety in STEM. Avi Ben-Zeev et al, unpublished data (under review)
Course Grades Abstract Reasoning
Resilience
Baseline Threat
Values Affirmation
STEP
URM Non-URM URM Non-URM
URM Non-URM
Example: Consortium-wide Student-Focused InterventionA strong science identity leads to persistence in science -certain activities and interventions increase science identity:
• A research-infused curriculum
• Engagement in laboratory research
• Presentations of research findings
• Understanding and overcoming the psychosocial barriers to feeling a sense of belonging in the scientific community (site-specific)
Measuring Science IdentitySurvey Items “I have a strong sense of belonging to a community of scientists” “I derive great personal satisfaction from working on a team that is doing important research” “I think of myself as a scientist” “I feel like I belong in the field of science”
Short-Term: Exposure to BUILD activities will result in stronger “science identity”
Estrada-Hollenbeck, M., et al (2011). Journal of Educational Psychology, 103(1), 206–222
Longer-Term: Stronger science identity will in turn predict (a) persistence in biomedical major, (b) graduation with biomedical bachelors degree and (c) matriculation to graduate school in biomedical science
Science Identity STEM Freshmen by Race/Ethnicity – BUILD vs non-BUILD Institutions
Incoming Freshmen*
48.050.052.054.056.058.060.062.0
Freshmen - End of Year*
48.050.052.054.056.058.060.062.0
BUILD National
Stro
ngly
Agr
ee (%
)
* Source Data:Incoming Freshmen: From Fall 2016 HERI Freshmen End of Year: From Spring 2016 HERINational Comparison = same non-BUILD institutions Fall & Spring
2015/16 2016/17 2017/18 2018/19
Seniors(N=3,499)
Grad Students Grad Students Grad Students
Juniors(N=3,475) Seniors Grad Students Grad Students
Sophomores Juniors Seniors Grad Students
Sophomores Juniors Seniors
Sophomores Juniors
Sophomores
Freshmen(N= 5,011)
Freshmen(N= 5,982)
Freshmen(N~5,000)
Freshmen(N~5,000)
Spring 2019 Annual Survey
(N~20,500)
Recruitment/Enrollment* of BUILD Student Participants - Cohorts 2015-2019
Some Data Trends…............
*Entire enrollment includes subjects and controls
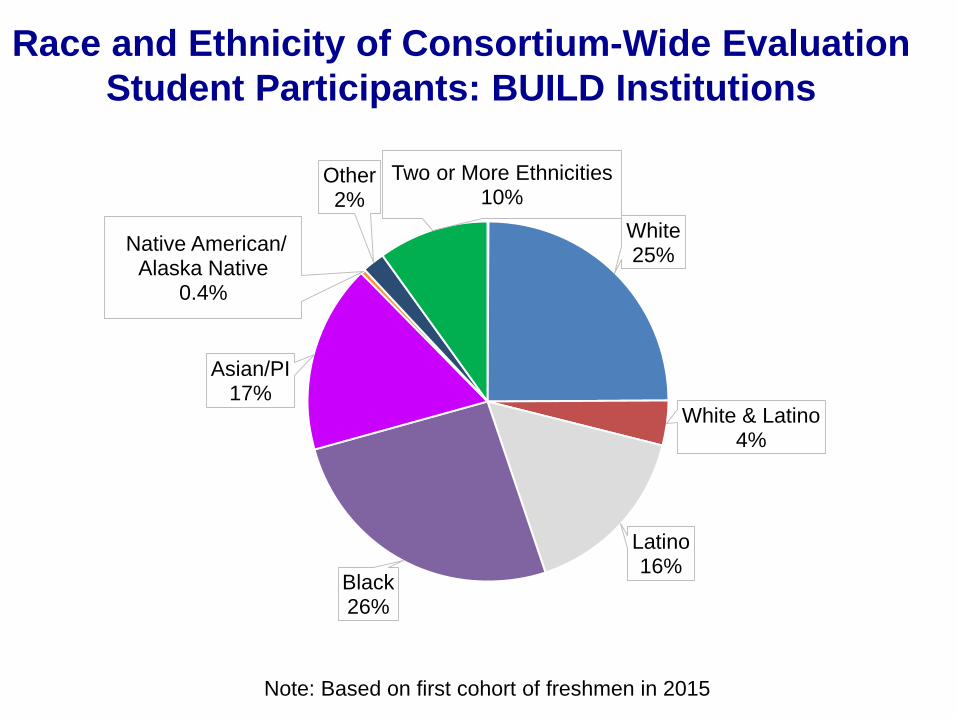
Race and Ethnicity of Consortium-Wide Evaluation Student Participants: BUILD Institutions
White25%
White & Latino4%
Latino16%
Black26%
Asian/PI17%
Native American/ Alaska Native
0.4%
Other2%
Two or More Ethnicities10%
Note: Based on first cohort of freshmen in 2015
Student Activity Tracking Tool
Mentoring800
Career Development1400
Novel Curricula
1010BUILD
Financial Support
284Diversity Training
46
Research Training & Support
1500
Academic Advising &
Support1750
0200400600800
100012001400160018002000
Mentee
Part
icip
ants
Student Activity
Example of Tracking Data
• Individuals tracked by their activities and linked to outcomes• Data is tracked in the same way• Stores all data in one location • Ensures data will be accessible in future years
Example: Faculty Focused HypothesisCertain interventions contribute to increased self-efficacy, resulting in improvements in research-related successInterventions include:
• Rigorous pilot project funding process• Protected time for research• Grant writing workshops• Grant writing coaches
BUILD
Surveys address self-efficacyHallmarks include: presentations at meetings, publications, external funding
Race/ethnicity of trainees who submitted grant applications post-NRMN training (as of March 24, 2017), N = 66
BUILD
Race/ethnicity of trainees who submitted grant applications post-NRMN training (as of March 24, 2017), N = 66
White21%
Black31%
Hispanic26%
Asian14%
Multiracial3%
American Indian2% Other
2%Hawaiian/Pacific
Islander1%
Mentees: N = 3,574
White
Black
Hispanic
Asian
Multiracial
American Indian
Other
Hawaiian/Pacific-Islander
Mentors: N = 1,929
White48%
Black16%
Hispanic18%
Asian13%
Multiracial2%
American Indian2%
Other1% Hawaiian/Pacific
-Islander0%
NRMNet Registrant Race and Ethnicity (6/1/17)
• Scientific opportunities in the intramural research program (IRP)
• Underrepresentation: Pipeline, attrition
• Women
• Race/ethnicity
• Enhancing diversity in the IRP – SWD partnership
• Recruitment and retention of tenure-track scientists
• SWD tools
• Implicit bias education
Targeted Recruiting and Retention:Enhancing NIH Intramural Diversity
Expanding Diversity of Candidate Pools: Junior Career Stage
Postdoctorates and Assistant Professors
• ~ 667 total, top 1/3rd culled• 4-10 years post-doctorate (most 4-7)• Authorship in top journals• 10+ publications: 357• 100+ citations: 407• 200+ citations: 311
23%
31%25%
1%
15%5%
Race/Ethnicity
White/Caucasian
African-American/BlackHispanic/Latino
Native American
Asian
Other
52%48%
GenderFemale
Male
Research and Interventions: Addressing Racial Funding Disparities
Intervention Targets
Submissions• Institution• Topic
Review• Less discussed• Score• Fewer re-
submissions• Topic
Funding• IC Council
review• Paylines, select
pay• Topic
Mentoring/coaching pilotto enhance submission and re-submission
• Information on re-submission outreach
• Anonymized application review study
• IC select pay analysis• Topic further analyses
• Health disparities• Minority health
Anonymized Review Study to AssessBias in Peer Review
• Request for Proposals: 2016, study now underway• 1,200 R01s (previously submitted, 3 cohorts)
– AA/B applicants– WH applicants (matched on sex, institutional types, score)– Randomly selected sample of WH applicants – Multiple reviewers will assess each anonymized or non-
anonymized application, using standard CSR review criteria
• Will evaluate resulting scores for differences that may be due to race awareness, institution reputation, sex, and seniority
Ongoing Projects and Analyses
• NIH Steering Committee Diversity Working Group– Diversity supplements: electronic tracking, work
under way
• Addressing Gender Inequality in the NIH Intramural Research Program Action Task Force– Implementation under way
• ACD Working Group Subcommittee on Workplace Climate and Harassment– With EDI, work under way, scientifically
designed survey early 2018
0
200
400
600
800
1000
1200
1400
1600
1800
2000
URMs (AA/B, H, AI/AN)
Num
ber o
f Doc
tora
te R
ecip
ient
s
Average Number of URM Doctorate Recipients2000-2012
2006-2012
2000-2006
1,274 URG PhDs(~9% total pool)
1,747 URG PhDs(~10% total pool)
38% increase
Where Are We Now? Setting the Stage for Next Steps
Where Are We Now? Setting the Stage for Next Steps
• ~10% of all PhD earners, 2006-2012:
• ~780 AA/B (~4% of entire pool)• 1% of all NIH RPG awards, 5.3% of all K awards (2006-2015)
• ~950 Hispanic (~5.7% of entire pool)• 3.3% of all NIH RPG awards, 5.7% of all K awards (2006-2015)
• 30 AI/AN (0.2% of entire pool), 30 NH/PI (0.2% of entire pool)
0.0%
10.0%
20.0%
30.0%
40.0%
50.0%
60.0%
70.0%
80.0%
RPG Applicants and Awardees by Percent of Total, All NIH-supported
Fields, 2006-2015, by Race
Applications Awards
0.0%
10.0%
20.0%
30.0%
40.0%
50.0%
60.0%
70.0%
80.0%
90.0%
RPG Applicants and Awardees by Percent of Total, All NIH-supported Fields, 2006-
2017: Opportunity to Focus on Transition from Training to Career Independence
Valantine HA, Lund PK, Gammie AE. From the NIH: A Systems Approach to Increasing the Diversity of the Biomedical Research Workforce. CBE Life Sci Educ. Fall 2016;15(3). pii: fe4.
Estimate Of Fiscal Year 2015 Percentage Of Trainees And Early-career Scientists Being Supported By NIH (F; T; K)
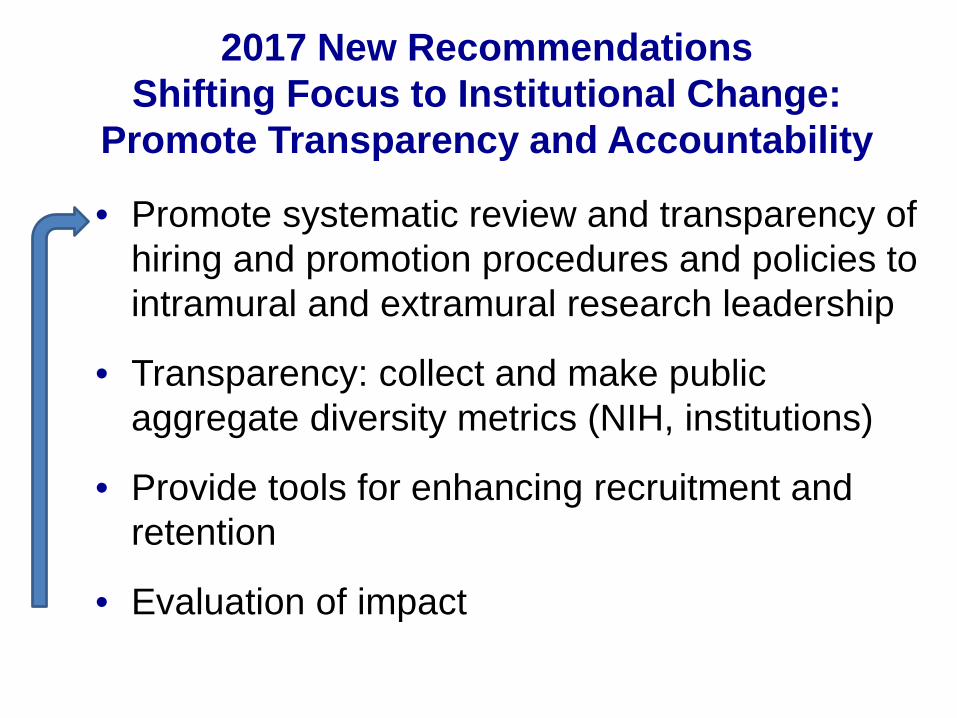
2017 New RecommendationsShifting Focus to Institutional Change:
Promote Transparency and Accountability
• Promote systematic review and transparency of hiring and promotion procedures and policies to intramural and extramural research leadership
• Transparency: collect and make public aggregate diversity metrics (NIH, institutions)
• Provide tools for enhancing recruitment and retention
• Evaluation of impact
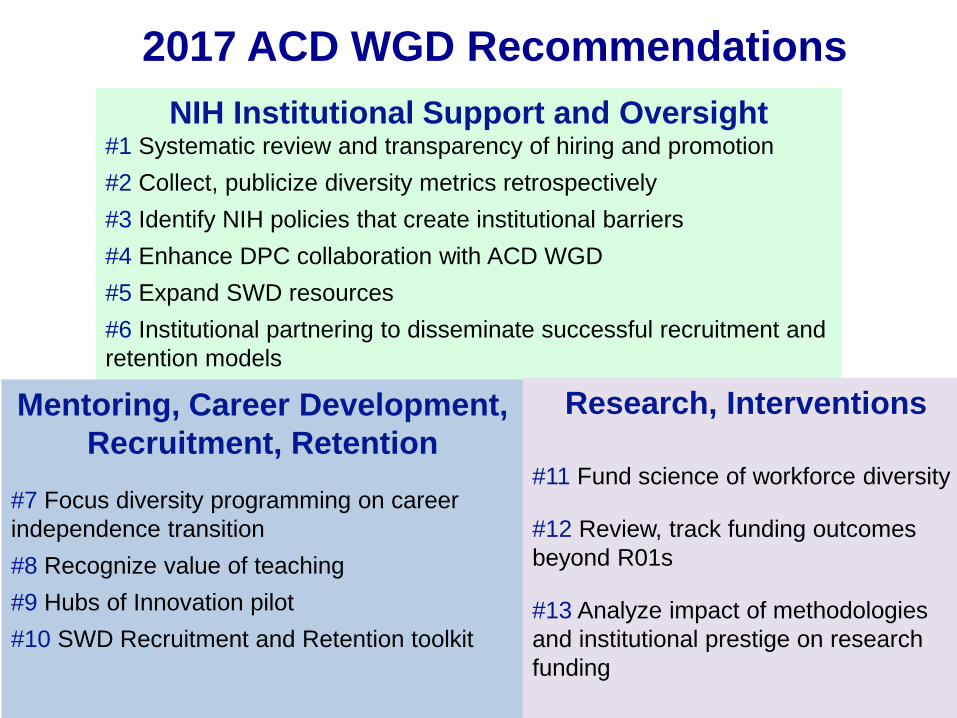
2017 ACD WGD RecommendationsNIH Institutional Support and Oversight
######
1 Systematic review and transparency of hiring and promotion2 Collect, publicize diversity metrics retrospectively3 Identify NIH policies that create institutional barriers4 Enhance DPC collaboration with ACD WGD5 Expand SWD resources6 Institutional partnering to disseminate successful recruitment and
retention models
Mentoring, Career Development, Recruitment, Retention
#
###
7 Focus diversity programming on career independence transition8 Recognize value of teaching9 Hubs of Innovation pilot10 SWD Recruitment and Retention toolkit
Research, Interventions
#
#
#
11 Fund science of workforce diversity
12 Review, track funding outcomes beyond R01s
13 Analyze impact of methodologies and institutional prestige on research funding
NIH Institutional Support and Oversight:Key Elements
• Institutional partnering to share successful recruitment, retention models
• Promote, disseminate institutional best practices– Implicit-bias education and mitigation
• Create and share climate survey• Training grants
– Diversity focus– Expand funding of fellowships – Expand SWD resources to meet growing mandate for data
collection, programming
Mentoring, Career Development, Recruitment, Retention: Key Elements
• Focus diversity programming, strategies, and policies on the transition from trainee to independent careers – Institutional accountability for faculty careers– Length of training, other barriers to career advancement
• Hubs of Innovation: public-private partnerships• SWD open-source recruitment and retention toolkit• Recognize value of teaching
– Expand workforce diversity of research faculty: role models– Expand IRACDA
• Continue interagency collaboration on K-12
Research and Interventions: Key Elements
• Fund science of workforce diversity– Effect of workforce diversity on science and science products
(identity is a proxy for cognitive diversity)– Expand and scale CEC to evaluate NIH diversity programs
• Review and track NIH policies, practices that affect funding outcomes– Mechanisms for funding translational, clinical, community-based
research– Research grant structure (MPI, # applicants per discipline per
institution)
• Investigate impact of methodologies, topic choice, and institutional prestige on funding outcomes– CSR anonymized review study– NIH-wide funding, review expertise for health-disparities research