Page 1
1
Measurement of the Secretion Dynamics of Insulin from Islets of Langerhans Using a Microfluidic
Device _________________
Nikita Mukhitov, Lian Yi, Michael G. Roper
Roper Research GroupFlorida State University
March 6th 2014
PITTCON 2014 Chicago, IL __________________________________
Page 2
2
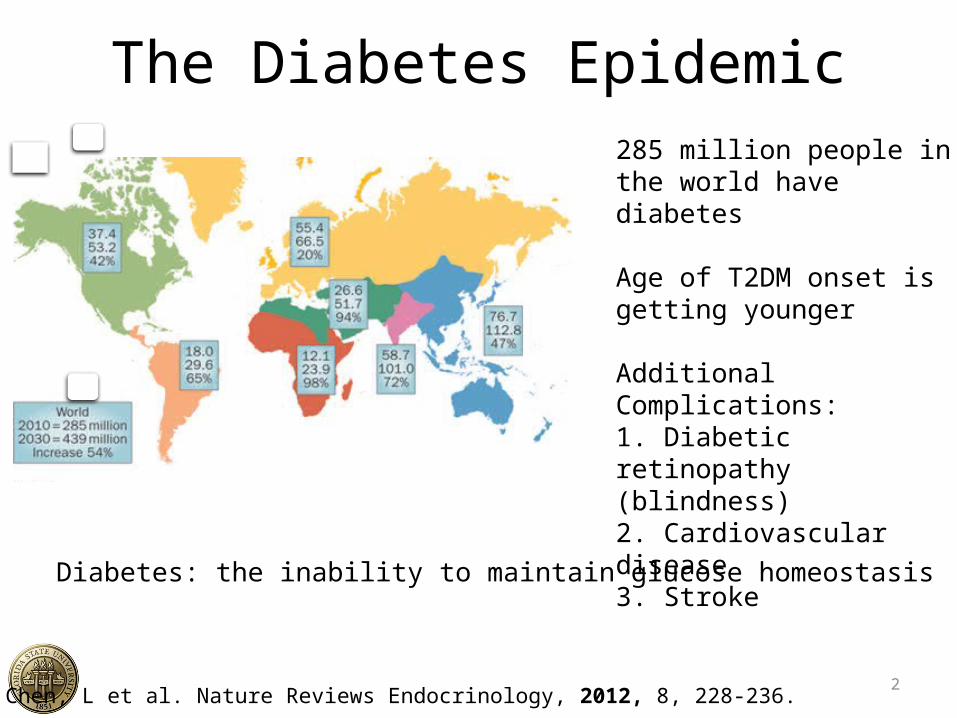
The Diabetes Epidemic
Chen, L et al. Nature Reviews Endocrinology, 2012, 8, 228-236.
285 million people in the world have diabetes
Age of T2DM onset is getting younger
Additional Complications:1. Diabetic retinopathy (blindness)2. Cardiovascular disease3. Stroke
Diabetes: the inability to maintain glucose homeostasis
Page 3
3
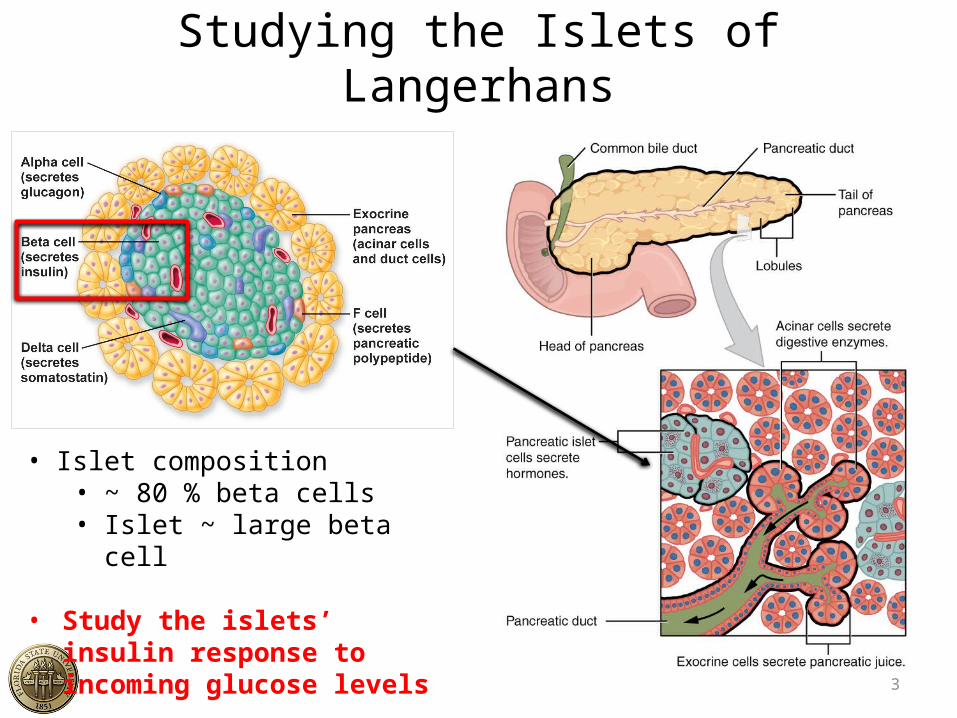
Studying the Islets of Langerhans
• Islet composition• ~ 80 % beta cells• Islet ~ large beta cell
• Study the islets’ insulin response to incoming glucose levels
Page 4
4
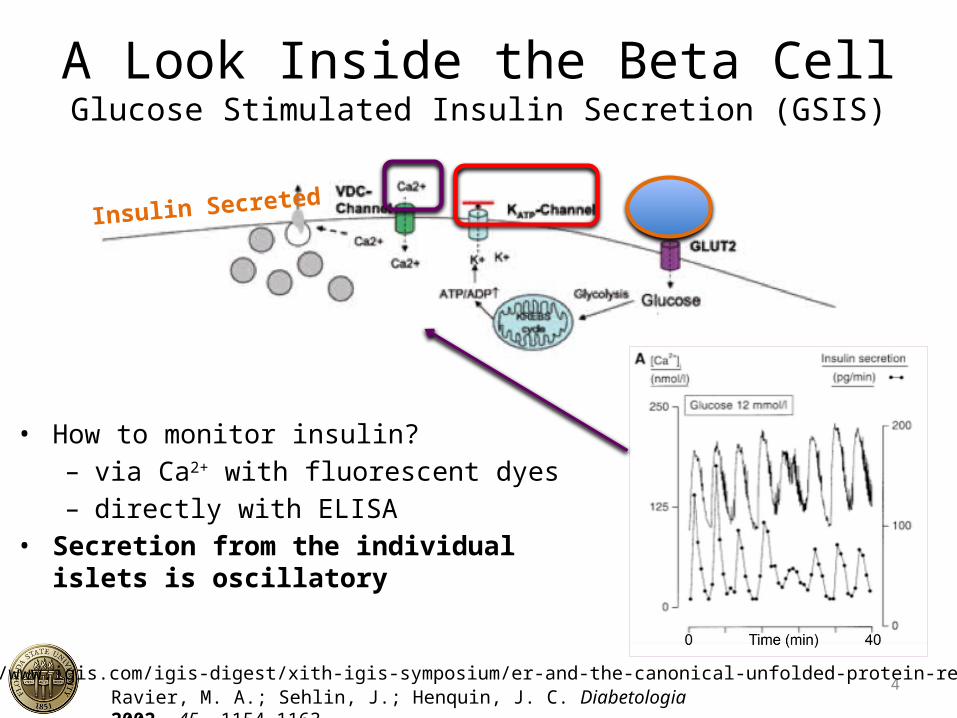
A Look Inside the Beta CellGlucose Stimulated Insulin Secretion (GSIS)
• How to monitor insulin?– via Ca2+ with fluorescent dyes – directly with ELISA
• Secretion from the individual islets is oscillatory
Ravier, M. A.; Sehlin, J.; Henquin, J. C. Diabetologia 2002, 45, 1154-1163.
http://www.igis.com/igis-digest/xith-igis-symposium/er-and-the-canonical-unfolded-protein-response-upr/
Insulin Secreted
Page 5
5
?
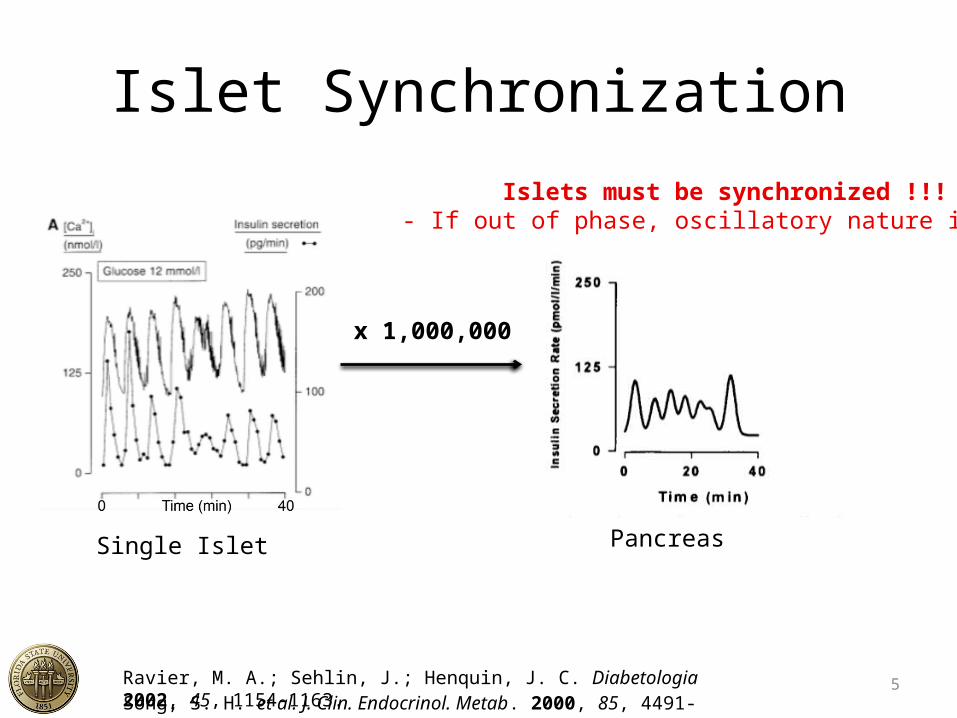
Islet Synchronization
Song, S. H. et al. J. Clin. Endocrinol. Metab. 2000, 85, 4491-4499.
Single Islet
x 1,000,000
Pancreas
Ravier, M. A.; Sehlin, J.; Henquin, J. C. Diabetologia 2002, 45, 1154-1163.
Islets must be synchronized !!!- If out of phase, oscillatory nature is lost
Page 6
6
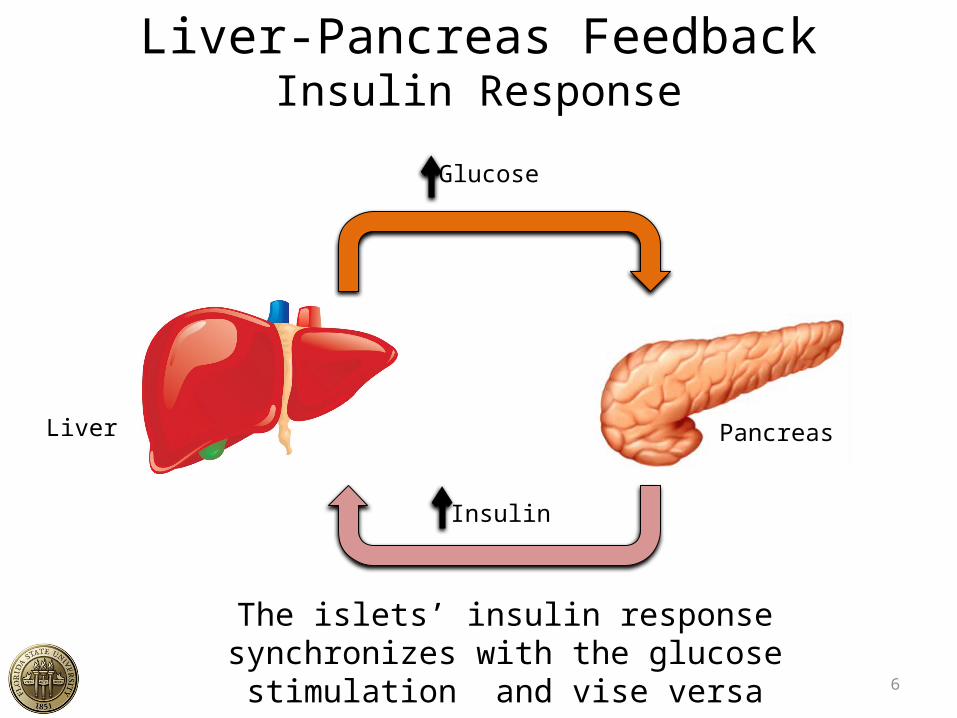
Liver-Pancreas FeedbackInsulin Response
Liver Pancreas
Glucose
Insulin
The islets’ insulin response synchronizes with the glucose stimulation and vise versa
Page 7
7
The Feedback Loop
1. Deliver [glucose] to islet
2. Monitor insulin as f(Ca2+) secretion
3. Utilize modelto predict liver response
4. Calculate expected changein [glucose] 6. Deliver new
[glucose] to islet
Keep iterating until synchronization achieved
Microfluidic Chip
Page 8
8
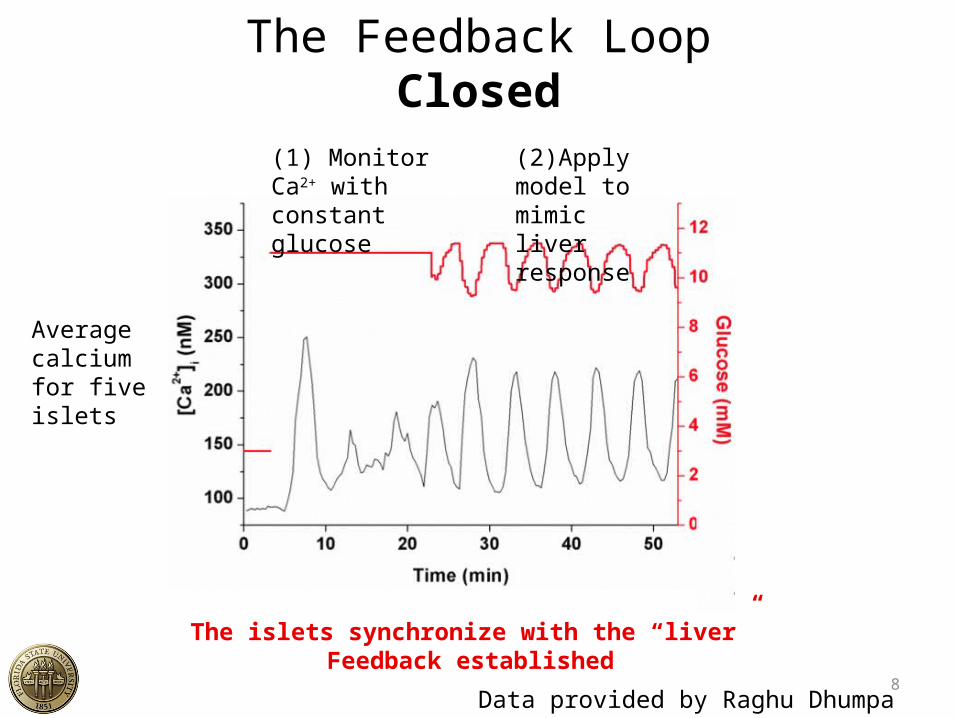
The Feedback LoopClosed
(1) Monitor Ca2+ with constant glucose
(2)Apply model to mimic liver response
The islets synchronize with the “liver”Feedback established
Data provided by Raghu Dhumpa
Average calcium for five islets
Page 9
9
Purpose: Measure insulin release under this dynamic interaction
How: Integrate previously developed methods for glucose
delivery and measurement of insulin secretion
Insu
lin
Page 10
10
Microfluidic Device
EOF Layer On the bottom;
~5 um deep and ~13 um wide
Perfusion LayerOn the Top;
~35 um deep and ~160 um wide
-Attach reservoirs with Epoxy adhesive
2.5 cmPhotolithography facilitated with OAI equipment
Page 11
11
Development of Cellular Perfusion System
• Flow is a function of syringe height on axis
• Very smooth flow • Total flow rate is constant (~1.1
uL/min)• Syringes are calibrated to the axes
position
Page 12
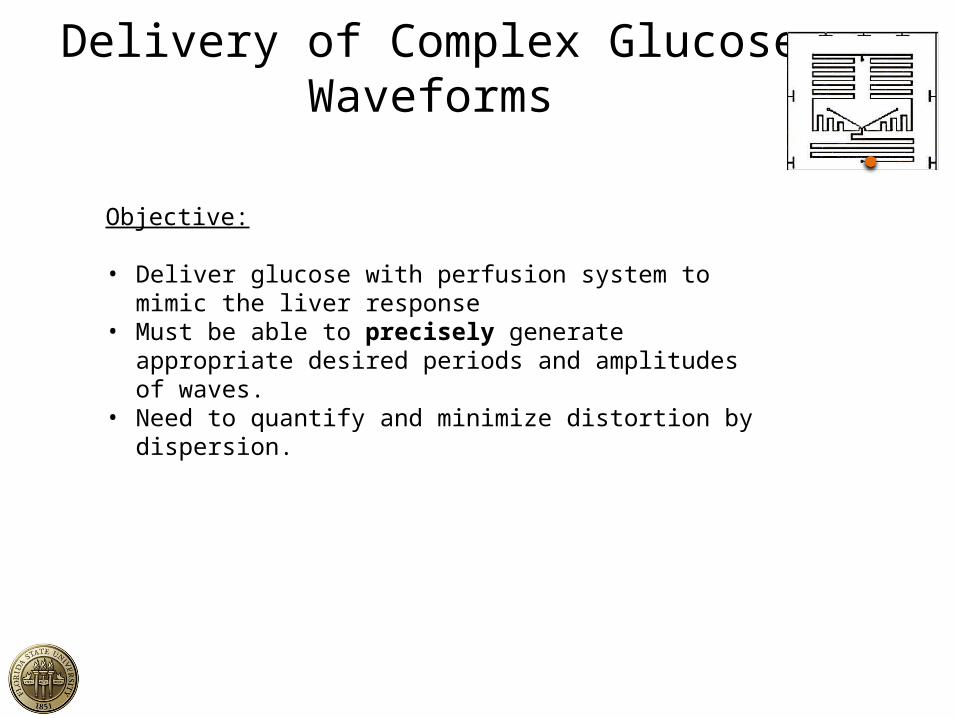
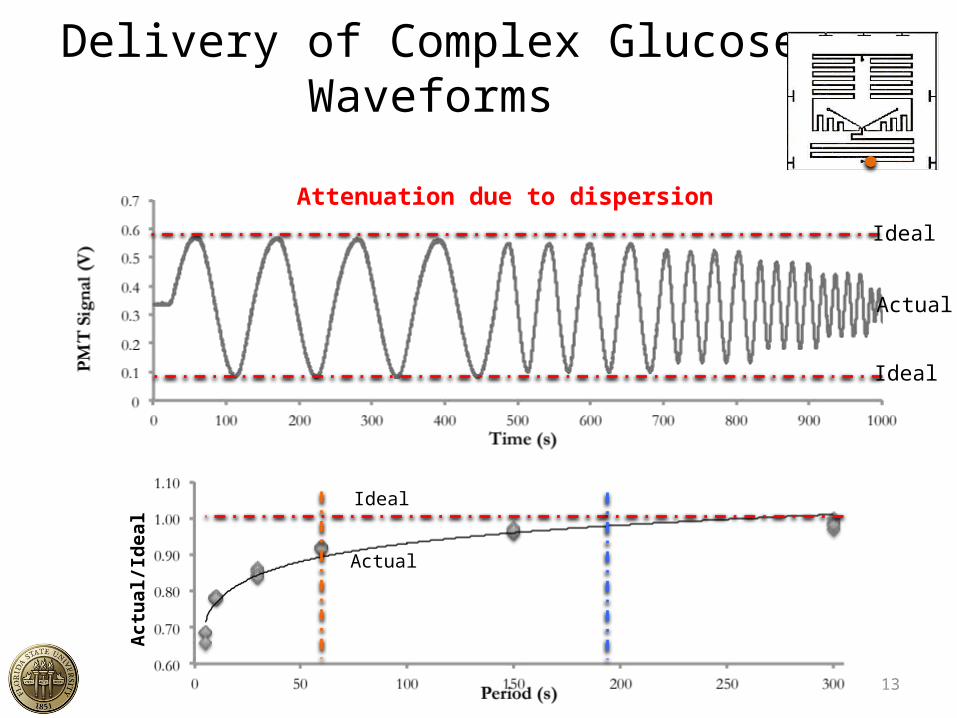
Delivery of Complex Glucose Waveforms
Objective:
• Deliver glucose with perfusion system to mimic the liver response
• Must be able to precisely generate appropriate desired periods and amplitudes of waves.
• Need to quantify and minimize distortion by dispersion.
Page 13
13
Delivery of Complex Glucose Waveforms
Ideal
Ideal Attenuation due to dispersion
Ideal
Act
ual/I
deal
Actual
Actual
Page 14
14
Perfusion successfully characterized and now to check integration
Page 15
15
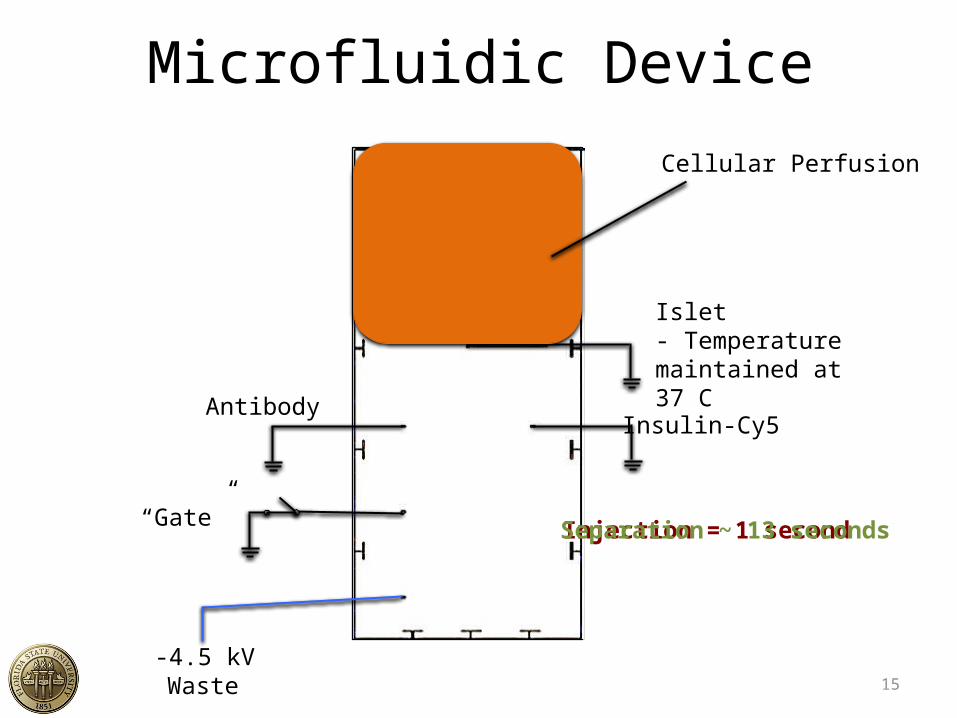
Microfluidic Device
-4.5 kV
Antibody Insulin-Cy5
Islet- Temperature maintained at 37 C
“Gate”
Waste
Cellular Perfusion
Injection = 1 secondSeparation ~ 13 seconds
Page 16
16
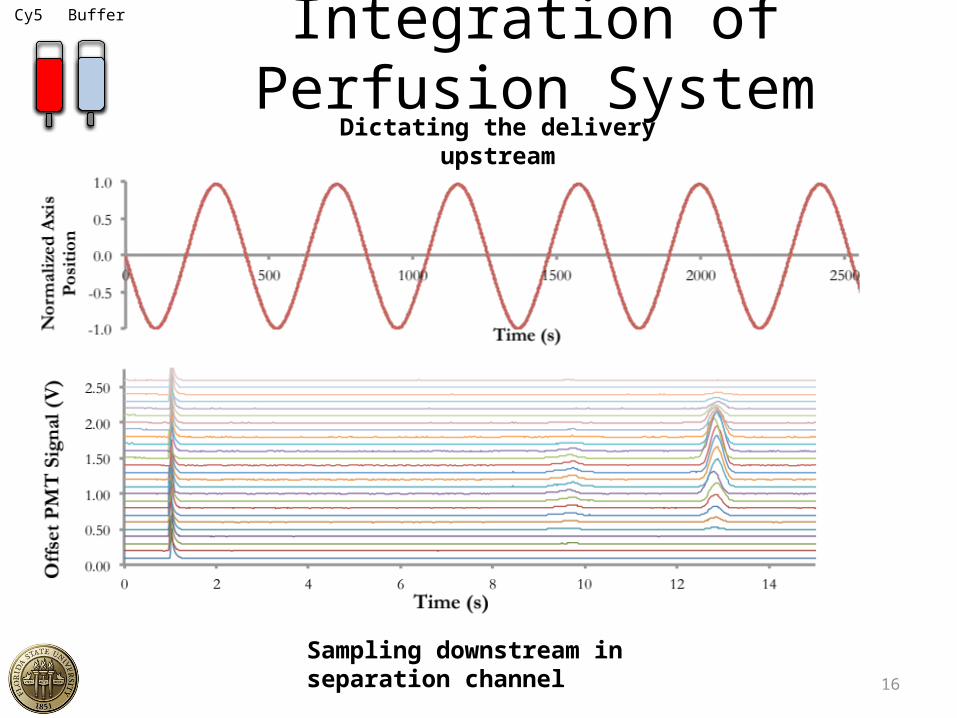
Integration of Perfusion System
Cy5 Buffer
Dictating the delivery upstream
Sampling downstream in separation channel
Page 17
17
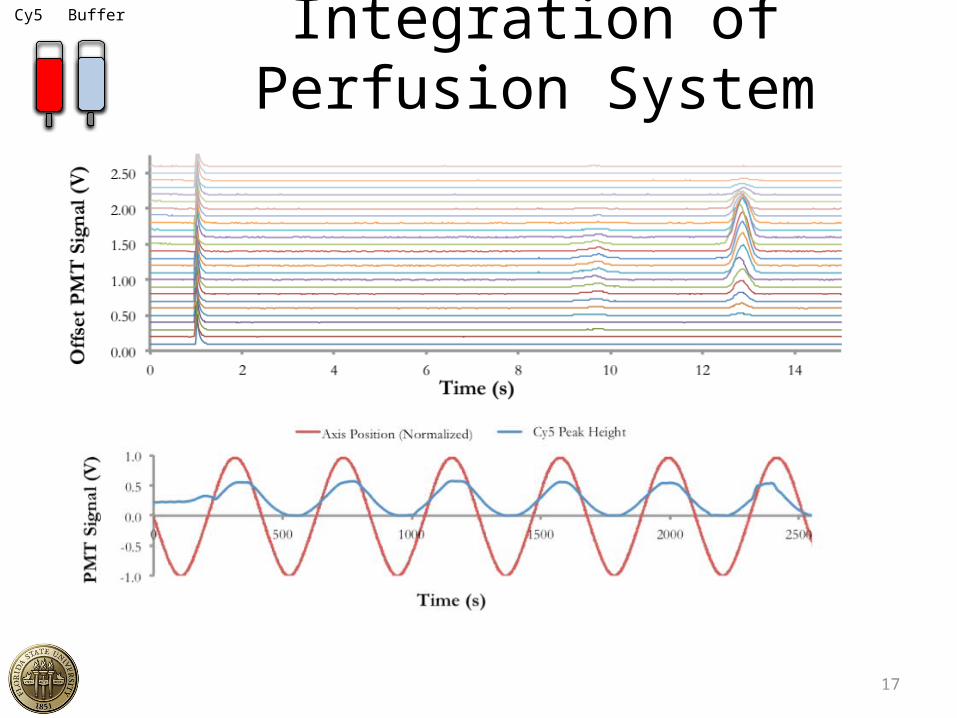
Integration of Perfusion System
Cy5 Buffer
Page 18
18
Integration complete
sampling, separation and detection+
cellular perfusion system_____________________
Apply to studying the islets
Page 19
19
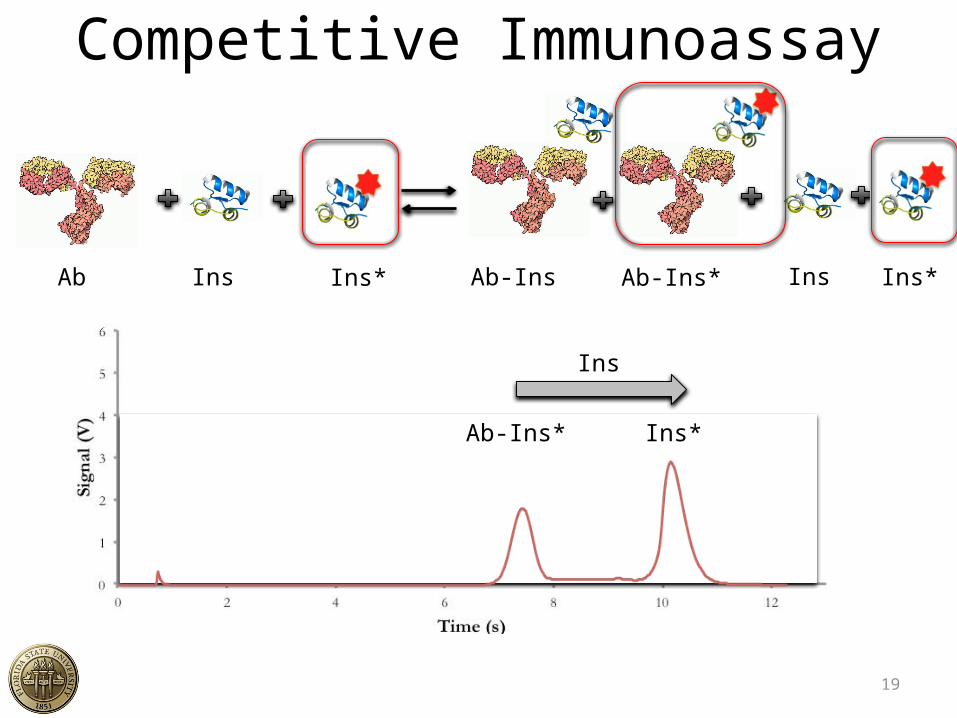
Competitive Immunoassay
Ins Ins* Ab-Ins InsAb Ab-Ins*
Ins
Ins*
Ins*Ab-Ins*
Page 20
20
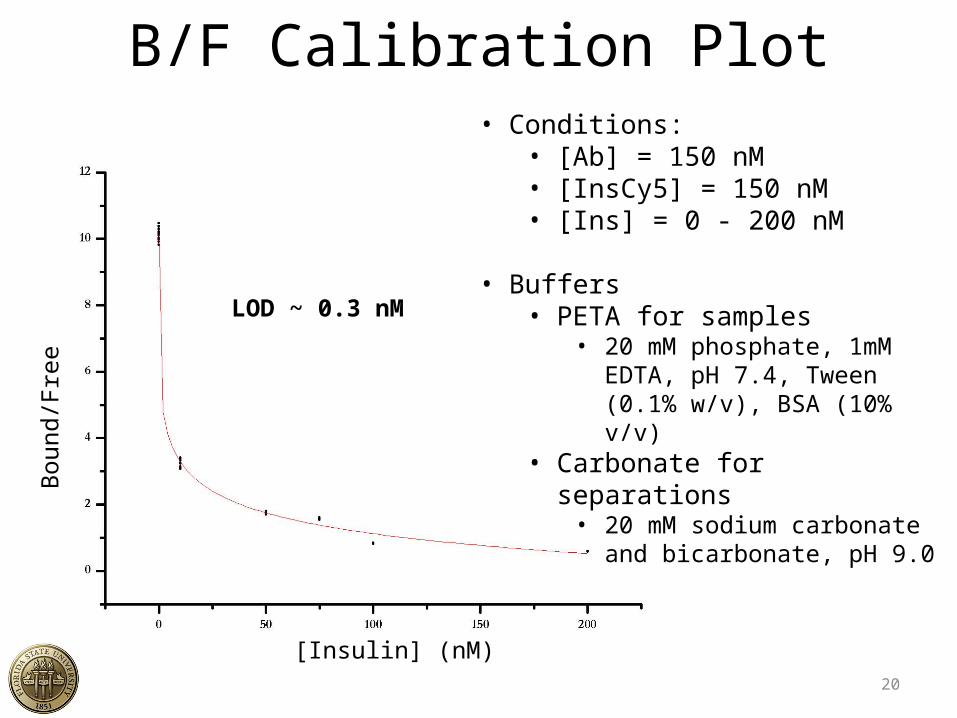
B/F Calibration PlotB
ound
/Fre
e
[Insulin] (nM)
• Conditions:• [Ab] = 150 nM• [InsCy5] = 150 nM• [Ins] = 0 - 200 nM
• Buffers• PETA for samples
• 20 mM phosphate, 1mM EDTA, pH 7.4, Tween (0.1% w/v), BSA (10% v/v)
• Carbonate for separations• 20 mM sodium carbonate
and bicarbonate, pH 9.0
LOD ~ 0.3 nM
Page 21
21
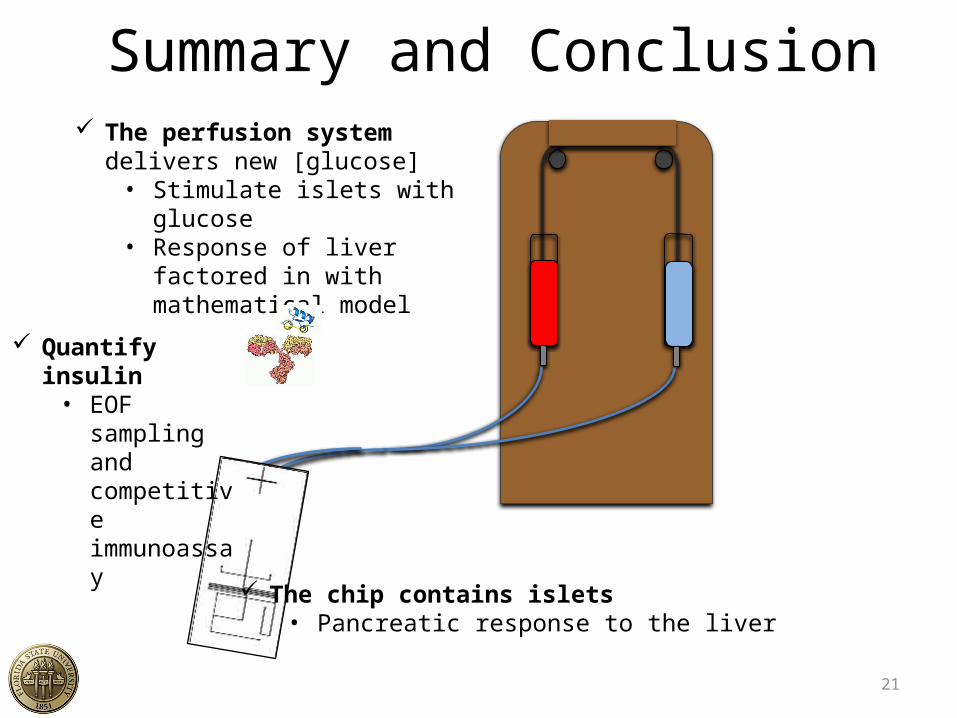
Summary and Conclusion The perfusion system
delivers new [glucose]• Stimulate islets with
glucose• Response of liver factored
in with mathematical model
Quantify insulin• EOF
sampling and competitive immunoassay
The chip contains islets • Pancreatic response to the liver
Page 22
22
Future Work• The stabilization of the immunoassay should
yield more reproducibility.– Apply the competitive immunoassay to real
time analysis of islet dynamics.• Utilize system on multi islet analysis.• Implement the insulin secretion data into model
revision.
Page 23
23
AcknowledgementsGroup
My group members for their patience, support and assistance in brainstorming:
– Lian, Adrian, Raghu, Tuan and Xue.
My PI, Mike Roper, for his support, guidance and motivation.
Funding
OAI Presentation GrantNIHFlorida State UniversityHoffman Fellowship
Page 24
24
Thank you for your time and questions