Graduate School Master of Science in Economics Master Degree Project No. 2012:47 Supervisor: Håkan Eggert Nile Perch Export and Welfare around Lake Victoria Has the boom in exports been positive for welfare? Jennie Bergman and Sandra Vieweg
Transcript
Graduate School Master of Science in Economics
Master Degree Project No. 2012:47
Supervisor: Håkan Eggert
Nile Perch Export and Welfare around Lake Victoria
Has the boom in exports been positive for welfare?
Jennie Bergman and Sandra Vieweg
Abstract
Alarming voices claim that the increased revenues from the Nile Perch industry in Lake Victoria
fail to benefit the local population. This paper aims to investigate the evolution of welfare and
income inequality alongside the expansion of the Nile Perch export industry in the regions of
Mwanza and Mara, Tanzania, during the past 20 years. We find evidence of a decreased poverty
and convergence between rural and urban areas in the regions. However our results also indicate
increased income inequality with the fishing villages being especially poor compared to the
region. Hence the revenues from the increased exports seem to have benefitted the Lake Victoria
region as a whole but failed to benefit the people directly involved in the fishing industry. The
unequal distribution of income between different actors is less apparent in the case of the Nile
Perch sector as opposed to other fish sectors. This fact suggests that the prevailing poverty in the
fishing communities is not mainly caused by the exports but rather due to an unequal
organization of the fish industry in general.
Acknowledgements
We would like to thank SIDA (Swedish International Development Cooperation Agency) for the
scholarship enabling us to perform our field work in Tanzania. Further, we appreciate and thank
Mr. Razack Lokina and Mr. Paul Onyango at the University of Dar-es-Salaam for their valuable
input to the subject of our thesis and for their patience while advising us on practical concerns
regarding our field work.
Moreover we are most grateful towards the staff at TAFIRI (Tanzania Fisheries Research
Institute) for their expertise and helpful approach during our work. Especially we would like to
thank the Director General at TAFIRI Dar-es-Salaam, Mr. Benjamin Ngatunga for his time.
Likewise we are grateful towards Mr. Joseph Luomba at TAFIRI Mwanza for his expertise and
professionalism while performing our survey in Igombe-Kayenze.
We would like to thank our supervisor Håkan Eggert at the University of Gothenburg for
providing us with inspiration, motivation and valuable advice during the process of our work.
Last but not least, we would like to thank our family and friends for their support during this
period and especially during our time in Tanzania.
Gothenburg, 31st of May 2012
Jennie Bergman and Sandra Vieweg
TABLE OF CONTENTS
ABSTRACT 1
ACKNOWLEDGEMENTS 2
I. INTRODUCTION 3
II. THE EVOLUTION OF LAKE VICTORIA FISHERIES 5
III. HOW TO MEASURE WELFARE AND INCOME DISTRIBUTION 8
DIFFERENT MEASUREMENTS OF WELFARE 8
INCOME INEQUALITY 9
IV. EMPIRICAL APPROACH 11
DATA 11
MEASURES 13
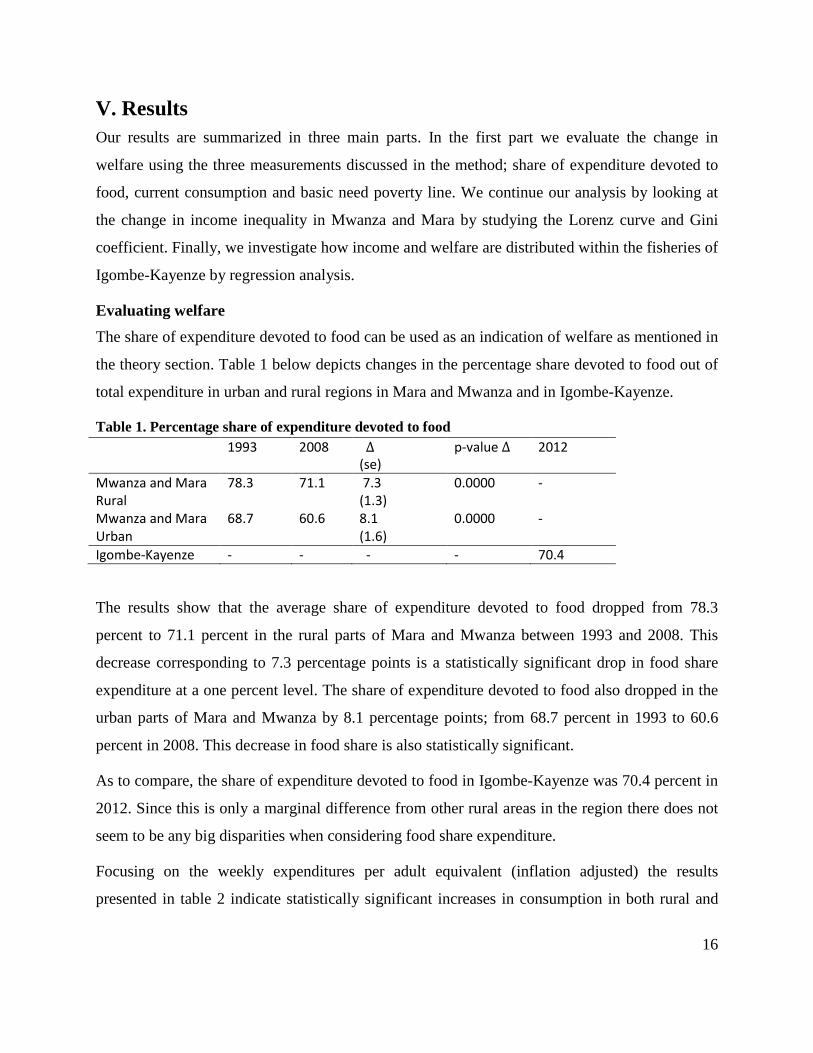
V. RESULTS 16
EVALUATING WELFARE 16
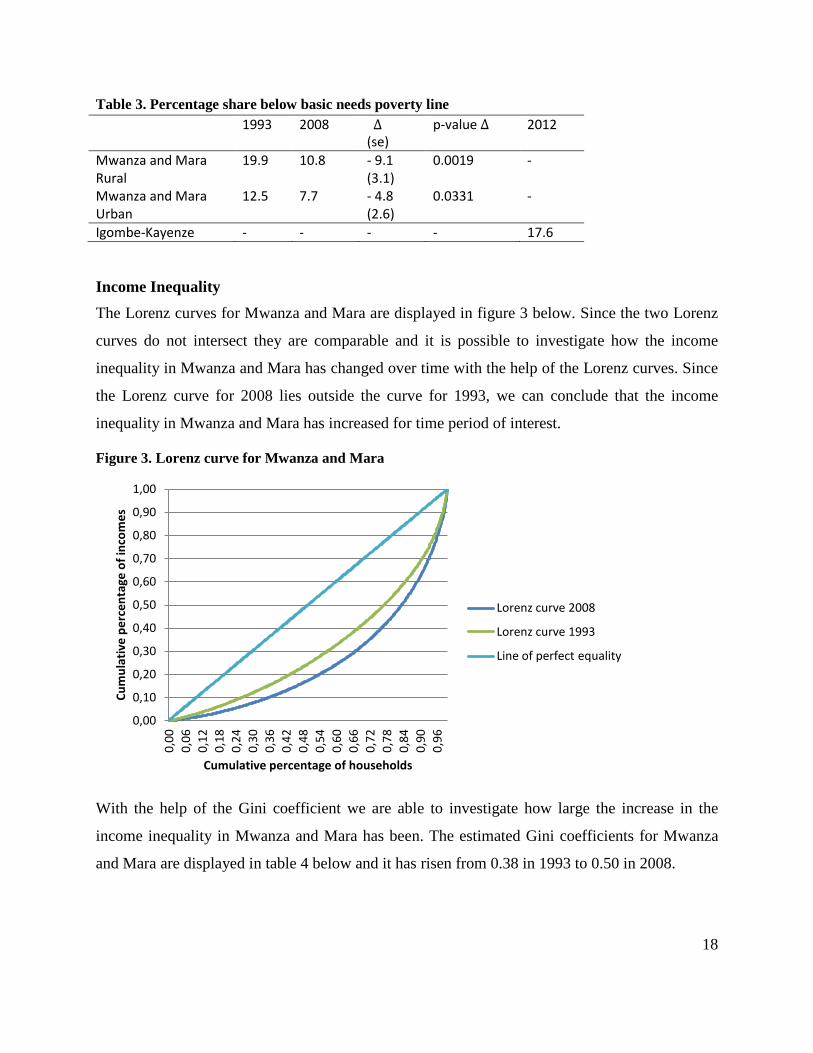
INCOME INEQUALITY 18
THE DISTRIBUTION OF INCOME IN IGOMBE-KAYENZE 20
VI. DISCUSSION AND CONCLUSIONS 24
APPENDIX 27
REFERENCES 28
3
I. Introduction For centuries fishermen have been practicing small scale fishing along the shores of Lake
Victoria. However, in the last couple of decades something has happened; the small scale fishing
has transformed into a major export industry. The export earnings have increased from a few tens
of thousands US dollars in the 1980s to over a hundred million US dollars in 2003 with an ever
increasing demand from developed countries as the main engine.
The incomes from the fish industry; harvests, processing and trade, have contributed to the
Tanzanian GDP and brought in valuable foreign exchange (Onyango, 2007). However the
economic progress is not specific to Lake Victorian region alone. In fact the Tanzanian GDP has
close to doubled in growth rate over the last decade; from 4.1 percent in 1998 to 7.4 percent in
2008. The growth is a historically high for Tanzania and is comparable to the fastest growing
economies in Sub-Saharan Africa (Research and Analysis Working Group, 2009).
The exports revenue from the fisheries and the strong growth performance of the Tanzanian
economy in general should lead to a reduction in poverty in the region, under the assumption that
these resources are able to trickle-down through the economy improving income also for the
poorest population. Hence, in order for the trickle-down effect to work by improving welfare for
the poor there must be some kind of redistributive effects in the society (Béné, 2008).
Accordingly research has shown that countries succeeding in combining rapid growth and
improved income equity have been the most successful in reducing poverty (Bigsten and Levin,
2000).
The question whether the increased revenues from the Nile Perch exports have reduced poverty
in the Lake Victorian regions is yet an unclosed discussion among researchers. While some
researchers point out that fish trade might help development because of an increased inflow of
cash and positive externalities such as additional work opportunities, others advocate the
opposite. Critics of the fish trade are prone to point out that few developing economies have yet
been able to prosper from fish trade with developed countries. This is mainly due to poor terms
of trade, low reinvestment rate, capital flight and the low degree of usage of local processing
facilities (Allison et al., 2009).
4
The distribution of resources generated by the Lake Victorian fisheries is another recurrent
subject discussed in the literature. Henson and Mitullah (2003) find empirical evidence
suggesting a very unequal distribution of the Nile Perch supply chain. Only an estimated 16
percent of the export revenues go to the fishermen. However, people involved in the export
supply chain have a higher income than people involved in the local market supply chain.
Some fishermen state that the export industry has improved incomes, although researchers claim
that the revenues fail to benefit the locals in general since people around Lake Victoria are still
undernourished and lack basic entitlements such as health care, education, transport and
electricity (Jentoft et al., 2010). In fact some authors even claim that food insecurity and
malnutrition is an increasing problem due to higher prices (Henson and Mitullah, 2003; Kirema-
Mukasa and Reynolds, 1991; Abila, 2000). Other researchers point out that the increasing
exports have reorganized the supply chain and led to fewer jobs available for local people (Abila
and Jansen, 1997).
As to conclude, there are numerous inconclusive theories concerning the impact the increased
Nile Perch export has had on local communities. However few studies have been able to identify
the linkage and to quantify the impact in economic terms. This study aims to fill this gap in the
literature by investigating how welfare and income distribution has changed in two of the three
main regions involved in the Nile Perch export industry in Tanzania over the past two decades.
Our analysis will focus on food share of total expenditure, the basic needs poverty line and
current consumption as measures of welfare and the Lorenz curve and Gini coefficient as a
measure of income inequality. Our aim is to investigate whether the resources gained from the
fish export industry have affected the welfare and income distribution on both regional and local
levels in the Mwanza and Mara regions in Tanzania.
In order to introduce the reader to some of the basic organization of the Lake Victorian fisheries
a short background on this topic will follow. A third section will introduce some of the basic
theories concerning welfare and income inequality, while our method is presented in section
four. We proceed by analysing our results in section five and the discussion with concluding
remarks will follow in section six.
5
II. The evolution of Lake Victoria fisheries This section will provide a brief historic picture of the Lake Victoria fisheries; how the
traditional fisheries were organized and how the sector has changed since the introduction of
Nile Perch in Lake Victoria.
Until the mid-1970s there were exclusively small scale fishermen operating in Lake Victoria.
The ownership was decentralized and the income from the fisheries was distributed fairly equally
among the fishermen. The processing and trading were dominated by small scale operators in the
local communities around the lake and a great majority of both the processors and traders were
women. Some fish was sold fresh, others smoked or sun-dried on the beach and then sold on the
local markets. Fish was likewise the main source of protein both for the fishermen and the people
living in the communities along the shores of the lake.
Since the introduction of Nile Perch in the late 1950s the composition of the fish biomass in the
lake has changed. From being a multi-species lake, there are now mainly three species: Nile
Perch, a sardine-like fish locally called Dagaa and Tilapia. The transformation of the biomass
comes from the fact that the Nile Perch is a predator, feeding on most of the other species in the
lake.
Initially, as a response to the increased landing of Nile Perch, more fishermen were employed to
work on the lake, more boats were built and more women engaged in fish processing. During the
1980s many new fish consumers gained when large amount of fish from Lake Victoria were
available at affordable prices (Jansen, 1997). Along with the rapid increase in the supply of Nile
Perch came an increase in demand for the fish from developed countries; Europe, Japan, Middle
East and the United States. This led to processing factories being established along the shore of
Lake Victoria in Kenya, Uganda and Tanzania. The first Nile Perch factory in Tanzania was
established in June 1992 (Bagumire, 2009).
The establishment of the factories along the shores of Lake Victoria changed the Nile Perch
industry; from being directed towards local and regional markets, to focusing on international
markets (Jansen, 1997). The establishment of the export industry around Lake Victoria also
changed the composition of labour relations within the fisheries. From being a decentralized
ownership, there are today many fishermen, especially in Nile Perch, who works as fishing crew
6
on boats owned by someone else. Boat owners in their turn often operate directly on the behalf of
the fish processing factories and in some cases the fish processing factories own the boats
themselves as to be sure to get the fish they need (Geheb et al., 2007). Other ways for the
factories to obtain their supply of fish is by buying it directly from the fishermen at the landing
sites or via agents who operate on the landing sites, either connected to the specific factory or
independent. Further, the Nile Perch export industry has changed the processing of fish. The Nile
Perch goes straight from the landing sites to the processing factories without any processing on
the landing sites. Hence, many local small scale fish processors, mostly women, have lost their
traditional jobs since there is no Nile Perch to process and trade (Abila and Jansen, 1997).
Figure 1 displayed below, shows how the catch of the Nile Perch in Lake Victoria has evolved
from the end of 1970s in the three countries bordering Lake Victoria as well as the total catch.
Over time the total catch of Nile Perch has increased substantially and from the 1990s the total
catch per year has been stabilizing around 300 thousand tons, though with large declines in the
figures in the early as well as late 1990s (FAO, 2010). The declines in catches in were probably
due to the new EU regulations in the early 1990s and an EU ban on Nile Perch imports in 1997
and 1999 (Ponte, 2007).
7
Figure 1. Nile Perch catch in Lake Victoria
Source: FAO, 2010
Tanzania’s Nile Perch export has steadily increased since the beginning of the 2000s, almost
doubling in value from 2001 to 2008. In 2009, there were nine Nile Perch factories in Tanzania.
The factories have an average production capacity of 50 tonnes of raw fish per day each, giving a
total export value of US$ 174 million annually in 2008. Over 90 percent of the fish export from
Tanzania is Nile Perch from Lake Victoria (Bagumire, 2009). Nile Perch was also the second
most imported freshwater fish in the EU in 2010 (FAO Globefish, 2012a) and Tanzania was the
biggest supplier of Nile Perch to the European markets, followed by Uganda and Kenya (FAO
Globefish, 2012b).
0
50000
100000
150000
200000
250000
300000
350000
400000
1977
1980
1983
1986
1989
1992
1995
1998
2001
2004
2007
Tons
Total
Tanzania
Kenya
Uganda
8
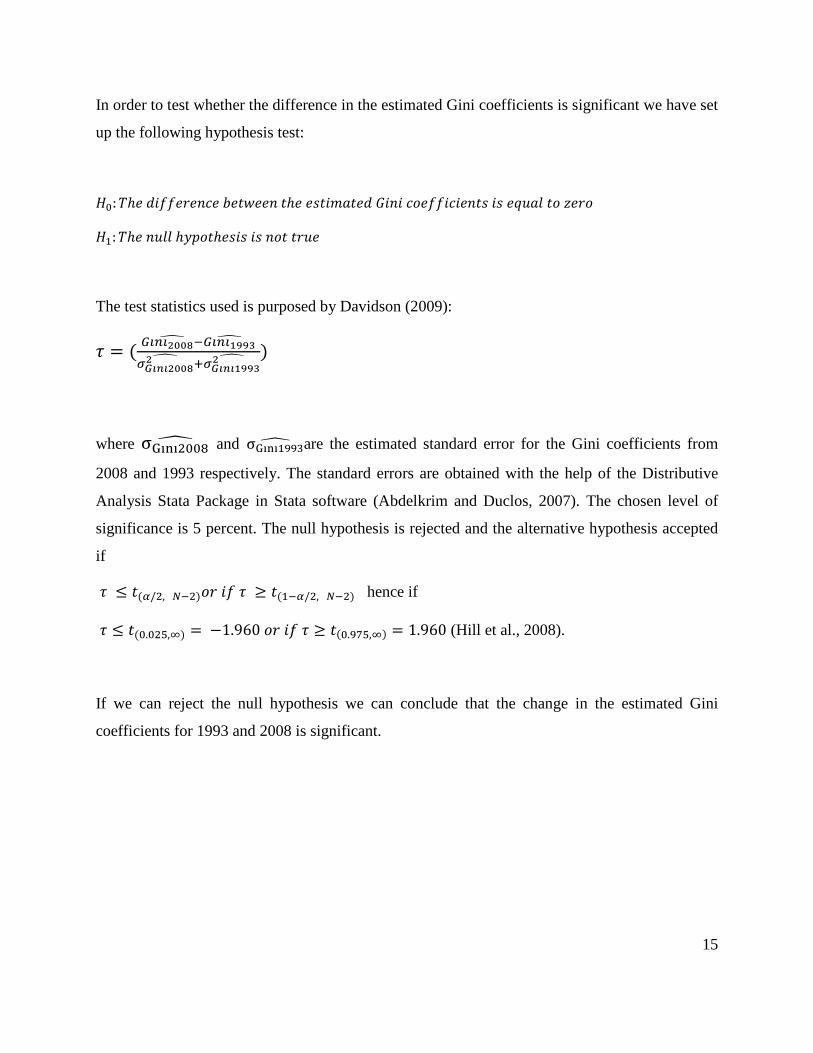
III. How to measure welfare and income distribution Although the Nile Perch exports have undoubtedly generated additional resources to the
Tanzanian economy, the question of whether or not these resources has benefited the poor still
remains. This section aims to clarify what characterizes welfare – how to define and measure it.
Further, in order to be able to assess how the resources have been distributed among the people
in the region, measures of income inequality will be presented.
Different measurements of welfare In development economics the standard of living is often used as a measure of welfare. The
standard of living is generally dependent on individual consumption of privately supplied goods.
Current consumption is often the preferred indicator of welfare in applied work, whereas income
is often only used as a proxy for consumption. A potential problem when comparing living
standards across households is differences in household size and composition, leading to
different household needs at the same level of total income (Ravallion, 1992). It is especially
important when heterogeneous households must be dealt with for poverty and inequality
purposes, and when comparisons are made over time. A solution to the problem is to use a tool
which converts nominal incomes into a comparable measure of well-being. An equivalent scale
can be seen as an index converting nominal incomes of heterogeneous households into
comparable measures of welfare in order to make the households comparable in inequality and
poverty analyses (Bellù and Liberati, 2005).
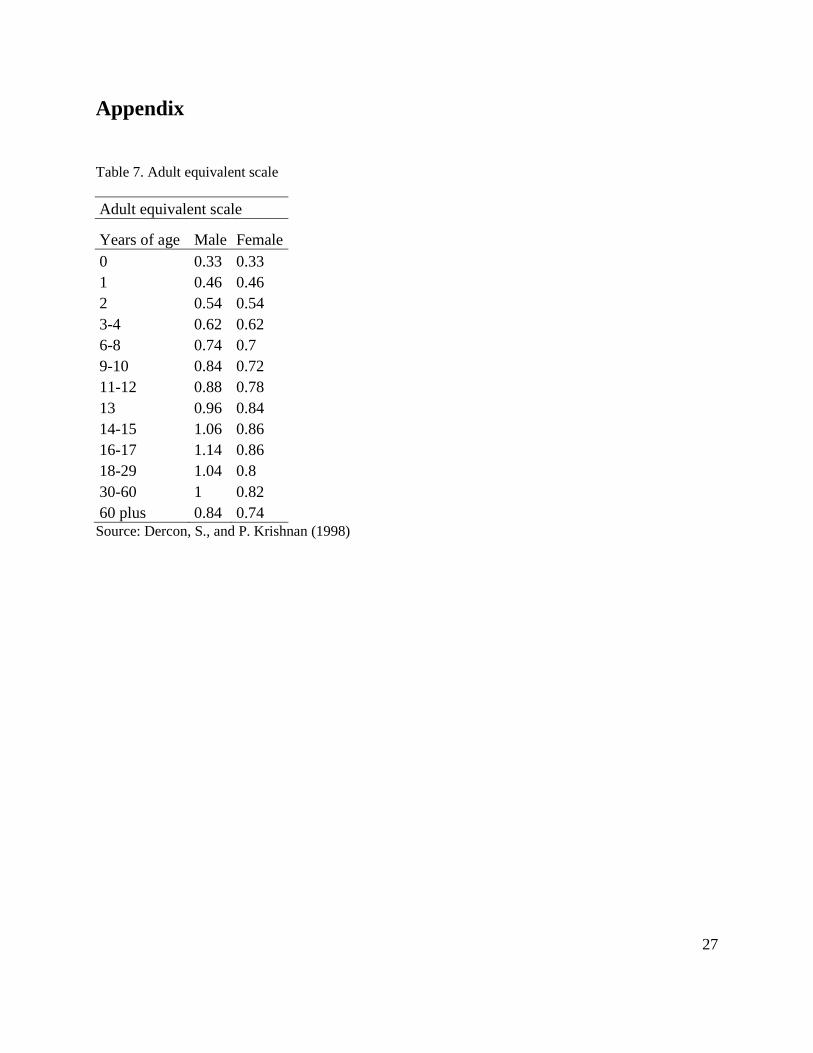
‘Per adult equivalent’ is an equivalent scale which measures the number of adult males which the
household is considered to be equivalent to. A usual way of constructing this equivalent scale is
to use observed consumption behaviour from household surveys; how aggregated household
consumption of different goods vary with household size, composition, prices and income during
the survey period. Most equivalent scales assign an adult male equivalent less than one to adult
females and children, hence women and children are assumed to need less consumption to
achieve the same level of well-being as adult males (Ravallion, 1992).
Consumption as the only indicator of well-being is often viewed as inappropriate and should be
complemented by other measures (World Bank Institute, 2005). Hence, a suitable measure of
9
poverty should depend on both monetary and non-monetary indicators to capture the different
aspect of welfare and poverty (Bourguignon and Chakravarty, 2003).
One non-monetary standard of living indicator is the share of consumption expenditure devoted
to food. The theory behind this indicator is the Engel’s Law; the budget share devoted to food
tends to decrease with total real consumption expenditure (Ravallion, 1992). In developing
countries, a household is considered poor if it is spending 60 percent or more of its total
expenditure on food, and considered severely poor if spending 80 percent or more (Central
Bureau of Statistic, 2008).
In order to obtain a percentage of the population in poverty, a poverty line can be used where a
person is considered poor when having an income less than the given poverty line (Bourguignon
and Chakravarty, 2003). A poverty line can be either relative or absolute and in developing
countries an absolute poverty line is often preferred. The absolute poverty line is defined as some
absolute standard which household should meet in order to obtain basic. One poverty line often
used in assessing absolute poverty in developing countries is the basic needs poverty line. The
basic needs poverty line defines the poverty line by an explicit bundle of foods typically
consumed by the poor at local prices plus basic non-food goods (World Bank, 2011).
Income inequality There are many different ways of measuring income inequality and the most widely used single
measure is the Gini coefficient which is based on the Lorenz curve (Haughton and Khandker,
2009).
In order to construct the Lorenz curve, one needs all household incomes, or a representative
sample, from the country or region of interest. The households are arranged from lowest to
highest income, which enables calculation of a series of figures. The first step is then to calculate
how large of a fraction of the total incomes in the country or region that is earned by the poorest
first percent of households. The second step is to find the fraction of total incomes earned by the
poorest second percent of households, and so on. The calculations are made for each fraction of
households through 100 percent. Graphing these data gives the Lorenz curve, with the
cumulative percentage of household income on the vertical axis and the cumulative percentage
of household on the horizontal axis.
10
The Lorenz curve is displayed in figure 2 below, where the 45 degree line is the line of perfect
equality. If the poorest 20 percent of households would receive 20 percent of total household
income, the poorest 40 percent 40 percent of total household income, and so on, the income
distribution would be perfectly equal and hence the Lorenz curve and the 45 degree line would
coincide. The more bowed out the Lorenz curve is, the higher is the income inequality and hence
the more unequal is the income distributed (Weil, 2009).
Figure 2. Lorenz curve
It is possible to compare income distributions between countries and the change in the
distribution over time in a specific country with the help of the Lorenz curve. Though, the
comparison is only possible when the Lorenz curves do not intersect (Persson and Skult, 2008).
Therefore, when wanting to compare income distributions for different time periods or countries,
the Gini coefficient is often the preferred measure.
From the Lorenz curve, the Gini coefficient can be calculated. The Gini coefficient is an index
summarizing the income inequality with one single number, ranging from zero to one. By
measuring the area between the Lorenz curve and the line of perfect equality (area A in figure 1),
and dividing this area by the total area under the line of perfect equality (area A+B in figure 1),
the Gini coefficient is obtained. A more unequal income distribution, provides a more bowed out
0
0,1
0,2
0,3
0,4
0,5
0,6
0,7
0,8
0,9
1
0,00
0,
07
0,14
0,
21
0,27
0,
34
0,41
0,
48
0,54
0,
61
0,68
0,
75
0,82
0,
88
0,95
Line of perfect equality
Lorenz curve A
B
11
Lorenz curve, and hence a higher Gini coefficient. An income distribution that is perfectly equal
will give a Gini coefficient of zero and a perfectly unequal distribution will give a Gini
coefficient of one (Weil, 2009).
An alternative analytic approach of obtaining the Gini coefficient, which can be done without
constructing the Lorenz curve, is shown below (Creedy, 1996).
𝐺𝑖𝑛𝑖 = 1 + 1𝑁− ( 2
𝑁2)∑ (𝑁 + 1 − 𝑖)(𝑦𝑖
𝑦�)𝑁
𝑖=1 (1)
where
N = number of households
yi = income of household i
y� = arithmetic mean income
and y1 < y2 … < yN
IV. Empirical Approach In order to investigate how the welfare and income distribution have changed during the past two
decades we will depart from the techniques discussed in the previous section. Hence the change
in welfare will be evaluated by calculating the change in expenditure devoted to food, the current
consumption and the ratio of the population below the basic needs poverty line. The changes in
income distribution will be evaluated by calculating and comparing the change in the Lorenz
curves and the Gini coefficients for the region. After summarizing how the welfare and income
distribution have changed for the whole region we will investigate how income and welfare
varies within a typical fishing community in the region. This approach will allow us to identify
and differentiate the indirect regional effects of the Nile Perch export industry from the direct
effects experienced by those directly engaged in the fisheries.
Data In order to capture both local and regional effects of the fish industry we use three different
samples. Two of the samples contain about 500 respondents each on regional level from 1993
and 2008 in order to capture the change in welfare and income distribution in the region. The
third sample with 51 respondents from 2012 contains only people directly active within the
12
fisheries and will serve to describe how income and welfare varies within the fishing
communities. This sample will occasionally also serve as a comparison to the regional sample of
2008 when discussing expenditures and poverty ratios. In this perspective the local survey from
2012 will be treated as a sub-sample of the regional survey in 2008 although there are disparities
in time and, to a certain extent, survey design and sampling techniques.
Our approach raises the issue of how to compare the income and consumption between different
surveys in an adequate way. Comparing survey results can be problematic due to changes in the
questionnaires and sampling methods, as well as problem arising when adjusting for inflation.
(Minot, 2007) The comparisons made in this paper have been made with these problems in mind,
minimizing the possible sources of biased results mentioned above.
The local sample
The local sample contains 51 respondents from the fishing village Igombe-Kayenze in Mwanza
region, Tanzania. Igombe-Kayenze is a typical fishing community 16 kilometres northwest of the
city of Mwanza, and one of the six major and busiest landing sites in the region. Most of the
processing factories in the region buy Nile Perch from the landing site in Igombe-Kayenze. The
population of approximately 10 000 people are highly dependent on fishing and related activities.
(The United Republic of Tanzania, 2002)
The sample was collected during mid-April 2012. Following advice from TAFIRI (Tanzania
Fisheries Research Institute) the village Igombe-Kayenze was chosen since it is considered to be
representative for fishing communities along the Tanzanian part of Lake Victoria. In order to
minimize the problem while comparing different samples, the questions in the survey are based
on the questionnaire from the 2008 survey. With the help of the Beach Management Units at the
fish landing site in Igombe-Kayenze the respondents were chosen as to make the sample as
representative as possible.
In order to capture all different aspects of fishing activities our sample is quite evenly distributed
between the two main types sectors; Nile Perch and Dagaa. The sample contains people from the
four main activities within fishing; fishing crew, processors, factory agents and boat owners.
13
The regional samples
The regional samples from 1993 and 2008 were collected from the regions of Mara and Mwanza,
two out of three regions bordering Lake Victoria in Tanzania. The figures from 1993 originate
from a survey made on a national level by the Population and Human Resources Division of the
East Africa Department of World Bank and include 516 households in Mwanza and Mara region
(HRDS, 1996). The sampling procedure was two-stage cluster sample, indicating that the village
weights should be used in the final analysis. The sample from 2008 consists of 520 households
from Mwanza and Mara and where executed as a collaboration between the University of
Gothenburg and the University of Dar-es-Salaam. The survey was based on the questionnaire
from 1993 in order to minimize errors due to context and method differences. The sampling
method was proportionate probability sampling which implies that no further adjustments are
needed for the analysis (Eggert et al., 2012).
Measures The first measure of welfare used in the analysis is the proportion of expenditure devoted to
food. This measure is constructed by dividing the food expenditure by the total expenditure.