77
db2 Guide v4.0 series Nimsoft® Monitor™

db2 Guide v4.0 series
Nimsoft® Monitor™

Legal Notices Copyright © 2013, CA. All rights reserved.
Warranty
The material contained in this document is provided "as is," and is subject to being changed, without notice, in future editions. Further, to the maximum extent permitted by applicable law, Nimsoft LLC disclaims all warranties, either express or implied, with regard to this manual and any information contained herein, including but not limited to the implied warranties of merchantability and fitness for a particular purpose. Nimsoft LLC shall not be liable for errors or for incidental or consequential damages in connection with the furnishing, use, or performance of this document or of any information contained herein. Should Nimsoft LLC and the user have a separate written agreement with warranty terms covering the material in this document that conflict with these terms, the warranty terms in the separate agreement shall control.
Technology Licenses
The hardware and/or software described in this document are furnished under a license and may be used or copied only in accordance with the terms of such license.
No part of this manual may be reproduced in any form or by any means (including electronic storage and retrieval or translation into a foreign language) without prior agreement and written consent from Nimsoft LLC as governed by United States and international copyright laws.
Restricted Rights Legend
If software is for use in the performance of a U.S. Government prime contract or subcontract, Software is delivered and licensed as "Commercial computer software" as defined in DFAR 252.227-7014 (June 1995), or as a "commercial item" as defined in FAR 2.101(a) or as "Restricted computer software" as defined in FAR 52.227-19 (June 1987) or any equivalent agency regulation or contract clause. Use, duplication or disclosure of Software is subject to Nimsoft LLC’s standard commercial license terms, and non-DOD Departments and Agencies of the U.S. Government will receive no greater than Restricted Rights as defined in FAR 52.227-19(c)(1-2) (June 1987). U.S. Government users will receive no greater than Limited Rights as defined in FAR 52.227-14 (June 1987) or DFAR 252.227-7015 (b)(2) (November 1995), as applicable in any technical data.
Trademarks
Nimsoft is a trademark of CA.
Adobe®, Acrobat®, Acrobat Reader®, and Acrobat Exchange® are registered trademarks of Adobe Systems Incorporated.
Intel® and Pentium® are U.S. registered trademarks of Intel Corporation.
Java(TM) is a U.S. trademark of Sun Microsystems, Inc.
Microsoft® and Windows® are U.S. registered trademarks of Microsoft Corporation.
Netscape(TM) is a U.S. trademark of Netscape Communications Corporation.
Oracle® is a U.S. registered trademark of Oracle Corporation, Redwood City, California.
UNIX® is a registered trademark of the Open Group.
ITIL® is a Registered Trade Mark of the Office of Government Commerce in the United Kingdom and other countries.
All other trademarks, trade names, service marks and logos referenced herein belong to their respective companies.
For information on licensed and public domain software, see the Nimsoft Monitor Third-Party Licenses and Terms of Use document at: http://docs.nimsoft.com/prodhelp/en_US/Library/index.htm?toc.htm?1981724.html.
Contact Nimsoft
For your convenience, Nimsoft provides a single site where you can access information about Nimsoft products.
At http://support.nimsoft.com/, you can access the following:
■ Online and telephone contact information for technical assistance and customer services
■ Information about user communities and forums
■ Product and documentation downloads
■ Nimsoft Support policies and guidelines
■ Other helpful resources appropriate for your product
Provide Feedback
If you have comments or questions about Nimsoft product documentation, you can send a message to [email protected].

Contents 5
Contents
Chapter 1: db2 4.0 7
db2 Overview ............................................................................................................................................................... 7
Chapter 2: db2 Probe Deployment 9
Supported Platforms .................................................................................................................................................... 9
System Requirements .................................................................................................................................................. 9
Software Requirements ............................................................................................................................................... 9
Monitoring System Requirements ............................................................................................................................. 10
Probe Deployment Information ................................................................................................................................. 10
Chapter 3: db2 Configuration 11
Probe Defaults ............................................................................................................................................................ 12
Probe Configuration Interface Installation ................................................................................................................. 13
Probe Configuration ................................................................................................................................................... 13
Setup Tab ............................................................................................................................................................ 13
Connections Tab .................................................................................................................................................. 18
Profiles Tab.......................................................................................................................................................... 22
Templates Tab ..................................................................................................................................................... 27
Status Tab ............................................................................................................................................................ 44
Group Tab ........................................................................................................................................................... 45
Checkpoints Metrics ............................................................................................................................................ 46
Chapter 4: QoS Threshold Metrics 53
db2 QoS Metrics ......................................................................................................................................................... 53
db2 Alert Metrics Default Settings ............................................................................................................................. 58

Chapter 1: db2 4.0 7
Chapter 1: db2 4.0
This description applies to db2 version 4.0.
This section contains the following topics:
db2 Overview (see page 7) Documentation Changes (see page 8)
db2 Overview
The db2 probe monitors DB2 instances, databases, table spaces and applications, using the DB2 snapshot and tablespace statistic APIs to extract vital information about your DB2 servers.

db2 Overview
8 db2 Guide
Documentation Changes
This table describes the version history for this document.
Version Date What's New?
4.0 January 2013 ■ Added Probe Defaults.
■ Added support for AIX 6.1 and 7.1 platforms.
■ Added check box to clear alarms on restart.
■ Added Timeout check box in the Edit Connection dialog.
■ Implementation of db2 probe based on V4 database framework; added new checkpoints and support for custom checkpoints.
Related Documentation
Documentation for other versions of the db2 probe
The Release Notes for the db2 probe
Getting Started with CA Nimsoft® Probes
Monitor Metrics Reference Information for CA Nimsoft Probes
Chapter 2: db2 Probe Deployment 9
Chapter 2: db2 Probe Deployment
This section contains the system requirements and deployment information for the db2 probe.
This section contains the following topics:
Supported Platforms (see page 9) System Requirements (see page 9) Software Requirements (see page 9) Monitoring System Requirements (see page 10) Probe Deployment Information (see page 10)
Supported Platforms
The db2 probe supports the same set of operating systems and databases as supported by the Nimsoft Server solution. Please refer to the Nimsoft Compatibility Support Matrix for the latest information on supported platforms.
System Requirements
The db2 probe should be installed on systems with the following minimum resources:
■ Memory: 2-4 GB of RAM. This probe OOTB configuration requires 256 MB of RAM.
■ CPU: 3 GHz dual-core processor, 32-bit or 64-bit
Software Requirements
The db2 probe requires the following software environment:
■ Nimsoft Monitor Server 5.1.1 or later
■ Nimsoft Robot 5.23 or later
■ Java Virtual Machine 1.6 or later (typically installed with NMS 5.0 and above)
Note: For SOC functionality, NM Server 5.6 or later and UMP 2.5.2 or later is required.
Monitoring System Requirements
10 db2 Guide
Monitoring System Requirements
This probe monitors DB2 instances, databases, table spaces and applications, using the DB2 snapshot and tablespace statistics APIs to extract vital information about your DB2 servers.
Probe Deployment Information
There are two ways to distribute archive packages. You can distribute the package within Infrastructure Manager or use the standalone Nimsoft Distribution application.
See Probe Deployment for more information on deploying probes.
Chapter 3: db2 Configuration 11
Chapter 3: db2 Configuration
The db2 probe can monitor about 280 DB2 snapshot and statistics counters and some calculated values like:
■ i_agents_created_ratio
■ i_piped_sorts_rejected
■ db_pool_hit_ratio
■ db_avg_sort_time
■ db_pct_sort_overflows
■ db_avg_sort_heap
■ db_pct_hjs_overflows
■ db_pool_sync_reads
■ db_pool_sync_writes
■ db_pool_sync_idx_writes
■ db_pool_sync_idx_reads
■ db_pool_avg_async_read_time
■ db_pool_avg_async_write_time
■ db_pool_sync_write_time
■ db_pool_avg_write_time
■ db_avg_direct_read_time
■ db_avg_direct_write_time
■ db_cat_cache_hit_rto
■ app_avg_sort_time
■ app_pct_sort_overflows
■ app_pool_hit_ratio
■ app_avg_direct_read_time
■ app_avg_direct_write_time
■ app_cat_cache_hit_rto
■ app_pkg_cache_hit_rto
■ app_locklist_util

Probe Defaults
12 db2 Guide
■ bp_pool_hit_ratio
■ bp_pool_avg_async_read_time
■ bp_pool_avg_async_write_time
■ bp_pool_sync_write_time
■ bp_pool_avg_write_time
■ bp_avg_direct_read_time
■ bp_avg_direct_write_time
■ bp_pool_sync_reads
■ bp_pool_sync_writes
■ bp_pool_sync_idx_writes
■ bp_pool_sync_idx_reads
■ ts_usable_pages_pct
■ ts_used_pages_pct
■ ts_free_pages_pct
■ ts_max_used_pages_pct
■ i_pct_active_connections
Initial configuration of the db2 probe is done by defining connections and profiles for monitored instances, using the GUI. The probe may be running locally on the database server, or it may be configured to run as a remote client. Every profile will run in its own thread.
Note: All windows containing lists are resizable. Click Apply to activate any configuration modifications done.
This section contains the following topics:
Probe Defaults (see page 12) Probe Configuration Interface Installation (see page 13) Probe Configuration (see page 13)
Probe Defaults
At the time of deploying a probe for the first time on robot, some default configuration will get deployed automatically. These probe defaults could be Alarms, QoS, Profiles and so on which save time to configure the default settings. These probe defaults will be seen on a fresh install, that is no instance of that probe is already available on that robot in activated or deactivated state.

Probe Configuration Interface Installation
Chapter 3: db2 Configuration 13
Probe Configuration Interface Installation
The probe configuration interface is automatically downloaded and installed by the Nimsoft Infrastructure Manager when the probe is deployed on a robot.
Probe Configuration
This section contains specific configuration for the probe.
Setup Tab
The Setup tab contains two sub tabs - General and Message pool. By default, the General sub tab is selected.
General Tab
The General tab enables to set the general run-time parameters regarding the db2 probe.
This tab contains the following fields:
Generate status only
Instructs the probe to only generate status, not to issue an alarm when a threshold is breached. Select the Status tab to see the status for the different checkpoints.

Probe Configuration
14 db2 Guide
Clear Alarm On Restart
Allows you to clear alarms on restart. By default, this check box is selected.
Alarm severity filter
Sets a "filter" on which severity levels are considered as alarms.
The db2 probe is capable of checking many areas of the databases. Some events that are generated are vital and key to the performance and availability of the database. As a database administrator, you may want to pass the important events on to the operations centre or helpdesk, so the event can trigger pagers, email etc. The Alarm severity filter will consider the events matching the selected severity level and higher as alarms, and pass these on whenever the Generate status only option is not selected.
Example: If you set this to major, then only messages with severity major and upward are considered as alarms.
Status Auto-Update
Lets you activate/deactivate the Status Auto-Update functionality as described below:
The Status Auto-Update parameter (number of seconds) specifies the automatic refresh interval of the Status Window on the Status tab. If you set this parameter to a value higher than 0 and then select a profile on the Status tab, the status will be automatically updated every x seconds. The checkpoints of the selected profile will be displayed until selecting another profile.
Note: This parameter is a "dialog" value - it means it is not saved in the configuration file, but in the machine running the dialog (same as for example windows size).
Log Size
Sets the size of the probe’s log file to which probe-internal log messages are written.
Default: 100 KB. When this size is reached, the contents of the file are cleared.
Log Level
Sets the level of details written to the log file. Log as little as possible during normal operation to minimize disk consumption.
QoS V2 compatibility
Provides backward-compatibility to V2 framework.
All Database Status
Provides the option to get the status of all database otherwise only for the default database.

Probe Configuration
Chapter 3: db2 Configuration 15
Message Pool Tab
The Message pool tab contains a list of all the available alarm messages. You select messages from this list when editing the properties for a checkpoint.
Right-click the list to add, edit, copy or delete messages.

Probe Configuration
16 db2 Guide
Define a Message
This functionality allows you to define a new message in the Message pool tab.
Follow these steps:
1. In the Templates tab, click the Message pool tab.
The list of messages appear.
2. Right-click in the list and select New.
The New message dialog appears.
3. Specify a name in the New message dialog and click OK.

Probe Configuration
Chapter 3: db2 Configuration 17
Note: Use the name of the checkpoint for which you create the alarm message as name. This makes it easier to find the alarm message when selecting an alarm message in the properties dialog for the checkpoint.
The Edit message dialog appears.
4. Select the checkpoint for which you create the alarm message in the drop-down list
All variables available for that check-point will be listed in the right part of the dialog.
5. Type the message and pick the variables you need.
6. Click the OK button when finished.
The new message should now appear in the message pool.

Probe Configuration
18 db2 Guide
Connections Tab
The Connections tab contains the list of various connections to instances that the db2 probe will monitor. You need to specify user name, password and service name you want to use to connect to the instance. The password information is encrypted and placed into the configuration file. A connection can be used by more than one profile.
The list contains one predefined connection that you may modify to your preferences. You may add, edit, delete and copy connections.

Probe Configuration
Chapter 3: db2 Configuration 19
Edit Connection Dialog
Right-click a connection and select Edit. The Edit Connection dialog opens for editing.
This dialog contains the following fields:
DSN
Specifies the ODBC Data Source Name. For details, refer Define an ODBC Connection (see page 21).
Description
Provides short description of the connection.
User ID
Defines the user id with SYSADM, SYSCTRL or SYSMAINT authorization.
Password
Defines the valid password.
Instance node
Specifies the node name under which the instance you want to connect to is catalogued in the node directory.
Default DB name
Specifies the database name used for connection tests (for example in i_check_dbalive).

Probe Configuration
20 db2 Guide
Retry attempts
Indicates the number of attempts the probe should try to repeat connection in case of failure. "0" means only the initial connection will be done.
Retry delay
Specifies the time for which the probe will wait between two connection attempts.
Timeout
Specifies the time for which the probe will wait for answer before it aborts the connection process.
Test button
Enables to test if the connection can be made. If successful, it will return the instance name and its version number. If not, an error message will be returned.

Probe Configuration
Chapter 3: db2 Configuration 21
Define an ODBC Connection
You must create an ODBC connection to specify a DSN while defining a new connection.
Follow these steps:
1. In the Control Panel, select Administrative Tools.
2. Select Data Sources (ODBC).
The ODBC Data Source Administrator dialog appears.
3. Select the System DSN tab and click the Add button.
The Create New Data Source wizard is launched.
4. Select the driver you want to use (for example IBM DB2 ODBC DRIVER) and click the Next button.
5. Follow the steps through the wizard to finish the definition.
Probe Configuration
22 db2 Guide
Profiles Tab
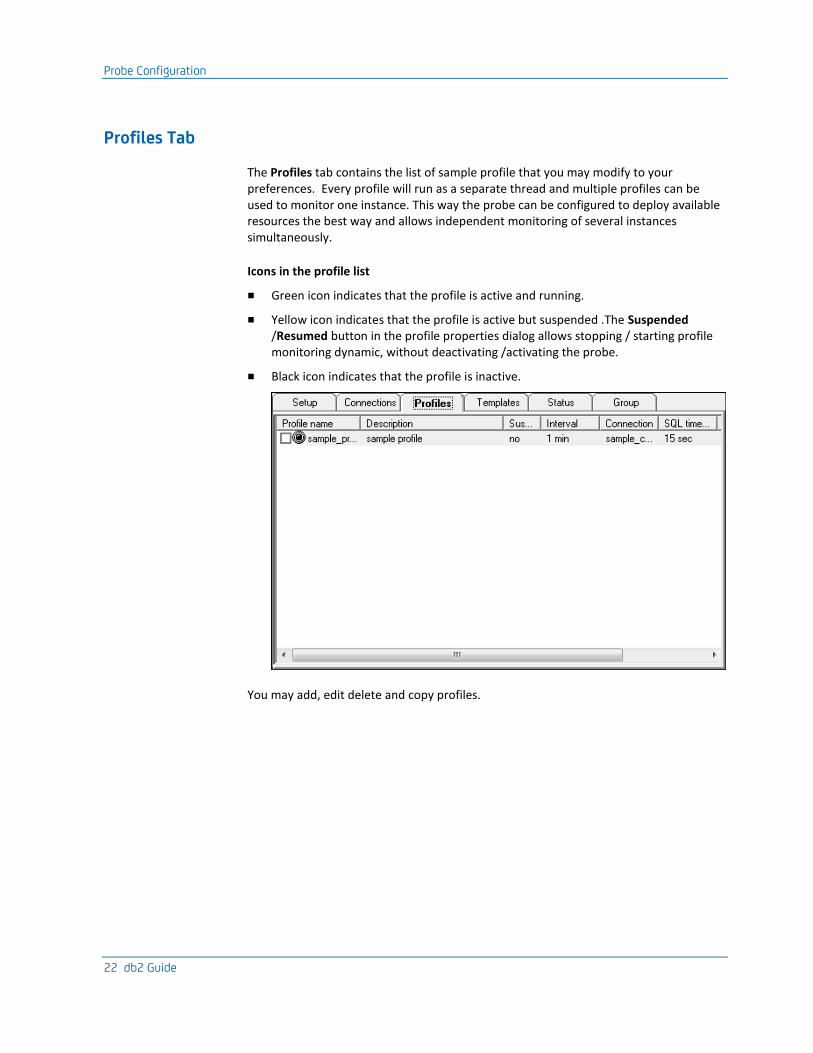
The Profiles tab contains the list of sample profile that you may modify to your preferences. Every profile will run as a separate thread and multiple profiles can be used to monitor one instance. This way the probe can be configured to deploy available resources the best way and allows independent monitoring of several instances simultaneously.
Icons in the profile list
■ Green icon indicates that the profile is active and running.
■ Yellow icon indicates that the profile is active but suspended .The Suspended /Resumed button in the profile properties dialog allows stopping / starting profile monitoring dynamic, without deactivating /activating the probe.
■ Black icon indicates that the profile is inactive.
You may add, edit delete and copy profiles.

Probe Configuration
Chapter 3: db2 Configuration 23
Edit Profile Dialog
Right-click the profile and select Edit. The Edit Profile dialog opens to edit the profile properties. The upper part of the dialog displays general profile properties and defaults whereas the lower part provides a list of available checkpoints.
The Suspended / Resumed commands allows stopping / starting profile monitoring dynamic without deactivating /activating the probe.
This dialog contains the following fields:
Description
Provides short description of the profile.
Heartbeat
Defines the interval at which all profile checkpoints schedules will be tested and trigger eventual checkpoint execution. This number should be common denominator to all used check interval values. The higher the value the lower is the profile overhead.

Probe Configuration
24 db2 Guide
Connection
Specifies the connection used in this profile. It has to be defined in Connections dialog before creating a profile.
Check Interval
Indicates the default value for check interval in the profile. This will be used if nothing else is defined in the checkpoint and overwrites the default checkpoint list setting.
Clear message
Specifies the message name for clear alarm.
SQL Timeout
Every checkpoint query run asynchronously. In case the query reaches the SQL timeout, the checkpoint processing will be terminated and the next checkpoint will be started. Alarm is issued.
Message
Specifies the message name used for SQL timeout alarm.
Profile Timeout
Defines the maximum processing time for all checkpoints in the profile. If this timeout is reached, the interval processing is finished and the probe waits for next heartbeat to evaluate any checkpoint schedules. Alarm message is issued.
Message
Specifies the message name used for profile timeout alarm.
Timeout severity
Defines severity for timeout messages.
Suspended/Resumed (indicator)
Indicates whether the profile is activated or not. This indicator is green when the profile is activated. The indicator changes to yellow when the profile is suspended and to black when deactivated.
Alarm source
Lets you override the source name of the alarm. If not used, default is assumed (robot IP).
Profile checkpoints
Provides the list of available checkpoints. When defining a new profile, all the available checkpoints (listed under the Checkpoints tab) will be listed here. Select the checkpoints you want for your new profile. The global and default checkpoint settings will be used unless you modify the settings locally for your profile (see section Checkpoints in Profile).
Probe Configuration
Chapter 3: db2 Configuration 25
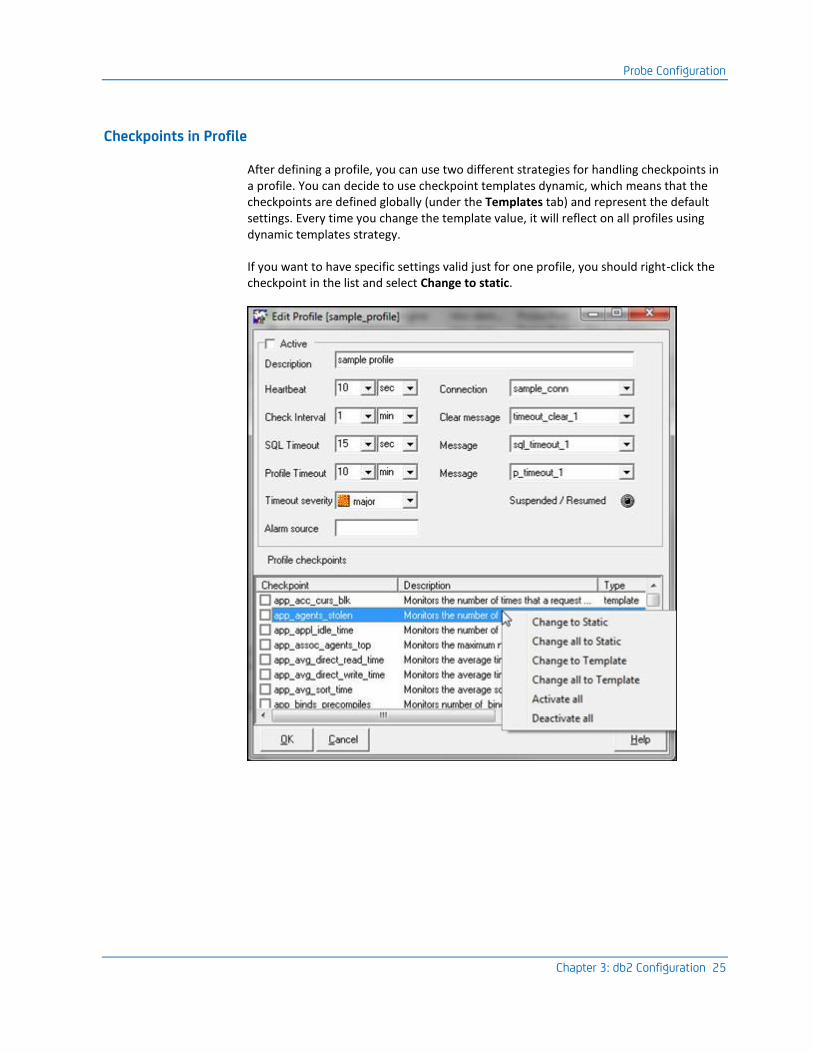
Checkpoints in Profile
After defining a profile, you can use two different strategies for handling checkpoints in a profile. You can decide to use checkpoint templates dynamic, which means that the checkpoints are defined globally (under the Templates tab) and represent the default settings. Every time you change the template value, it will reflect on all profiles using dynamic templates strategy.
If you want to have specific settings valid just for one profile, you should right-click the checkpoint in the list and select Change to static.

Probe Configuration
26 db2 Guide
Now you can double-click the checkpoint to modify the properties and the settings will be valid for this profile only.
Note: If you attempt to modify a template checkpoint in the Profile dialog without changing it to static as described above, you will receive the following warning:
There can be both template and static checkpoints mixed in one profile. If a checkpoint is managed as static, the checkpoint name will appear in the list with a blue color and it will be marked as static in the column Type.
Type of Checkpoints
■ Static:
Manages the properties for a checkpoint locally. Change the checkpoint to static in your profile before modifying it. When modified, the new settings will be valid for this profile only.
■ Template:
Edits the properties for a checkpoint template. Double-click the checkpoint in the profile list or Templates tab. When modified, the new settings will be valid for all profiles, unless overruled by static settings in the profile.
Refer the section Edit a Checkpoint (see page 38) for a description of the checkpoint properties.
When deciding which checkpoints to activate/deactivate for a profile, refer section Checkpoint Metrics (see page 46) for a description of the different checkpoints.

Probe Configuration
Chapter 3: db2 Configuration 27
Templates Tab
The Templates tab contains the list of predefined set of checkpoints that you may use in your profiles. These checkpoints can be modified to your preferences.
By default, most checkpoints are active with a reasonable default threshold value. The checkpoint properties may be used in a profile either dynamic, using the template values, or they can be added to the profile and managed static in the profile.
Static
Edits the properties for a checkpoint locally for a profile. Right-click the profile in the checkpoints list in the Edit Profile dialog and change it to static. Double-click the checkpoint to modify it. When modified, the new settings will be valid for this profile only.
Template
Edits the properties for a checkpoint template. Double-click the checkpoint in the checkpoints list in the Edit Profile dialog or Templates tab. When modified, the new settings will be valid for all profiles, unless overruled by static settings in the profile.

Probe Configuration
28 db2 Guide
Define a New Checkpoint
This functionality allows you to create a custom checkpoint for the DB2 probe.
Follow these steps:
1. In the Templates tab, right-click and select Create new from the context menu.
The Add New User Template dialog appears.
2. Enter a name for the custom checkpoint. Click OK.

Probe Configuration
Chapter 3: db2 Configuration 29
The Edit template checkpoint dialog opens.
3. By default, the General tab opens. Click the Query tab.
4. Select the required connection from the Connection drop-down list, which displays a list of pre-configured connections, created from the Connections tab.

Probe Configuration
30 db2 Guide
5. Enter the required query statement in the Query field and click the Test button to validate the query.
The Query Result dialog appears, displaying the result of the query entered.

Probe Configuration
Chapter 3: db2 Configuration 31
6. Click Edit to specify the Message Variables.

Probe Configuration
32 db2 Guide
7. In the Query tab of Edit template checkpoint dialog, enter the values in the fields as described in section Query Tab (see page 37).
8. Click OK.
9. Now, click the General tab of Edit template checkpoint dialog and enter the details as described in section General Tab (see page 34).
10. Right-click inside the threshold section and select New from the context menu. Enter the field values.
11. Click the QoS List button.
The QoS list dialog appears.
Probe Configuration
Chapter 3: db2 Configuration 33
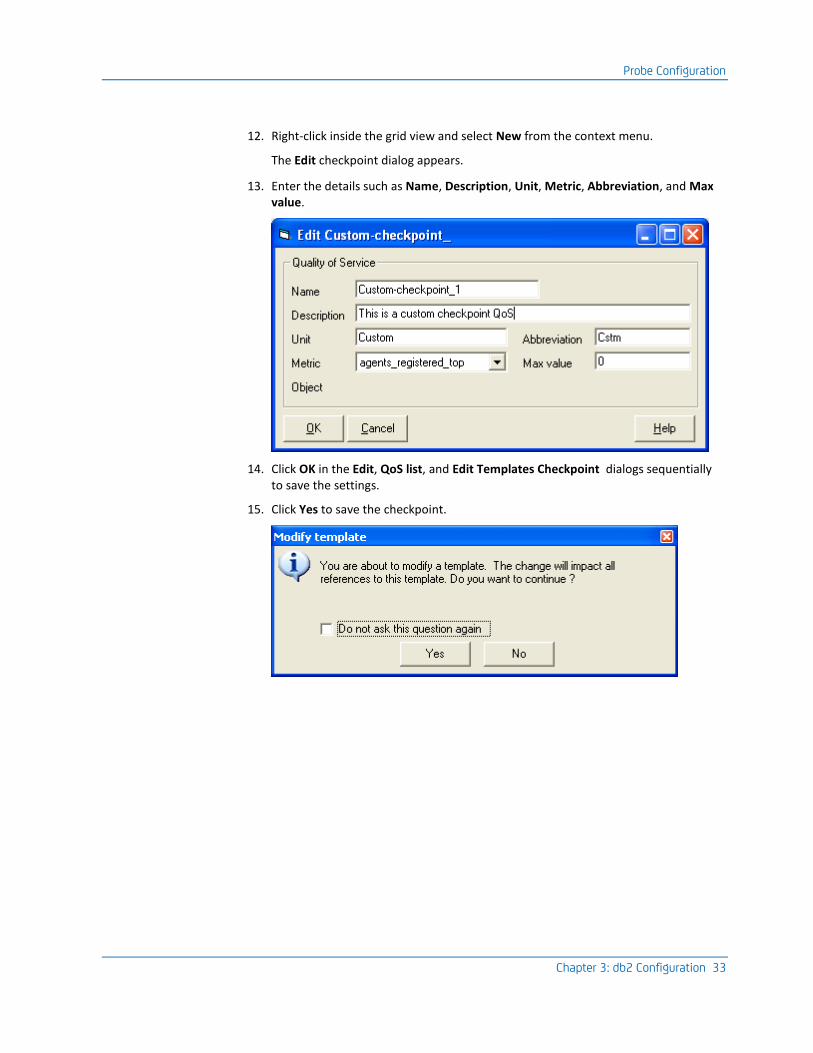
12. Right-click inside the grid view and select New from the context menu.
The Edit checkpoint dialog appears.
13. Enter the details such as Name, Description, Unit, Metric, Abbreviation, and Max value.
14. Click OK in the Edit, QoS list, and Edit Templates Checkpoint dialogs sequentially to save the settings.
15. Click Yes to save the checkpoint.
Probe Configuration
34 db2 Guide
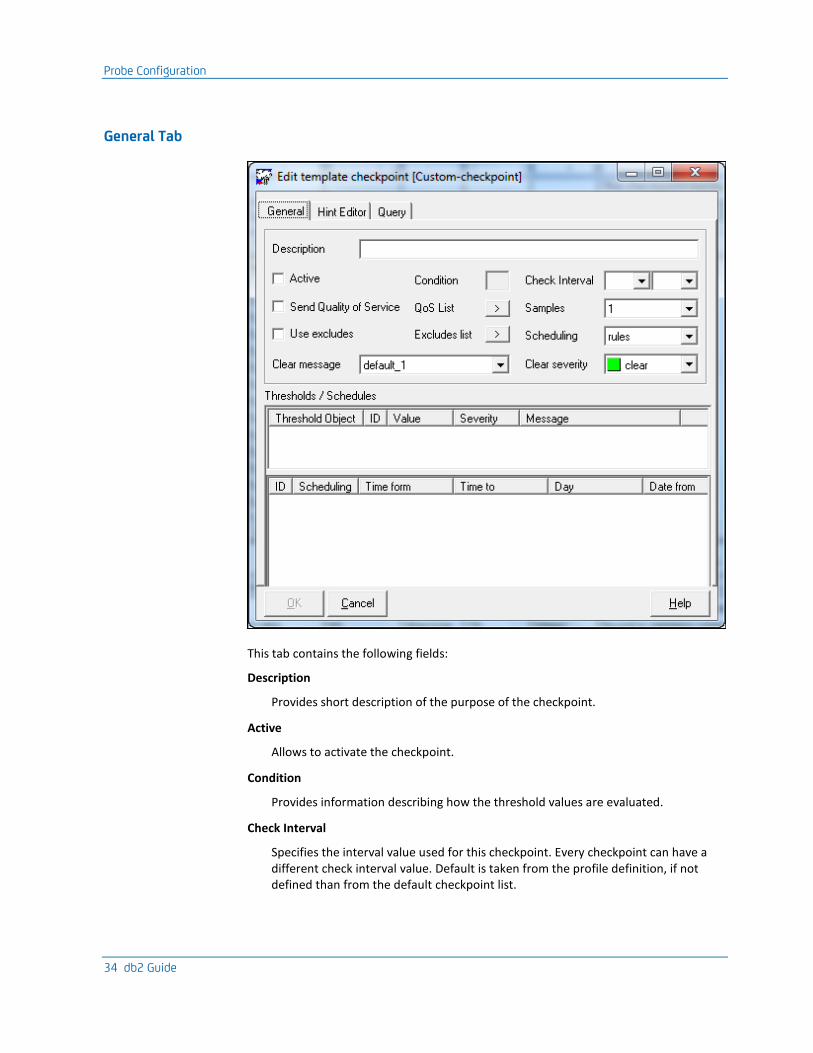
General Tab
This tab contains the following fields:
Description
Provides short description of the purpose of the checkpoint.
Active
Allows to activate the checkpoint.
Condition
Provides information describing how the threshold values are evaluated.
Check Interval
Specifies the interval value used for this checkpoint. Every checkpoint can have a different check interval value. Default is taken from the profile definition, if not defined than from the default checkpoint list.

Probe Configuration
Chapter 3: db2 Configuration 35
Send Quality of Service
Activates QoS values being send into the QoS database. If not available in a checkpoint, checkbox is disabled.
QoS List
Opens the QoS list showing the current QoS definitions (default is one definition per checkpoint). Right-clicking in the list lets you add new QoS definitions and copy, edit or delete an existing QoS definition.
The Edit QoS dialog offers available metrics (numerical variables which could be reported as QoS) and available object variables (if any - to be added to the QoS source). The name of the QoS has to start with the checkpoint name. QoS can be activated/deactivated as usual.
Note: Some of the checkpoints have no QoS possibilities - from these checkpoints the QoS dialog cannot be activated.
Samples
Saves the number of samples specified here and calculate an average value. This average value will be compared to the alarm threshold specified.
Setting "Samples = 1", no sampling is done.
Setting "Samples = 3", the average of the 3 last samples will be used.
Setting "Samples = 0" (in profile), number of samples will be taken from the template. If not set there, no sampling is done.
Initially after start-up, the probe calculates the average value from the number of samples available.
Example, Samples=3:
In the first interval the first sample value is used
In the second interval, the average of sample 1 and 2 will be used etc.
Note: Many checkpoints calculate an "interval value", therefore in the first interval there is no value at all (no threshold checking).
Use excludes
Provides the option to add excludes to the Excludes list to some of the checkpoints (as it does not make sense for all checkpoints).
Using excludes, you can define objects that you do NOT want to monitor on the checkpoint. The excludes patterns found if clicking the Excludes list button will be used for the checkpoint.

Probe Configuration
36 db2 Guide
Excludes list
Opens the list that shows if excludes are defined for the checkpoint. The excludes found in the list will be used for the checkpoint if the Use excludes option is checked. Right-clicking in the list lets you add new excludes or edit, copy or delete existing excludes.
When adding (or editing) an exclude pattern, a Match expression dialog is opened, letting you edit or define the exclude pattern. Excludes are defined using regular expression patterns.
A test button lets you test the exclude pattern defined. This test is possible only for running active profiles and checkpoints. The test uses the status list (on the status tab) as input:
Note: If there already are active excludes, the excluded objects are excluded from the status list BEFORE the test.
When clicking the Test button, an Exclude test list pops up, showing the result of the test. Red text lines show the objects which would be excluded using the tested pattern.
The "object thresholds" are functioning as an "include list". This means if there are special thresholds defined for a special object, this object will always stay in, even if the exclude pattern would eliminate it normally. This is considered also in the test function.
Scheduling
This field lets you select how to use the schedules settings, if any (see description below the table).
rules
Selecting rules means to run according the rules described in the Schedules settings.
exceptions
Selecting exceptions means to run except the rules described in the Schedules settings.
Clear message
Specifies the message name used for clear alarm message.
Clear severity
Severity used for message issued in normal state.
Thresholds/Schedules
Refer Thresholds (see page 42) and Schedules (see page 43).
Probe Configuration
Chapter 3: db2 Configuration 37
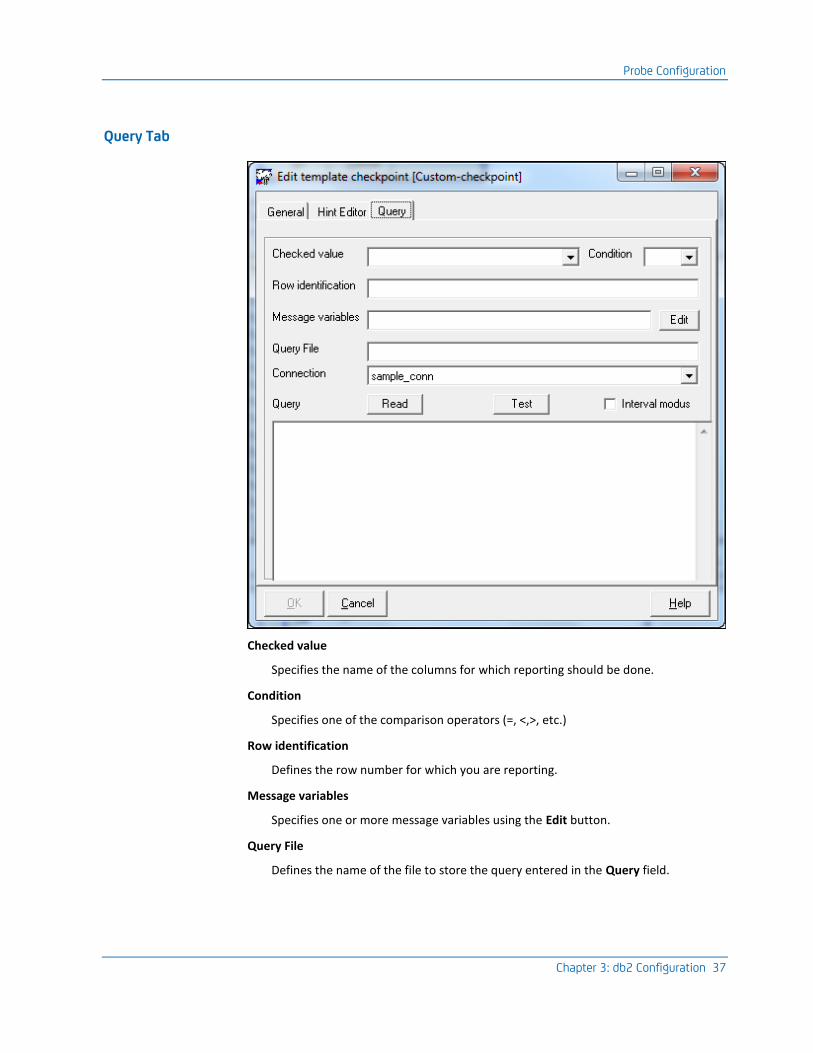
Query Tab
Checked value
Specifies the name of the columns for which reporting should be done.
Condition
Specifies one of the comparison operators (=, <,>, etc.)
Row identification
Defines the row number for which you are reporting.
Message variables
Specifies one or more message variables using the Edit button.
Query File
Defines the name of the file to store the query entered in the Query field.

Probe Configuration
38 db2 Guide
Edit a Checkpoint
The checkpoint properties may be used in a profile either dynamic, using the template values, or they can be added to the profile and managed static in the profile.
Static
Edits the properties for a checkpoint locally for a profile. Right-click the profile in the list of checkpoints in the Edit Profile dialog and change it to static. Double-click the checkpoint to modify it. When modified, the new settings will be valid for this profile only.
Template
Edits the properties for a checkpoint template. Double-click the checkpoint in the Edit Profile dialog or Templates tab. When modified, the new settings will be valid for all profiles, unless overruled by static settings in the profile.
The properties for checkpoints are described below:

Probe Configuration
Chapter 3: db2 Configuration 39
The upper part of the dialog contains general checkpoint settings whereas the lower part contains two lists with threshold and schedule settings.
Description
Provides short description of the purpose of the checkpoint.
Active
Allows to activate the checkpoint.
Condition
Provides information describing how the threshold values are evaluated.
Check Interval
Specifies the interval value used for this checkpoint. Every checkpoint can have a different check interval value. Default is taken from the profile definition, if not defined than from the default checkpoint list.
Send Quality of Service
Activates QoS values being send into the QoS database. If not available in a checkpoint, check box is disabled.
QoS List
Opens the QoS list showing the current QoS definitions (default is one definition per checkpoint). Right-clicking in the list lets you add new QoS definitions and copy, edit or delete an existing QoS definition.
The Edit QoS dialog offers available metrics (numerical variables that could be reported as QoS) and available object variables (if any - to be added to the QoS source).
The name of the QoS has to start with the checkpoint name. QoS can be activated/deactivated as usual.
Note: Some of the checkpoints have no QoS possibilities - from these checkpoints, the QoS dialog cannot be activated.
Probe Configuration
40 db2 Guide
Samples
Saves the number of samples specified here and calculate an average value. This average value will be compared to the alarm threshold specified (see threshold description below the table).
Setting "Samples = 1", no sampling is done.
Setting "Samples = 3", the average of the 3 last samples will be used.
Setting "Samples = 0" (in profile), number of samples will be taken from the template. If not set there, no sampling is done.
Initially after start-up, the probe calculates the average value from the number of samples available.
Example, Samples=3:
In the first interval the first sample value is used
In the second interval, the average of sample 1 and 2 will be used etc.
Note: Many checkpoints calculate an "interval value", therefore in the first interval there is no value at all (no threshold checking).
Use excludes
Provides the option to add excludes to the Exclude list to some of the checkpoints (as it does not make sense for all checkpoints).
Using excludes, you can define objects that you do NOT want to monitor on the checkpoint. The excludes patterns found if clicking the Excludes list button will be used for the checkpoint.

Probe Configuration
Chapter 3: db2 Configuration 41
Excludes list
Opens the list that displays if excludes are defined for the checkpoint. The excludes found in the list will be used for the checkpoint if the Use excludes option is checked. Right-clicking in the list lets you add new excludes or edit, copy or delete existing excludes.
When adding (or editing) an exclude pattern, a Match expression dialog is opened, letting you edit or define the exclude pattern. Excludes are defined using regular expression patterns.
A test button lets you test the exclude pattern defined. This test is possible only for running active profiles and checkpoints. The test uses the status list (on the status tab) as input:
Note: If there already are active excludes, the excluded objects are excluded from the status list BEFORE the test.
When clicking the test button, an exclude test list pops up, showing the result of the test. Red text lines show the objects which would be excluded using the tested pattern.
The "object thresholds" are functioning as an "include list" - it means, if there are special thresholds defined for a special object, this object will always stay in, even if the exclude pattern would eliminate it normally. This is considered also in the test function.
Scheduling
Lets you select how to use the Schedules settings, if any.
rules
Selecting rules means to run according the rules described in the Schedules settings.
exceptions
Selecting exceptions means to run except the rules described in the Schedules settings.
Clear message
Specifies the message name used for clear alarm message.
Clear severity
Severity used for message issued in normal state.
Thresholds/Schedules
Refer Thresholds (see page 42) and Schedules (see page 43).
Probe Configuration
42 db2 Guide
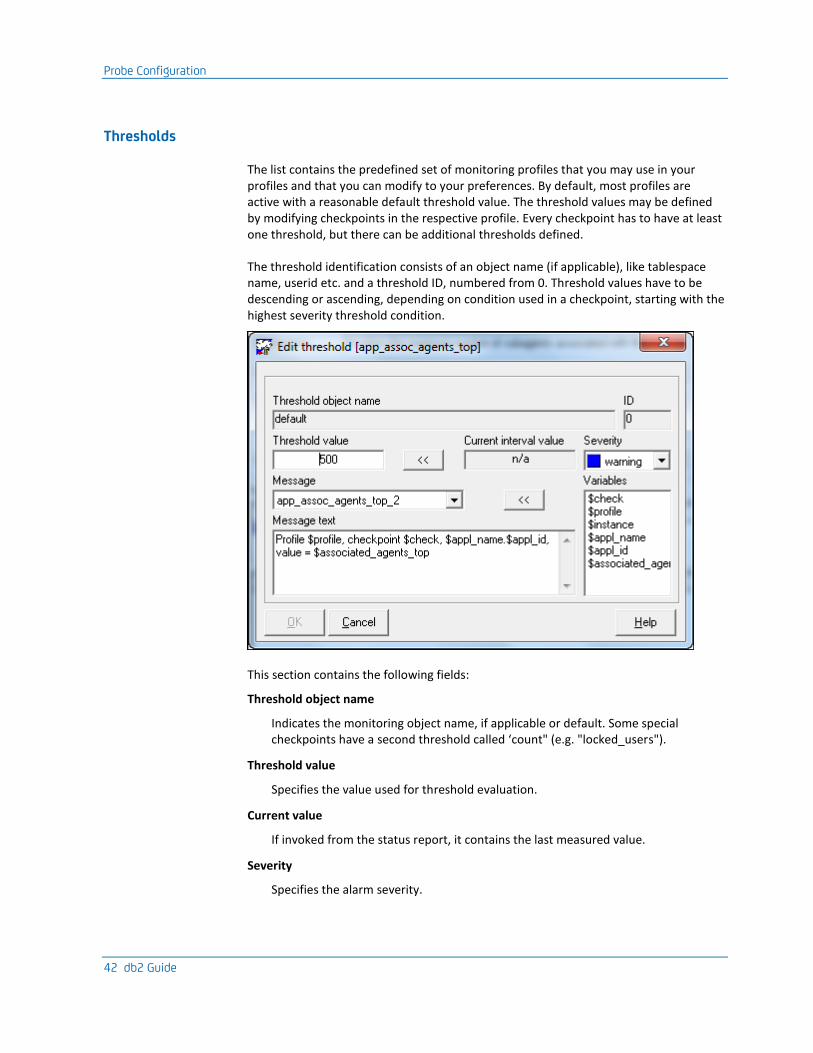
Thresholds
The list contains the predefined set of monitoring profiles that you may use in your profiles and that you can modify to your preferences. By default, most profiles are active with a reasonable default threshold value. The threshold values may be defined by modifying checkpoints in the respective profile. Every checkpoint has to have at least one threshold, but there can be additional thresholds defined.
The threshold identification consists of an object name (if applicable), like tablespace name, userid etc. and a threshold ID, numbered from 0. Threshold values have to be descending or ascending, depending on condition used in a checkpoint, starting with the highest severity threshold condition.
This section contains the following fields:
Threshold object name
Indicates the monitoring object name, if applicable or default. Some special checkpoints have a second threshold called ‘count" (e.g. "locked_users").
Threshold value
Specifies the value used for threshold evaluation.
Current value
If invoked from the status report, it contains the last measured value.
Severity
Specifies the alarm severity.

Probe Configuration
Chapter 3: db2 Configuration 43
Message
Defines the name of message used for threshold alarm.
Message text
Displays the text of the message, containing variables, which will be replaced in run time. If the message text is changed from a profile list, you will be forced to create new message.
Variables
Lists variables available in the checkpoint.
Schedules
If the schedules list is empty, the checkpoint will be executed on interval, 24 hours a day. You can also define several schedules per checkpoint, each defining additional rules to the check interval or exceptions of it. The rules and exceptions cannot be mixed in one checkpoint.
In principle, a schedule is a definition of an execution period (or execution break if exceptions used) with specified days, including time from/to and date from/to values. If only Date from and Time from is defined, first execution can be defined. Run once will cause the checkpoint run only once a day in the defined period (unlike multiple times if Run interval is used).

Probe Configuration
44 db2 Guide
Status Tab
The Status tab displays contents in a hierarchal fashion with the profile name nodes and one or more checkpoint nodes (only active checkpoints are considered here). The highest status is propagated. Select the checkpoint in the navigation tree (to your left) to bring up the corresponding events.
The properties for an individual checkpoint object can also be modified here. Select a profile and a monitored checkpoint in the left pane. Then double-click an object in the right pane. If the object belongs to a template object, you will be warned that a modification will make the checkpoint static for the selected profile.

Probe Configuration
Chapter 3: db2 Configuration 45
Group Tab
This tab lets you create multiple groups which can be associated with profiles.
You can add, copy, modify, or delete a group.
Probe Configuration
46 db2 Guide
Checkpoints Metrics
There are five kind of metrics used:
Count
Absolute number of events in the interval. It is calculated as delta between count at the beginning of the interval and at the end. In the first interval, counts are not checked because their interval value cannot be calculated. If there is a "total" value in the message, it means "since the start of the instance".
Gauge
Absolute number describing the actual state of the system.
Ratio
Calculated percentage using interval counts. In the first interval, it is calculated from total counts (as the interval count cannot be calculated).
Average
Calculated using interval counts. In the starting interval, it is calculated from absolute counts.
Status
Absolute value like ‘ONLINE’ etc.
Single Counter Description
Most of the checkpoints are measuring single DB2 snapshot counter values. Description of these counters can be found in the IBM DB2 "System Monitor Guide and Reference" manual or in DB2 Information Center under "Monitor elements":
http://publib.boulder.ibm.com/infocenter/db2luw/v9r5/index.jsp http://publib.boulder.ibm.com/infocenter/db2luw/v9r5/index.jsp
The IBM used counter names are hierarchically organized and therefore not unique. For this reason, the probe is adding to every name a prefix, depending on its source:
■ "i_" for instance snapshot
■ "db_" for database
■ "bp_" for bufferpool
■ "app_" for application
■ "ts_" for tablespace statistics counter.
So the description for the counter "i_comm_private_mem" can be found under "comm_private_mem" in the IBM sources.

Probe Configuration
Chapter 3: db2 Configuration 47
Calculated Checkpoints Description
The app_ checkpoints do not generate QoS.
i_agents_created_ratio – ratio
Calculated as: (i_agents_created_empty_pool / i_agents_from_pool) * 100.
Description: Monitors % of agents created due to empty agent pool by agents assigned from pool.
i_piped_sorts_rejected – count
Calculated as: i_piped_sorts_requested - i_piped_sorts_accepted.
Description: Monitors number of piped sort requests rejected.
db_pool_hit_ratio – ratio
Calculated as: (1.0 - ((db_pool_data_p_reads + db_pool_index_p_reads) / (db_pool_data_l_reads + db_pool_index_l_reads))) * 100.
Description: Monitors percentage of time a page was found in buffer pool on request.
db_avg_sort_time – average
Calculated as: (db_total_sort_time / db_total_sorts) / 1000.
Description: Monitors average sort time in interval in seconds.
db_pct_sort_overflows – ratio
Calculated as: (db_sort_overflows / db_total_sorts) * 100.
Description: Monitors % of sort overflows in interval.
db_avg_sort_heap – average
Calculated as: db_sort_heap_allocated / db_active_sorts.
Description: Monitors average number of pages allocated to sort heap in interval.
db_pct_hjs_overflows – ratio
Calculated as: (db_hash_join_small_overflows / db_hash_join_overflows) * 100.
Description: Monitors percentage of hash join small overflows.
db_pool_sync_reads – count
Calculated as: db_pool_data_p_reads - db_pool_async_data_reads.
Description: Monitors number of synchronous data reads per interval.
db_pool_sync_writes – count
Calculated as: db_pool_data_writes - db_pool_async_data_writes
Description: Monitors number of synchronous data writes per interval.
Probe Configuration
48 db2 Guide
db_pool_sync_idx_reads – count
Calculated as: db_pool_index_p_reads - db_pool_async_index_reads
Description: Monitors number of synchronous index page reads per interval.
db_pool_sync_idx_writes – count
Calculated as: db_pool_index_writes - db_pool_async_index_writes
Description: Monitors number of synchronous index page writes per interval.
db_pool_avg_async_read_time – average
Calculated as: db_pool_async_read_time / db_pool_async_data_reads
Description: Monitors average asynchronous read time in ms in interval.
db_pool_avg_async_write_time – average
Calculated as: db_pool_async_write_time / (db_pool_async_data_writes + db_pool_async_index_writes)
Description: Monitors average asynchronous write time in ms in interval.
db_pool_sync_write_time – count
Calculated as: db_pool_write_time - db_pool_async_write_time
Description: Monitors synchronous write time in ms in interval.
db_pool_avg_write_time – average
Calculated as: db_pool_async_write_time / (db_pool_async_data_writes + db_pool_async_index_writes)
Description: Monitors average write time in ms in interval.
db_avg_direct_read_time – average
Calculated as: db_direct_read_time / db_direct_reads
Description: Monitors average time for direct read in ms.
db_avg_direct_write_time – average
Calculated as: db_direct_write_time / db_direct_writes
Description: Monitors average time for direct write in ms.
db_cat_cache_hit_rto - ratio
Calculated as: (1- (db_cat_cache_inserts / db_cat_cache_lookups)) * 100.
Description: Monitors percent of times, information was found in catalog cache.
db_log_util_rto - ratio
Calculated as: (db_total_log_used / (db_total_log_used + db_total_log_available)) * 100.
Description: Monitors database log utilization.
Probe Configuration
Chapter 3: db2 Configuration 49
db_since_last_backup - count
Calculated as: (tNow - ((elapsed_exec_time_s + (elapsed_exec_time_ms / 1000000.0)))) / 3600.
Description: Monitors number of hours since last backup.
db_status - status
Calculated as: db_status based on the below values.
Description: Monitors database status.
#. State Value Alarm QoS
1. ACTIVE 0 Yes Yes
2. QUIESCE_PEND 1Yes Yes
3. QUIESCED 2 Yes Yes
4. ROLLFWD 3 Yes Yes
5. Not defined Log No Yes
app_avg_sort_time – average
Calculated as: app_total_sort_time / app_total_sorts
Description: Monitors the average sort time in interval in ms.
app_pct_sort_overflows – ratio
Calculated as: (app_sort_overflows / app_total_sorts) * 100.
Description: Monitors the percentage of sort overflows per interval.
app_pool_hit_ratio – ratio
Calculated as: (1 - ((app_pool_data_p_reads + app_pool_index_p_reads) / (app_pool_data_l_reads + app_pool_index_l_reads))) * 100.
Description: Monitors percentage of time a page was found in buffer pool on application request.
app_avg_direct_read_time – average
Calculated as: app_direct_read_time / app_direct_reads.
Description: Monitors the average time for direct read in ms.
app_avg_direct_write_time – average
Calculated as: app_direct_write_time / app_direct_writes
Description: Monitors the average time for direct write in ms.
app_cat_cache_hit_rto – ratio
Calculated as: (1 - (app_cat_cache_inserts / app_cat_cache_lookups)) * 100.
Description: Monitors percentage of time table descriptor was found in catalog cache.
Probe Configuration
50 db2 Guide
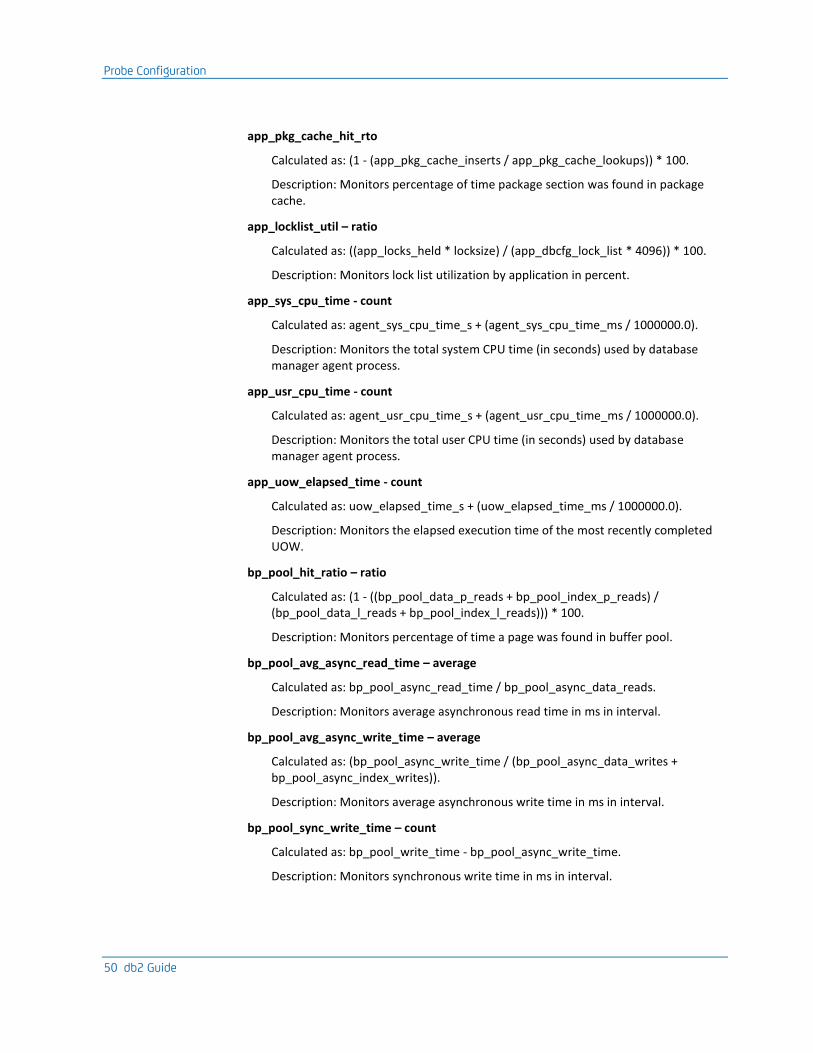
app_pkg_cache_hit_rto
Calculated as: (1 - (app_pkg_cache_inserts / app_pkg_cache_lookups)) * 100.
Description: Monitors percentage of time package section was found in package cache.
app_locklist_util – ratio
Calculated as: ((app_locks_held * locksize) / (app_dbcfg_lock_list * 4096)) * 100.
Description: Monitors lock list utilization by application in percent.
app_sys_cpu_time - count
Calculated as: agent_sys_cpu_time_s + (agent_sys_cpu_time_ms / 1000000.0).
Description: Monitors the total system CPU time (in seconds) used by database manager agent process.
app_usr_cpu_time - count
Calculated as: agent_usr_cpu_time_s + (agent_usr_cpu_time_ms / 1000000.0).
Description: Monitors the total user CPU time (in seconds) used by database manager agent process.
app_uow_elapsed_time - count
Calculated as: uow_elapsed_time_s + (uow_elapsed_time_ms / 1000000.0).
Description: Monitors the elapsed execution time of the most recently completed UOW.
bp_pool_hit_ratio – ratio
Calculated as: (1 - ((bp_pool_data_p_reads + bp_pool_index_p_reads) / (bp_pool_data_l_reads + bp_pool_index_l_reads))) * 100.
Description: Monitors percentage of time a page was found in buffer pool.
bp_pool_avg_async_read_time – average
Calculated as: bp_pool_async_read_time / bp_pool_async_data_reads.
Description: Monitors average asynchronous read time in ms in interval.
bp_pool_avg_async_write_time – average
Calculated as: (bp_pool_async_write_time / (bp_pool_async_data_writes + bp_pool_async_index_writes)).
Description: Monitors average asynchronous write time in ms in interval.
bp_pool_sync_write_time – count
Calculated as: bp_pool_write_time - bp_pool_async_write_time.
Description: Monitors synchronous write time in ms in interval.

Probe Configuration
Chapter 3: db2 Configuration 51
bp_pool_avg_write_time – average
Calculated as: bp_pool_async_write_time / (bp_pool_async_data_writes + bp_pool_async_index_writes).
Description: Monitors average asynchronous write time in ms in interval.
bp_avg_direct_read_time – average
Calculated as: bp_direct_read_time / bp_direct_reads.
Description: Monitors average time for direct read in ms in interval.
bp_avg_direct_write_time – average
Calculated as: bp_direct_write_time / bp_direct_writes.
Description: Monitors average time for direct write in ms in interval.
bp_pool_sync_reads – count
Calculated as: bp_pool_data_p_reads - bp_pool_async_data_reads.
Description: Monitors number of synchronous data reads in interval.
bp_pool_sync_writes – count
Calculated as: bp_pool_data_writes - bp_pool_async_data_writes.
Description: Monitors number of synchronous data writes in interval.
bp_pool_sync_idx_writes – count
Calculated as: bp_pool_index_writes - bp_pool_async_index_writes.
Description: Monitors number of synchronous index page writes in interval.
bp_pool_sync_idx_reads – count
Calculated as: bp_pool_index_p_reads - bp_pool_async_index_reads.
Description: Monitors number of synchronous index page reads in interval.
ts_usable_pages_pct – ratio
Calculated as: (ts_usable_pages / ts_total_pages) * 100.
Description: Monitors percent of usable pages in DMS table space (exlc. overhead).
ts_used_pages_pct – ratio
Calculated as: (ts_used_pages / ts_total_pages) * 100.
Description: Monitors percent of used pages in table space.
ts_free_pages_pct – ratio
Calculated as: (ts_free_pages / ts_total_pages) * 100.
Description: Monitors percent of free pages in DMS table space.
Probe Configuration
52 db2 Guide
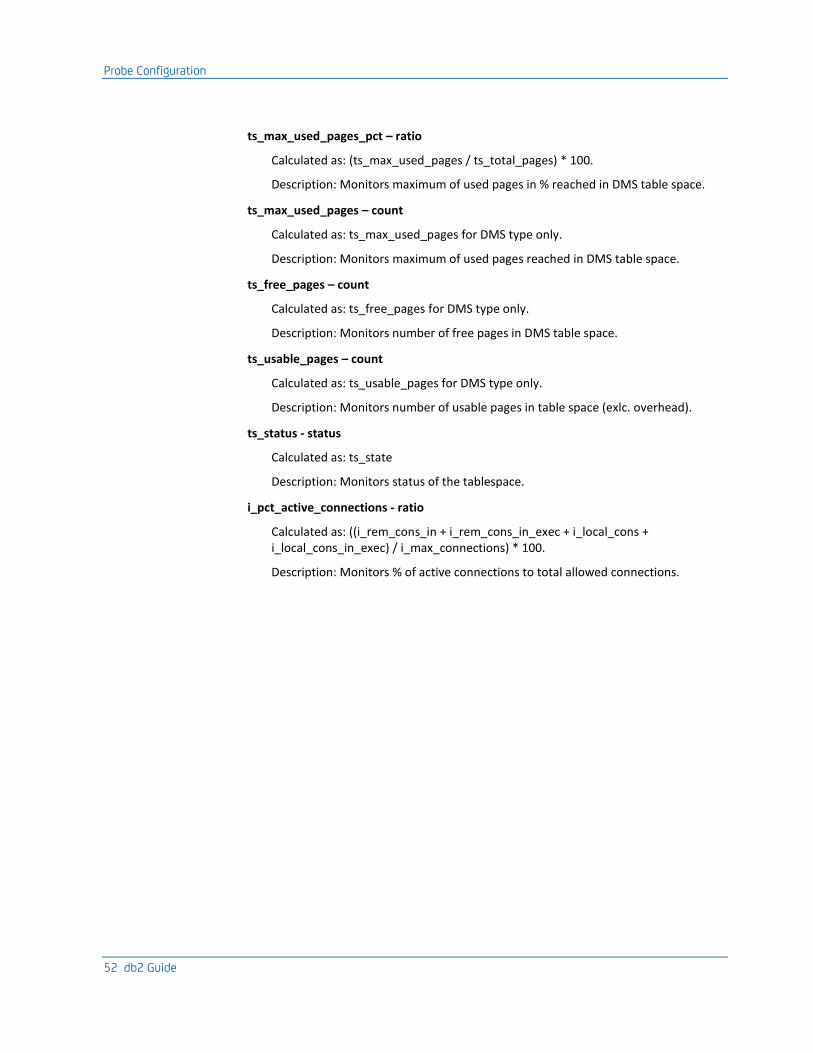
ts_max_used_pages_pct – ratio
Calculated as: (ts_max_used_pages / ts_total_pages) * 100.
Description: Monitors maximum of used pages in % reached in DMS table space.
ts_max_used_pages – count
Calculated as: ts_max_used_pages for DMS type only.
Description: Monitors maximum of used pages reached in DMS table space.
ts_free_pages – count
Calculated as: ts_free_pages for DMS type only.
Description: Monitors number of free pages in DMS table space.
ts_usable_pages – count
Calculated as: ts_usable_pages for DMS type only.
Description: Monitors number of usable pages in table space (exlc. overhead).
ts_status - status
Calculated as: ts_state
Description: Monitors status of the tablespace.
i_pct_active_connections - ratio
Calculated as: ((i_rem_cons_in + i_rem_cons_in_exec + i_local_cons + i_local_cons_in_exec) / i_max_connections) * 100.
Description: Monitors % of active connections to total allowed connections.
Chapter 4: QoS Threshold Metrics 53
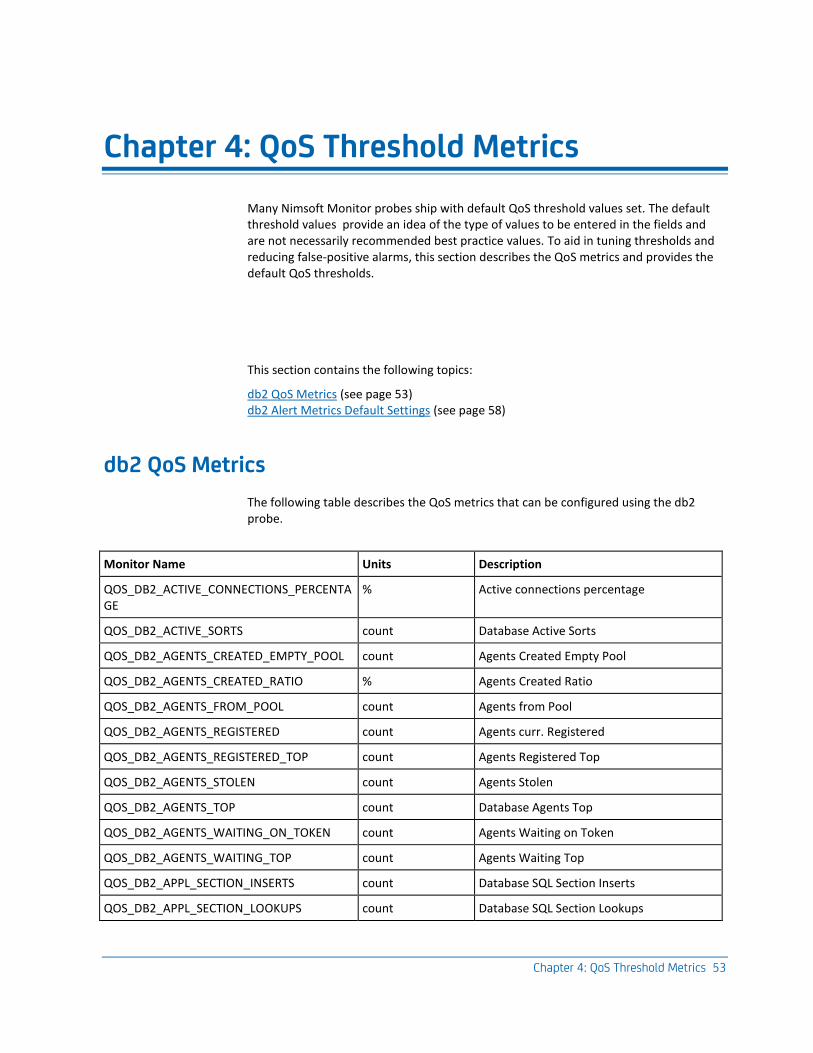
Chapter 4: QoS Threshold Metrics
Many Nimsoft Monitor probes ship with default QoS threshold values set. The default threshold values provide an idea of the type of values to be entered in the fields and are not necessarily recommended best practice values. To aid in tuning thresholds and reducing false-positive alarms, this section describes the QoS metrics and provides the default QoS thresholds.
This section contains the following topics:
db2 QoS Metrics (see page 53) db2 Alert Metrics Default Settings (see page 58)
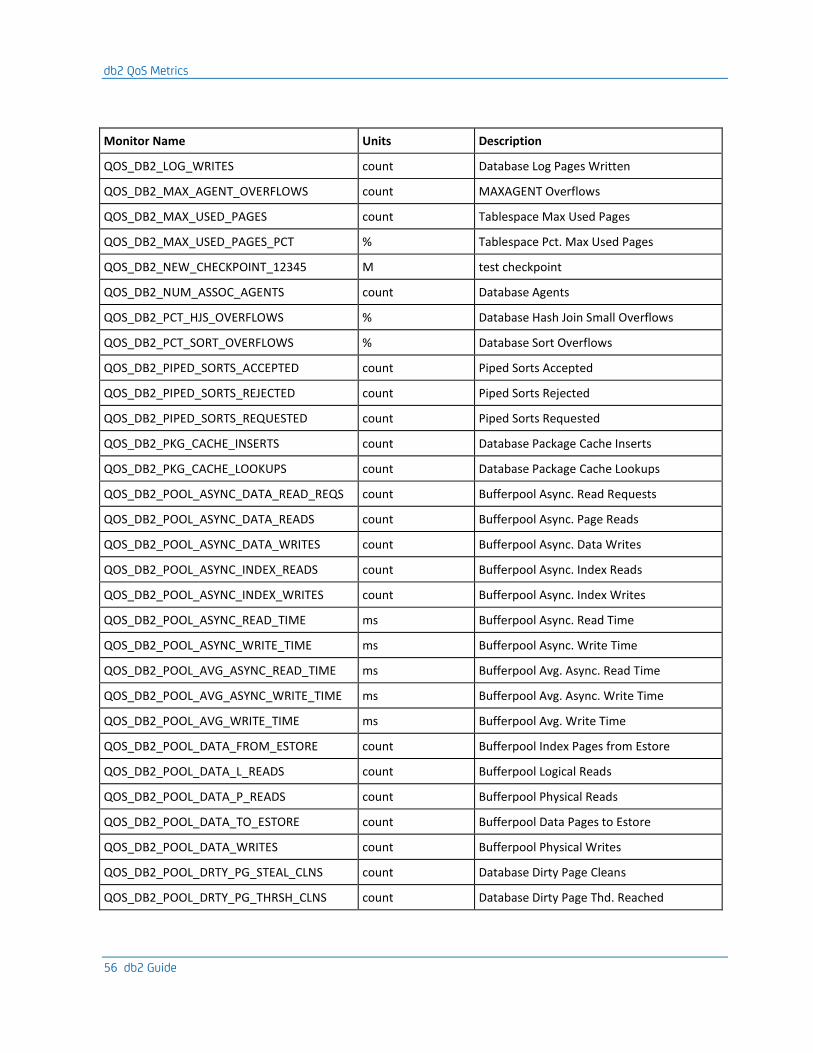
db2 QoS Metrics
The following table describes the QoS metrics that can be configured using the db2 probe.
Monitor Name Units Description
QOS_DB2_ACTIVE_CONNECTIONS_PERCENTAGE
% Active connections percentage
QOS_DB2_ACTIVE_SORTS count Database Active Sorts
QOS_DB2_AGENTS_CREATED_EMPTY_POOL count Agents Created Empty Pool
QOS_DB2_AGENTS_CREATED_RATIO % Agents Created Ratio
QOS_DB2_AGENTS_FROM_POOL count Agents from Pool
QOS_DB2_AGENTS_REGISTERED count Agents curr. Registered
QOS_DB2_AGENTS_REGISTERED_TOP count Agents Registered Top
QOS_DB2_AGENTS_STOLEN count Agents Stolen
QOS_DB2_AGENTS_TOP count Database Agents Top
QOS_DB2_AGENTS_WAITING_ON_TOKEN count Agents Waiting on Token
QOS_DB2_AGENTS_WAITING_TOP count Agents Waiting Top
QOS_DB2_APPL_SECTION_INSERTS count Database SQL Section Inserts
QOS_DB2_APPL_SECTION_LOOKUPS count Database SQL Section Lookups
db2 QoS Metrics
54 db2 Guide
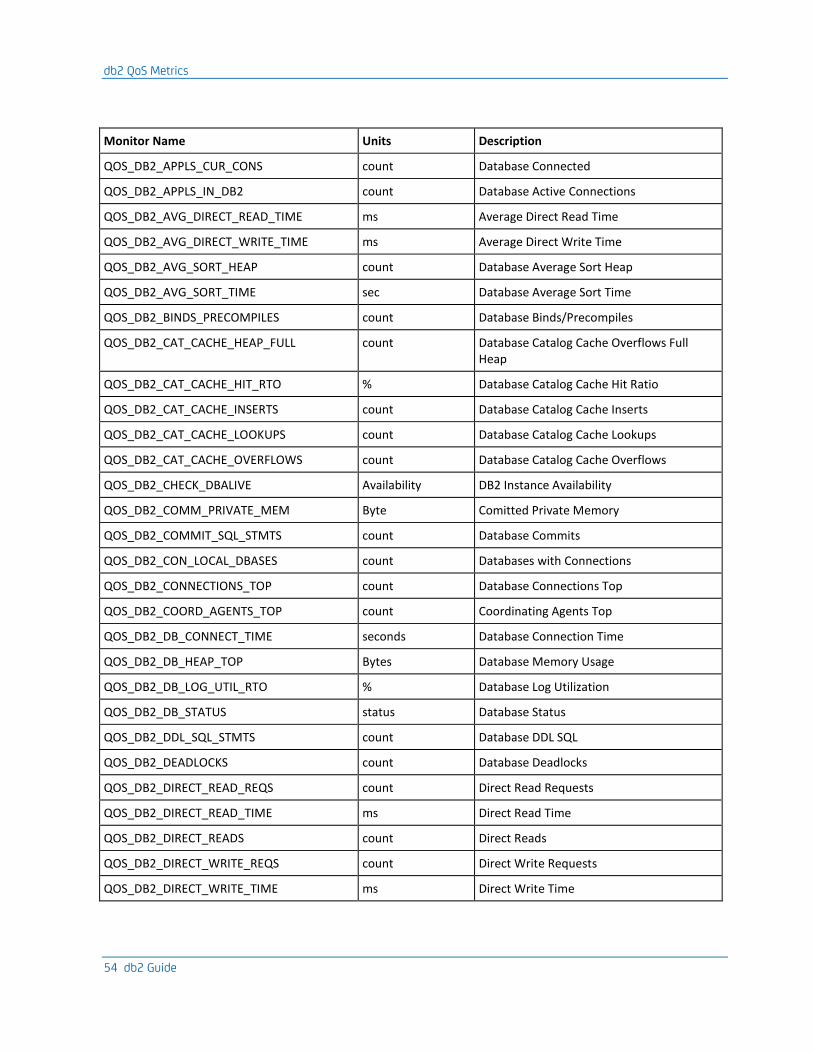
Monitor Name Units Description
QOS_DB2_APPLS_CUR_CONS count Database Connected
QOS_DB2_APPLS_IN_DB2 count Database Active Connections
QOS_DB2_AVG_DIRECT_READ_TIME ms Average Direct Read Time
QOS_DB2_AVG_DIRECT_WRITE_TIME ms Average Direct Write Time
QOS_DB2_AVG_SORT_HEAP count Database Average Sort Heap
QOS_DB2_AVG_SORT_TIME sec Database Average Sort Time
QOS_DB2_BINDS_PRECOMPILES count Database Binds/Precompiles
QOS_DB2_CAT_CACHE_HEAP_FULL count Database Catalog Cache Overflows Full Heap
QOS_DB2_CAT_CACHE_HIT_RTO % Database Catalog Cache Hit Ratio
QOS_DB2_CAT_CACHE_INSERTS count Database Catalog Cache Inserts
QOS_DB2_CAT_CACHE_LOOKUPS count Database Catalog Cache Lookups
QOS_DB2_CAT_CACHE_OVERFLOWS count Database Catalog Cache Overflows
QOS_DB2_CHECK_DBALIVE Availability DB2 Instance Availability
QOS_DB2_COMM_PRIVATE_MEM Byte Comitted Private Memory
QOS_DB2_COMMIT_SQL_STMTS count Database Commits
QOS_DB2_CON_LOCAL_DBASES count Databases with Connections
QOS_DB2_CONNECTIONS_TOP count Database Connections Top
QOS_DB2_COORD_AGENTS_TOP count Coordinating Agents Top
QOS_DB2_DB_CONNECT_TIME seconds Database Connection Time
QOS_DB2_DB_HEAP_TOP Bytes Database Memory Usage
QOS_DB2_DB_LOG_UTIL_RTO % Database Log Utilization
QOS_DB2_DB_STATUS status Database Status
QOS_DB2_DDL_SQL_STMTS count Database DDL SQL
QOS_DB2_DEADLOCKS count Database Deadlocks
QOS_DB2_DIRECT_READ_REQS count Direct Read Requests
QOS_DB2_DIRECT_READ_TIME ms Direct Read Time
QOS_DB2_DIRECT_READS count Direct Reads
QOS_DB2_DIRECT_WRITE_REQS count Direct Write Requests
QOS_DB2_DIRECT_WRITE_TIME ms Direct Write Time

db2 QoS Metrics
Chapter 4: QoS Threshold Metrics 55
Monitor Name Units Description
QOS_DB2_DIRECT_WRITES count Direct Writes
QOS_DB2_DYNAMIC_SQL_STMTS count Database Dynamic SQL
QOS_DB2_FAILED_SQL_STMTS count Database Failed SQL
QOS_DB2_FILES_CLOSED count Bufferpool File Close
QOS_DB2_FREE_PAGES count Tablespace Free Pages
QOS_DB2_FREE_PAGES_PCT % Tablespace Pct. Free Pages
QOS_DB2_GW_CONS_WAIT_CLIENT count Connections Waiting on Client
QOS_DB2_GW_CONS_WAIT_HOST count Connections Waiting on Host
QOS_DB2_GW_CUR_CONS count Gateway Current Connections
QOS_DB2_GW_TOTAL_CONS count Gateway Connection Attempts
QOS_DB2_HASH_JOIN_OVERFLOWS count Database Hash Join Overflows
QOS_DB2_HASH_JOIN_SMALL_OVERFLOWS count Database Hash Join Small Overflows
QOS_DB2_IDLE_AGENTS count Unassigned Agents
QOS_DB2_INT_AUTO_REBINDS count Database Auto Rebinds
QOS_DB2_INT_COMMITS count Database Internal Commits
QOS_DB2_INT_DEADLOCK_ROLLBACKS count Database Internal Deadlock Rollbacks
QOS_DB2_INT_ROLLBACKS count Database Internal Rollbacks
QOS_DB2_INT_ROWS_DELETED count Database Internal Deletes
QOS_DB2_INT_ROWS_INSERTED count Database Internal Inserts
QOS_DB2_INT_ROWS_UPDATED count Database Internal Updates
QOS_DB2_LOCAL_CONS count Current Local Connections
QOS_DB2_LOCAL_CONS_IN_EXEC count Current Local Connections Executing
QOS_DB2_LOCK_ESCALS count Database Lock Escalations
QOS_DB2_LOCK_LIST_IN_USE Bytes Database Lock List Use
QOS_DB2_LOCK_TIMEOUTS count Database Locks Waiting
QOS_DB2_LOCK_WAIT_TIME ms Database Lock Wait Time
QOS_DB2_LOCK_WAITS count Database Lock Waits
QOS_DB2_LOCKS_HELD count Database Locks Held
QOS_DB2_LOCKS_WAITING count Database Locks Waiting
QOS_DB2_LOG_READS count Database Log Pages Read
db2 QoS Metrics
56 db2 Guide
Monitor Name Units Description
QOS_DB2_LOG_WRITES count Database Log Pages Written
QOS_DB2_MAX_AGENT_OVERFLOWS count MAXAGENT Overflows
QOS_DB2_MAX_USED_PAGES count Tablespace Max Used Pages
QOS_DB2_MAX_USED_PAGES_PCT % Tablespace Pct. Max Used Pages
QOS_DB2_NEW_CHECKPOINT_12345 M test checkpoint
QOS_DB2_NUM_ASSOC_AGENTS count Database Agents
QOS_DB2_PCT_HJS_OVERFLOWS % Database Hash Join Small Overflows
QOS_DB2_PCT_SORT_OVERFLOWS % Database Sort Overflows
QOS_DB2_PIPED_SORTS_ACCEPTED count Piped Sorts Accepted
QOS_DB2_PIPED_SORTS_REJECTED count Piped Sorts Rejected
QOS_DB2_PIPED_SORTS_REQUESTED count Piped Sorts Requested
QOS_DB2_PKG_CACHE_INSERTS count Database Package Cache Inserts
QOS_DB2_PKG_CACHE_LOOKUPS count Database Package Cache Lookups
QOS_DB2_POOL_ASYNC_DATA_READ_REQS count Bufferpool Async. Read Requests
QOS_DB2_POOL_ASYNC_DATA_READS count Bufferpool Async. Page Reads
QOS_DB2_POOL_ASYNC_DATA_WRITES count Bufferpool Async. Data Writes
QOS_DB2_POOL_ASYNC_INDEX_READS count Bufferpool Async. Index Reads
QOS_DB2_POOL_ASYNC_INDEX_WRITES count Bufferpool Async. Index Writes
QOS_DB2_POOL_ASYNC_READ_TIME ms Bufferpool Async. Read Time
QOS_DB2_POOL_ASYNC_WRITE_TIME ms Bufferpool Async. Write Time
QOS_DB2_POOL_AVG_ASYNC_READ_TIME ms Bufferpool Avg. Async. Read Time
QOS_DB2_POOL_AVG_ASYNC_WRITE_TIME ms Bufferpool Avg. Async. Write Time
QOS_DB2_POOL_AVG_WRITE_TIME ms Bufferpool Avg. Write Time
QOS_DB2_POOL_DATA_FROM_ESTORE count Bufferpool Index Pages from Estore
QOS_DB2_POOL_DATA_L_READS count Bufferpool Logical Reads
QOS_DB2_POOL_DATA_P_READS count Bufferpool Physical Reads
QOS_DB2_POOL_DATA_TO_ESTORE count Bufferpool Data Pages to Estore
QOS_DB2_POOL_DATA_WRITES count Bufferpool Physical Writes
QOS_DB2_POOL_DRTY_PG_STEAL_CLNS count Database Dirty Page Cleans
QOS_DB2_POOL_DRTY_PG_THRSH_CLNS count Database Dirty Page Thd. Reached

db2 QoS Metrics
Chapter 4: QoS Threshold Metrics 57
Monitor Name Units Description
QOS_DB2_POOL_HIT_RATIO % Bufferpool Hit Ratio
QOS_DB2_POOL_INDEX_FROM_ESTORE count Bufferpool Index Pages from Estore
QOS_DB2_POOL_INDEX_L_READS count Bufferpool Logical Index Reads
QOS_DB2_POOL_INDEX_P_READS count Bufferpool Physical Index Reads
QOS_DB2_POOL_INDEX_TO_ESTORE count Bufferpool Index Pages to Estore
QOS_DB2_POOL_INDEX_WRITES count Bufferpool Index Writes
QOS_DB2_POOL_LSN_GAP_CLNS count Database Log Space Cleans
QOS_DB2_POOL_READ_TIME ms Bufferpool Total Read Time
QOS_DB2_POOL_SYNC_IDX_READS count Bufferpool Sync. Index Reads
QOS_DB2_POOL_SYNC_IDX_WRITES count Bufferpool Synchronous Index Writes
QOS_DB2_POOL_SYNC_READS count Bufferpool Synchronous Reads
QOS_DB2_POOL_SYNC_WRITE_TIME ms Bufferpool Sync. Write Time
QOS_DB2_POOL_SYNC_WRITES count Bufferpool Sync. Writes
QOS_DB2_POOL_WRITE_TIME ms Bufferpool Physical Write Time
QOS_DB2_POST_THRESHOLD_HASH_JOINS count Post Treshold Hash Joins
QOS_DB2_POST_THRESHOLD_SORTS count Post Threshold Sorts
QOS_DB2_PREFETCH_WAIT_TIME ms Database Prefetch Wait Time
QOS_DB2_REM_CONS_IN count Current Remote Connections
QOS_DB2_REM_CONS_IN_EXEC count Current Remote Connections Executing
QOS_DB2_ROLLBACK_SQL_STMTS count Database Rollbacks
QOS_DB2_ROWS_DELETED count Database Rows Deleted
QOS_DB2_ROWS_INSERTED count Database Rows Inserted
QOS_DB2_ROWS_SELECTED count Database Rows Selected
QOS_DB2_ROWS_UPDATED count Database Rows Updated
QOS_DB2_SEC_LOG_USED_TOP Bytes Database Secondary Logspace Top
QOS_DB2_SEC_LOGS_ALLOCATED count Database Secondary Logs
QOS_DB2_SELECT_SQL_STMTS count Database Select SQL
QOS_DB2_SINCE_LAST_BACKUP hours Hours Since Last Backup
QOS_DB2_SORT_HEAP_ALLOCATED count Sort Heap Allocated
QOS_DB2_SORT_OVERFLOWS count Database Sort Overflows

db2 Alert Metrics Default Settings
58 db2 Guide
Monitor Name Units Description
QOS_DB2_STATIC_SQL_STMTS count Database Static SQL
QOS_DB2_TOT_LOG_USED_TOP Bytes Database Total Logspace Top
QOS_DB2_TOTAL_CONS count Database Connects
QOS_DB2_TOTAL_HASH_JOINS count Database Hash Joins
QOS_DB2_TOTAL_HASH_LOOPS count Database Hash Loops
QOS_DB2_TOTAL_PAGES count Tablespace Total Pages
QOS_DB2_TOTAL_SEC_CONS count Database Secondary Connections
QOS_DB2_TOTAL_SORT_TIME ms Database Total Sort Time
QOS_DB2_TOTAL_SORTS count Database Total Sorts
QOS_DB2_TS_DATA_PARTITIONING % Data partitioning free percent
QOS_DB2_TS_STATUS status Tablespace Status
QOS_DB2_UID_SQL_STMTS count Database UID SQL
QOS_DB2_USABLE_PAGES count Tablespace Total Pages
QOS_DB2_USABLE_PAGES_PCT % Tablespace Pct. Usable Pages
QOS_DB2_USED_PAGES count Tablespace Used Pages
QOS_DB2_USED_PAGES_PCT % Tablespace Pct. Used Pages
QOS_DB2_X_LOCK_ESCALS count Database X-Lock Escalations
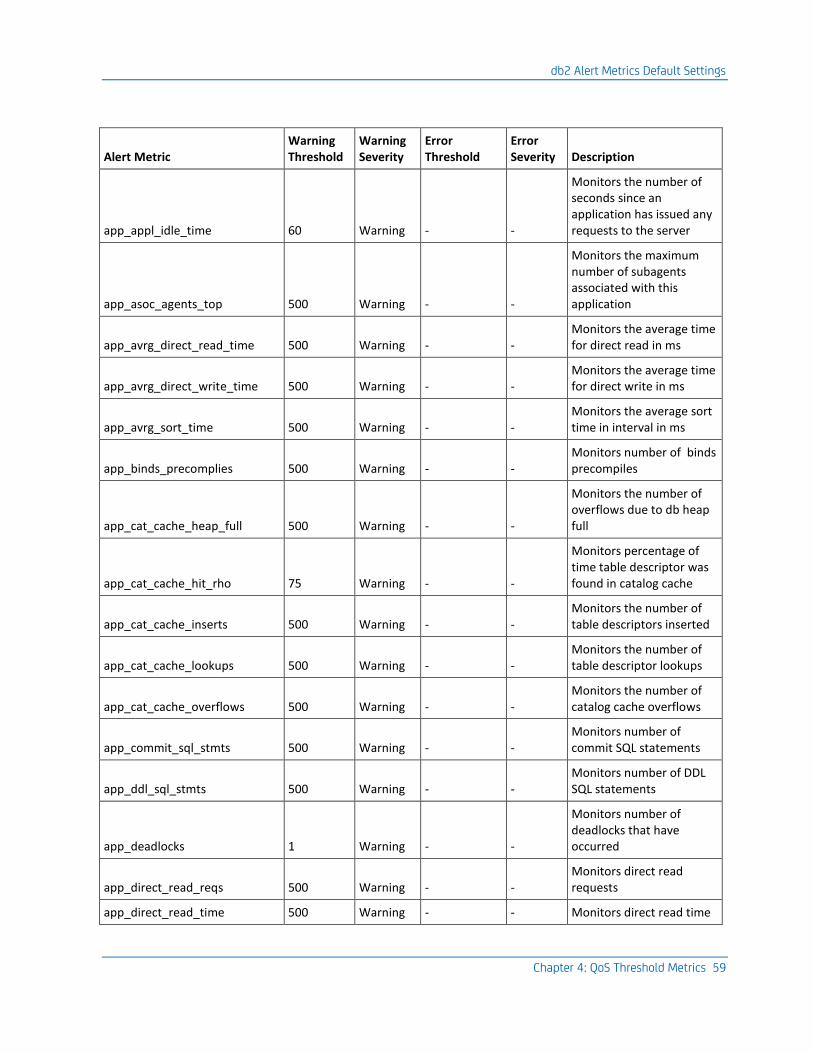
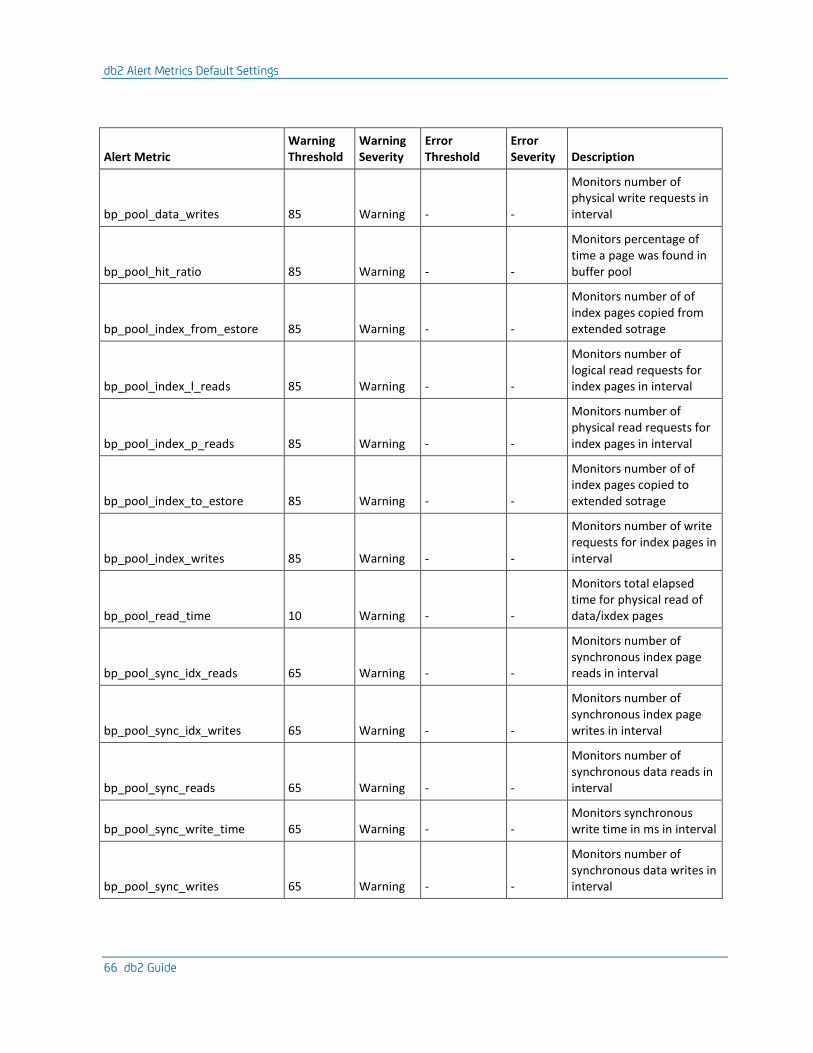
db2 Alert Metrics Default Settings
This section contains the QoS metric default settings for the db2 probe.
Alert Metric Warning Threshold
Warning Severity
Error Threshold
Error Severity Description
app_acc_curs_blk 500 Warning - -
Monitors the number of times that a request for an I/O block was accepted
app_agents_stolen 500 Warning - -
Monitors the number of agents stolen from app. in interval
db2 Alert Metrics Default Settings
Chapter 4: QoS Threshold Metrics 59
Alert Metric Warning Threshold
Warning Severity
Error Threshold
Error Severity Description
app_appl_idle_time 60 Warning - -
Monitors the number of seconds since an application has issued any requests to the server
app_asoc_agents_top 500 Warning - -
Monitors the maximum number of subagents associated with this application
app_avrg_direct_read_time 500 Warning - - Monitors the average time for direct read in ms
app_avrg_direct_write_time 500 Warning - - Monitors the average time for direct write in ms
app_avrg_sort_time 500 Warning - - Monitors the average sort time in interval in ms
app_binds_precomplies 500 Warning - - Monitors number of binds precompiles
app_cat_cache_heap_full 500 Warning - -
Monitors the number of overflows due to db heap full
app_cat_cache_hit_rho 75 Warning - -
Monitors percentage of time table descriptor was found in catalog cache
app_cat_cache_inserts 500 Warning - - Monitors the number of table descriptors inserted
app_cat_cache_lookups 500 Warning - - Monitors the number of table descriptor lookups
app_cat_cache_overflows 500 Warning - - Monitors the number of catalog cache overflows
app_commit_sql_stmts 500 Warning - - Monitors number of commit SQL statements
app_ddl_sql_stmts 500 Warning - - Monitors number of DDL SQL statements
app_deadlocks 1 Warning - -
Monitors number of deadlocks that have occurred
app_direct_read_reqs 500 Warning - - Monitors direct read requests
app_direct_read_time 500 Warning - - Monitors direct read time
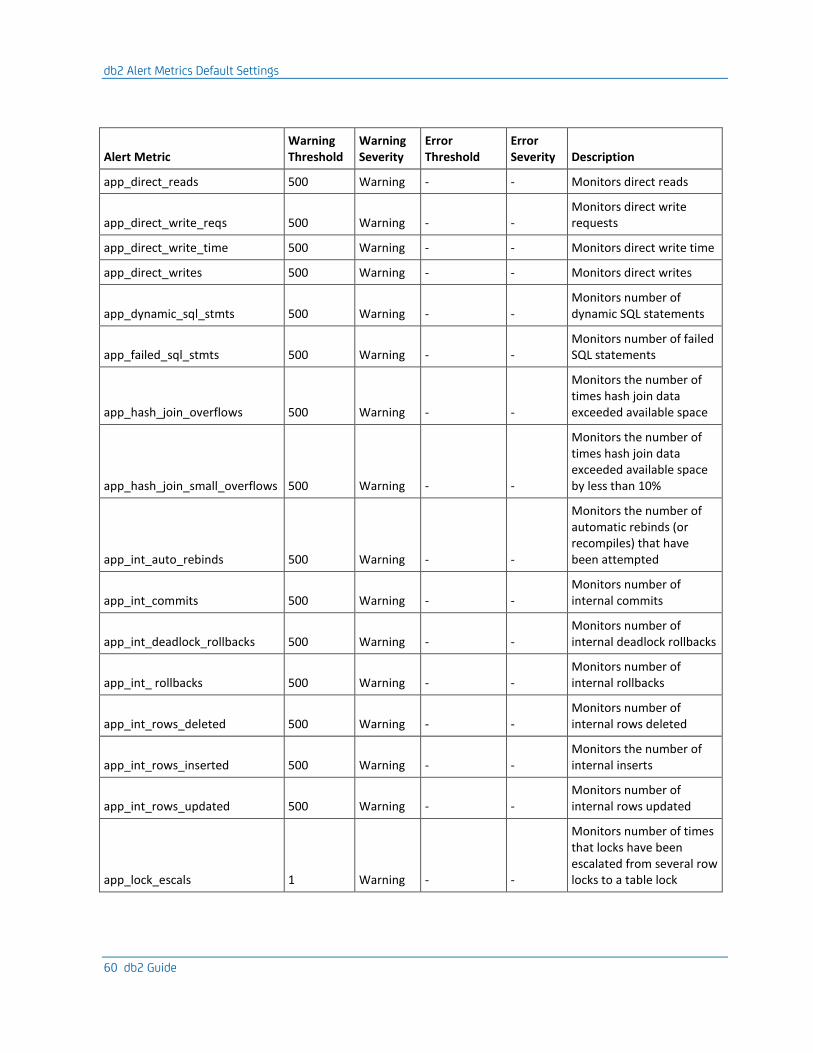
db2 Alert Metrics Default Settings
60 db2 Guide
Alert Metric Warning Threshold
Warning Severity
Error Threshold
Error Severity Description
app_direct_reads 500 Warning - - Monitors direct reads
app_direct_write_reqs 500 Warning - - Monitors direct write requests
app_direct_write_time 500 Warning - - Monitors direct write time
app_direct_writes 500 Warning - - Monitors direct writes
app_dynamic_sql_stmts 500 Warning - - Monitors number of dynamic SQL statements
app_failed_sql_stmts 500 Warning - - Monitors number of failed SQL statements
app_hash_join_overflows 500 Warning - -
Monitors the number of times hash join data exceeded available space
app_hash_join_small_overflows 500 Warning - -
Monitors the number of times hash join data exceeded available space by less than 10%
app_int_auto_rebinds 500 Warning - -
Monitors the number of automatic rebinds (or recompiles) that have been attempted
app_int_commits 500 Warning - - Monitors number of internal commits
app_int_deadlock_rollbacks 500 Warning - - Monitors number of internal deadlock rollbacks
app_int_ rollbacks 500 Warning - - Monitors number of internal rollbacks
app_int_rows_deleted 500 Warning - - Monitors number of internal rows deleted
app_int_rows_inserted 500 Warning - - Monitors the number of internal inserts
app_int_rows_updated 500 Warning - - Monitors number of internal rows updated
app_lock_escals 1 Warning - -
Monitors number of times that locks have been escalated from several row locks to a table lock
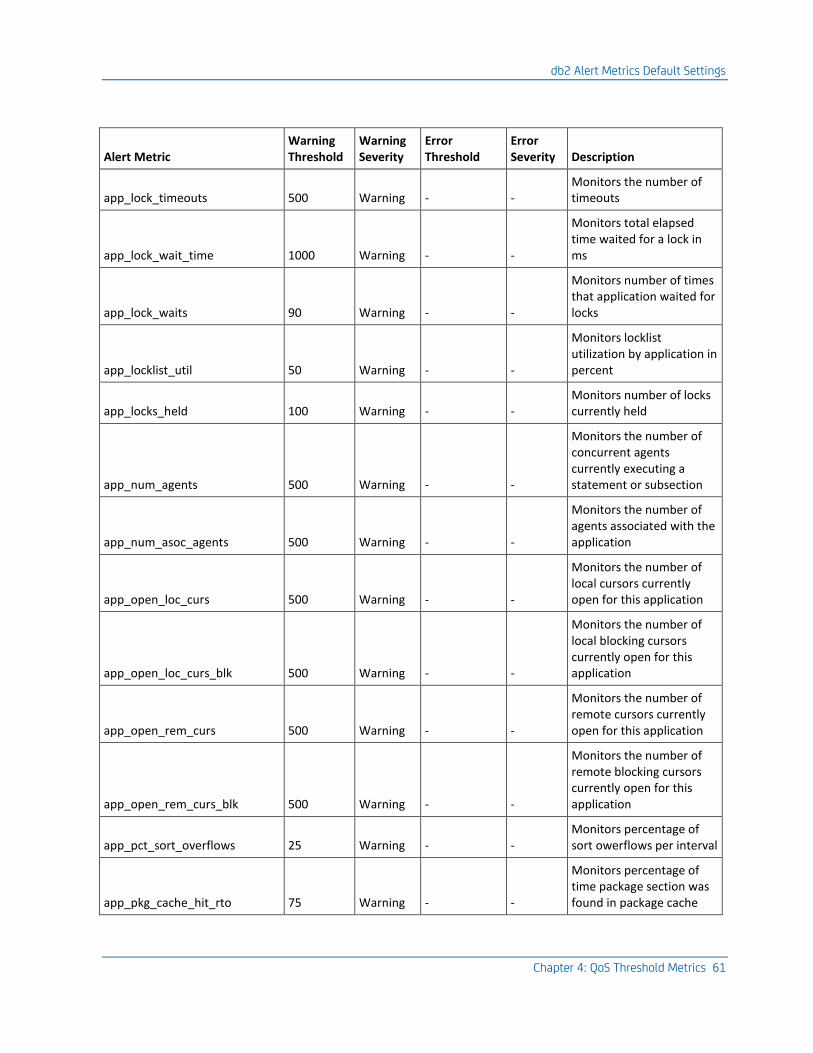
db2 Alert Metrics Default Settings
Chapter 4: QoS Threshold Metrics 61
Alert Metric Warning Threshold
Warning Severity
Error Threshold
Error Severity Description
app_lock_timeouts 500 Warning - - Monitors the number of timeouts
app_lock_wait_time 1000 Warning - -
Monitors total elapsed time waited for a lock in ms
app_lock_waits 90 Warning - -
Monitors number of times that application waited for locks
app_locklist_util 50 Warning - -
Monitors locklist utilization by application in percent
app_locks_held 100 Warning - - Monitors number of locks currently held
app_num_agents 500 Warning - -
Monitors the number of concurrent agents currently executing a statement or subsection
app_num_asoc_agents 500 Warning - -
Monitors the number of agents associated with the application
app_open_loc_curs 500 Warning - -
Monitors the number of local cursors currently open for this application
app_open_loc_curs_blk 500 Warning - -
Monitors the number of local blocking cursors currently open for this application
app_open_rem_curs 500 Warning - -
Monitors the number of remote cursors currently open for this application
app_open_rem_curs_blk 500 Warning - -
Monitors the number of remote blocking cursors currently open for this application
app_pct_sort_overflows 25 Warning - - Monitors percentage of sort owerflows per interval
app_pkg_cache_hit_rto 75 Warning - -
Monitors percentage of time package section was found in package cache

db2 Alert Metrics Default Settings
62 db2 Guide
Alert Metric Warning Threshold
Warning Severity
Error Threshold
Error Severity Description
app_pkg_cache_inserts 500 Warning - -
Monitors the number of sections inserted into cache
app_pkg_cache_lookups 500 Warning - - Monitors the number of section lookups
app_pool_data_I_reads 500 Warning - - Monitors number of logical read requests
app_pool_data_p_reads 500 Warning - - Monitors number of reads, requiring physical I/O
app_pool_data_writes 500 Warning - -
Monitors number of times, data was physicaly written to disk
app_pool_hit_ratio 85 Warning - -
Monitors the percentage of time a page was found in buffer pool on application request
app_pool_index_l_reads 500 Warning - -
Monitors number of logical read req. for index pages
app_pool_index_p_reads 500 Warning - -
Monitors number of req. for index page req. physical I/O
app_pool_index_writes 500 Warning - -
Monitors number of times, index page was written to disk
app_pool_read_time 500 Warning - -
Monitors total el.time for ph. read of data/ix. pages in ms
app_pool_write_time 500 Warning - -
Monitors total el.time for ph. read of data/ix. pages in ms
app_rej_curs_blk 500 Warning - -
Monitors the number of times that a request for an I/O block at server was rejected
app_rollback_sql_stmts 500 Warning - - Monitors number of rollback SQL statements
app_rows_deleted 500 Warning - - Monitors number of rows deleted

db2 Alert Metrics Default Settings
Chapter 4: QoS Threshold Metrics 63
Alert Metric Warning Threshold
Warning Severity
Error Threshold
Error Severity Description
app_rows_inserted 500 Warning - - Monitors number of rows inserted
app_rows_read 500 Warning - - Monitors number of rows read
app_rows_selected 500 Warning - - Monitors number of rows selected
app_rows_updated 500 Warning - - Monitors number of rows updated
app_rows_written 500 Warning - - Monitors number of rows written
app_select_sql_stmts 500 Warning - - Monitors number of select SQL statements
app_sort_overflows 50 Warning - -
Monitors the total number of sorts that ran out of sort heap
app_static_sql_stmts 500 Warning - - Monitors number of static SQL statements
app_sys_cpu_time 500 Warning - -
Monitors the total system CPU time (in seconds) used by database manager agent process
app_total_hash_joins 500 Warning - -
Monitors the number of hash joins executed in interval
app_total_hash_loops 500 Warning - -
Monitors the number of hash joins executed in interval
app_total_sort_time 50 Warning - -
Monitors the total elapsed time (in ms) for all sorts that have been executed
app_total_sorts 1 Warning - -
Monitors the total number of sorts that have been executed
app_uid_sql_stmts 500 Warning - - Monitors number of UID SQL statements
app_uow_elapsed_time 500 Warning - -
Monitors the elapsed execution time of the most recently completed UOW

db2 Alert Metrics Default Settings
64 db2 Guide
Alert Metric Warning Threshold
Warning Severity
Error Threshold
Error Severity Description
app_uow_lock_wait_time 500 Warning - -
Monitors the total amount of elapsed time this unit of work has spent waiting for locks in ms
app_uow_log_space_used 500 Warning - -
Monitors the amount of log space (in bytes) used in the current UOW
app_usr_cpu_time 500 Warning - -
Monitors the total user CPU time (in seconds) used by database manager agent process
app_x_lock_escals 1 Warning - -
Monitors number of times that (x) locks have been escalated from several row locks to one exclusive table lock
bp_avg_direct_read_time 65 Warning - -
Monitors average time for direct read in ms in interval
bp_avg_direct_write_time 65 Warning - -
Monitors average time for direct write in ms in interval
bp_direct_read_reqs 85 Warning - - Monitors number of direct read requests
bp_direct_read_time 85 Warning - - Monitors direct read time
bp_direct_reads 85 Warning - - Monitors number of direct reads
bp_direct_write_reqs 85 Warning - - Monitors number of direct write requests
bp_direct_write_time 85 Warning - - Monitors direct write time
bp_direct_writes 85 Warning - - Monitors number of direct writes
bp_files_closed 85 Warning - - Monitors number of file close operations
bp_pool_async_data_read_reqs 85 Warning - -
Monitors number of asynchronous read requests

db2 Alert Metrics Default Settings
Chapter 4: QoS Threshold Metrics 65
Alert Metric Warning Threshold
Warning Severity
Error Threshold
Error Severity Description
bp_pool_async_data_reads 85 Warning - -
Monitors number of pages read asynchronously into the bufferpool
bp_pool_async_data_writes 85 Warning - -
Monitors number of pages written asynchronously into the bufferpool
bp_pool_async_index_reads 85 Warning - - Monitors number of asynchronous index reads
bp_pool_async_index_writes 85 Warning - -
Monitors number of index pages written asynchronously into the bufferpool
bp_pool_async_read_time 85 Warning - -
Monitors elapsed time spent reading by prefetcher
bp_pool_async_write_time 85 Warning - -
Monitors elapsed time spent asynchronously writing
bp_pool_avg_async_read_time 15 Warning - -
Monitors average asynchronous read time in ms in interval
bp_pool_avg_async_write_time 25 Warning - -
Monitors average asynchronous write time in ms in interval
bp_pool_avg_write_time 65 Warning - -
Monitors average asynchronous write time in ms in interval
bp_pool_data_from_estore 85 Warning - -
Monitors number of of data pages copied from extended sotrage
bp_pool_data_l_reads 100000 Warning - -
Monitors number of logical read requests in interval
bp_pool_data_p_reads 85 Warning - -
Monitors number of physical read requests in interval
bp_pool_data_to_estore 85 Warning - -
Monitors number of of data pages copied to extended sotrage
db2 Alert Metrics Default Settings
66 db2 Guide
Alert Metric Warning Threshold
Warning Severity
Error Threshold
Error Severity Description
bp_pool_data_writes 85 Warning - -
Monitors number of physical write requests in interval
bp_pool_hit_ratio 85 Warning - -
Monitors percentage of time a page was found in buffer pool
bp_pool_index_from_estore 85 Warning - -
Monitors number of of index pages copied from extended sotrage
bp_pool_index_l_reads 85 Warning - -
Monitors number of logical read requests for index pages in interval
bp_pool_index_p_reads 85 Warning - -
Monitors number of physical read requests for index pages in interval
bp_pool_index_to_estore 85 Warning - -
Monitors number of of index pages copied to extended sotrage
bp_pool_index_writes 85 Warning - -
Monitors number of write requests for index pages in interval
bp_pool_read_time 10 Warning - -
Monitors total elapsed time for physical read of data/ixdex pages
bp_pool_sync_idx_reads 65 Warning - -
Monitors number of synchronous index page reads in interval
bp_pool_sync_idx_writes 65 Warning - -
Monitors number of synchronous index page writes in interval
bp_pool_sync_reads 65 Warning - -
Monitors number of synchronous data reads in interval
bp_pool_sync_write_time 65 Warning - - Monitors synchronous write time in ms in interval
bp_pool_sync_writes 65 Warning - -
Monitors number of synchronous data writes in interval

db2 Alert Metrics Default Settings
Chapter 4: QoS Threshold Metrics 67
Alert Metric Warning Threshold
Warning Severity
Error Threshold
Error Severity Description
bp_pool_write_time 85 Warning - -
Monitors elapsed time for physical write of data/index pages
db_active_sorts 800 Warning - -
Monitors # of sorts currently having heap allocated
db_agents_top 5 Warning - -
Monitors max # of agents associated at once with the database
db_appl_section_inserts 5 Warning - - Monitors # of inserts due SQL section not found
db_appl_section_lookups 5 Warning - - Monitors # of references to SQL work area
db_appls_cur_cons 25 Warning - -
Monitors number of applications currently connected
db_appls_in_db2 25 Warning - -
Monitors number of applications currently connected
db_avg_direct_read_time 15 Warning - - Monitors average time for direct read in ms
db_avg_direct_write_time 25 Warning - - Monitors average time for direct write in ms
db_avg_sort_heap 100 Warning - -
Monitors average number of pages allocated to sort heap in interval
db_avg_sort_time 10 Warning - - Monitors average sort time in interval in sec
db_binds_precomplies 25 Warning - - Monitors number of binds/precompiles
db_cat_cache_heap_full 25 Warning - -
Monitors number of of overflows due to databae heap full
db_cat_cache_hit_rto 50 Warning - -
Monitors percent of times, information was found in catalog cache
db_cat_cache_inserts 25 Warning - - Monitors number of catalog cache inserts
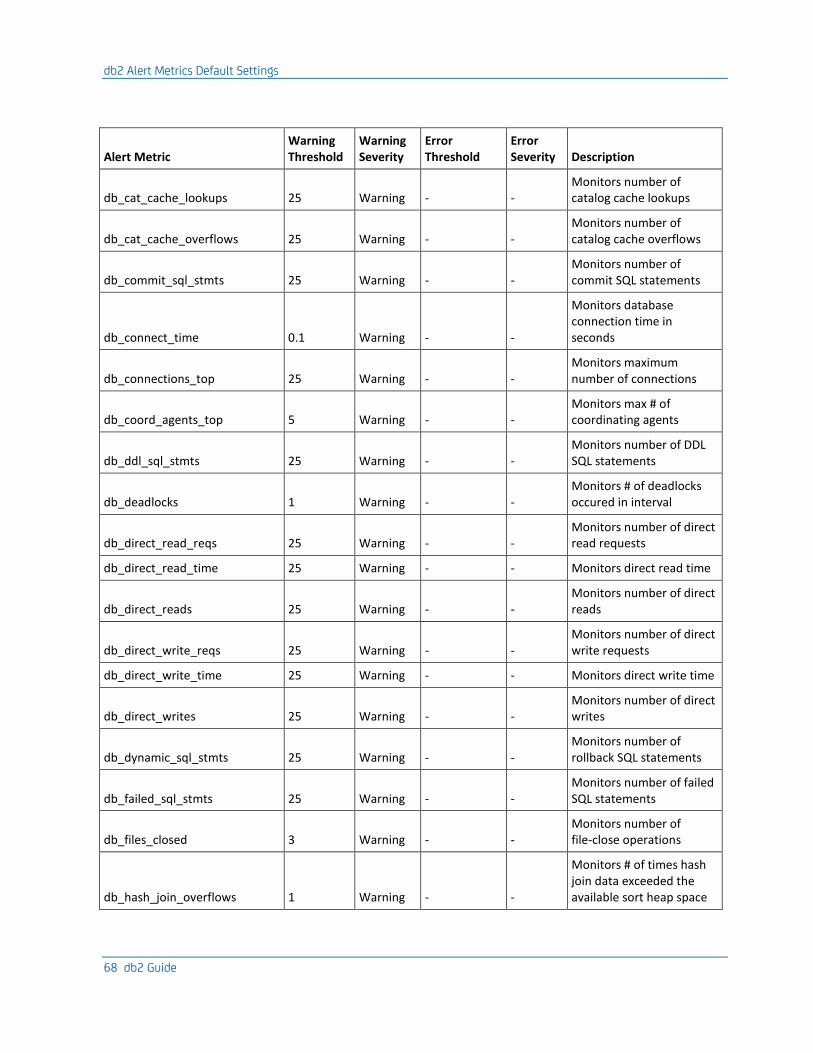
db2 Alert Metrics Default Settings
68 db2 Guide
Alert Metric Warning Threshold
Warning Severity
Error Threshold
Error Severity Description
db_cat_cache_lookups 25 Warning - - Monitors number of catalog cache lookups
db_cat_cache_overflows 25 Warning - - Monitors number of catalog cache overflows
db_commit_sql_stmts 25 Warning - - Monitors number of commit SQL statements
db_connect_time 0.1 Warning - -
Monitors database connection time in seconds
db_connections_top 25 Warning - - Monitors maximum number of connections
db_coord_agents_top 5 Warning - - Monitors max # of coordinating agents
db_ddl_sql_stmts 25 Warning - - Monitors number of DDL SQL statements
db_deadlocks 1 Warning - - Monitors # of deadlocks occured in interval
db_direct_read_reqs 25 Warning - - Monitors number of direct read requests
db_direct_read_time 25 Warning - - Monitors direct read time
db_direct_reads 25 Warning - - Monitors number of direct reads
db_direct_write_reqs 25 Warning - - Monitors number of direct write requests
db_direct_write_time 25 Warning - - Monitors direct write time
db_direct_writes 25 Warning - - Monitors number of direct writes
db_dynamic_sql_stmts 25 Warning - - Monitors number of rollback SQL statements
db_failed_sql_stmts 25 Warning - - Monitors number of failed SQL statements
db_files_closed 3 Warning - - Monitors number of file-close operations
db_hash_join_overflows 1 Warning - -
Monitors # of times hash join data exceeded the available sort heap space
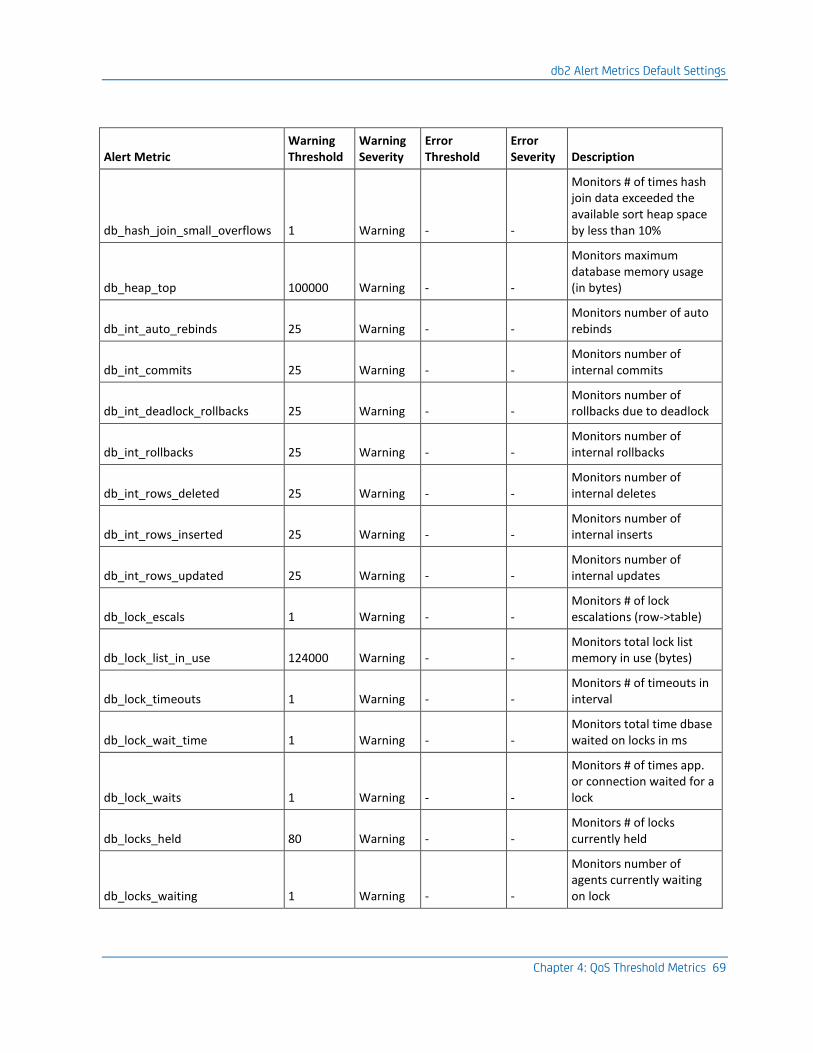
db2 Alert Metrics Default Settings
Chapter 4: QoS Threshold Metrics 69
Alert Metric Warning Threshold
Warning Severity
Error Threshold
Error Severity Description
db_hash_join_small_overflows 1 Warning - -
Monitors # of times hash join data exceeded the available sort heap space by less than 10%
db_heap_top 100000 Warning - -
Monitors maximum database memory usage (in bytes)
db_int_auto_rebinds 25 Warning - - Monitors number of auto rebinds
db_int_commits 25 Warning - - Monitors number of internal commits
db_int_deadlock_rollbacks 25 Warning - - Monitors number of rollbacks due to deadlock
db_int_rollbacks 25 Warning - - Monitors number of internal rollbacks
db_int_rows_deleted 25 Warning - - Monitors number of internal deletes
db_int_rows_inserted 25 Warning - - Monitors number of internal inserts
db_int_rows_updated 25 Warning - - Monitors number of internal updates
db_lock_escals 1 Warning - - Monitors # of lock escalations (row->table)
db_lock_list_in_use 124000 Warning - - Monitors total lock list memory in use (bytes)
db_lock_timeouts 1 Warning - - Monitors # of timeouts in interval
db_lock_wait_time 1 Warning - - Monitors total time dbase waited on locks in ms
db_lock_waits 1 Warning - -
Monitors # of times app. or connection waited for a lock
db_locks_held 80 Warning - - Monitors # of locks currently held
db_locks_waiting 1 Warning - -
Monitors number of agents currently waiting on lock

db2 Alert Metrics Default Settings
70 db2 Guide
Alert Metric Warning Threshold
Warning Severity
Error Threshold
Error Severity Description
db_logs_read 25 Warning - - Monitors number of log pages read
db_log_util_rto 25 Warning - - Monitors database log utilization
db_log_writes 25 Warning - - Monitors number of log pages written
db_num_assoc_agents 5 Warning - -
Monitors current number of agents associated with the database
db_pct_hjs_overflows 10 Warning - - Monitors percentage of hash join small overflows
db_pct_sort_overflows 10 Warning - - Monitors % of sort owerflows in interval
db_pkg_cache_inserts 25 Warning - -
Monitors number of sections inserted into cache
db_pkg_cache_lookups 25 Warning - - Monitors number of package or section lookups
db_pool_async_data_read_reqs 100 Warning - -
Monitors number of asynchronous read requests
db_pool_async_data_reads 100 Warning - -
Monitors number of pages read asynchronously into the buffer pool
db_pool_async_data_writes 100 Warning - -
Monitors number of data pages asynchronously written to disk
db_pool_async_index_reads 3 Warning - -
Monitors number of times index was asynchronously read
db_pool_async_index_writes 100 Warning - -
Monitors number of index pages asynchronously written to disk
db_pool_async_read_time 100 Warning - -
Monitors total elapsed time spent reading by prefetcher

db2 Alert Metrics Default Settings
Chapter 4: QoS Threshold Metrics 71
Alert Metric Warning Threshold
Warning Severity
Error Threshold
Error Severity Description
db_pool_async_write_time 100 Warning - -
Monitors total elapsed time spent asychronously writing
db_pool_avg_async_read_time 15 Warning - -
Monitors average asynchronous read time in ms in interval
db_pool_avg_async_write_time 25 Warning - -
Monitors average asynchronous write time in ms in interval
db_pool_avg_write_time 25 Warning - - Monitors average write time in ms in interval
db_pool_data_from_estore 100 Warning - -
Monitors number of data pages copied from extended sotrage
db_pool_data_l_reads 10 Warning - - Monitors number of logical read requests
db_pool_data_p_reads 10 Warning - - Monitors number of reads, requiring physical I/O
db_pool_data_to_estore 3 Warning - -
Monitors number of data pages copied to extended sotrage
db_pool_data_writes 10 Warning - -
Monitors number of times, data was physicaly written to disk
db_pool_drty_pg_steal_clns 100 Warning - -
Monitors number of times victim page cleaner was triggered
db_pool_drty_pg_thrsh_clns 100 Warning - -
Monitors number of times dirty page threshold reached
db_pool_hit_ratio 75 Warning - -
Monitors percentage of time a page was found in buffer pool
db_pool_index_from_estore 3 Warning - -
Monitors number of index pages copied from extended storage
db_pool_index_l_reads 10 Warning - -
Monitors number of logical read requests for index pages
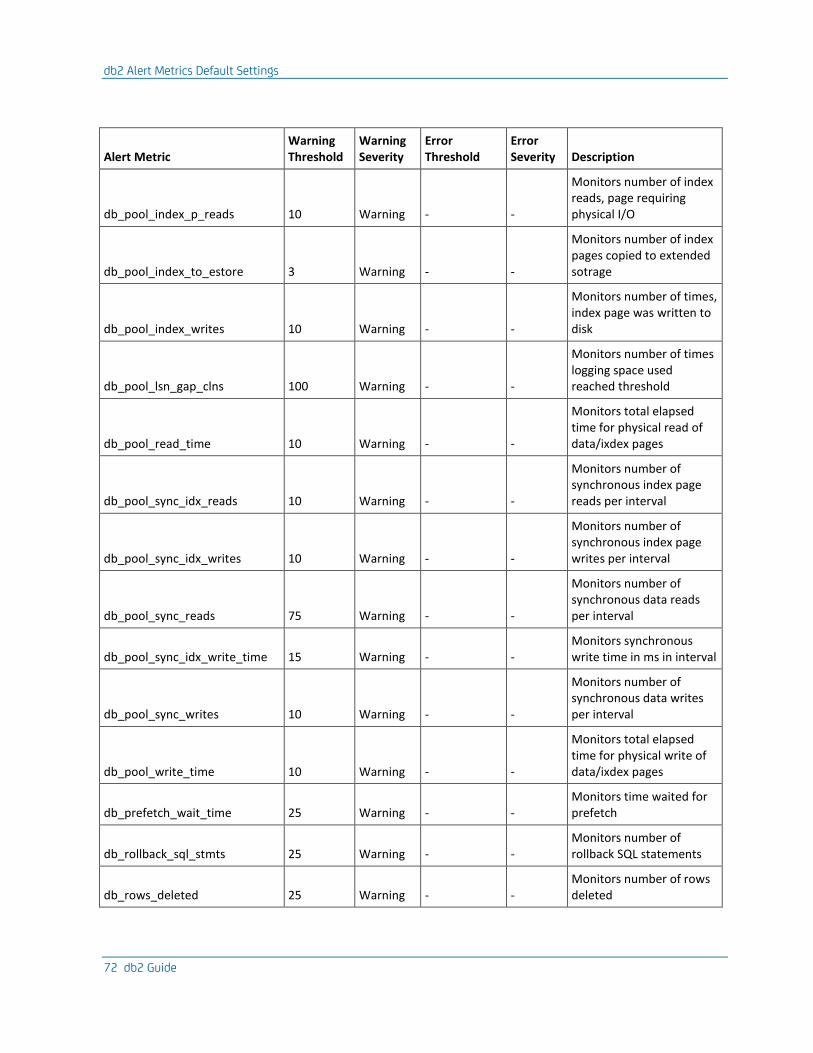
db2 Alert Metrics Default Settings
72 db2 Guide
Alert Metric Warning Threshold
Warning Severity
Error Threshold
Error Severity Description
db_pool_index_p_reads 10 Warning - -
Monitors number of index reads, page requiring physical I/O
db_pool_index_to_estore 3 Warning - -
Monitors number of index pages copied to extended sotrage
db_pool_index_writes 10 Warning - -
Monitors number of times, index page was written to disk
db_pool_lsn_gap_clns 100 Warning - -
Monitors number of times logging space used reached threshold
db_pool_read_time 10 Warning - -
Monitors total elapsed time for physical read of data/ixdex pages
db_pool_sync_idx_reads 10 Warning - -
Monitors number of synchronous index page reads per interval
db_pool_sync_idx_writes 10 Warning - -
Monitors number of synchronous index page writes per interval
db_pool_sync_reads 75 Warning - -
Monitors number of synchronous data reads per interval
db_pool_sync_idx_write_time 15 Warning - - Monitors synchronous write time in ms in interval
db_pool_sync_writes 10 Warning - -
Monitors number of synchronous data writes per interval
db_pool_write_time 10 Warning - -
Monitors total elapsed time for physical write of data/ixdex pages
db_prefetch_wait_time 25 Warning - - Monitors time waited for prefetch
db_rollback_sql_stmts 25 Warning - - Monitors number of rollback SQL statements
db_rows_deleted 25 Warning - - Monitors number of rows deleted
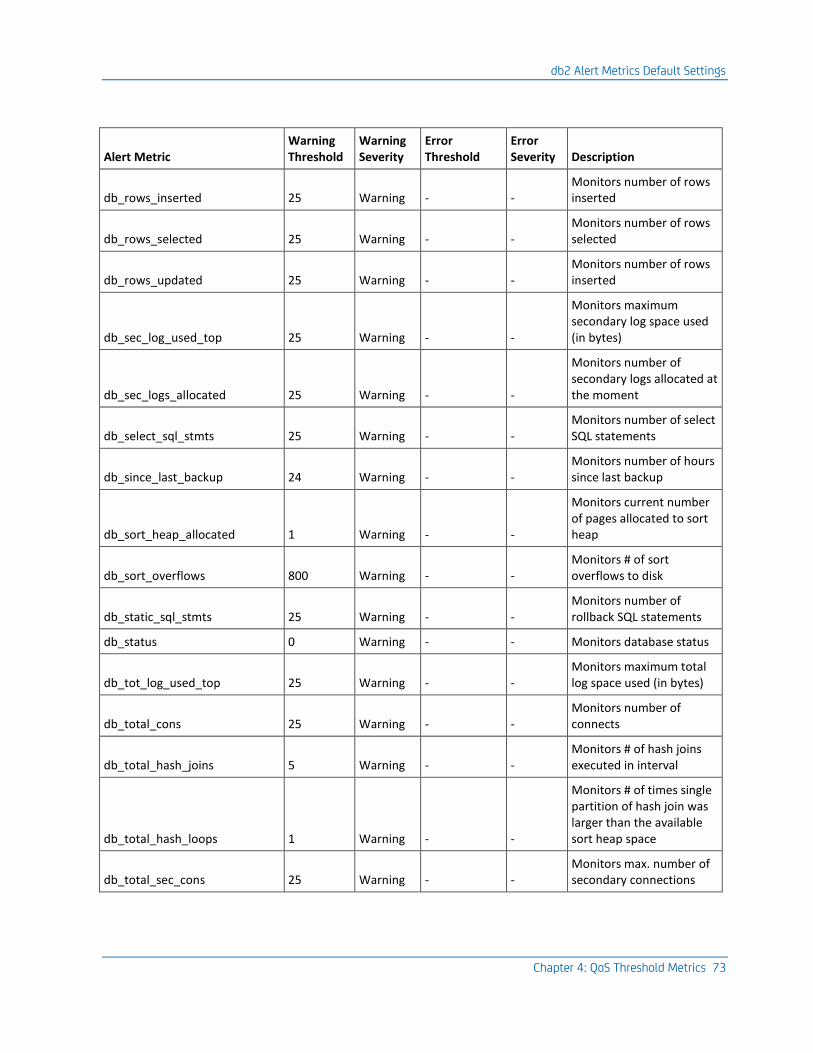
db2 Alert Metrics Default Settings
Chapter 4: QoS Threshold Metrics 73
Alert Metric Warning Threshold
Warning Severity
Error Threshold
Error Severity Description
db_rows_inserted 25 Warning - - Monitors number of rows inserted
db_rows_selected 25 Warning - - Monitors number of rows selected
db_rows_updated 25 Warning - - Monitors number of rows inserted
db_sec_log_used_top 25 Warning - -
Monitors maximum secondary log space used (in bytes)
db_sec_logs_allocated 25 Warning - -
Monitors number of secondary logs allocated at the moment
db_select_sql_stmts 25 Warning - - Monitors number of select SQL statements
db_since_last_backup 24 Warning - - Monitors number of hours since last backup
db_sort_heap_allocated 1 Warning - -
Monitors current number of pages allocated to sort heap
db_sort_overflows 800 Warning - - Monitors # of sort overflows to disk
db_static_sql_stmts 25 Warning - - Monitors number of rollback SQL statements
db_status 0 Warning - - Monitors database status
db_tot_log_used_top 25 Warning - - Monitors maximum total log space used (in bytes)
db_total_cons 25 Warning - - Monitors number of connects
db_total_hash_joins 5 Warning - - Monitors # of hash joins executed in interval
db_total_hash_loops 1 Warning - -
Monitors # of times single partition of hash join was larger than the available sort heap space
db_total_sec_cons 25 Warning - - Monitors max. number of secondary connections

db2 Alert Metrics Default Settings
74 db2 Guide
Alert Metric Warning Threshold
Warning Severity
Error Threshold
Error Severity Description
db_total_sort_time 800 Warning - - Monitors total elapsed time in ms
db_total_sorts 4 Warning - - Monitors # of sorts executed
db_uid_sql_stmts 25 Warning - -
Monitors number of Update, Insert, Delete SQL statements
db_x_lock_escals 1 Warning - - Monitors # of x-lock escalations (row->table)
i_agents_created_empty_pool 5 Warning - -
Monitors number of agents created because the agent pool was empty
i_agents_created_ratio 50 Warning - -
Monitors Agents Created Due to Empty Agent Pool by Agents Assigned From Pool in %
i_agents_from_pool 20 Warning - - Monitors number of agents assigned from pool
i_agents_registered 150 Warning - - Monitors # of agents curr. registered in instance
i_agents_registered_top 150 Warning - -
Monitors max. # of agents ever registered since DB2 start
i_agents_stolen 5 Warning - -
Monitors # of agents stolen from applications in interval
i_agents_waiting_on_token 10 Warning - -
Monitors # of agents waiting for free token in instance
i_agents_waiting_top 10 Warning - -
Monitors max. # of agents ever waiting for token since DB2 start
i_agents_dbalive 1 Warning - - Monitors connectivity to the db2 databases
i_comm_private_memory 1000000 Warning - -
Monitors amount of committed private memory

db2 Alert Metrics Default Settings
Chapter 4: QoS Threshold Metrics 75
Alert Metric Warning Threshold
Warning Severity
Error Threshold
Error Severity Description
i_con_local_dbases 5 Warning - -
Monitors # of local databases having open connections
i_coord_agents_top 5 Warning - -
Monitors max. # of coordinating agents since DB2 start
i_gw_cons_wait_client 5 Warning - -
Monitors # if gateway connections waiting for client reply
i_gw_cons_wait_host 5 Warning - -
Monitors # of gateway connections waiting for host reply
i_gw_cur_cons 5 Warning - - Monitors current number of gateway connections
i_gw_total_cons 5 Warning - -
Monitors number of gateway connection attempts
i_idle_agents 5 Warning - - Monitors number of unassigned agents in pool
i_local_cons 5 Warning - -
Monitors curr. # of local connections to the instance
i_local_cons_in_exec 5 Warning - -
Monitors curr. # of local connections to the instance executing
i_max_agent_overflows 3 Warning - -
Monitors # of times MAXAGENT parameter was reached (for DB2 before v9.5)
i_pct_active_connections 5 Warning - -
Monitors percentage of active connections to total allowed connections
i_piped_sorts_accepted 5 Warning - - Monitors number of piped sort requests accepted
i_piped_sorts_rejected 5 Warning - -
Monitors number of of piped sort requests rejected
i_piped_sorts_requested 5 Warning - - Monitors number of of piped sort requests
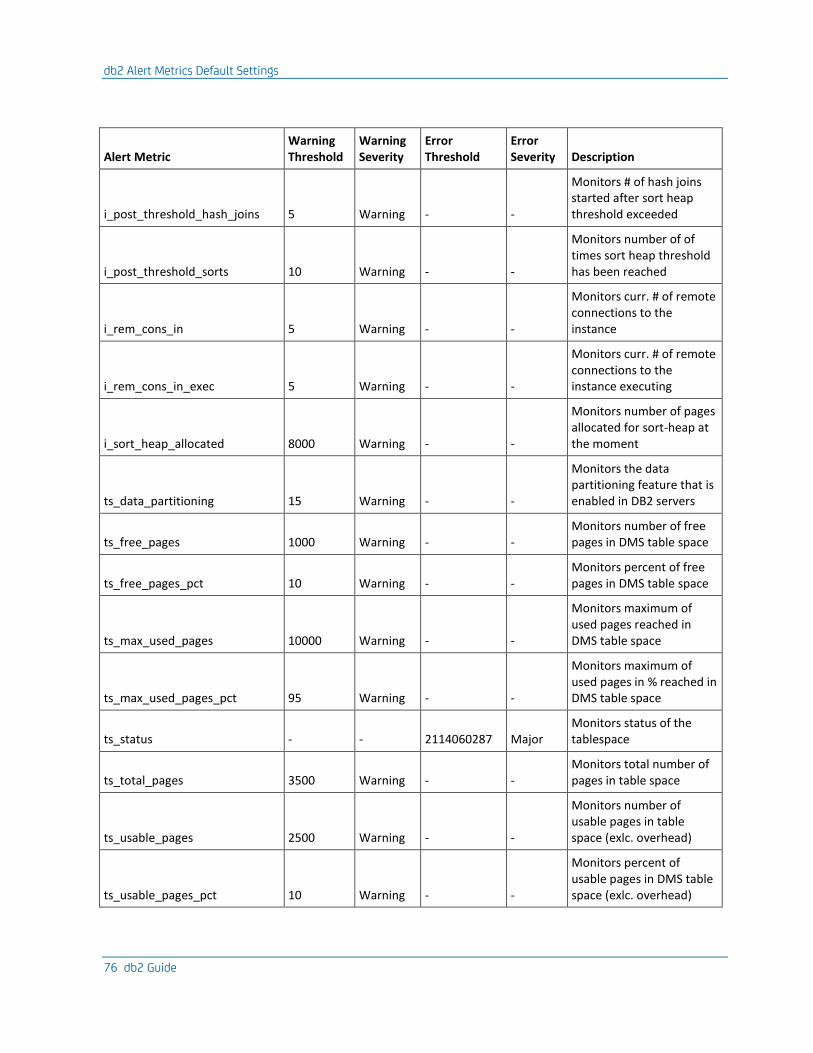
db2 Alert Metrics Default Settings
76 db2 Guide
Alert Metric Warning Threshold
Warning Severity
Error Threshold
Error Severity Description
i_post_threshold_hash_joins 5 Warning - -
Monitors # of hash joins started after sort heap threshold exceeded
i_post_threshold_sorts 10 Warning - -
Monitors number of of times sort heap threshold has been reached
i_rem_cons_in 5 Warning - -
Monitors curr. # of remote connections to the instance
i_rem_cons_in_exec 5 Warning - -
Monitors curr. # of remote connections to the instance executing
i_sort_heap_allocated 8000 Warning - -
Monitors number of pages allocated for sort-heap at the moment
ts_data_partitioning 15 Warning - -
Monitors the data partitioning feature that is enabled in DB2 servers
ts_free_pages 1000 Warning - - Monitors number of free pages in DMS table space
ts_free_pages_pct 10 Warning - - Monitors percent of free pages in DMS table space
ts_max_used_pages 10000 Warning - -
Monitors maximum of used pages reached in DMS table space
ts_max_used_pages_pct 95 Warning - -
Monitors maximum of used pages in % reached in DMS table space
ts_status - - 2114060287 Major Monitors status of the tablespace
ts_total_pages 3500 Warning - - Monitors total number of pages in table space
ts_usable_pages 2500 Warning - -
Monitors number of usable pages in table space (exlc. overhead)
ts_usable_pages_pct 10 Warning - -
Monitors percent of usable pages in DMS table space (exlc. overhead)

db2 Alert Metrics Default Settings
Chapter 4: QoS Threshold Metrics 77
Alert Metric Warning Threshold
Warning Severity
Error Threshold
Error Severity Description
ts_used_pages 2500 Warning - - Monitors number of used pages in table space
ts_used_pages_pct 85 Warning - - Monitors percent of used pages in table space


