58
websphere Guide v1.6 series Nimsoft® Monitor™

websphere Guide v1.6 series
Nimsoft® Monitor™
Legal Notices Copyright © 2014, CA. All rights reserved.
Warranty
The material contained in this document is provided "as is," and is subject to being changed, without notice, in future editions. Further, to the maximum extent permitted by applicable law, Nimsoft LLC disclaims all warranties, either express or implied, with regard to this manual and any information contained herein, including but not limited to the implied warranties of merchantability and fitness for a particular purpose. Nimsoft LLC shall not be liable for errors or for incidental or consequential damages in connection with the furnishing, use, or performance of this document or of any information contained herein. Should Nimsoft LLC and the user have a separate written agreement with warranty terms covering the material in this document that conflict with these terms, the warranty terms in the separate agreement shall control.
Technology Licenses
The hardware and/or software described in this document are furnished under a license and may be used or copied only in accordance with the terms of such license.
No part of this manual may be reproduced in any form or by any means (including electronic storage and retrieval or translation into a foreign language) without prior agreement and written consent from Nimsoft LLC as governed by United States and international copyright laws.
Restricted Rights Legend
If software is for use in the performance of a U.S. Government prime contract or subcontract, Software is delivered and licensed as "Commercial computer software" as defined in DFAR 252.2277014 (June 1995), or as a "commercial item" as defined in FAR 2.101(a) or as "Restricted computer software" as defined in FAR 52.22719 (June 1987) or any equivalent agency regulation or contract clause. Use, duplication or disclosure of Software is subject to Nimsoft LLC’s standard commercial license terms, and nonDOD Departments and Agencies of the U.S. Government will receive no greater than Restricted Rights as defined in FAR 52.22719(c)(12) (June 1987). U.S. Government users will receive no greater than Limited Rights as defined in FAR 52.22714 (June 1987) or DFAR 252.2277015 (b)(2) (November 1995), as applicable in any technical data.
Trademarks
Nimsoft is a trademark of CA.
Adobe®, Acrobat®, Acrobat Reader®, and Acrobat Exchange® are registered trademarks of Adobe Systems Incorporated.
Intel® and Pentium® are U.S. registered trademarks of Intel Corporation.
Java(TM) is a U.S. trademark of Sun Microsystems, Inc.
Microsoft® and Windows® are U.S. registered trademarks of Microsoft Corporation.
Netscape(TM) is a U.S. trademark of Netscape Communications Corporation.
Oracle® is a U.S. registered trademark of Oracle Corporation, Redwood City, California.
UNIX® is a registered trademark of the Open Group.
ITIL® is a Registered Trade Mark of the Office of Government Commerce in the United Kingdom and other countries.
All other trademarks, trade names, service marks and logos referenced herein belong to their respective companies.
For information on licensed and public domain software, see the Nimsoft Monitor ThirdParty Licenses and Terms of Use document at: http://docs.nimsoft.com/prodhelp/en_US/Library/index.htm?toc.htm?1981724.html.

Contact CA
Contact CA Support
For your convenience, CA Technologies provides one site where you can access the information that you need for your Home Office, Small Business, and Enterprise CA Technologies products. At http://ca.com/support, you can access the following resources:
■ Online and telephone contact information for technical assistance and customer services
■ Information about user communities and forums
■ Product and documentation downloads
■ CA Support policies and guidelines
■ Other helpful resources appropriate for your product
Providing Feedback About Product Documentation
Send comments or questions about CA Technologies Nimsoft product documentation to [email protected].
To provide feedback about general CA Technologies product documentation, complete our short customer survey which is available on the CA Support website at http://ca.com/docs.


Contents 5
Contents
Chapter 1: websphere 1.6 7
websphere Overview ................................................................................................................................................... 7
Chapter 2: websphere Probe Deployment 9
Prerequisites .............................................................................................................................................................. 10
JVM...................................................................................................................................................................... 11
On UNIX ............................................................................................................................................................... 11
On Windows ........................................................................................................................................................ 13
PMI ...................................................................................................................................................................... 14
WAS Versions ...................................................................................................................................................... 15
Supported Platforms .................................................................................................................................................. 15
System Requirements ................................................................................................................................................ 15
Software Requirements ............................................................................................................................................. 15
Monitoring System Requirements ............................................................................................................................. 16
Probe Deployment Information ................................................................................................................................. 16
The Websphere Installation Wizard ........................................................................................................................... 17
Installation on AIX ...................................................................................................................................................... 20
Chapter 3: websphere Configuration 25
Probe Defaults ............................................................................................................................................................ 25
Probe Configuration Interface Installation ................................................................................................................. 26
Probe GUI ................................................................................................................................................................... 26
The Left Pane ...................................................................................................................................................... 27
The Right Pane .................................................................................................................................................... 29
The Toolbar Buttons ............................................................................................................................................ 32
Probe Configuration ................................................................................................................................................... 38
Create a Resource ............................................................................................................................................... 39
Edit the Properties for a Resource ...................................................................................................................... 44
Create a Profile.................................................................................................................................................... 46
Auto Configurations ............................................................................................................................................ 47
Auto Monitors ..................................................................................................................................................... 48
Add Monitors to be Measured ............................................................................................................................ 49
Edit the Monitor Properties ................................................................................................................................ 51
Enable the Monitors for QoS and Alarming ........................................................................................................ 53
Templates ............................................................................................................................................................ 54
Error Codes.......................................................................................................................................................... 55

6 websphere Guide
Chapter 4: QoS Threshold Metrics 57
websphere QoS Metrics ............................................................................................................................................. 57
websphere Alert Metrics Default Settings ................................................................................................................. 57

Chapter 1: websphere 1.6 7
Chapter 1: websphere 1.6
This description applies to websphere probe version 1.6.
This section contains the following topics:
websphere Overview (see page 7) Documentation Changes (see page 8)
websphere Overview
The Nimsoft WebSphere monitoring probe handles all the common monitoring and data collection tasks on IBM WebSphere Application Servers. The probe collects and stores data and information from the monitored system at customizable intervals. You can define alarms to be raised and propagated to the NMS Enterprise Console when the specified thresholds are breached.
Business based on Web depends on a high degree of quality and availability. It is therefore of high importance that the security, availability and performance of the WebSphere Application Servers (WAS) is as high as possible. This is done by monitoring and managing the servers, components and services to ensure optimal performance

websphere Overview
8 websphere Guide
Documentation Changes
This table describes the version history for this document.
Version Date What's New?
1.6 November 2012 ■ Added Probe Defaults (Template based).
■ Added support for WAS version 8.0 and 8.5
■ Added features for Auto Configurations, Auto Monitors and Templates
■ Added monitoring capability for application up/down status
■ Added support for AIX
■ Added Memory Threshold tab in General Setup dialog
■ Added Low threshold for monitors in GUI
1.5 December 2010 ■ Added support for automatic scanning of newly added servers.
■ Fixed the issues related to Scanning.
■ Changed the probe startup mechanism to start up java.
■ Changed the Cfg structure. Monitors are now part of the profile section.
Related Documentation
Documentation for other versions of the websphere probe (../../websphere.html)
The Release Notes for the websphere probe
Monitor Metrics Reference Information for CA Nimsoft Probes (http://docs.nimsoft.com/prodhelp/en_US/Probes/ProbeReference/index.htm)
Chapter 2: websphere Probe Deployment 9
Chapter 2: websphere Probe Deployment
This section contains the prerequisites, system requirements and deployment information for the websphere probe
This section contains the following topics:
Prerequisites (see page 10) Supported Platforms (see page 15) System Requirements (see page 15) Software Requirements (see page 15) Monitoring System Requirements (see page 16) Probe Deployment Information (see page 16) The Websphere Installation Wizard (see page 17) Installation on AIX (see page 20)

Prerequisites
10 websphere Guide
Prerequisites
The websphere probe can be installed on either a server running WebSphere or on a remote computer.
■ If installed on a server running WebSphere, all environment files needed by the probe are present on the server.
■ If installed on a remote computer, the environment files needed by the probe must be copied to this computer.
Note: WAS files/App server directory should be present on the machine where the probe is deployed for all WAS version.
For WebSphere Ver 5 and 6.0, copy the following folders from the WebSphere directory of the WebSphere server.
■ etc
■ libs
For WebSphere Ver 6.1, 7.0, 8.0 and 8.5 copy the following folders from the WebSphere directory of the WebSphere server:
■ runtimes
■ plugins
Note: If the probe is installed on a remote computer running an OS different from the server running the WebSphere software (For example, if the remote computer runs Windows and the server running WebSphere is a Solaris computer), you can copy the etc and lib folders as described above.
If the websphere probe is running on Windows OS, the AppServer directory for Windows should be used. Similarly, if the probe is running on Linux or Solaris, the AppServer directory from the respective environment should be used.

Prerequisites
Chapter 2: websphere Probe Deployment 11
JVM
A Java Virtual Machine (JVM) of version 1.6 or higher from IBM must be installed on the computer running the WebSphere probe and the PATH has to contain the java executable. You can also copy the Java folder from the WebSphere directory of the Windows WebSphere server to the remote Windows computer in which probe needs to be installed.
Ensure that a version of java.exe exists in the path as described below. This is a prerequisite for dropping the probe. The version of java.exe is at this point not critical. Later (when the installation wizard is launched on double-clicking the probe) you will be asked to select the java.exe.
Note: JVM version 1.6 and above is available along with WAS 7.0 and above and you can use the same path for java_home.
On UNIX
Follow these steps:
1. Set the JAVA_HOME environment variable to the directory in which IBM JVM is installed and export JAVA_HOME. For example,
export JAVA_HOME=/usr/lib/jvm/ibm-java2-i386-50/jre/bin
2. Make sure that the PATH variable includes $JAVA_HOME. For example,
export PATH=$JAVA_HOME:$PATH
3. Open a shell as user root and use the command java –version. The output should show the IBM java version installed.
Prerequisites
12 websphere Guide
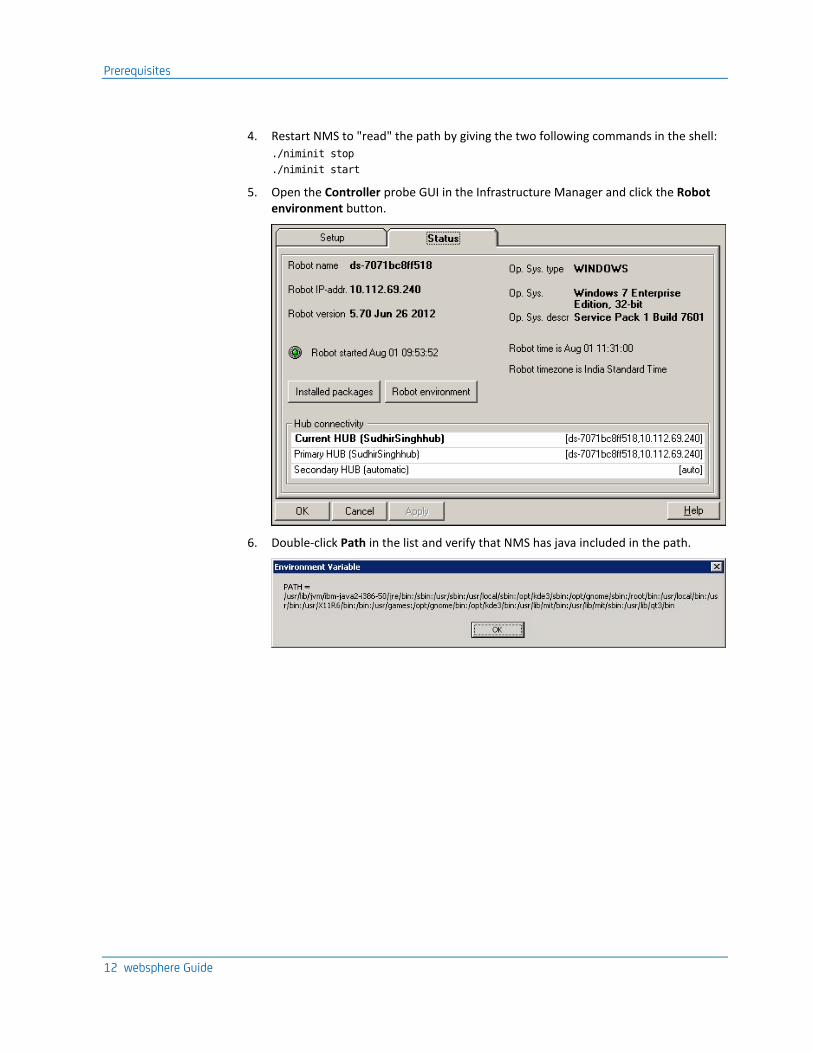
4. Restart NMS to "read" the path by giving the two following commands in the shell:
./niminit stop
./niminit start
5. Open the Controller probe GUI in the Infrastructure Manager and click the Robot environment button.
6. Double-click Path in the list and verify that NMS has java included in the path.

Prerequisites
Chapter 2: websphere Probe Deployment 13
On Windows
Follow these steps:
1. To set the Java path, right-click My Computer and select Properties.
2. In the Advanced tab, click Environment variables.
3. Alter the Path variable so that it also contains the path to the IBM Java executable.
4. Open a DOS window and use the command java –version.
The output should show that IBM java version is installed.
5. Open the Service Controller by selecting Programs > Nimsoft Monitoring > Infrastructure Service Controller.

Prerequisites
14 websphere Guide
6. Click first Stop and then Start to enable NMS to include java in the path.
7. Open the Controller probe GUI in the Infrastructure Manager and click the Robot Environment button.
8. Double-click Path in the list popping up and verify that NMS has java included in the path.
PMI
Performance Monitoring Infrastructure (PMI) needs to be enabled on the WebSphere Application Server in order for the probe to gather performance data.
Read more about PMI in the following link:
http://publib.boulder.ibm.com/infocenter/wasinfo/v6r0/index.jsp?topic=/com.ibm.websphere.express.doc/info/exp/ae/cprf_pmidata.html http://publib.boulder.ibm.com/infocenter/wasinfo/v6r0/index.jsp?topic=/com.ibm.websphere.express.doc/info/exp/ae/cprf_pmidata.html

Supported Platforms
Chapter 2: websphere Probe Deployment 15
WAS Versions
Some versions of the WebSphere Application Server (WAS) contain an internal error that prevents external PMI clients, like the websphere probe, to obtain correct PMI values from the server.
■ For both WAS 5 and 6, the error is corrected in fix number PK20342.
■ For WAS 5, the error is fixed in version 5.1.1.10.
■ For WAS 6, the error is fixed in version 6.0.2.9, older versions like 6.0.2.5 and 6.0.2.7 contains the error.
When installing the probe, a wizard will assist you through the initial probe configuration.
Supported Platforms
The New Probe probe is supported on the same set of operating systems and databases as the Nimsoft Monitor Server solution. Please refer to the:
■ Nimsoft Compatibility Support Matrix for the latest information on supported platforms.
■ Support Matrix for Nimsoft Probes for additional information on the New Probe probe.
System Requirements
The websphere probe should be installed on systems with the following minimum resources:
■ Memory: 2-4 GB of RAM. This probe OOTB configuration requires 256 MB of RAM.
■ CPU: 3 GHz dual-core processor, 32-bit or 64-bit.
Software Requirements
The websphere probe requires the following software environment:
■ Nimsoft Monitor Server 5.1.1 or later
■ Nimsoft Robot 5.23 or later
■ Java Virtual Machine 1.6 or later from IBM (typically installed with NMS 5.0 and above)
Note: For SOC functionality, NM Server 5.6 or later and UMP 2.5.2 or later is required.
Monitoring System Requirements
16 websphere Guide
Monitoring System Requirements
The webshpere probe monitors the WebSphere Application Server version 5.1 to 8.5.
Probe Deployment Information
There are three ways to distribute archive packages. You can distribute the package within the web-based Admin Console (for supported probes), from within Infrastructure Manager, or use the standalone Nimsoft Distribution application.See Probe Deployment for more information on deploying probes.

The Websphere Installation Wizard
Chapter 2: websphere Probe Deployment 17
The Websphere Installation Wizard
Follow these steps:
1. Double-click the line representing the probe in the Infrastructure Manager after the probe has been distributed.
The installation wizard will be launched automatically and the Welcome picture appears on your screen
Note: The installation wizard is launched only when you double-click the line representing the probe in the Infrastructure Manager for the first time.
2. Read the instructions given carefully.
3. Select your WebSphere version and click the Next button.
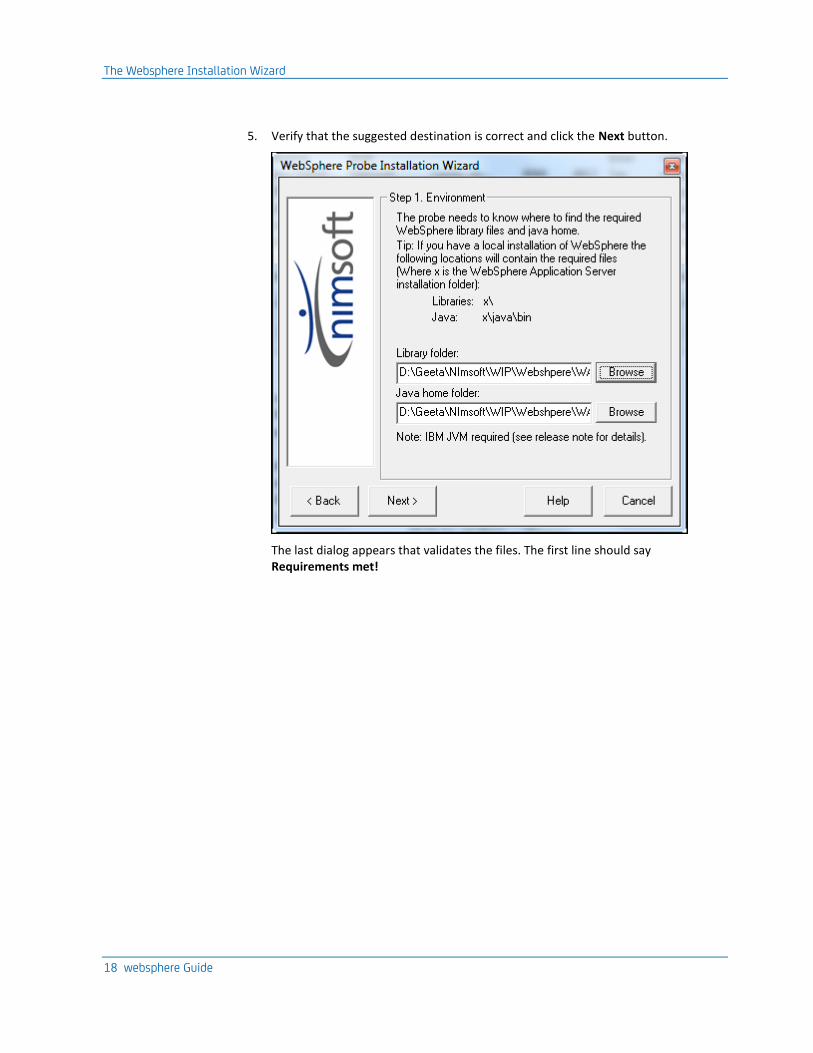
4. Browse to the folders containing the required WebSphere libraries and java home.
Note: If first browsing for the Library folder, the setup will suggest the destination of the Java home folder for you.
The Websphere Installation Wizard
18 websphere Guide
5. Verify that the suggested destination is correct and click the Next button.
The last dialog appears that validates the files. The first line should say Requirements met!

The Websphere Installation Wizard
Chapter 2: websphere Probe Deployment 19
6. Click the Next button to finish the wizard.
Note: If something goes wrong, the output listed in the window will have a red color and the first line will state that the requirement was NOT met. In that case, you must click the Back button, check that you have the correct environment files and try again.
You will be asked to restart the probe to initialize the probe.
7. Click the Yes button to restart the probe.

Installation on AIX
20 websphere Guide
Installation on AIX
Follow these steps:
1. Distribute the package on AIX machine and open Configuration Window of Websphere.
2. Select the required version of Websphere you want to monitor.
The Welcome page appears.

Installation on AIX
Chapter 2: websphere Probe Deployment 21
3. Browse to the path of Websphere Installation Directory for “….\IBM\WebSphere\AppServer”.
Note: If the Websphere server is installed locally then the default path of Java home folder can be used and you need not to change it. However, if you have copied the “AppServer” folder from any other environment then you need to change the path of Java home folder.

Installation on AIX
22 websphere Guide
4. In that case, select the Java home folder of AIX machine (Java Version 6.x).
Note: If you are not able to locate Java there, then you need to install it by downloading from the IBM website.

Installation on AIX
Chapter 2: websphere Probe Deployment 23
5. Click Next.
The Finish page appears.
6. Click Finish.
The probe will be restarted and is ready to make connection.

Chapter 3: websphere Configuration 25
Chapter 3: websphere Configuration
The websphere monitoring probe has the capability of handling all common monitoring and data collection tasks.
The probe collects and stores data and information from the monitored system at customizable intervals. You can easily define alarms to be raised and propagated to the Enterprise Console when the specified thresholds are breached.
The following WebSphere Server entities may be monitored:
■ The Java Virtual machine (JVM)
■ Execution queues and threads
■ Enterprise Java Beans (EJB)
■ Servlets and Java Server Pages (JSP)
■ Java Transaction API (JTA)
■ Java Database Connection Pools. (JDBC)
■ Java Messaging Services (JMS)
■ Java Connector Architecture (JCA)
■ Application Up/Down Status
This section contains the following topics:
Probe Defaults (see page 25) Probe Configuration Interface Installation (see page 26) Probe GUI (see page 26) Probe Configuration (see page 38)
Probe Defaults
At the time of deploying a probe for the first time on robot, some default configuration will be deployed. For this you have to drag and drop the test template to the profile. These probe defaults could be Alarms, QoS, Profiles and so on, which save time to configure the default settings. These probe defaults will be seen on a fresh install, that is no instance of that probe is already available on that robot in activated or deactivated state.

Probe Configuration Interface Installation
26 websphere Guide
Probe Configuration Interface Installation
The probe configuration interface is automatically downloaded and installed by the Nimsoft Infrastructure Manager when the probe is deployed on a robot.
Probe GUI
Double-click the line representing the probe in the Infrastructure Manager to bring up the GUI. The GUI consists of a row of tool buttons and two window panes. The GUI will initially appear containing an empty group called Default Group and a QoS node containing five QoS definitions.
Probe GUI
Chapter 3: websphere Configuration 27
The probe does not monitor anything yet! First you have to define what to monitor:
1. Start by creating a resource. This is described in section Create a Resource (see page 39).
A resource is the computer in the cluster running the Network Node software.
2. Create one or more profiles.
A profile is a cluster member.
Note: One profile will automatically be created under the resource created in the previous step.
To add more profiles, follow the steps as described in section Create a Profile (see page 46).
3. Add monitors to be measured.
This is described in section Add Monitors to be Measured (see page 49).
Note: You must click the Apply button to activate any configuration modifications done.
The Left Pane
The left pane shows the monitoring groups defined, the QoS definitions and the templates. During the initial probe configuration wizard, the Default group (with an underlying resource and one or more profiles), the standard QoS definitions and the Templates node are created and will appear in the pane.
Groups
Using groups makes the management easier when monitoring large configurations. You can create new groups by right-clicking a group and selecting the New Group option (or by clicking the Create A New Group tool button).
■ Resources
A group contains one or more resources. A resource is a WebSphere instance being monitored identified with its host name or IP address. You can create new resources by right-clicking a group and selecting the New Resource option (or by clicking the Create A New Resource tool button).
■ Auto Configurations
The Auto Configurations node allows you to add and configure a checkpoint for all monitoring instances. To add a monitor (checkpoint) to the Auto Configurations node, drag the monitor to the node.
■ Auto Monitors
The Auto Monitors node contains the list of all the monitors (checkpoints) in the monitoring instances where the monitors added to the Auto Configurations appear.

Probe GUI
28 websphere Guide
■ Profiles
One or more profiles can be defined for each resource. You can create new profiles by right-clicking a resource and selecting the New Profile option (or by clicking the Create A New Profile tool button).
A profile is initially "empty" (contains no monitors). To add monitors, follow the steps as described in section Add Monitors to be Measured (see page 49).
QoS
This node contains the standard QoS definitions included with the probe package. These can be selected when editing the monitoring properties for a monitor. To define your own QoS definitions, you can right-click the QoS node and select the New option.
Right-clicking in the pane opens a pop-up menu with the following options:
■ New Resource
Opens the wizard enabling you to define a new resource to be monitored. This option is available only when a group, resource, or profile is selected.
■ New Profile
Opens the Profile dialog enabling you to define a new profile to be monitored. This option is available only when a resource or profile is selected.
■ New Group
Creates a new group where you may place resources (with their underlying profiles and monitors) to be monitored. The new group will appear in the pane with the name New Group. This option is available only when a group, resource, or profile is selected.
Right-click the new group and select Rename to give the group a name of your own choice.
To move a resource from one group to another, right-click the resource and select Edit to open the resource’s properties dialog, where you may select the group you want the resource to belong to (refer the section Create a Resource (see page 39)).
■ Edit
Lets you edit the properties for the selected element, depending what you have selected (resource, profile, or QoS definition). This option is available only when a resource or profile is selected.
■ Delete
Lets you delete the selected element (group, resource, profile, or QoS definition).
Note: that the Default group cannot be deleted, but if you remove all elements from the group, it will not appear the next time you restart the probe.
■ Rename
Lets you rename the selected element (group, resource, or profile).
Probe GUI
Chapter 3: websphere Configuration 29
Templates
This node contains the section for creating new templates to store your desired list of monitors which can be applied to any resource or profile. To create a new template, you can right-click the Templates node and select the New Template option.
The Right Pane
The contents of the right pane depend on what you select in the left pane:
■ QoS definitions when the QoS node is selected in the left-pane.
■ Resources when a group is selected in the left-pane.
■ Profiles when a resource is selected in the left-pane.
■ Monitors when a profile is selected in the left-pane.
■ Monitors that are added in Auto Configurations when Auto Configurations node is selected in the left-pane.
■ Monitors that are activated in Auto Configurations will be visible for all profiles when Auto Monitors node is selected in the left-pane.
■ List of templates when the Templates node is selected in the left-pane.
■ Monitors which are added in the specific template when that template is selected in the left-pane.
Right-clicking in the pane gives you the following possibilities:
■ When the QoS definitions are listed in the pane:
Right-clicking the list opens a small menu, giving you the possibility to add or delete a QoS definition.
■ When the resources are listed in the pane:
Right-clicking in the list opens a small menu with the following options:
New
Opens the wizard allowing you to define a new resource. Refer section Create a Resource (see page 39).
Edit
Opens the Resource dialog for the selected resource allowing you to modify the properties. Refer section Edit the Properties for a Resource (see page 44).
Delete
Deletes the selected resource.
Activate
Activates the selected resource.

Probe GUI
30 websphere Guide
Deactivate
Deactivates the selected resource.
■ When Auto Configurations are listed in the pane:
Right-clicking in the list opens a small menu with the following options:
Edit
Opens the dialog allowing you to edit the monitor properties for the monitor which is added to Auto Configurations.
Delete
Deletes the selected monitor from Auto Configurations.
■ When Auto Monitors are listed in the pane:
Right-clicking in the list opens a small menu with the following options:
Edit
Opens the dialog asking you to convert the monitor to a static monitor allowing you to edit the monitor properties for the monitor which is activated from Auto Configurations. If you convert the monitor to static, it will no longer be auto monitored
Delete
Appears in the disabled mode as you cannot delete Auto Monitors.
Monitor
Opens the monitor window and starts filling a graph with the values measured of the selected monitor.

Probe GUI
Chapter 3: websphere Configuration 31
Add to Template
Opens the Select Template dialog to add a monitor to the template. After selecting the desired template, two options appear for adding monitors to the template.
■ When the profiles are listed in the pane:
Right-clicking in the list opens a small menu with the following options:
New
Opens the Profile dialog allowing you to define a new resource. Refer section Create a Profile (see page 46).
Edit
Opens the Profile dialog for the selected resource allowing you to modify the properties. Refer section Create a Profile (see page 46).
Delete
Deletes the selected profile.
Activate
Activates the selected profile.
Deactivate
Deactivates the selected profile.
■ When the monitors are listed in the pane:
Right-clicking in the list opens a small menu with the following options:
Edit
Opens the Monitor Properties dialog for the selected monitor allowing you to modify the properties.
Delete
Deletes the selected monitor.
Refresh
Refreshes the window to display the most current measured values for the monitors.
Browse
Selects Browse to maneuver to the folder the monitor belongs to in the WebSphere Browser.
Monitor
Opens the monitor window and starts filling a graph with the values measured of the selected monitor.

Probe GUI
32 websphere Guide
Add to Template
Opens the Select Template dialog to add a monitor to the template. After selecting the desired template, two options appear for adding monitors to the template.
■ When the templates are listed in the pane:
Right-clicking in the list opens a small menu with the following options:
New
Opens the Template Properties dialog allowing you to add a new template.
Edit
Opens the Template Properties dialog allowing you to edit the template properties.
Delete
Deletes the selected template.
The Toolbar Buttons
The configuration tool contains a row of toolbar buttons:
■ General Setup
■ Create A New Group
■ Create A New Resource
■ Create A New Profile
■ Message Pool Manager
■ Rescan for host
■ Create New Template
General Setup

Probe GUI
Chapter 3: websphere Configuration 33
Clicking the General Setup button opens the General Setup dialog.
This dialog contains the following tabs:
General
Log-level
Sets the level of details written to the log file. Log as little as possible during normal operation to minimize disk consumption.
Environment
Reflects the folder containing the local WebSphere installation as defined during the probe installation wizard.
Advanced
Specifies the valid password if the Client security files located in the Security folder specified in the probe installation wizard are password protected.
Memory Threshold
Provides options for High threshold and Low threshold. Low threshold will generate a warning alarm for JVM memory used by probe, if the Low threshold value is exceeded. The High threshold will generate an alarm and restart the probe. This is a very rare condition.

Probe GUI
34 websphere Guide
Create a New Group
You may create a new group using this functionality.
Follow these steps:
1. Click the Create A New Group button in the toolbar.
The new group will appear in the pane with the name New Group.
2. Right-click the new group and select Rename to give the group a name of your own choice.
Create a New Resource
You may create a new resource using this functionality
Follow these steps:
1. Select the group it should belong to and click the Create A New Resource button in the toolbar.
A wizard will be launched, guiding you through the process of creating a resource.
2. Refer Create a Resource (see page 39) for details.

Probe GUI
Chapter 3: websphere Configuration 35
Create a New Profile
You may create a new profile using this functionality.
Follow these steps:
1. Select the resource it should belong to and click the Create a New Profile button in the toolbar.
2. Refer section Create a Profile (see page 46) for details.
Launch the Message Pool Manager
You can open the Message Pool dialog by clicking the Message Pool Manager button in the toolbar.

Probe GUI
36 websphere Guide
The alarm messages for each alarm situation are stored in the Message Pool. Using the Message Pool Manager, you can customize the alarm text and you can also create your own messages.
Note that variable expansion in the message text is supported. If you type a ‘$’ in the Error Alarm Text field, a dialog pops up offering the following set of variables:
Resource
Refers to the resource in the alarm message.
Host
Indicates the host computer where the alarm condition occurs.
Port
Defines the communication port on the host.
Profile
Defines the name of the profile being monitored.
Node
Defines the name of the node in the cluster.
Server
Defines the name of the server in the cluster.
Monitor
Specifies the monitor (checkpoint) referred to in the alarm message.

Probe GUI
Chapter 3: websphere Configuration 37
Desc
Provides the description of the monitor.
Key
Defines the monitor key (normally the same as the name of the monitor).
Value
Defines the value used in the alarm message.
Oper
Specifies the operand to be combined with the value and the threshold in the alarm message.
Thr
Defines the alarm threshold defined.
Unit
Specifies the unit to be combined with the value in the alarm message (for example Boolean).
Rescan the Profiles
The websphere probe automatically scans the profiles in the host server after a pre-configured interval (15 minutes) and loads any profiles available in the host server under the respective Resources nodes in the probe GUI.
If you wish to manually scan the profiles, click the Rescan for host button from the toolbar.
A message appears informing the scan in progress.

Probe Configuration
38 websphere Guide
If any of the profiles available in the host servers has not been added to websphere probe, the profile is added to the probe GUI.
If all the profiles currently available in the host server are already loaded under the respective resources in the websphere probe, the following message appears:
Create New Template
Templates are useful tools for defining monitors to be measured on the various elements of a system.
You can create templates using the Create New Template button in the toolbar and define a set of monitors belonging to that template.
These templates can be applied to a resource or profile by dragging and dropping the template on the node in the tree where you want to measure the monitors defined for the template. You may also drop a template on a resource in the tree structure using the Auto Configurations feature and the template will be applied to all elements for the profile.
Probe Configuration
This section describes the configuration concepts and procedures for setting up the websphere probe.

Probe Configuration
Chapter 3: websphere Configuration 39
Create a Resource
You may create a new resource by selecting the group it should belong to and clicking the Create A New Resource icon in the tool bar. A configuration wizard will be launched to create the new resource.
Follow these steps:
1. The first dialog contains only information. Read the instructions in the dialog and click Next.

Probe Configuration
40 websphere Guide
2. Specify the Hostname or IP address of the WebSphere server (later also called Resource) to monitor and the SOAP Port, which by default is 8880 for standalone WebSphere Servers, but may also be 8879 for WebSphere Application Server Network Deployment (clustered environments).
3. Click Next to continue.

Probe Configuration
Chapter 3: websphere Configuration 41
4. Specify Username and Password with administrative privileges to the WebSphere server.
5. Select Use SSL if you want to use SSL (default turned on and recommended in production environments).
6. Click Next to continue.

Probe Configuration
42 websphere Guide
The probe now lists the node/server combinations found on the host.
7. Check Select all to select all or select the one(s) you want to monitor from the list.
Note: It is recommended to create separate resources for each cluster node to achieve a well arranged monitoring environment.
8. Click Finish to complete the wizard.
Probe Configuration
Chapter 3: websphere Configuration 43
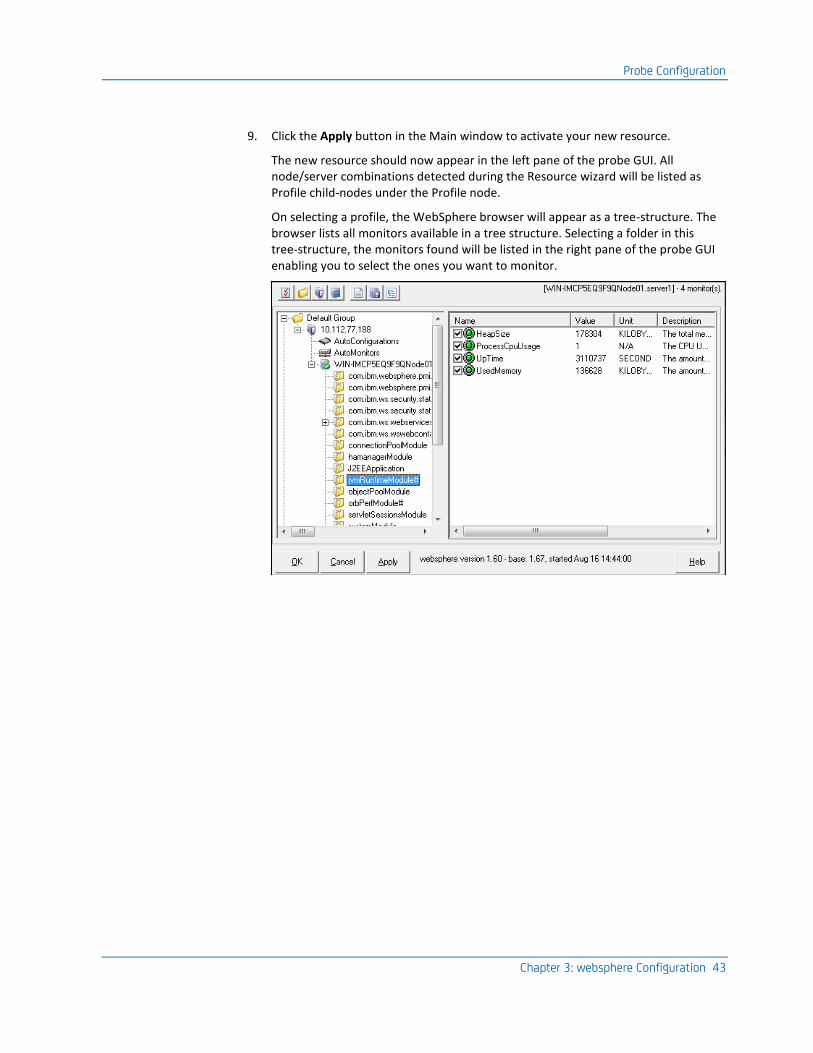
9. Click the Apply button in the Main window to activate your new resource.
The new resource should now appear in the left pane of the probe GUI. All node/server combinations detected during the Resource wizard will be listed as Profile child-nodes under the Profile node.
On selecting a profile, the WebSphere browser will appear as a tree-structure. The browser lists all monitors available in a tree structure. Selecting a folder in this tree-structure, the monitors found will be listed in the right pane of the probe GUI enabling you to select the ones you want to monitor.

Probe Configuration
44 websphere Guide
Edit the Properties for a Resource
You can edit the properties for a resource by right-clicking a resource and selecting Edit. This brings up the Resource dialog.
This dialog contains the following fields:
Hostname or IP address
Defines the hostname or IP address to the WebSphere server to monitor.
Port
Defines the SOAP Connector port for administration. Default is 8880, but it may also be 8879 in clustered environments.
Active
Activates or deactivates monitoring of the resource.
Group
Selects the group to which the resource should belong.
Check interval
Defines how often the probe checks the values of the monitors on the resource.

Probe Configuration
Chapter 3: websphere Configuration 45
Alarm Message
Select the alarm message to be sent if the resource does not respond.
Note: You can edit the message or define your own ones using the Message Pool Manager.
Host information
User name and Password
Defines the login user name and password for the probe to log on the resource, if necessary.
Activate statistic set automatically on PMI
Sets the PMI to a level allowing it to access all monitors because the PMI level set by the WebSphere system administrator may deny the probe access to some of the monitors.
Note: You should be very careful when doing this because this may influence the performance of the WebSphere server. Ask the WebSphere system administrator first!
Advanced alarming
How many profiles must have a monitor in alarm state before an alarm is sent
Specifies the minimum number of profiles where the same monitor has exceeded the defined alarm threshold before an alarm is sent.
Note: This parameter can be individually overridden for each of the monitors by setting the Always alarm option in the Monitors properties dialog.

Probe Configuration
46 websphere Guide
Create a Profile
Normally all node/server combinations are detected and added during the resource wizard.
You may also create new profiles by right-clicking the profile and selecting New or edit the properties for an existing profile by right-clicking the profile and selecting Edit. This brings up the Profile dialog where the following properties can be edited.
This dialog contains the following fields:
Active
Activates or deactivates monitoring of the profile.
Name
Provides the new profile a unique and descriptive name. You may for example use the format <node>.<server>.
Node
Specifies the name of the node in the cluster.
Server
Specifies the name of the server in the cluster.
Resource
Lets you select the resource to which the node/server belongs.
Alarm Message
Specifies the alarm message that will be sent if the profile does not respond.

Probe Configuration
Chapter 3: websphere Configuration 47
If the newly defined node/server is not recognized, this is indicated with the following
symbol:
Auto Configurations
The Auto Configurations node allows you to add and configure a checkpoint for all monitoring instances. When you modify a checkpoint using Auto Configurations, the probe automatically applies the same updates to all the monitoring instances.
To add a monitor (checkpoint) to the Auto Configurations node, drag the monitor to Auto Configurations.

Probe Configuration
48 websphere Guide
Auto Monitors
The Auto Monitors node contains the list of all the monitors (checkpoints) in the monitoring instances where the monitors added to the Auto Configurations appear.

Probe Configuration
Chapter 3: websphere Configuration 49
Add Monitors to be Measured
To select a monitor to be measured for a Profile, you simply select the Profile in the left pane and maneuver through the WebSphere browser appearing under Profiles node. Selecting a folder in this tree-structure, the monitors found will be listed in the right pane of the probe GUI enabling you to select the ones you want to monitor.
Selecting the Profiles node, all monitors currently being measured will be listed in the right pane. You can select/deselect monitors from here.
Probe Configuration
50 websphere Guide
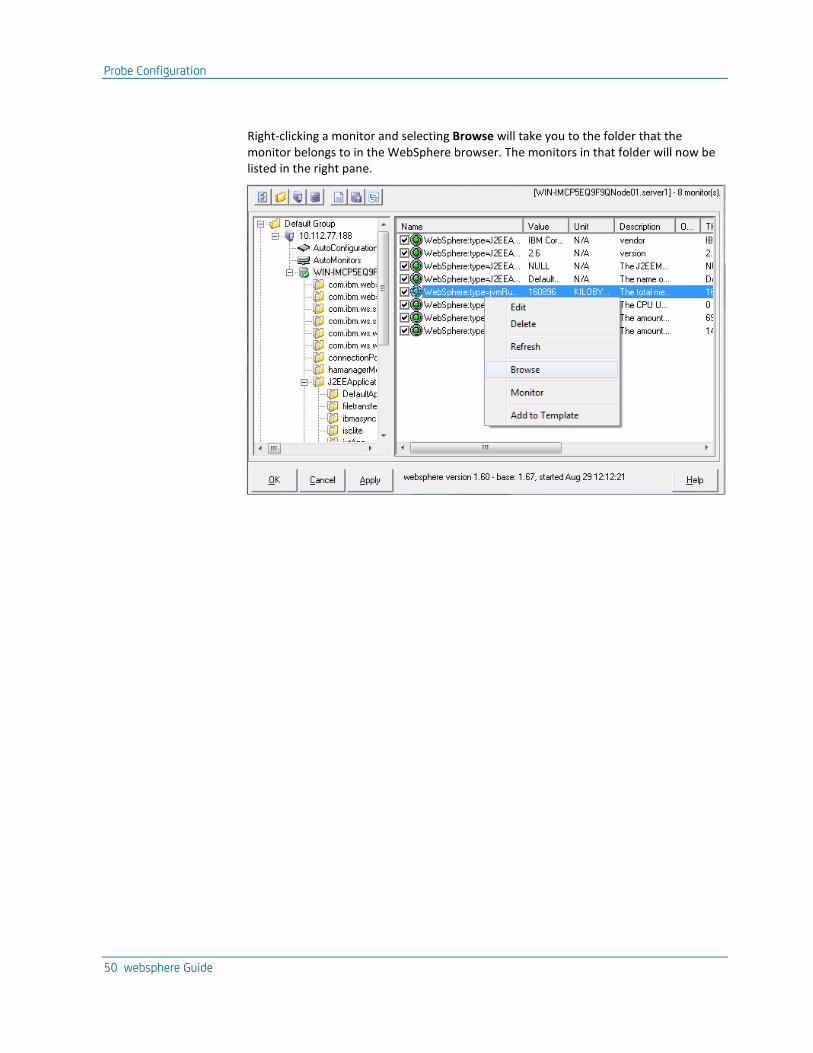
Right-clicking a monitor and selecting Browse will take you to the folder that the monitor belongs to in the WebSphere browser. The monitors in that folder will now be listed in the right pane.

Probe Configuration
Chapter 3: websphere Configuration 51
Edit the Monitor Properties
Edit the properties for monitor by right-clicking it in the window and selecting Edit.
This dialog contains the following fields:
Name
Defines the name of the monitor. The name will be inserted into this field when the monitor is fetched from the WebSphere browser but you can modify the name.
Key
Indicates a read-only field, describing the monitor key.
Description
Provides the description of the monitor. This description will be inserted into this field when the monitor is fetched from the WebSphere browser, but you are allowed to modify it.

Probe Configuration
52 websphere Guide
Value Definition
Lets you select which value to be used, both for alarming and QoS. You have the following options:
■ The current value: Means that the most current value measured will be used.
■ The delta value (current – previous): Means that the delta value calculated from the current and the previous measured sample will be used.
■ Delta per second: Means that the delta value calculated from the samples measured within a second will be used.
■ The average value (cur + prev) / 2: Means the average value of the current value and the previous value).
Note: In case of delta value, QOS and alarm will be generated on second interval as on first interval it will not find the previous value.
Active
Activates the monitoring of the probe.
Enable Monitoring
Activates the monitoring.
Note: The monitor will also be selected in the list of monitors in the right window pane when this option is selected, and that you can enable/disable monitoring of the checkpoint from that list.
High and Low Threshold
Indicates the High and Low threshold values.
Operator
Specifies the operator to be used when setting the alarm threshold for the measured value.
Example:
> 90 means alarm condition if the measured value is above 90.
= 90 means alarm condition if the measured value is exact 90.
Threshold
Defines the alarm threshold value. An alarm message will be sent if this threshold is exceeded.
Unit
Indicates the unit of the monitored value.
Example: %, Mbytes etc. The field is read-only.

Probe Configuration
Chapter 3: websphere Configuration 53
Message Token
Selects the alarm message to be issued if the specified threshold value is breached. These messages are kept in the message pool. The messages can be modified in the Message Pool Manager.
Key not found alarm
Allows you to send an alarm if no key is detected. This may for example happen after a restart of the WebSphere server when it takes some time before all monitors are restored.
Always Alarm
Overrides the option Advance Alarming on the Resource properties dialog. When selected, a threshold breach for this monitor will result in an error message, independent of the value of this monitor on other profiles in the cluster.
Publish Quality of Service
Provides the option to have QoS messages issued on the monitor.
QoS Name
Specifies the name to be used on the QoS message issued.
Enable the Monitors for QoS and Alarming
You can now see the current values for the monitors in the Values column in the monitor list of the GUI. To enable the probe to send QoS data and/or send alarms on threshold breaches, you have to modify the properties for each of the monitors. This is done by double-clicking a monitor (or right-clicking and selecting Edit), which brings up the monitor’s properties dialog. Refer the Edit the Monitor Properties section for details.

Probe Configuration
54 websphere Guide
Templates
Templates are useful tools for defining monitors to be measured on the various elements of a system.
You may create templates and define a set of monitors belonging to that template. These templates can be applied to a resource or profile by dragging and dropping the template on the node in the tree where you want to measure the monitors defined for the template. You may also drop a template on a resource in the tree structure using the Auto Configurations feature and the template will be applied to all elements for the profile.
To create a new template, right-click the Templates node in the left window pane and select New.
Note: You may also edit an existing template by selecting one of the templates defined (found by expanding the Templates node and selecting Edit).
You can edit or delete a template by right clicking it in the tree view and choosing the appropriate option from the context menu.
To add a monitor to a template, do one of the following:
■ Drag and drop the monitor to the template.
■ Right-click the monitor and select Add to templates in the context menu.
You can also use the wild card search feature in the Templates node. When you drag and drop a monitor to a template, the Select Template dialog appears that provides two options for adding monitors to the template. The first is for wild card search which searches all the siblings for the same monitor name. In the second option, it will place the specified monitor to the template.
Probe Configuration
Chapter 3: websphere Configuration 55
Error Codes
The error codes listed below may occur in the probe’s log file available by right-clicking the probe in the Infrastructure Manager and selecting View Log. Error code 1500 and 1503 may also appear in the WebSphere browser window.
1500
Lost connection to the WebSphere server.
Not able to connect to the WebSphere server.
Subtext: The reason for the connection problem.
1501 and 1502
The given key (measurepoint) is not found on the server.
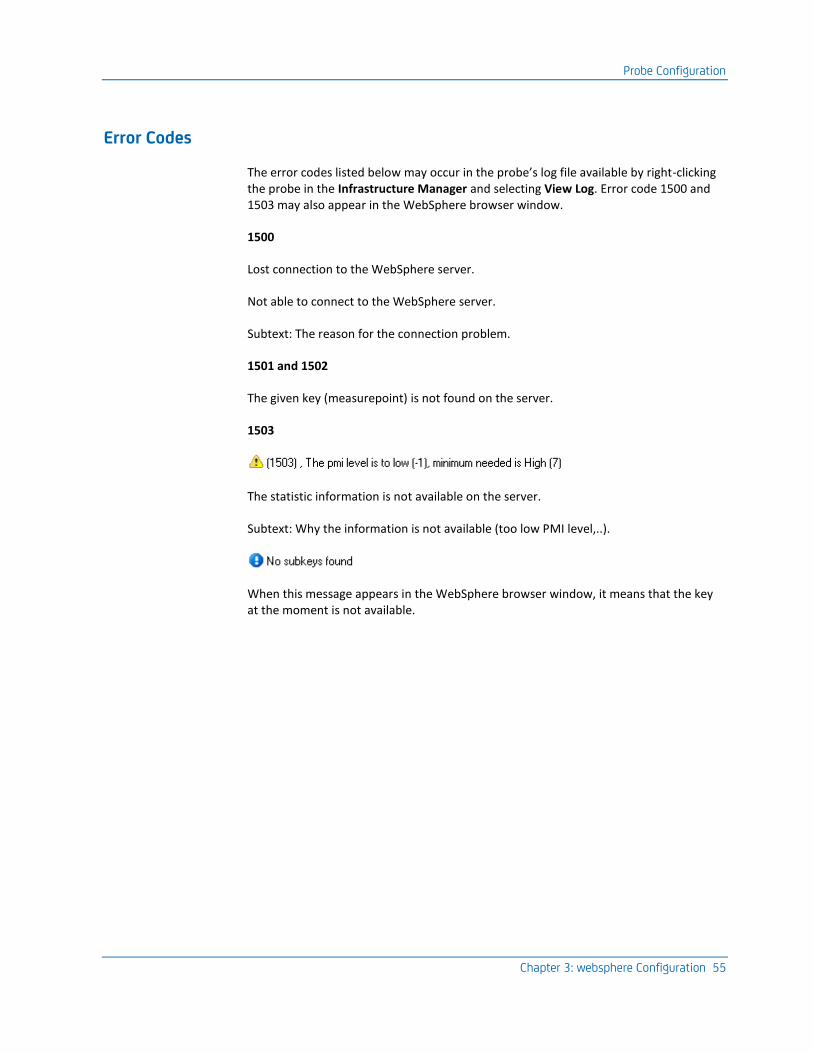
1503
The statistic information is not available on the server.
Subtext: Why the information is not available (too low PMI level,..).
When this message appears in the WebSphere browser window, it means that the key at the moment is not available.


Chapter 4: QoS Threshold Metrics 57
Chapter 4: QoS Threshold Metrics
Many Nimsoft Monitor probes ship with default QoS threshold values set. The default threshold values provide an idea of the type of values to be entered in the fields and are not necessarily recommended best practice values. To aid in tuning thresholds and reducing false-positive alarms, this section describes the QoS metrics and provides the default QoS thresholds.
This section contains the following topics:
websphere QoS Metrics (see page 57) websphere Alert Metrics Default Settings (see page 57)
websphere QoS Metrics
The following table describes the checkpoint metrics that can be configured using the websphere probe.
Monitor Name Units Description
QOS_WEBSPHERE_CPU_USAGE Percent CPU Usage
QOS_WEBSPHERE_MEMORY_USAGE Kilobyte Memory in KB
QOS_WEBSPHERE_METHODCOUNT number Number of calls
QOS_WEBSPHERE_THREADCOUNT number Thread counter
QOS_WEBSPHERE_TIME Seconds Measured time
websphere Alert Metrics Default Settings
The following table describes the default settings for the websphere metrics.
QoS Metric Error Threshold Error Severity Description
ThreadPoolCritical - Critical Alarms to be issued when the thread pool is above threshold
CPUWarning - Warning Alarms to be issued when the CPU usage is above threshold
MonitorWarning - Major Alarms to be issued when the monitor is above threshold

websphere Alert Metrics Default Settings
58 websphere Guide
QoS Metric Error Threshold Error Severity Description
ConcurrentWaiters - Critical Alarms to be issued when the waiters for a thread pool is above threshold
ThreadPoolHigh - Major Alarms to be issued when the used resources on the thread pool is above threshold
MemoryWarning - Minor Alarms to be issued when the memory usage is above threshold
CPUCritical - Critical Alarms to be issued when the CPU usage is above threshold
MethodCallsHigh - Major Alarms to be issued when the Number of method calls are above threshold
ProfileCritical - Critical Alarms to be issued when the profile is not responding
ProfileWarning - Major Alarms to be issued when the profile is not responding
ResourceCritical - Critical Alarms to be issued when the resource is not responding
ResourceWarning - Minor Alarms to be issued when the resource is not responding
MemoryUsageCritical - Critical Alarms to be issued when the probe internal used memory is above threshold
MemoryUsageWarning - Warning Alarms to be issued when the probe internal used memory is above threshold


