Ningaloo Collaboration Cluster: Hyperspectral Mapping of Bathymetry and Benthic Cover Wojciech Klonowski, Mervyn Lynch, Peter Fearns, Leon Majewski, and Mark Gray. Curtin University Ningaloo Collaboration Cluster Final Report No. 1a ISBN: 978-0-86905-959-3
Transcript
Ningaloo Collaboration Cluster:
Hyperspectral Mapping of Bathymetry and
Benthic Cover Wojciech Klonowski, Mervyn Lynch, Peter Fearns, Leon Majewski, and Mark Gray. Curtin University Ningaloo Collaboration Cluster Final Report No. 1a ISBN: 978-0-86905-959-3
ISBN: 978-0-86905-959-3
This report is an outcome from the Ningaloo Collaboration Cluster – a partnership between Murdoch
University, The University of Western Australia, the Australian National University, The University of
Queensland, Edith Cowan University, Curtin University of Technology, the Sustainable Tourism
Cooperative Research Centre and CSIRO’s Wealth from Oceans Flagship. The Cluster is funded through
CSIRO’s Flagship Collaboration Fund and the partners’ in-kind support.
www.csiro.au/partnerships/NingalooCluster
Enquiries should be addressed to: Professor Mervyn J Lynch Wojciech Klonowski Department of Imaging and Applied Physics Curtin University PO Box U1987 Perth WA 6845
Distribution list Dr Tom Hatton, Director CSIRO Wealth from Oceans Flagship
Dr Steve Buchan, Met Ocean Engineers
Professor Neil Loneragan, Murdoch University
DrTerry Cox, HyVista Corporation
Dr Steve Blake, CEO WAMSI Prof. Stuart Phinn, Director, TERN
Dr Chris Simpson, Program Leader, Marine Science
Dr. Ian Poiner, CEO, AIMS
Dr Paul Vogel, EPA Dr David Ryan, Worley Parsons
Dr Rodney Hoath, Department of Transport, Marine Branch
Dr Peter Hausknecht, Woodside Energy
Ian Wood, Vice President Sustainable Development and Community Relations, BHP Billiton
1.6 Data Accessibility (Data Summary) .......................................................................... 9 1.6.1 Who is the custodian of the data ........................................................................... 9 1.6.2 Raw data and data products description ............................................................... 9
2. Bathymetry and broad scale benthic habitat classification of the Ningaloo lagoon from Airborne hyperspectral data ...................................................... 13 2.1 Summary ................................................................................................................. 13
Figure 3: Validation comparison between image-derived bathymetry and echo sounder depth ................. 19
Figure 4: A true colour HyMap image of Coral Bay, WA. ............................................................................ 20
Figure 5: Validation comparison between image-derived bathymetry and historical acoustic survey depths. ...................................................................................................................... 21
Hyperspectral Mapping of Bathymetry and Benthic Cover • 25 July 2011, Version 1.0 5
1. SUMMARY
1.1 Benefits and managements implications
A detailed bathymetry and a benthic cover classification map of the Ningaloo Reef was derived from airborne remotely sensed imagery on a scale of 3.5 m , one of the most extensive, fine scale mapping programs ever attempted. At this fine scale, benthic cover may easily be verified by divers. In situ measurement can easily be used to validate the bathymetry and cover predicted from remote sensing. This study included a verification program conducted by a research team from Murdoch University at a number of selected locations within the Reef. Additionally, Curtin scientists undertook an independent validation of bathymetry using a small craft equipped with an echo sounder. These verification studies found that the bathymetry product was accurate to 20 cm within the 0-20 m depth range and will be of great benefit to the community of users.
Accurate bathymetry of the shallow water lagoon is critical and provides the foundation needed for assimilation into numerical hydrodynamic models of coastal currents and near-shore circulation. These calculations are of great importance when predicting coastal sediment transport and in environmental management studies where the impact of engineering structures [pipelines, jetties, marinas, etc] on coastal systems are to be investigated. Bathymetry is a prime variable in such studies where it needs to be spatially well sampled [e.g. a regular grid] and the data of known accuracy.
Accurate bathymetry also provides a baseline data set for future management. Any physical forcing on coastal systems [e.g. severe storms, tropical cyclones, storm surge, Tsunami] has the potential to significantly modify the bathymetry. A reference dataset enables any future impacts to be assessed with good accuracy. Such information on system vulnerability clearly feeds into Reef management practice.
Ningaloo Reef is impacted by local currents, primarily the Leeuwin Current which appears to entrain Reef waters on its poleward flow down the mid-West Coast. However, the inshore Ningaloo Current and the Holloway Currents also appear quite relevant in that they can transport biological materials such as larvae, plankton, hazardous algal blooms (HABs) and numerous other biological species originating from remote locations into Ningaloo waters. These, when combined with potential global change, for example, water temperature rise, changed wind regimes, changed wave energy forcing, have the potential to impact significantly over time the indigenous marine flora and fauna. A validated baseline dataset comprising a detailed knowledge of the range of benthic species on the Reef along with their spatial distribution at pixel scale of 3.5 m will enable the monitoring and, ideally, the detection, of any such impacts on Ningaloo Reef. Curtin captured underwater video imagery of the benthos from a small craft. A preliminary description of the validation of the remotely sensed benthic cover classification has been reported [see Section 1.5.2 of this Report].
The Curtin Team produced two additional products. The first, requested by the Murdoch University Team, was the spectral reflectance of the reef bottom. This was requested by the Murdoch University researchers because this is a variable that they measure in situ with an
6 Hyperspectral Mapping of Bathymetry and Benthic Cover • 25 July 2011, Version 1.0
underwater spectrometer. The other product was the in-water diffuse attenuation coefficient at 490 nm [K490] which indicated the reduction in light intensity per metre as light travels down to the seabed. This is a difficult variable to estimate in shallow water regions and is not successfully measured by on-orbit satellite sensors. It is a “noisy” product when measured in the current airborne program because the overall attenuation at 490 nm in Ningaloo shallow water is very small. However, some spatial averaging from 3.5 m pixels to 10 m pixels will produce a more spatially homogeneous product which can be compared with in situ measurements. A key parameter in the deterioration of the condition of benthic flora is the reduction in light reaching the seabed. K490 is the relevant physical variable that monitors this process.
In summary, we have produced a quantitative set of data at high spatial resolution that covers the entire Ningaloo Reef system for a given period in time (April 2006). The data have been measured with a single instrument so the quality of data across the whole Reef is standardised. The high spatial resolution, sampling on a uniform spatial grid and the characterisation of measurement errors for the bathymetry is particularly beneficial for numerical modelling of coastal processes. It also provides a very accurate baseline for assessing major changes in the system due to geophysical disturbances such as Tsunamis, cyclones and severe storms.
The benthic cover mapping also maps the whole Reef at an instant in time and as stated previously, using a single instrument. These data are comparable to data collected using divers and visual assessments where some diver-dependent subjectivity always enters into the monitoring process. As the Ningaloo Reef covers such a vast spatial area, in situ sampling frequently is neither comprehensive in coverage or accuracy nor collected at the same time as other physical data. However, it is clearly the case that these remote sensing methods do not replace the need for in situ assessment. The remote sensing and the diver-based sampling enhance each other. Remote sensing provides total spatial coverage maps or benthic substrate at a coarse level of classification, and the diver sampling provides validation data at discrete points and classification at species level.
We have identified several management implications that such data will have. These include the frequency of occurrence and areal coverage of specific marine habitats. This information is important in guiding the establishment of marine protected areas. The vulnerability of particular habitats to weather system will relate to their location. Further, high value marine assets, such as coral reefs, need to be identified and their locations mapped accurately if there is a requirement to be able to protect them from a hazardous event such as an oil spill. The hydrodynamic modelling that will be undertaken using shallow water bathymetric data provided by this project will provide information both on reef currents and within-reef circulation systems which are important variables in developing strategies for the Reef’s management. For example, with such information, the impact of sea level rise on the Reef may be accurately modelled. The WA State agency closely concerned with these above matters is the Department of Environment and Conservation. Wave climate is monitored by the Marine Branch of the Department of Transport.
We believe that once the Cluster datasets are released and made publicly available there will be many more benefits that emerge and these in turn will find their way into impacting management practices.
Hyperspectral Mapping of Bathymetry and Benthic Cover • 25 July 2011, Version 1.0 7
1.2 Further Developments
Data exchange will continue between the various research groups participating in the Ningaloo cluster. All Curtin’s Ningaloo products are archived on iVEC and have been available to Cluster collaborators for over 12 months. At this time, we have not been able to access any in situ data collected by Murdoch researchers, nor have we had any formalised reporting from the CSIRO numerical modelling researchers on the suitability of the remotely sensed bathymetry.
When in situ datasets on benthic habitats collected by Murdoch become available, there will be benefit in comparing the remotely sensed benthic classification with the in situ survey undertaken by Murdoch University staff. While the classification techniques are quite different, there is a need to reach a consensus on the methodology for the comparison. The comparison itself and the associated statistical analysis will be a particularly important outcome of the project and will indicate the value or otherwise of remotely sensed baseline surveys of coastal ecosystems.
A further output from the Curtin component of the Ningaloo project that was not a contractual requirement but was requested by Murdoch scientists was remotely sensed bottom spectral reflectance. These bottom reflectances can be compared with those measured in situ by Murdoch University staff using an Ocean Optics 2000 hand-held optical spectrometer.
Water samples were collected by Curtin from the small craft deployed during the flight of the aircraft that collected the hyperspectral datasets. These water samples were filtered, stored and transported to CSIRO Hobart in an LN2 cooled dry shipper for analysis by Ms Lesley Clementson. The HPLC-derived pigment concentrations, if modelled using the Hydrolight (Sequoia) software, should provide a spectral diffuse attenuation coefficient K490 for comparison with the same product extracted from the remotely sensed observations. As mentioned previously, the remotely sensed product is somewhat noisy but may be spatially averaged to yield a meaningful product. HPLC pigment concentrations primarily define the absorption of solar radiation by the water column. The attenuation is estimated quite separately from the aircraft hyperspectral data. Comparing these will provide an independent validation of the hyperspectral data.
It is clear from the above that there are a number of quite fruitful activities that remain to be followed through using datasets generated by the Ningaloo Collaborative Cluster. We anticipate that the associated research outcomes will follow progressively over the next few years.
1.3 Acknowledgements
There are a number of agencies that contributed to the successful conduct of the remote sensing hyperspectral campaign of the Ningaloo Reef. We express our gratitude to AIMS, HyVista Corporation and BHP Billiton for the provision of the funding and acquisition of the hyperspectral dataset. We also express our appreciation to iVEC for the computing services and data storage facilities without which the project would have been very difficult to complete. We also than Dr Arnold Dekker, CSIRO L&W for his advisory role and for reviewing of project progress.
8 Hyperspectral Mapping of Bathymetry and Benthic Cover • 25 July 2011, Version 1.0
1.4 Planned Publications
Expectations are that several publications by Curtin and collaborators will emerge from the project. These relate to the following research outcomes:
1) W. Klonowski, M. Gray, P. Fearns, M. Lynch, "Hyperspectral image-derived bathymetry for the Ningaloo Marine Park", International J. Digital Earth. 2) W. Klonowski, P. Fearns, M. Lynch, "Improving hyperspectral retrievals of IOPs, Depth and Benthic Cover by incorporating angular dependant semi-empirical model coefficients: Ningaloo Marine Park case study", Remote Sensing of the Environment. 3) W. Klonowski, L. Majewski, P. Fearns, M. Lynch, "Validation of hyperspectral image-derived Ningaloo benthic cover using towed underwater video transects", Remote Sensing of the Environment. 4) W. Klonowski, L. Majewski, P. Fearns, M. Lynch, "In situ bio-optical properties of Ningaloo Reef waters", Remote Sensing of the Environment.
1.5 Communications:
1.5.1 List publications Conference papers Wojciech Klonowski, “Depth Retrieval from Hyperspectral Imagery over the Ningaloo Marine Park”, Ocean Optics XVIII conference (Montreal, Canada, 9-13 Oct 2006).
Wojciech Klonowski, “Validation of Hyperspectral Image-Derived Benthic Cover using Towed Underwater Video Transects”, Ocean Optics XIX conference (Tuscany, ITALY, 3-10 Oct 2008).
1.5.2 Presentations
Majewski, L., W. Klonowski,and M. Lynch .2006. “Validation Campaign for the Ningaloo Hyperspectral Sensing Project.” Presentation to BHP Billeton on the Ningaloo Project, Perth, Western Australia.
Lynch, M., P. Fearns, W. Klonowski, M.Gray, M. Slivkoff, L. Edwards and M. Wyatt. “Hyperspectral Remote Sensing of Coastal Oceans”presented at the Australia-India Workshop on Marine Remote Sensing, Ahmedabad, India March 18-19, 2010. [Sponsored by a grant from the Australia-India Strategic Research Fund].
Lynch,M., D. Liu, R. Proctor, J. Keesing, P. Fearns, G. Hallegraff and R. Garcia. “Marine Biology and Bio-optical Remote Sensing for Supporting Marine Environmental Management.” Presentation to a Joint Meeting of the Australian Academy of Science,the Academy of Technological Science and Engineering with the Chinese Academy of Science, Canberra, May 7, 2010.
Hyperspectral Mapping of Bathymetry and Benthic Cover • 25 July 2011, Version 1.0 9
Lynch, M. “Exploring the Information Content in Hyperspectral Remote Sensing Observations of the Earth.”Presented at a Workshop convened by the Chinese Academy of Science at the Center for Earth Observations and Digital Earth [CEODE], Beijing, March 15-16, 2011.
Lynch, M. “Remote Sensing of the Mid-West Coast and Kimberley Regions of Western Australia” Kimberley Marine Research Workshop sponsored by the Australian Institute of Marine Science [AIMS], University of WA, Perth, Western Australia, November 2009.
1.5.3 Student Projects
Mark Gray, Department of Imaging and Applied Physics, Curtin. PhD Thesis, Start: Feb. 2005 Estimated completion: Nov. 2011 - Interim Title: Retrieving and Optimising Multi-instrument Shallow Water Coastal Ocean Properties
1.6 Data Accessibility (Data Summary)
Metadata for the remotely sensed data have been provided to Mr Luke Edwards who is supported by WAMSI to maintain the metadata for all marine research projects undertaken in WA. The metadata link for the airborne hyperspectral data is:
A summary of the metadata is given at the end of this section.
1.6.1 Who is the custodian of the data
The datasets ultimately will reside with the Portal managed by the Australian Ocean Data Network (AODN).
1.6.2 Raw data and data products description
The processed remote sensing reflectance, bathymetry and benthic cover products are delivered in standard ENVI data format, a binary file in BSQ (Band Sequential) format, with an associated header text file (*.hdr). The data type and scaling factors of the image bands are listed in the paired header file. The data products are delivered as individual flight lines which have been geo-rectified and formed as block mosaics.
Atmospherically Corrected Rrs
The filenames “Blk_X_YY_Tafkaa_Rrs_Georectified.bsq” represent the above-water remote sensing reflectance products. “X” corresponds to the data Block letter (A – K) and “YY” are the flight line numbers (67 in total). The flight lines have been geo-rectified using the HyVista Corp. supplied geo-correction data (GLT files). The geo-rectified images within each data block have been overlayed together to produce block mosaics and are stored as “Blk_X_Tafkaa_Rrs_Mosaic.bsq”. A feathering distance of 30 pixels was used at the overlap areas of the flight lines. The remote sensing reflectance (1/Sr) data are stored as short integer values scaled by 10000.
10 Hyperspectral Mapping of Bathymetry and Benthic Cover • 25 July 2011, Version 1.0
Bathymetry
The filenames “Blk_X_YY_Bathymetry_Georectified.bsq” represent the image-derived bathymetry products. “X” corresponds to the data Block letter (A – K) and “YY” are the flight line numbers (67 in total). The flight lines have been geo-rectified using the HyVista Corp. supplied geo-correction data (GLT files). The geo-rectified images within each data block have been overlayed together to produce block mosaics and are represented by the filenames, “Blk_X_Bathymetry_Mosaic.bsq”. A feathering distance of 30 pixels was used at the overlap areas of the flight lines. The bathymetry data are stored as floating point precision values. Flag values of -1 correspond to the land mask and flag values of -2 correspond to whitewash or whitecaps over the water. Flag values of -99 correspond to no data. Note: the image-derived bathymetry of each flight line has been tide corrected to a Mean-Sea-Level datum.
Benthic Cover
The filenames “Blk_X_YY_BenthicCover_Georectified.bsq” represent the benthic cover products. “X” corresponds to the data Block letter (A – K) and “YY” are the flight line numbers (67 in total). The flight lines have been geo-rectified using the HyVista Corp. supplied geo-correction data (GLT files). The geo-rectified images within each data block have been overlayed together to produce block mosaics and are stored as “Blk_X_BenthicCover_Mosaic.bsq”. A feathering distance of 30 pixels was used at the overlap areas of the flight lines. The benthic cover data are stored as short integer values which represent the fractional cover (in percent) of 3 benthic classes (Sediment, Vegetation and Coral). Flag values of -1 correspond to the land mask and flag values of -2 correspond to whitewash or whitecaps over the water. Flag values of -99 correspond to no data.
Summary of metadata
Data Identification
Title Ningaloo Reef Bathymetry (Tide Corrected) - April 2006
Date
Date 2009-03-02T10:06:00
Date type creation: date identifies when the resource was brought into existence
Abstract HyVista Corporation acquired hyperspectral data over the Ningaloo Marine Park area in North-West Western Australia between the 20th of April 2006 and the 2nd of May 2006. A shallow water reflectance model (3-bottom component) was used to determine the bathymetry and benthic cover albedo by inverting reflectance data. This was also separated into 11 blocks of data (blocks A to F) covering Ningaloo Reef.
Point of contact
Individual name Wojciech Klonowski
Organisation name Curtin University of Technology - Remote Sensing and Satellite
Hyperspectral Mapping of Bathymetry and Benthic Cover • 25 July 2011, Version 1.0 11
keywords
Spatial representation type
grid: grid data is used to represent geographic data
Language English
Character set utf8: 8-bit variable size UCS Transfer Format, based on ISO/IEC 10646
Topic category
Topic category code oceans
Topic category
Topic category code elevation
Topic category
Topic category code imageryBaseMapsEarthCover
Extent
Geographic element
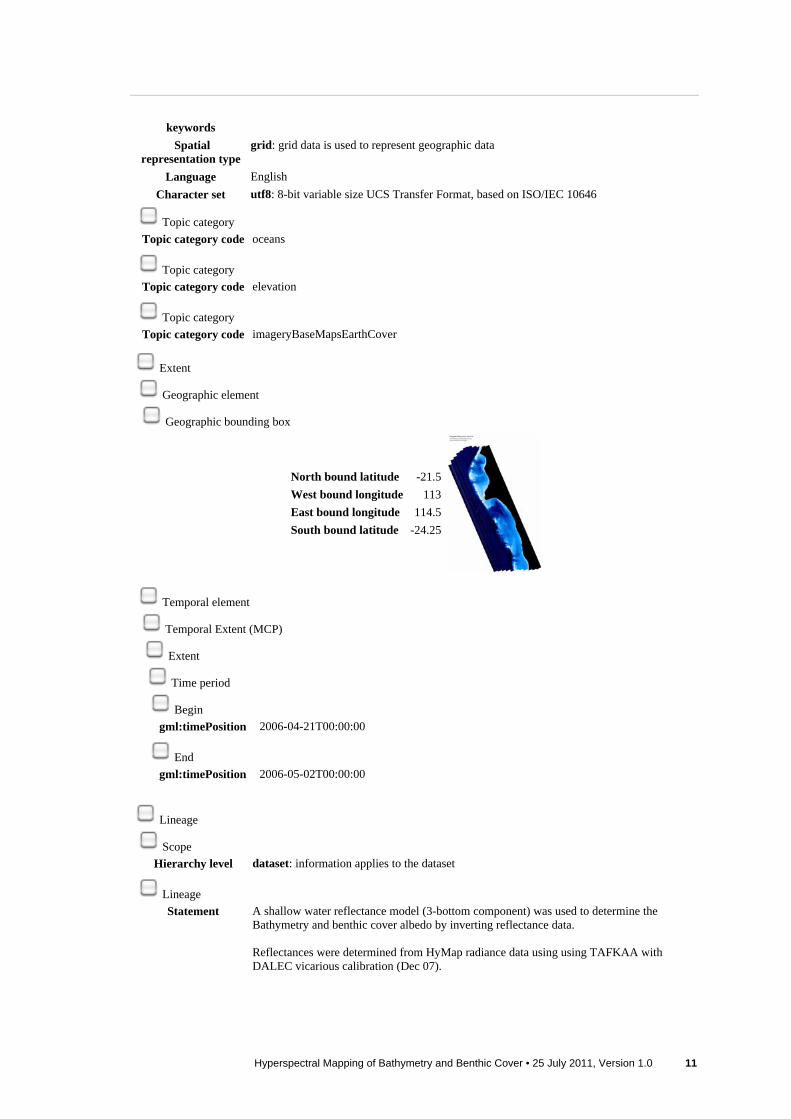
Geographic bounding box
North bound latitude -21.5
West bound longitude 113
East bound longitude 114.5
South bound latitude -24.25
Temporal element
Temporal Extent (MCP)
Extent
Time period
Begin
gml:timePosition 2006-04-21T00:00:00
End
gml:timePosition 2006-05-02T00:00:00
Lineage
Scope
Hierarchy level dataset: information applies to the dataset
Lineage
Statement A shallow water reflectance model (3-bottom component) was used to determine the Bathymetry and benthic cover albedo by inverting reflectance data. Reflectances were determined from HyMap radiance data using using TAFKAA with DALEC vicarious calibration (Dec 07).
12 Hyperspectral Mapping of Bathymetry and Benthic Cover • 25 July 2011, Version 1.0
Bathymetry data for each flight line was tide corrected using the excel file "Hyperspectral_flight_line_corrections.xls" issued by Ryan Lowe - UWA (5th June 2008). All mosaics have been generated using HyVista Corp-supplied GLT files (Nov 2008) in ENVI 4.5
Reference System Info
Code EPSG:28349
Code space EPSG
Distribution and On-line Resource(s)
Distribution format
Name .BSQ (Band Sequential)
OnLine resource Point of truth URL of this metadata record
Australian Marine Community Profile of ISO 19115:2005/19139
Metadata standard version
MCP:BlueNet V1.4
Revision Date 2009-03-02T09:33:57
Hyperspectral Mapping of Bathymetry and Benthic Cover • 25 July 2011, Version 1.0 13
2. BATHYMETRY AND BROAD SCALE BENTHIC HABITAT CLASSIFICATION OF THE NINGALOO LAGOON FROM AIRBORNE HYPERSPECTRAL DATA
2.1 Summary
In April 2006, a large-scale hyperspectral aerial survey was conducted over the Ningaloo Marine Park, capturing spectral signatures of the lagoon with spatial resolution of approximately 3.5m. By incorporating sophisticated models that invert the spectral signatures, it is possible to simultaneously retrieve water depth and key benthic cover types (e.g. sediment, vegetation and coral) from the hyperspectral imagery. The Remote Sensing and Satellite Research Group (RSSRG) at Curtin University processed this large dataset at the iVEC supercomputing facility to produce high-resolution bathymetry and benthic cover maps over the whole of the Ningaloo Marine Park (< 20 m water depth). The image-derived bathymetry products have been validated with echo sounder measurements acquired during the flight campaign and with historical acoustic bathymetry. The results indicate that the bathymetry is accurate to within ± 20cm at shallow depths up to 5m and within ± 40cm for depths ranging from 5 m to 12 m.
2.2 Introduction
The Ningaloo Marine Park, situated in the north west of Western Australia, is Australia’s largest and most accessible fringing reef system. The shallow lagoons formed by the reef support a diverse array of habitats for a multitude of colourful corals and more than 500 species of fish. To better characterise the coral reef environment, accurate bathymetry with high-spatial resolution is required since coral reefs, by their very nature, are strongly influenced by the physical structure of the environment they inhabit (Stumpf and Holderied 2004). Because of the relatively small horizontal spatial scales of the coral communities that occupy reef outcrops, detailed knowledge of the bottom topography will improve characterization of reef habitat for both corals and the species living within the reef system (Mumby et al. 1998). Currently, there is very little coverage of depth soundings within the extensive area of the Ningaloo Marine Park. The majority of existing soundings are spatially limited with horizontal scales typically between tens to hundreds of meters. Given the sheer extent of the Reef system and the need for detailed bottom typography, remote sensing is currently the only viable option for providing both the determination of high-spatial resolution bathymetry and the benthic cover information within the Ningaloo Marine Park.
Hyperspectral remote sensing over our coastal waters can provide large spatial coverage of detailed information of visible light emanating from the shallow waters in many spectral bands and at high ground resolutions. Unlike historical methods for determining water depth and benthic cover, such as supervised classification of digital imagery with ground truth benthic cover and/or known bathymetry, hyperspectral imagery allows us to incorporate sophisticated radiative transfer models and therefore invert the measured spectral signatures to yield accurate and repeatable retrievals of water depth and key benthic cover types and therefore produce accurate bathymetry and benthic habitat maps. This environmental information is significant in
14 Hyperspectral Mapping of Bathymetry and Benthic Cover • 25 July 2011, Version 1.0
monitoring and managing coastal marine ecosystems. The coastal manager needs to possess such baseline data and to measure any subsequent system variability against this reference set. This is particularly the case when development or multiple-use pressures impact an area that can lead to degradation of the existing physical and biological ecosystem. The various environmental data may further be employed as inputs to numerical ecosystem models. Accurate bathymetric and benthic cover data are required for numerical modelling of shallow water systems. Once quantified, models may be used to explore a range of scenarios that might arise from a change in physical forcing on the coastal ecosystem.
2.3 Materials and methods
The Ningaloo imagery were captured with the airborne HyMap imaging system (HyVista Corp.), which records light into 126 spectral channels covering the 450nm to 2500 nm spectral range at a typical bandwidth of 15nm. A field campaign was conducted during the same period, acquiring a variety of in situ measurements coincident with several over flights to support the retrieval of bathymetry and benthic cover from the hyperspectral imagery. Field measurements included the continuous acquisition of above-water remote sensing reflectance spectra, echo sounder depths, GPS and underwater video recordings, which were taken along transects within the shallow lagoons inside the Ningaloo Marine Park. Intermittent station stops were made along the way, obtaining in-water profiles of water column absorption, attenuation and backscattering. Discrete water samples were also taken at these station sites and filtered the same day. The samples were filtered within hours of collection for total suspended matter (47mm mesh filter, 1 litre), phytoplankton absorption (35 mm GF/F filter, 2 litres) and HPLC pigments (47mm GF/F filter, 4 litres). 250 ml water samples were collected for determining absorption by coloured dissolved organic matter (CDOM). The filtered water samples were analysed by Lesley Clementson at CSIRO Marine and Atmospheric Research, Hobart. On days where no over flights were scheduled, bottom samples of a variety of substrate types were collected and their spectra acquired with a hand-held hyperspectral radiometer (Klonowski et al. 2003).
Atmospheric correction of the HyMap data was performed with TAFKAA (Montes et al. 2004). TAFKAA utilises pre-determined tabulated atmospheric data calculated for a variety of solar-sensor geometries, altitudes and atmospheric conditions, with focus in coastal water environments. The atmospheric correction performed here was accomplished by selection of the closest tabulated atmospheric data by using known meteorology. Prior to analysis of the HyMap data, a sensitivity analysis of the TAFKAA algorithm was performed to assess the response to variability in important input parameters. The atmospheric correction for a sensor positioned at HyMap altitudes was found to be most sensitive to changes in the aerosol loading and total column water vapour. The correction was relatively insensitive to changes in the temperature profile, the water vapour profile shape, ozone amount and the surface wind speed used in the model. TAFKAA has been executed to produce apparent reflectance (RAPREF) and remote-sensing reflectance (Rrs) for all water scenes in the dataset over the HyMap bands used in bathymetry and benthic cover retrieval (456nm to 750nm). Remote sensing reflectance produced by TAFKAA did not compare well with in situ observations of reflectance collected during the field campaign. Comparison in the short wave “blue” bands is particularly poor. Another approach to atmospheric correction is by vicarious means, adjusting the measured reflectance to match closely with at-surface measurements.
Hyperspectral Mapping of Bathymetry and Benthic Cover • 25 July 2011, Version 1.0 15
While the apparent reflectance does not capture the column atmospheric physics it was shown to provide a better and more consistent atmospheric correction than either the TAFKAA Rrs or the HyVista-supplied atmospheric correction results. In this correction dataset the in situ collected remote sensing reflectance was used as a benchmark estimate of the HyMap observed reflectance. Apparent reflectance was generated for each band (this has no correction for scattering or absorption) which was subsequently adjusted linearly to minimise the correlation between the HyMap apparent reflectance and the in situ remote sensing reflectance to yield the atmospherically corrected above-water remote sensing reflectance products. The approach used to invert atmospherically corrected remote sensing reflectance imagery incorporates a shallow water reflectance model. The model follows the work outlined in Lee et al. (1999) and Klonowski et al. (2007) and relates the subsurface remote sensing reflectance (rrs) to the absorption and backscattering properties of the water column (a and bb), the bottom reflectance ( and water depth (H), expressed as,
rrs 0.0840.170u u 1 exp 1
cos(w ) 1.03 12.4u
cos(v )
H
exp 1
cos(w ) 1.04 15.4u
cos(v )
H
,
where, u a
a bb
and a bb. All parameters in the above approximation are wavelength
dependent except for the subsurface solar and sensor viewing angles (w and v) and water depth. Absorption is further expressed as,
a aw Pa
G exp 0.015 440 ,
where, aw is the spectral absorption of pure water taken from Pope and Fry (1997). P and G represent the magnitude of spectral absorption at 440 nm for phytoplankton and CDOM, respectively. a is the wavelength dependent specific absorption coefficients for phytoplankton normalised at 440 nm. Values for a are taken from phytoplankton spectral absorption measurements determined from field collected water samples. Backscattering is modelled as,
where, X represents the magnitude of backscattering at 550 nm and is the centre wavelength of the spectral band. The value of the spectral shape parameter, Y, was set at 1.0, which is representative of coastal waters. Values for the backscattering coefficients of pure water (bbw) were taken from Smith and Baker (1981). The bottom reflectance term, ρ, is parameterized by the linear combination of three bottom reflectance spectra that are representative of three key benthic cover classes, namely sediment, vegetation and coral. For situations where more than 3 spectral end members are available, such as this study, the end members are separated into their three respective key benthic classes, which allows for various combinations of 3 bottom types by selecting in turn one member from each of the three benthic classes. The bottom reflectance parameterization is thus expressed as,
16 Hyperspectral Mapping of Bathymetry and Benthic Cover • 25 July 2011, Version 1.0
Bsedisedi
Bvegivegi
Bcoricori
where, Bsedi
, Bvegi and Bcori
correspond to the fractional weighting coefficient of bottom
reflectance spectra within the benthic classes; sediment, vegetation and coral, respectively.
sedi
, vegi
and cori
are the measured bottom reflectance spectral end members in each key
benthic cover class. The above-water remote sensing reflectance, Rrs, is related to the subsurface remote sensing reflectance, rrs, with an expression given as,
rs
rsrs r
rR
1
,
where, accounts for diversion across the air-water interface and the term, 1rrs , accounts for internal reflection (Lee et al. 1999). Values for and were determined from Hydrolight simulations following the method used in Lee et al. (1998), whereby, =0.5 and =1.5 for nadir view. The solution of the 7 unknown model parameters (P, G, X, Bsed, Bveg, Bcor, H) was obtained by incorporating non-linear methods. The basic concept of these methods involves attempting to minimise the difference between modelled and measured Rrs spectra by adjusting the model parameters. In this study we adopt the Levenberg-Marquardt retrieval scheme. The scheme requires a set of initial values for the model parameters to generate an initial Rrs
spectrum. An optimisation program then computes the 2value. This value represents the
residual between the measured and modelled Rrs curves and is calculated as,
2 1
NRrs
Measured RrsModelled 2
,
summed over the first 16 HyMap spectral bands (450nm – 675nm). The process is repeated
whereby the program appropriately adjusts the model parameters until 2 reaches a minimum.
Once a minimum is reached it may be assumed that the best estimate of each model parameter has been obtained.
2.4 Results and Discussion
A total of 67 HyMap image flight lines were collected as part of the Ningaloo mapping survey, covering an area of approximately 3500km2. A nominal ground resolution of 3.5m was achieved for the imagery resulting in over 1 billion pixels to be processed. Due to the large volume of data, the hyperspectral imagery was processed at Western Australia’s supercomputing facility, iVEC. Utilising iVEC’s 192 CPU’s the image data were tiled and processed simultaneously in just under 1 week of continuous computation.
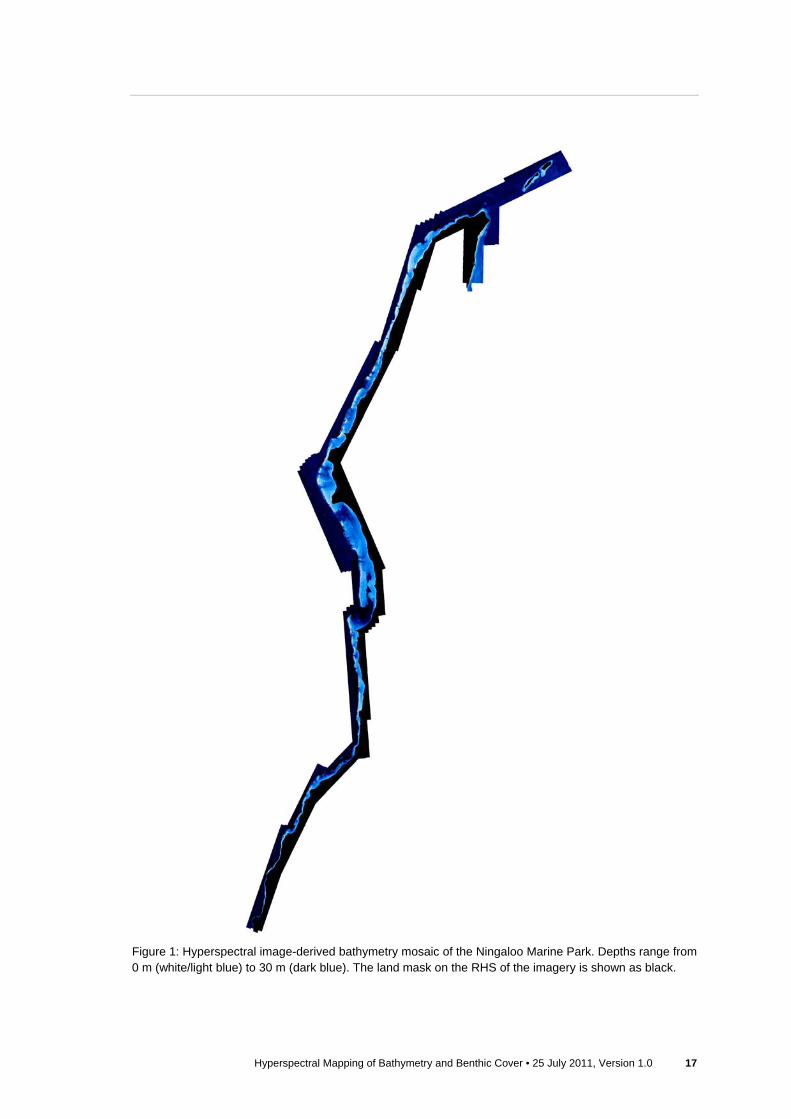
The image-derived water depth and benthic cover weighting coefficients were used to generate mapped bathymetry and benthic habitat maps. Bathymetry and benthic cover products for each flight line were geo-located using HyVista supplied GLT data, creating mapped outputs. A tide model developed by Ryan Lowe (UWA) was used to correct the image-derived water depths to a Mean-Sea-Level datum. A scaled down version of the entire bathymetry mosaic is shown in Figure 1. Figure 2 displays a focused section of the bathymetry map showing the high-resolution detail that has been captured.
Hyperspectral Mapping of Bathymetry and Benthic Cover • 25 July 2011, Version 1.0 17
Figure 1: Hyperspectral image-derived bathymetry mosaic of the Ningaloo Marine Park. Depths range from 0 m (white/light blue) to 30 m (dark blue). The land mask on the RHS of the imagery is shown as black.
18 Hyperspectral Mapping of Bathymetry and Benthic Cover • 25 July 2011, Version 1.0
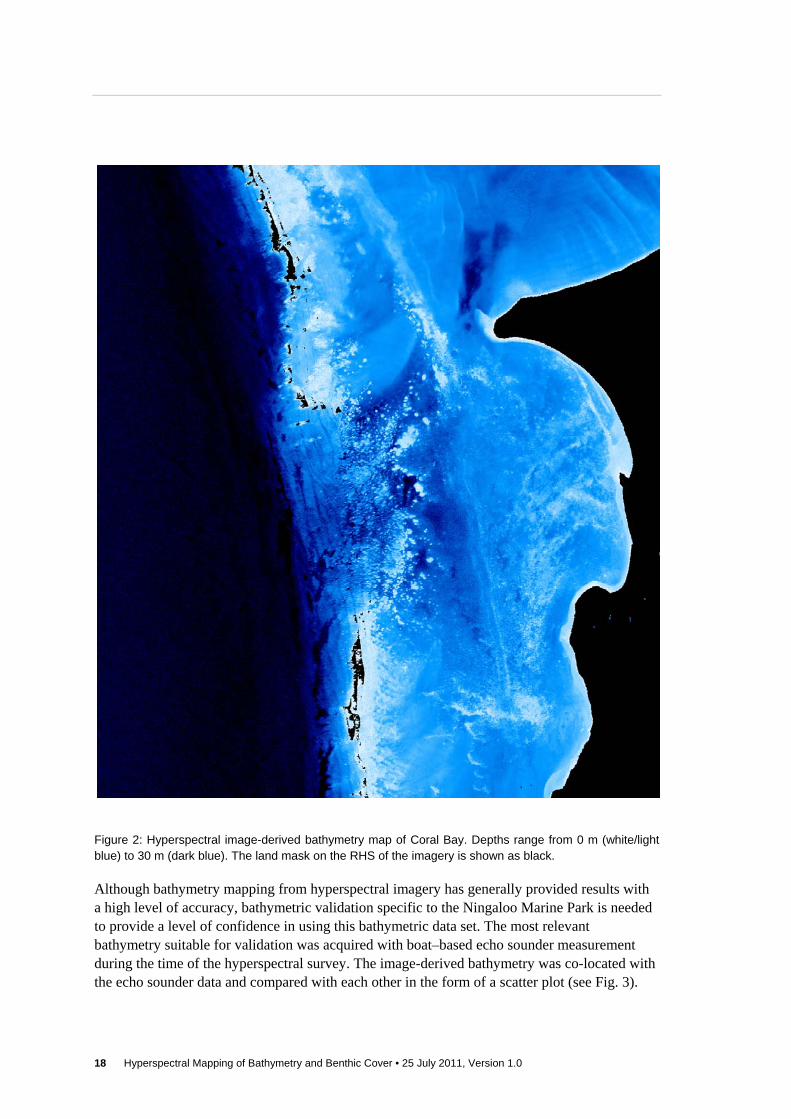
Figure 2: Hyperspectral image-derived bathymetry map of Coral Bay. Depths range from 0 m (white/light blue) to 30 m (dark blue). The land mask on the RHS of the imagery is shown as black.
Although bathymetry mapping from hyperspectral imagery has generally provided results with a high level of accuracy, bathymetric validation specific to the Ningaloo Marine Park is needed to provide a level of confidence in using this bathymetric data set. The most relevant bathymetry suitable for validation was acquired with boat–based echo sounder measurement during the time of the hyperspectral survey. The image-derived bathymetry was co-located with the echo sounder data and compared with each other in the form of a scatter plot (see Fig. 3).
Hyperspectral Mapping of Bathymetry and Benthic Cover • 25 July 2011, Version 1.0 19
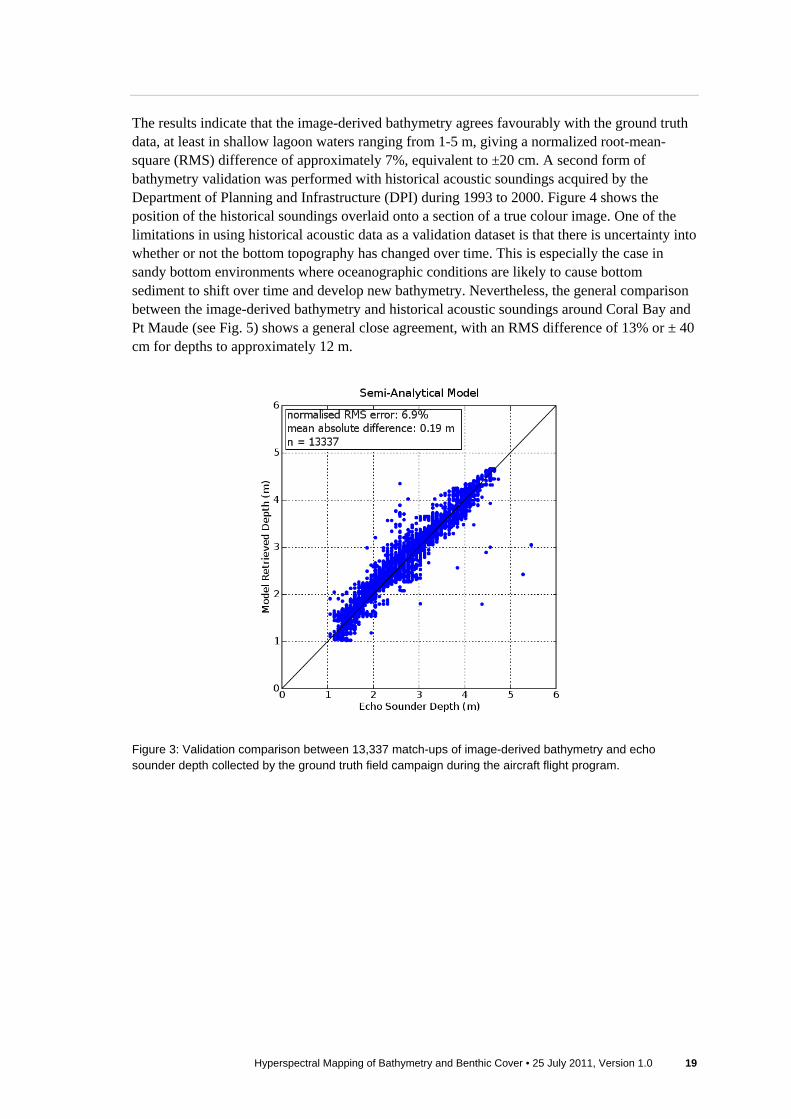
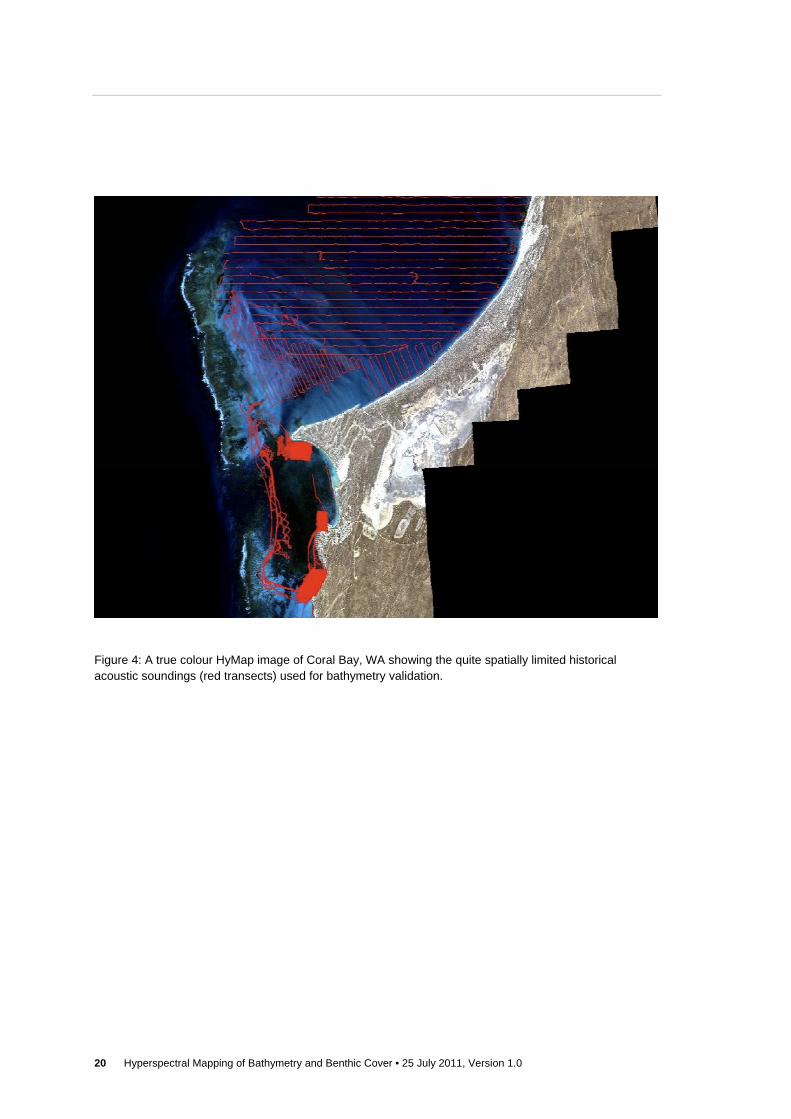
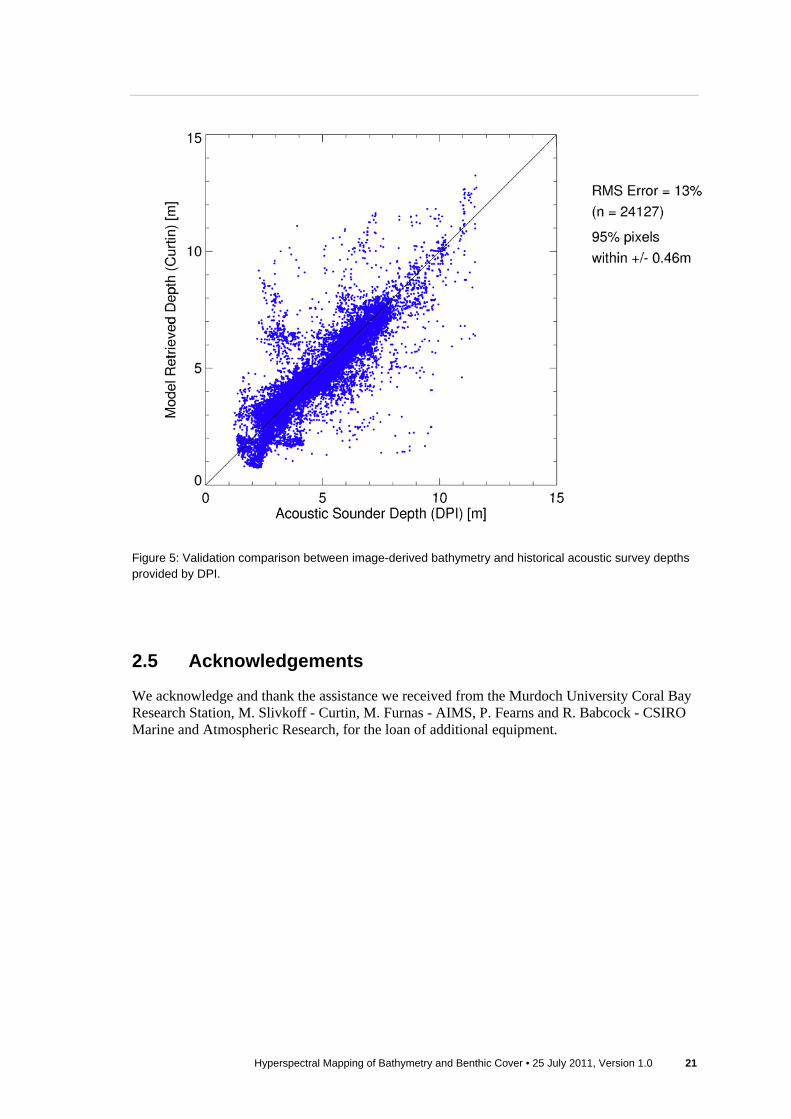
The results indicate that the image-derived bathymetry agrees favourably with the ground truth data, at least in shallow lagoon waters ranging from 1-5 m, giving a normalized root-mean-square (RMS) difference of approximately 7%, equivalent to ±20 cm. A second form of bathymetry validation was performed with historical acoustic soundings acquired by the Department of Planning and Infrastructure (DPI) during 1993 to 2000. Figure 4 shows the position of the historical soundings overlaid onto a section of a true colour image. One of the limitations in using historical acoustic data as a validation dataset is that there is uncertainty into whether or not the bottom topography has changed over time. This is especially the case in sandy bottom environments where oceanographic conditions are likely to cause bottom sediment to shift over time and develop new bathymetry. Nevertheless, the general comparison between the image-derived bathymetry and historical acoustic soundings around Coral Bay and Pt Maude (see Fig. 5) shows a general close agreement, with an RMS difference of 13% or ± 40 cm for depths to approximately 12 m.
Figure 3: Validation comparison between 13,337 match-ups of image-derived bathymetry and echo sounder depth collected by the ground truth field campaign during the aircraft flight program.
20 Hyperspectral Mapping of Bathymetry and Benthic Cover • 25 July 2011, Version 1.0
Figure 4: A true colour HyMap image of Coral Bay, WA showing the quite spatially limited historical acoustic soundings (red transects) used for bathymetry validation.
Hyperspectral Mapping of Bathymetry and Benthic Cover • 25 July 2011, Version 1.0 21
Figure 5: Validation comparison between image-derived bathymetry and historical acoustic survey depths provided by DPI.
2.5 Acknowledgements
We acknowledge and thank the assistance we received from the Murdoch University Coral Bay Research Station, M. Slivkoff - Curtin, M. Furnas - AIMS, P. Fearns and R. Babcock - CSIRO Marine and Atmospheric Research, for the loan of additional equipment.
REFERENCES
22 Hyperspectral Mapping of Bathymetry and Benthic Cover • 25 July 2011, Version 1.0
REFERENCES
HyVista Corporation, www.hyvista.com
iVEC, www.ivec.org
Klonowski, W. M., M. J. Lynch, B. T. McGann, P. R. C. S. Fearns, L. A. Clementson and A. Dekker (2003). "Hyperspectral Remote Sensing of Western Australian Coastal Waters." International Society for Optical Engineering 5515: 203-210.
Klonowski, W. M., P. R. C. S. Fearns and M. J. Lynch, (2007). "Retrieving Key Benthic Cover Types and Bathymetry from Hyperspectral Imagery" Journal of Applied Remote Sensing 011505: 1-21.
Lee, Z., K. L. Carder, C. D. Mobley, R. G. Steward and J. S. Patch (1998). "Hyperspectral remote sensing for shallow waters. I. A semianalytical model." Applied Optics 37(27): 6329.
Lee, Z., K. L. Carder and J. S. Patch (1999). "Hyperspectral remote sensing for shallow waters: 2. Deriving bottom depths and water properties by optimization." Applied Optics 38(18): 3831-3843.
Majewski, L. J. and W. M. Klonowski (2006). “Optical model closure and inversion for north east Australian waters.” Technical Report: DIAP2006001, Curtin University of Technology, Department of Imaging and Applied Physics.
Mumby, P. J., C. D. Clark, E. P. Green and A. J. Edwards (1998). "Benefits of water column correction and contextual editing for mapping coral reefs." International Journal of Remote Sensing 19: 203-210.
Pope, R. M. and E. S. Fry (1997). "Absorption spectrum ~380–700 nm of pure water. II. Integrating cavity measurements." Applied Optics 36(33): 8710-8723.
Slivkoff, M., M. Furnas and M. Lynch (2006). Continual transect ocean colour remote sensing validation in the Great Barrier Reef marine park. Ocean Optics XVIII, Montreal Canada.
Smith, R. C. and K. S. Baker (1981). "Optical properties of the clearest natural waters (200-800 nm)." Applied Optics 20(2): 177-184.
Stumpf, R. P. and K. Holderied (2004). "Determination of water depth with high-resolution satellite imagery over variable bottom types." Limnology and Oceanography 48(1, Part 2): 547-556.