18
NIR, Qemscan® and XRD gangue characterization in a world class porphyry copper deposit: a case study Karin Quintana and Catalina Martínez

NIR, Qemscan® and XRD gangue characterization in a world class porphyry copper deposit: a case studyKarin Quintana and Catalina Martínez

OVERVIEWAutomated mineralogy has a relevant role in modern
mining industry, providing accurate and relatively objective identification of mineral phases in short time.
Developed new techniques have different application and must be used according to the aim of the study. Technique’s features are critical to decide which
technique is suitable for approaching the mining process challenges.

OVERVIEWThe aim of this study is showing the behaviour of
phyllosilicates species (kaolinite, pyrophyllite-smectite, chlorite, biotite and muscovite-illite) in each sample,
according to the methodology used. This will provide information for visualizing similarities and differences of the presence and content of mineral phases
that can help building stronger NIR chemometric models using the fit for purpose technique depending on the mineral.

METHODOLOGY36 SAMPLES
NIR Qemscan® XRD
METHODOLOGY
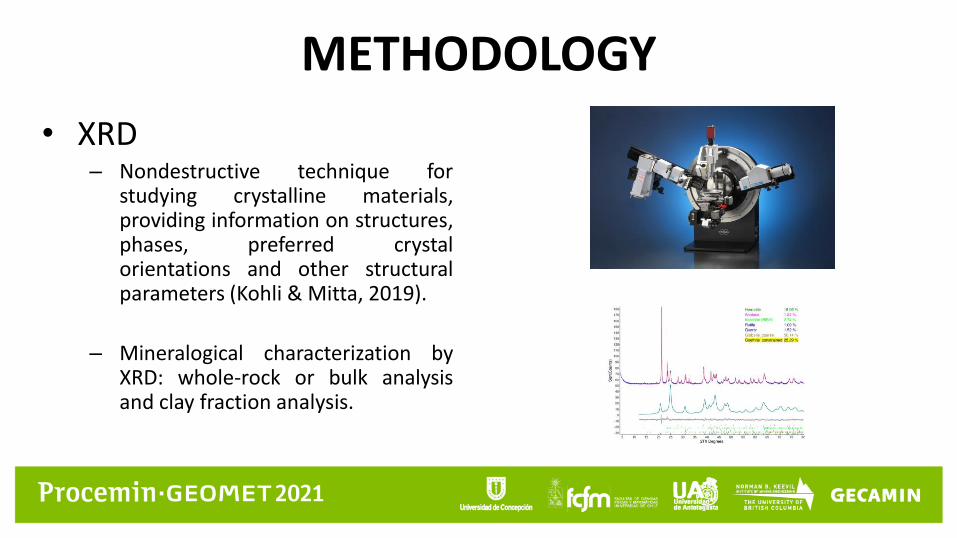
• XRD– Nondestructive technique for
studying crystalline materials,providing information on structures,phases, preferred crystalorientations and other structuralparameters (Kohli & Mitta, 2019).
– Mineralogical characterization byXRD: whole-rock or bulk analysisand clay fraction analysis.
METHODOLOGY
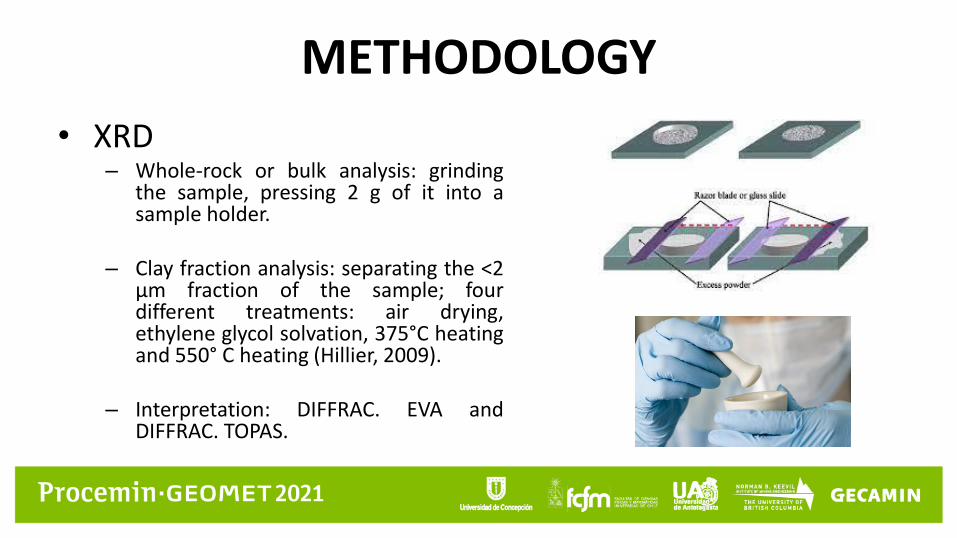
• XRD– Whole-rock or bulk analysis: grinding
the sample, pressing 2 g of it into asample holder.
– Clay fraction analysis: separating the <2µm fraction of the sample; fourdifferent treatments: air drying,ethylene glycol solvation, 375°C heatingand 550° C heating (Hillier, 2009).
– Interpretation: DIFFRAC. EVA andDIFFRAC. TOPAS.

METHODOLOGY• Qemscan®
– Automated micro-analysissystem that enablesquantitative chemical analysisof materials and generation ofhigh-resolution mineral maps.
– BMA analysis (Bulk MineralAnalysis)
– Data processing: iMeasure 5.3and iDiscover 5.3.

METHODOLOGY• Qemscan®
– Sample preparation: block with 2 g -#65Ty with resin and graphite. Theblock is polished and coated with a thin layer of graphite.

METHODOLOGY
• NIR– Interaction of electromagnetic radiation
with matter: spectra generated byinteratomic bonds of groups containing C,N and O bonded to H (Manley & Baeten,2018).
– In geological samples: CH and OH bondsare mainly related to clay minerals; NH,SH and CO to calcite; and SO, tosulphates.
– Analyzed samples: -10#Ty and -150#Ty.– Calibration models were developed using
GRAMS™
RESULTS
- Analysis were focused on gangue minerals: kaolinite,other clays (pyrophyllite and smectites), biotite, chlorite,muscovite-illite.
- Specific chemometric models were applied to NIRresults.

RESULTS: Kaolinite

RESULTS: Other clays

RESULTS: Biotite
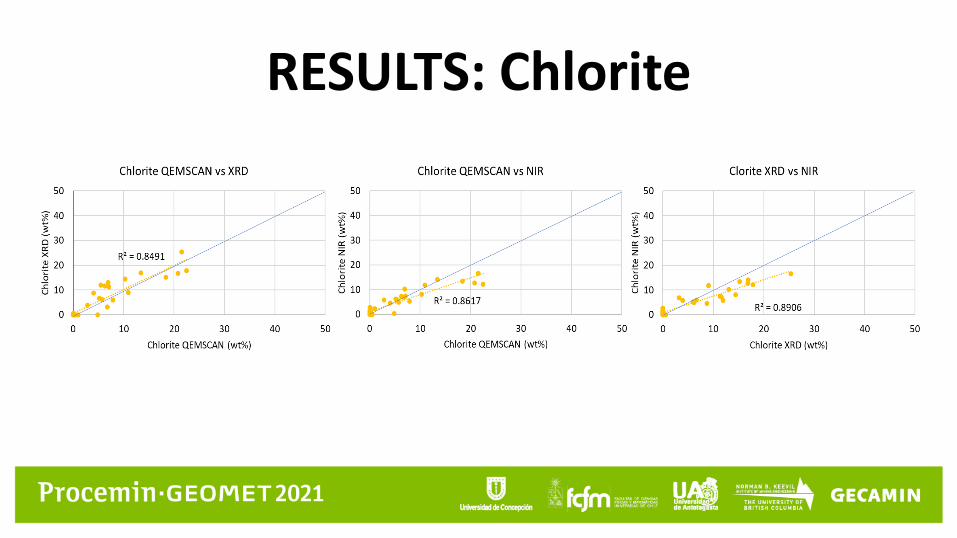
RESULTS: Chlorite

RESULTS: Muscovite-illite

Results: Average, Minimum, Maximum
CONCLUSIONS
• According to the scope of the study, conclusion focus on differences between analytical techniquesregarding mineral composition, mainly based on NIR concentrations.
• In general, NIR chemometric models show good results comparing to XRD and Qemscan® mineralogy: kaolinite, other clays and chlorite NIR values are highly correlated with XRD values, while biotite and muscovite-illite show a stronger correlation with Qemscan®. This fact suggests that minerals should be approached with different techniques depending on its nature.
• NIR chlorite and kaolinite concentrations can be underestimated when concentrations are >10 wt%, regarding XRD and Qemscan® results. This could be improved by incorporating more samples with high chlorite and kaolinite concentrations to the NIR chemometric models.

CONCLUSIONS
• In many cases, correlations for XRD can be affected because of mineral values <1 wt%, due to technique’s limit of detection (1 wt%) Qemscan® and NIR have a LOD of 0.1 wt%.
• It is recommended to include whole rock chemical analysis, for a better gangue characterization inQemscan®, specifically for refining biotite, chlorite and muscovite-illite results.
• It is highly suggested to include certified standards when generating chemometric models, as nomeasure of the true mineral composition exists; thus, evaluation of studied analytical tools would bemore accurate.


